
Investigation of Microwave Absorption Mechanisms in Microcellular Foamed Conductive Composites


ICTEAM Institute, Université Catholique de Louvain, Place du Levant 3, 1348 Louvain-la-Neuve, Belgium
Micro 2021, 1(1), 86-101; https://doi.org/10.3390/micro1010007
Submission received: 31 May 2021
/
Revised: 7 July 2021
/
Accepted: 18 July 2021
/
Published: 26 July 2021
(This article belongs to the Section Microscale Materials Science)
Abstract
:The paper investigates the mechanisms of microwave absorption in microcellular foamed conductive composites dedicated to protection against electromagnetic interferences (EMI). A multi-layered electromagnetic one-dimensional (1D) model mimicking the microcellular foam structure is built and validated using previous measurements carried out on various fabricated composite foams. Our model enables us to perform a parametric analysis of the absorption behaviour in a foamed composite, using as parameters the size of the hollow cell, the thickness of the cell’s walls and its conductivity, as well as the overall thickness of the composite and the frequency. Our investigations demonstrate that multiple reflections of the microwave signal between the cellular walls are not the main mechanism responsible for absorption, although they are often reported as a cause of enhanced absorption in the literature. On the contrary, our work demonstrates that the enhancement of the absorption observed in foamed conductive composite compared to unfoamed composite is mainly due to the presence of air in the microcells of the composite.
1. Introduction
Protection against electromagnetic interferences (EMI) has been a pervasive challenge for almost two decades. EMI indeed can damage the operation of daily used devices containing electronic components that are sensitive to electromagnetic (EM) radiation. Sectors of activity are numerous: military and civilian aerospace, automotive, medical, wireless communications and IoT devices, to name a few. EMI is also a potential concern for security and health [1], since EM radiation could have a detrimental effect on living cells.
For these reasons, research has concentrated since the 2000s on the design and fabrication of efficient solutions against EMI, known as EMI shielding. Among these, composite materials combining polymer and conductive charges have gained much interest, since they offer the advantages of light weight, excellent thermal and electrical properties, as well as ease of fabrication for mass production. In particular, as discussed in [2], the dispersion of conductive nano-inclusions such as carbon nanotubes in polymer material can tailor the absorption and reflection of EMI induced in the resulting nanocomposites. The best solution to prevent EMI is to maximize the absorption and minimize the reflection, so that all parasitic signals are trapped in the vicinity of the composite material. An important subclass of composites for EMI shielding is foamed composites. Indeed, the presence of air in the cell of the foam helps to reduce the reflection of the signal incoming to the composite and contributes also to reduce its weight. Moreover, some authors [3,4,5,6,7,8,9,10] claim that the microwave absorption in foamed composites is enhanced compared to that in solid composite, due to multiple reflections/scatterings of the microwave signal on the walls of the foam’s cell. However, no experimental nor theoretical development in the literature confirms this statement, to the best of our knowledge.
In this paper, we propose an electromagnetic one-dimensional (1D) model aimed at predicting the absorption of microwave power in microcellular foamed composites. This is given in Section 3.1, while Section 3.2 validates the model through a comparison of predictions with measured values of absorption achieved by nanocomposites from the literature. Section 3.3 investigates, using the model, what the main causes of absorption in microcellular conductive composites are, while Section 3.4 proposes a parametric study of microwave absorption as a function of geometrical and electrical parameters of the foam. This study enables the optimization of these parameters in order to help the synthesis of composite foams dedicated to microwave absorption, as discussed in Section 3.5 and Section 3.6.
2. Materials and Methods
2.1. Synthesis of Conductive Foams
The foamed composite materials that serve as reference for the validation of the proposed model were fabricated using a supercritical CO2 process. For the sake of completeness, it is briefly recalled here. Supercritical CO2 was applied to carbon nanotubes (CNT)-based polymer nanocomposites to ensure their foaming. Two mixing techniques were used for the fabrication of the nanocomposites, i.e., melt blending and co-precipitation. The high ability of these polymeric foams to absorb electromagnetic radiation was demonstrated at low CNT content, as a result of the high affinity of the polymer matrix for CNTs, and therefore with good CNTs dispersion, in the frequency range 8–40 GHz. Shielding efficiency as high as 60 to 80 dB together with low reflectivity was observed at a very low volume concentration of CNTs (0.25 vol%). Three different polymer matrices were considered as examples in this work, i.e., polycarbonate (PC) as described in [11], polycaprolactone (PCL) as described in [12], and polypropylene (PP) as described in [13].
2.2. Electromagnetic Modelling Technique
The technique used to develop the model presented in Section 3.1 for conductive foams is explained with details in references [14,15]. In brief, the foam medium is approximated by a periodical structure, alternating hollow thick sections filled with air, and thin composite sections corresponding to the wall of the foam that are constituted of PC, PP or PCL loaded with conductive charges. The charges considered in [11,12,13] are carbon nanotubes, but as our model considers only the conductivity of the nano-charges, it is general and applicable to any kind of conductive charges that are present in the walls of the pores forming the foam. A simple method based on chain matrix conversion simulates the scattering parameters (S-parameters) and absorption index if the physical parameters of each layer are known. S-parameters are relevant quantities widely used in microwave measurement and analysis. They link, in matrix formalism, the incoming, transmitted and reflected waves and are helpful to gain precise understanding of the electromagnetic behavior of a multilayered structure, such as that shown in Figure 1. The technique proposed in [14,15] and applied in [16,17] enables us to calculate the transmission of microwave power through a cascade of air and wall sections, by taking the matrix product of their corresponding chain matrices that are formulated as a function of their respective thickness, of the electromagnetic parameters for the conductive polymer forming the wall of the foam and of the frequency of operation of the composite material used as a microwave absorber. As the technique also provides the amount of power reflected by the composite multilayer, the absorbed power can be obtained. The model was implemented in this paper using Matlab simulation software Release 2020a.
3. Results and Discussion
3.1. Electromagnetic Model of the Foam
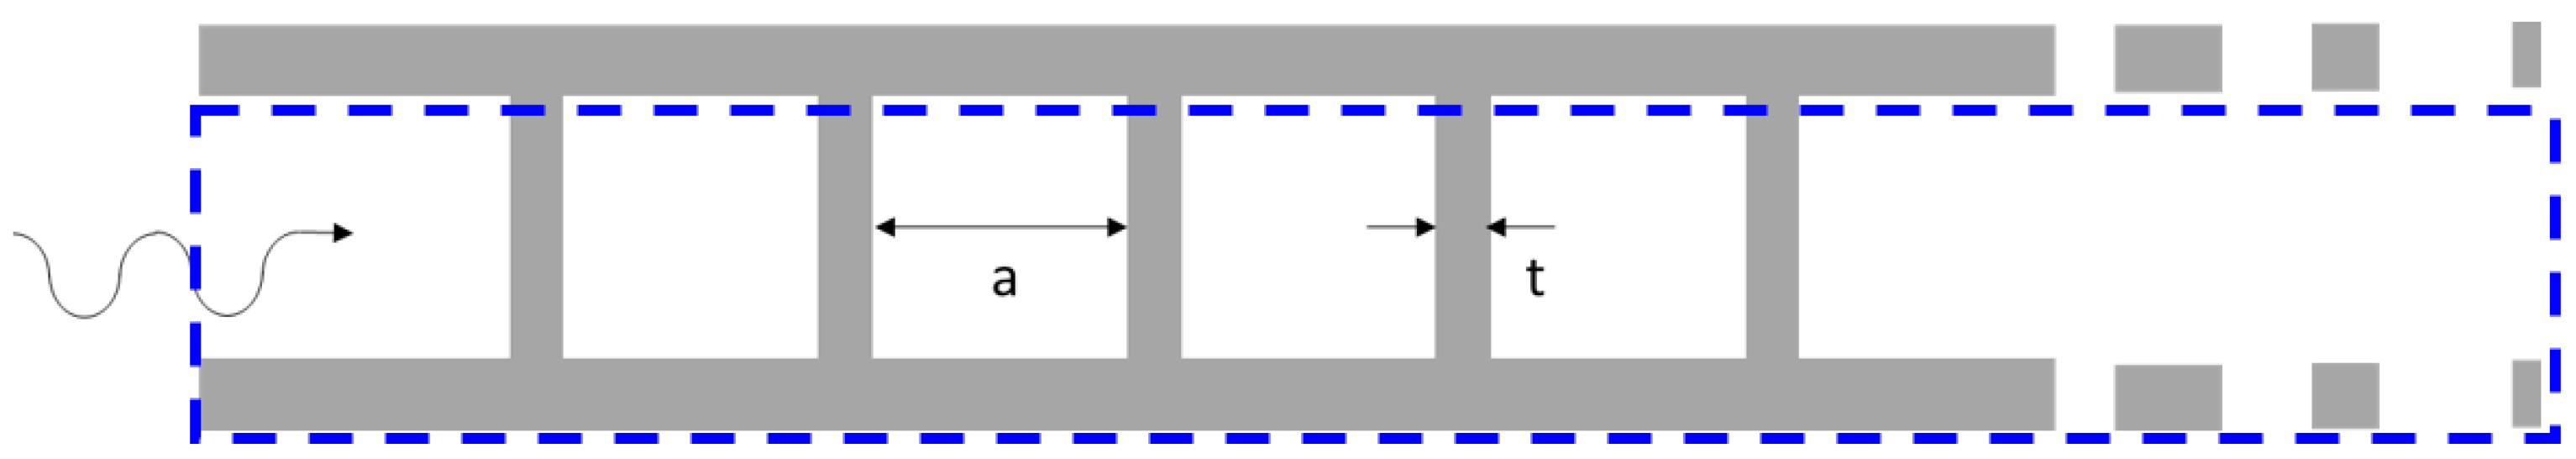
The 1-dimensional schematic representation of the foam geometry is shown in Figure 1. Although foamed composites usually have circular pores of given average diameter d, an equivalent squared section of area a2 can be defined as done in Equation (1) for taking into account the same amount of air in the simulation:
It is also important to note that foamed composite in [11,12,13] has a random distribution of pore diameter and density. Simulations made in this section assume averaged values for diameters d, as were measured in [11,12,13].
The polymer forming the foam, represented in grey scale in Figure 1, is considered, having a dielectric constant εr and a conductivity σ, while air filling each cell has a dielectric constant equal to 1 and a zero conductivity. According to the formalism explained in Section 2.2 and detailed in [14,15] the propagation through the structure of Figure 1 can be modelled using the product of chain matrices of sections of air, having thickness a, and of polymer, having thickness t, representing the cascade of air and conductive polymer forming the foamed conductive composite. Each section has as characteristic electromagnetic parameters the propagation constant γ and wave impedance Z, that allow us to form the chain matrix for air and polymer sections.
For polymer sections we have:
For air sections, we take into account the presence of the top branch made of conductive polymer situated above each air cell and joining two vertical walls, as shown in Figure 1. For this, we consider that the air section has the permittivity of air, while its conductivity shows a proportional effect since the branch is present over a height t compared to height a of an air cell; otherwise said as σair = σ t/a. Equations (2)–(4) are rewritten for air sections as:
The global chain matrix corresponding to the structure of Figure 1 is given by:
where N is an integer such that N (t + a) + a = D, where D is defined as the total thickness of the foamed composite. In Expressions (2)–(7), ω = 2 π f, with f the frequency in Hz. The S-parameters of the composite, denoted S11 and S22, are obtained from the global matrix using conversion formulas available in [18,19]. For sake of completeness, these formulas are provided in Appendix A. Parameter S11 is associated with the fraction of power reflected at the input interface of the composite, denoted R:
The fraction of power transmitted from input to output of the composite, denoted T, is associated with S21:
Writing the power balance law yields the fraction of power absorbed in the composite, denoted A:
Finally, the EMI shielding value, noted EMI and expressed in dB, is obtained from the S21 parameter as:
Note that reflection parameter R can also be expressed in dB, similarly to (12).
The walls having thickness t represented in Figure 1 correspond to the actual walls of the pores forming the foam. As explained in Section 2.1, the foamed composite results from the foaming process of a particular polymer loaded with conductive charges, forming a composite polymer. This means that the walls of the foam are made of the conductive polymer composite. The model takes into account the conductive polymer composite by considering that sections having thickness t have as electromagnetic parameters the dielectric constant εr et and the conductivity σ of the composite, as calculated via Equations (2) and (3). These parameters interact with the microwave signal and influence its absorption. The approach is microscopic (i.e., at the scale of the wall and pore dimension) and not nanoscopic, in the sense that multiple reflections of the signal between nano-charges (carbon nanotubes in the present case) are not reproduced by the model; instead, the electromagnetic parameters of the composite εr and σ take into account at the microscale the interaction of the signal with polymer and nano-charges. These parameters are thus considered homogenised at the microscale.
Next, the alternated presence of two different media, air and polymer composites, is expressed via the product of the chain matrices associated with each medium, provided by Expressions (4) and (7), respectively. These expressions include the respective characteristic impedance Zair and Zp of the two media; as their value is clearly different, reflections of the signal occur at each interface, air/composite or composite/air, that are perfectly accounted for thanks to the chain matrix product (8).
3.2. Experimental Validation of the Model
We compared our model with experiments on foams reported in the literature. Three kinds of samples are considered in this work, corresponding to foamed samples characterised in references [11,12,13]. Table 1 shows the main characteristics of each sample and nominal microwave measurements available in references [11,12] or [13]. Symbol ‘–’ indicates that the measurement of the value is not provided in the reference on top of the corresponding column. In bold face are indicated values predicted by our model. A very good agreement is observed, whatever the cell size and frequency range. Therefore, our model can be used to investigate finely the origin of microwave absorption in foamed composites. This will be done in Section 3.3.
3.3. Absorption Mechanism in Foamed Composite
3.3.1. Interaction with Walls
It is often said in the literature [3,4,5,6,7,8,9,10] that absorption in foamed composites is favoured by multiple reflections of the microwave signal between walls, so that the signal is trapped in each cell, which maximises the interactions with conductive walls wherein the signal is dissipated then absorbed. If this is true, the behaviour of the signal in each cell is close to that of a resonator. This resonant behaviour should be correlated with the size d of the cell, i.e., the frequencies where resonance occurs are linked to the cell size as:
In other words, resonance should occur according to (13) when the cell size d is a multiple of half a wavelength. For the sample studied in reference [13], having cell size d = 46.3 mm, the calculated three first resonance frequencies are 3.261, 6.622 and 9.783 THz, well above the GHz frequency range of foamed absorbers commonly used. A similar conclusion can be drawn for the two other samples reported in Table 1.
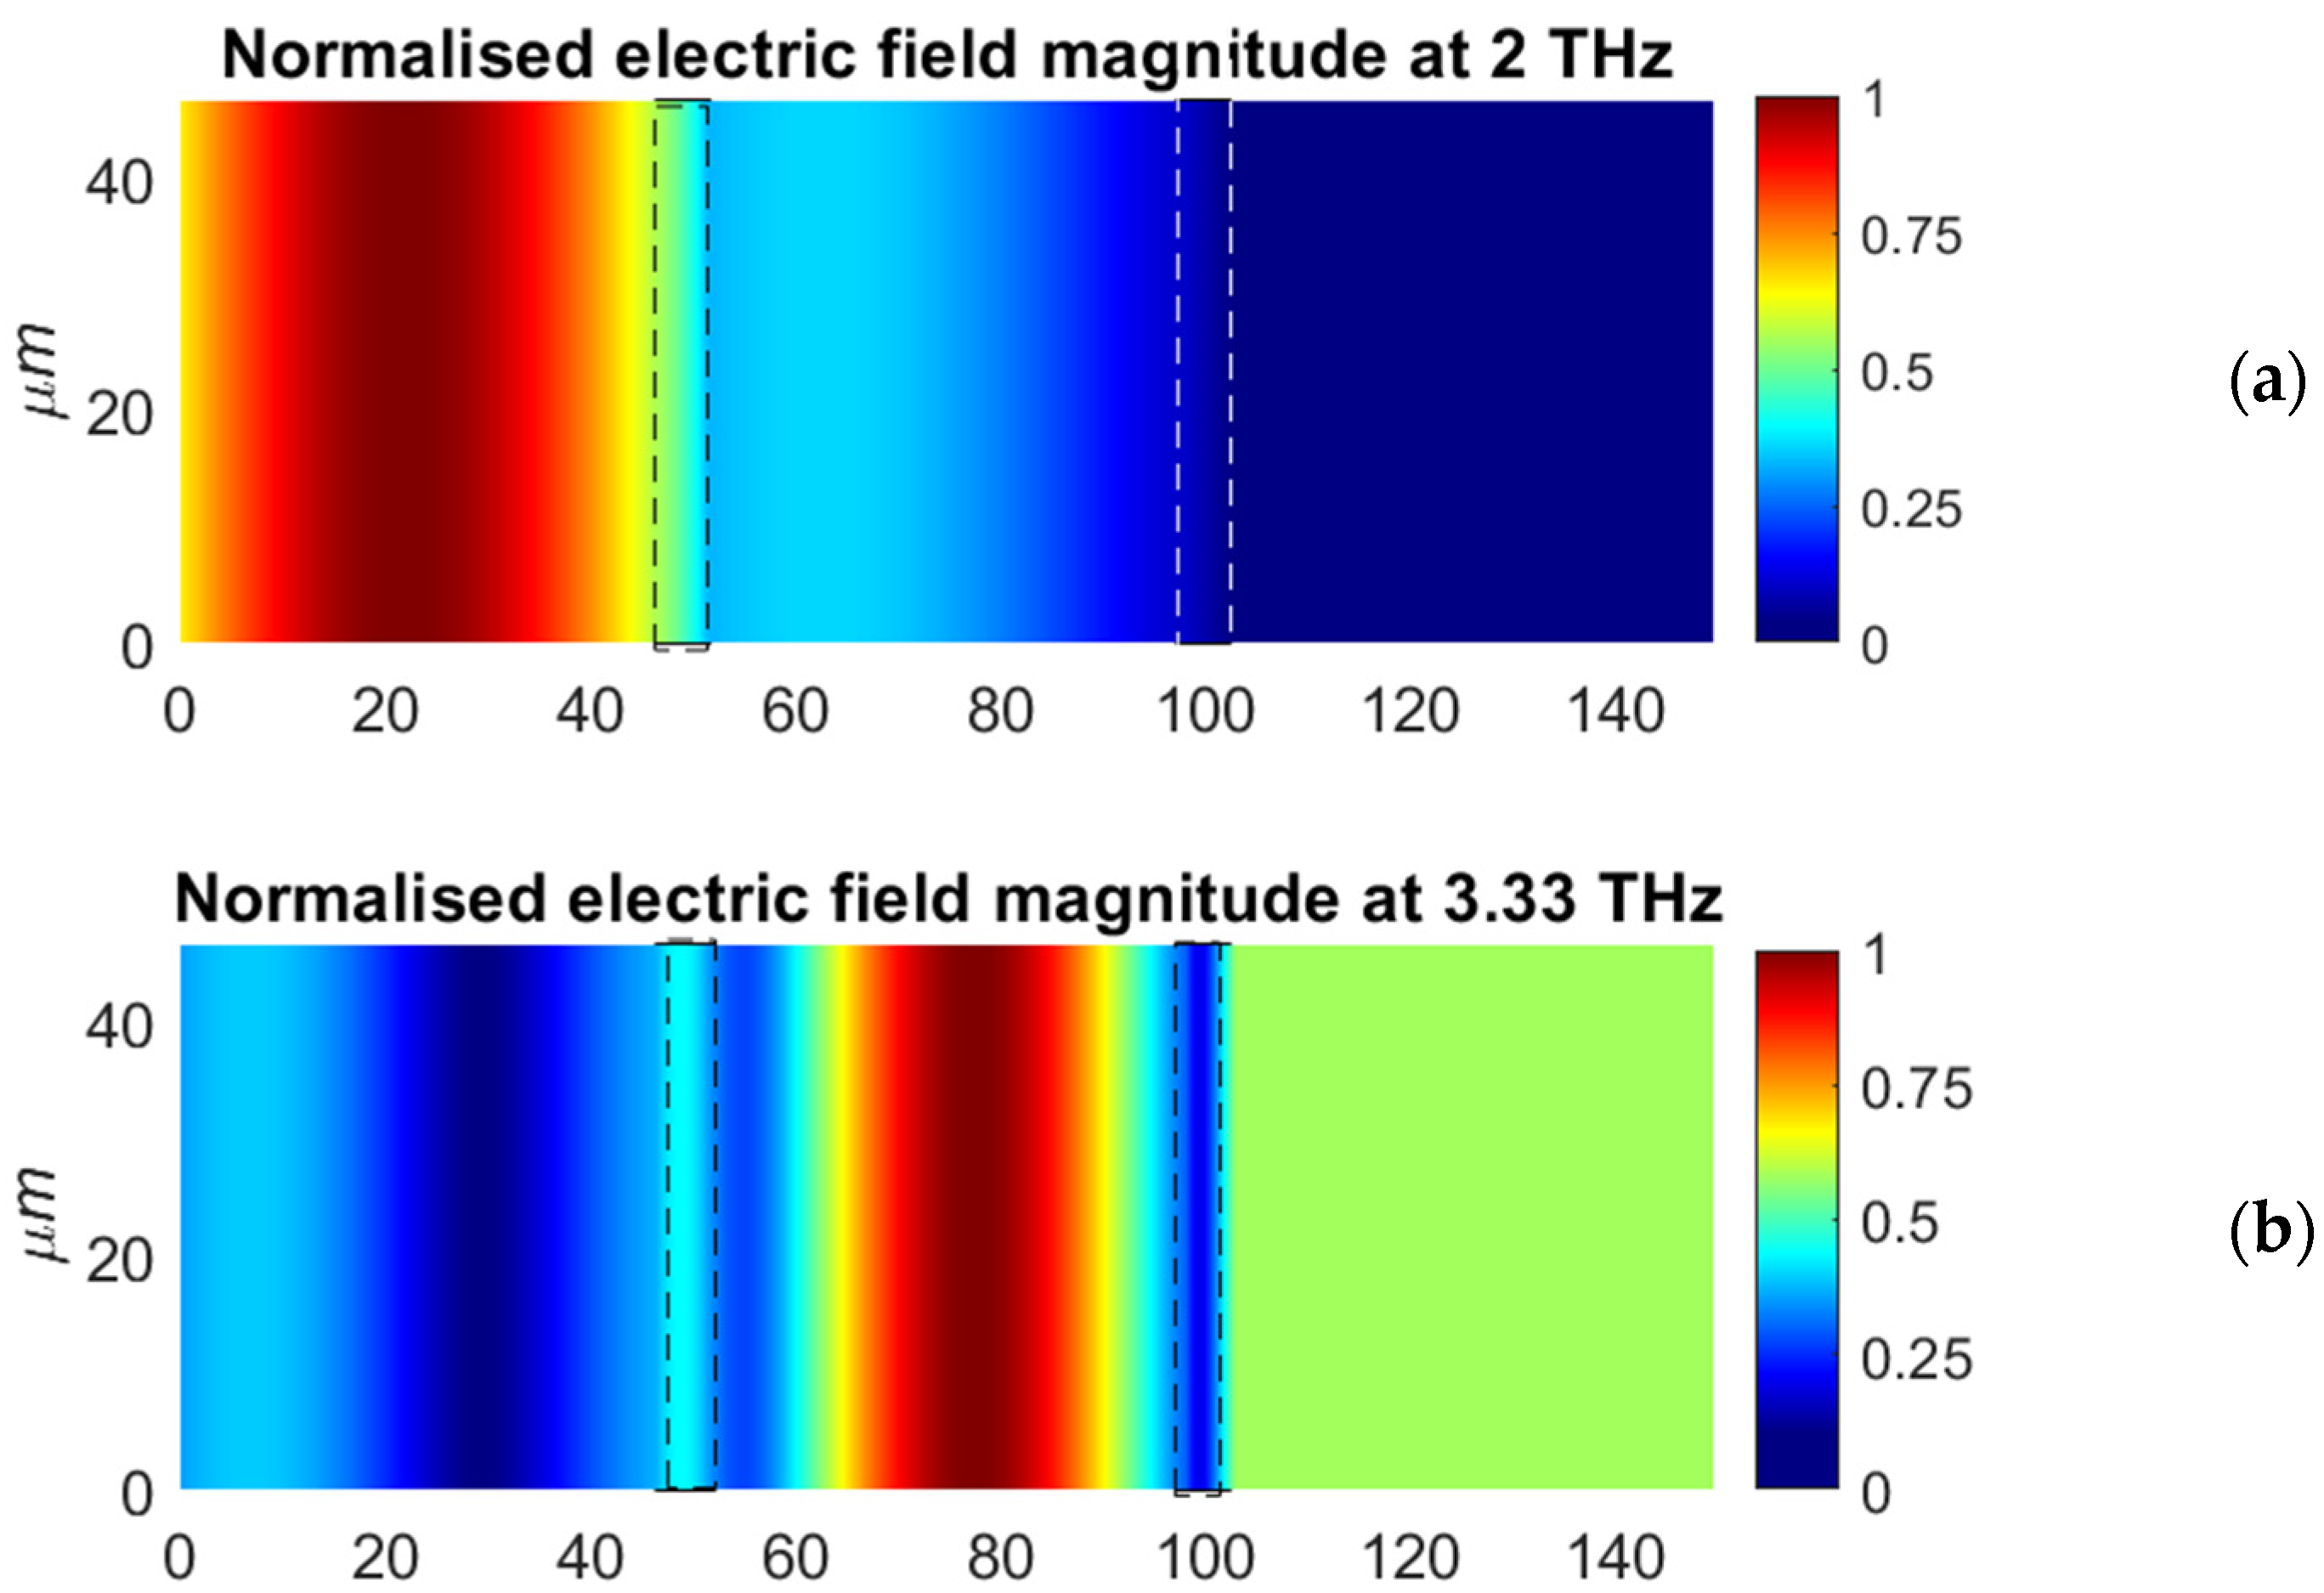
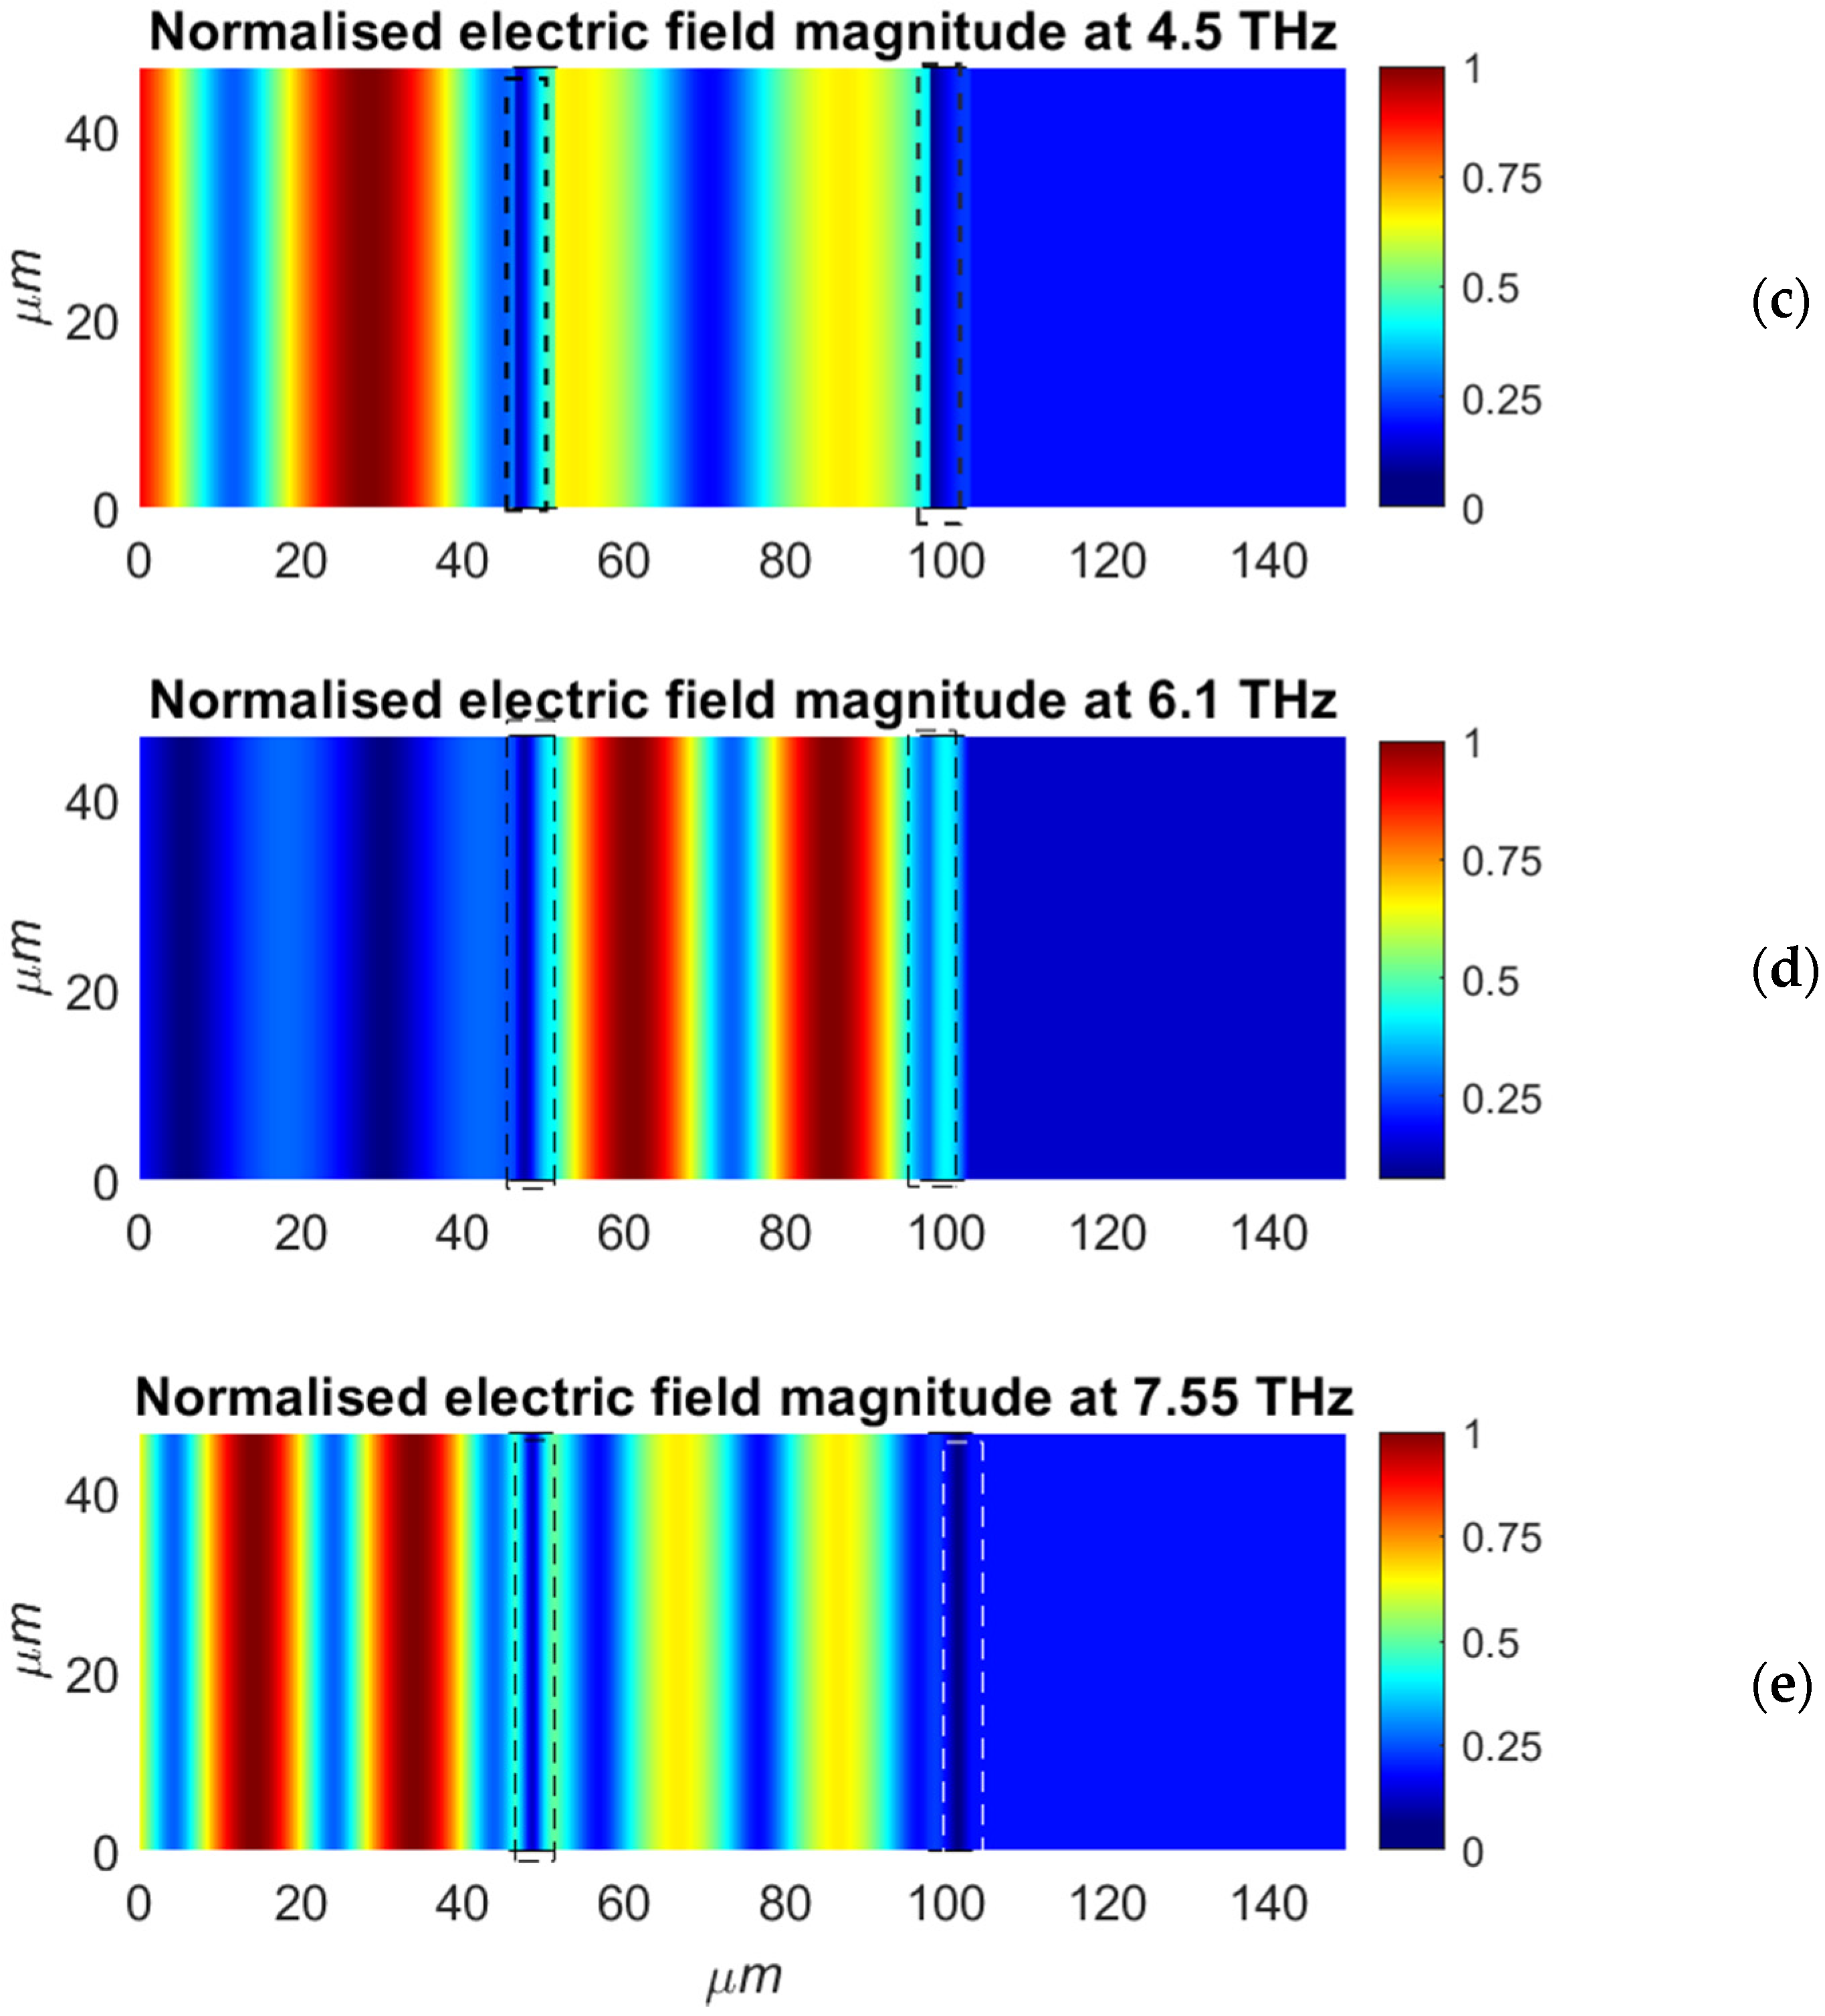
This prediction is fairly well verified using our model. Figure 2 shows the behaviour versus frequency of factors R, T and A defined by Expressions (9)–(11), calculated over three cells. It is observed that reflection factor R vanishes and absorption A undergoes a local maximum around 3 and 6 GHz roughly. The physical interpretation is that at those frequencies the signal is trapped between the two walls of the cell and is attenuated to ohmic dissipation inside the conductive walls and subsequent conversion into heat. These assumptions are confirmed when looking at the electric field pattern simulated for various frequencies in Figure 3, normalised with respect to the maximal value of field over considered penetration depth. A clear resonance (maximum of electric field intensity) is observed at frequencies where reflection factor R is minimum (3.33 and 6.1 THz). As these frequencies are located in the THz range and not in the microwave range, we can conclude that the reflection of the signal between walls of the cell plays almost no role in the absorption of microwave signals occurring in foamed conductive composites. At frequencies where reflection R has a local maximum (4.5 and 7.55 THz), no absolute maximum is observed in the field intensity inside the central cell. Indeed, at those frequencies the field intensity is higher in the left input cell than in the central cell. The same phenomenon is observed at 2 GHz, where the electric field concentrates at input cell, and does not propagate inside the foam, due to the high reflection observed around 2 THz in Figure 2.
3.3.2. Influence of Air
In this section, we intend to show that in foamed conductive composite it is the presence of air which induces an enhancement of the absorption, compared with absorption in a solid composite having the same volumetric content as the foamed one.
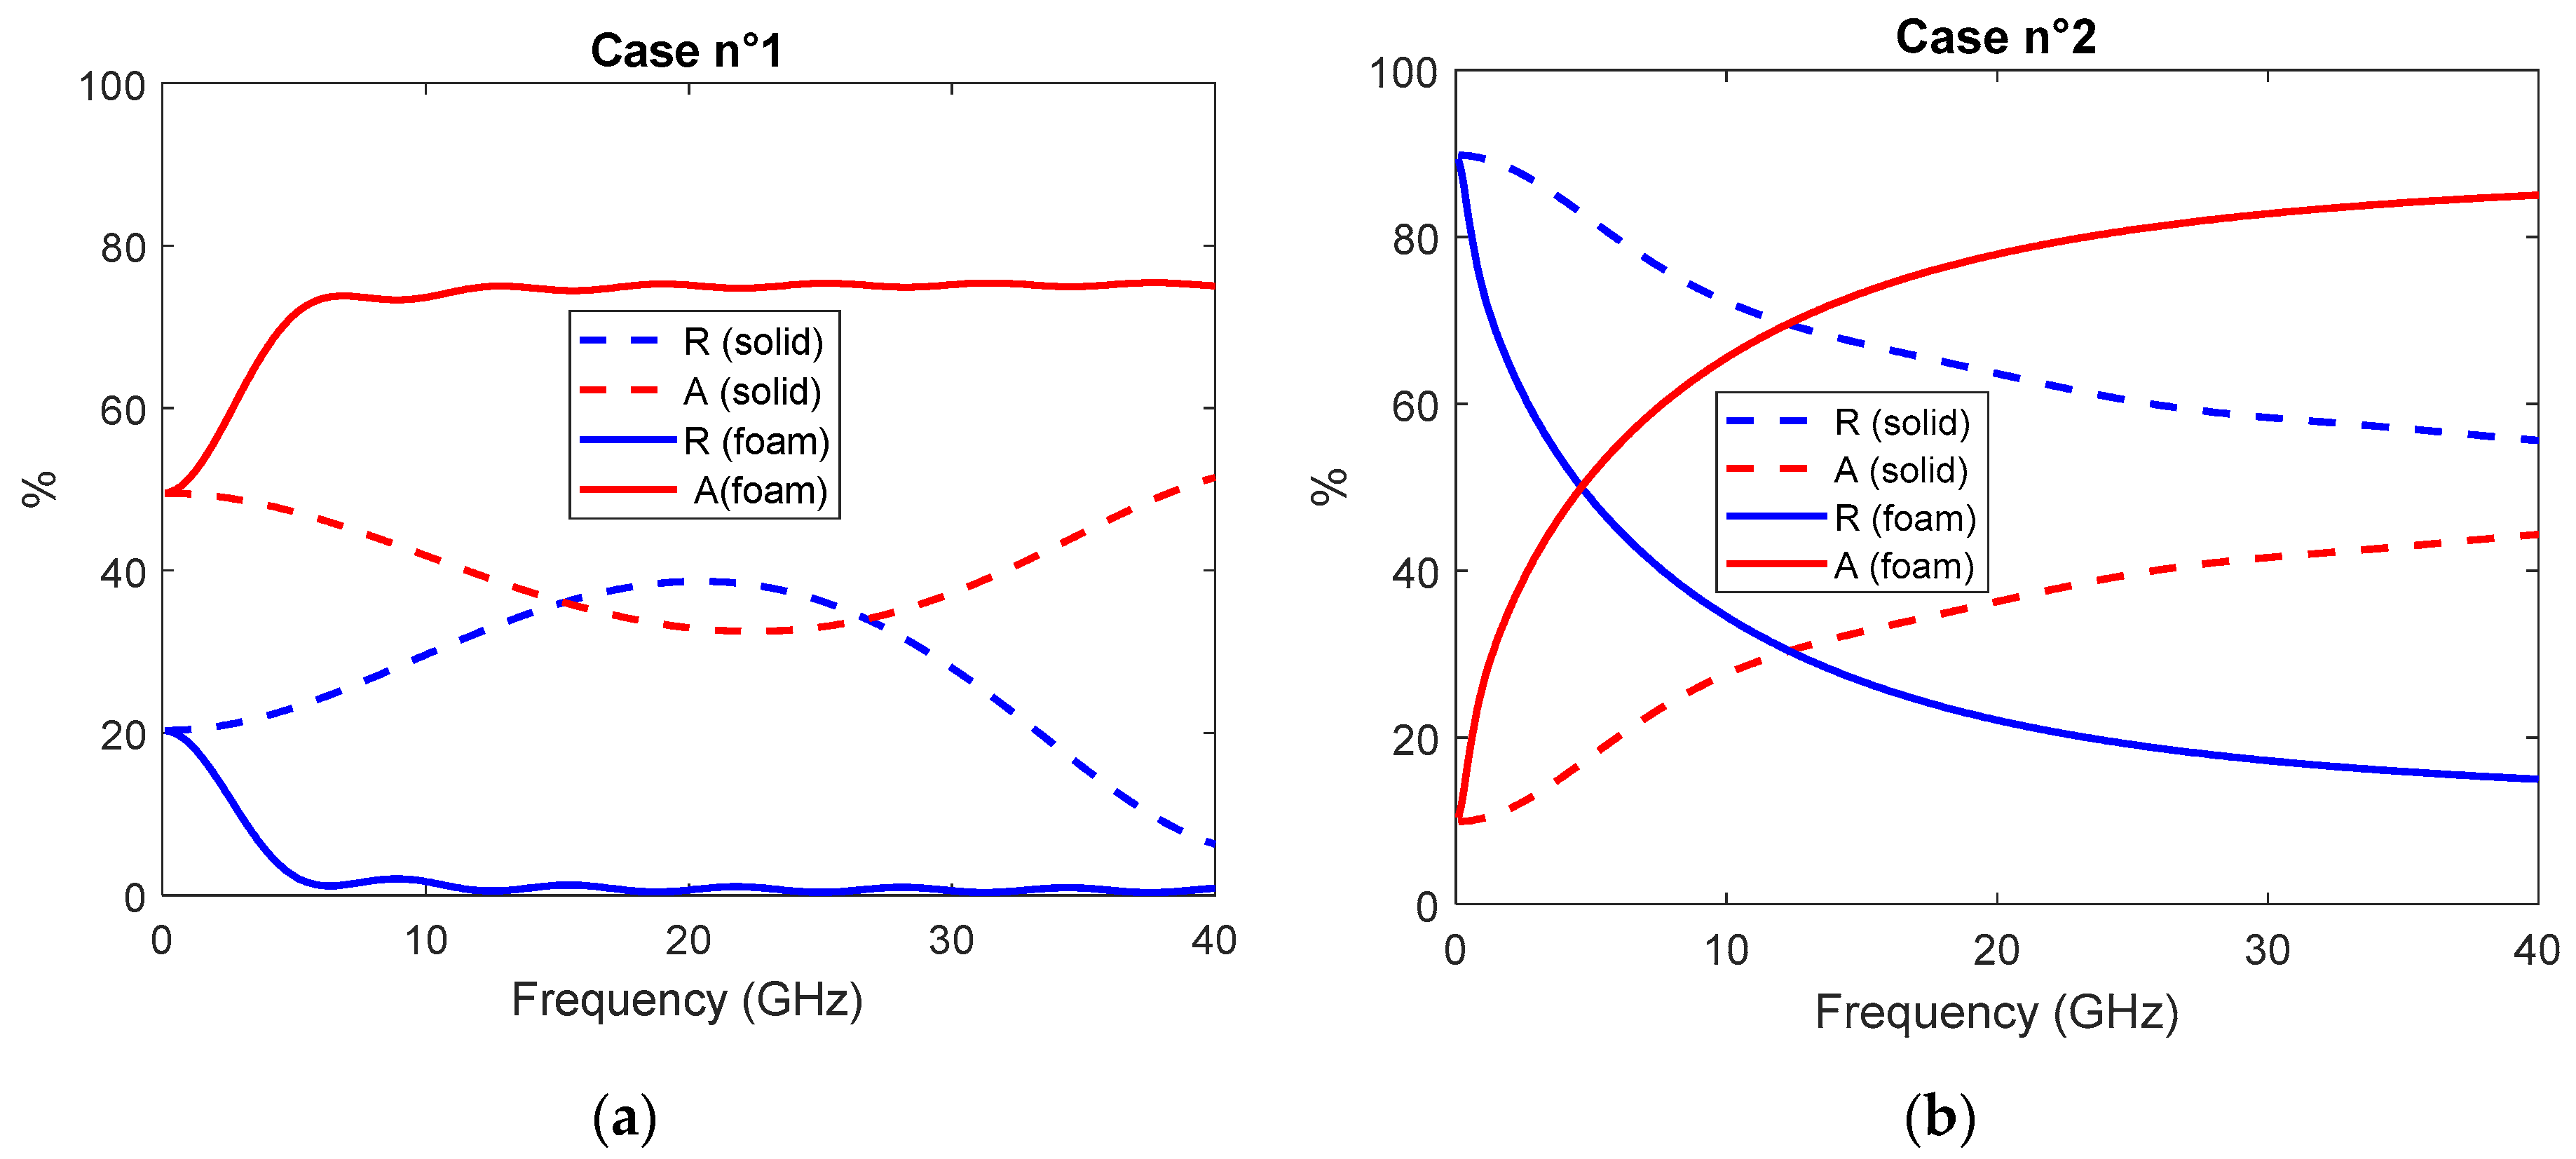
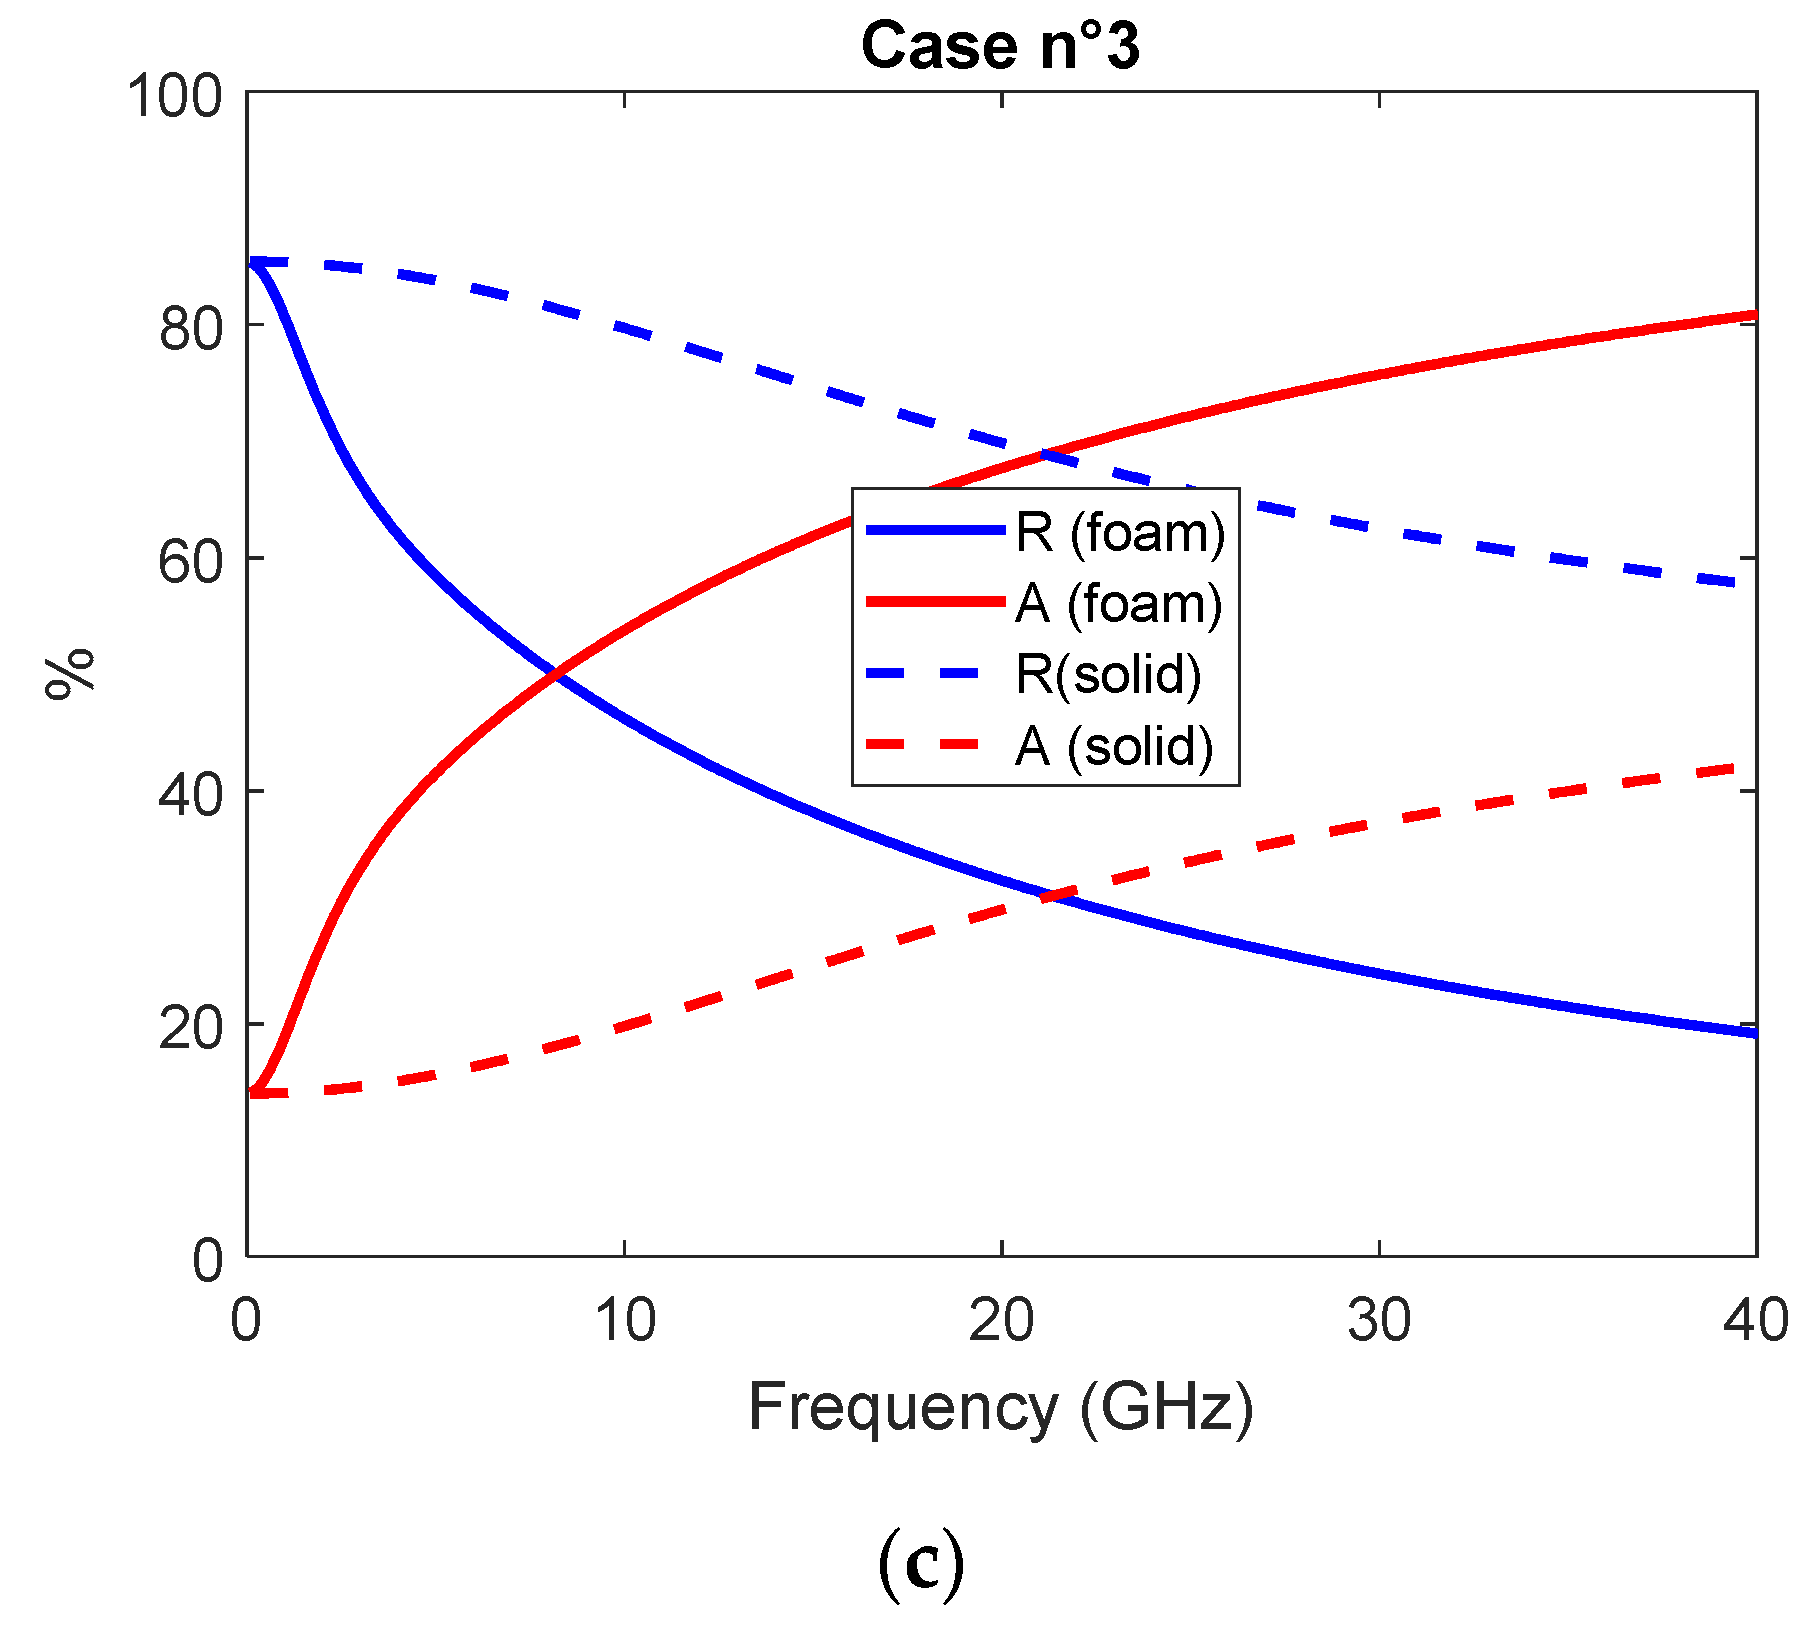
Figure 4 indeed compares, for the three cases presented in Table 1, the absorption predicted by our model, for foamed configuration and unfoamed (or solid) configuration. The simulation of the solid configuration assumes that the size d of the foam cell is equal to zero, meaning that the foamed and unfoamed configurations have exactly the same volumetric content in conductive loads and also the same amount of conductive charges. The first observation from Figure 4 is that absorption A in foamed samples is significantly higher than in unfoamed composites. Secondly, the increase in absorption from unfoamed to foamed samples is correlated with a decrease in reflection factor R. This logically means that reflection at the input of the composite prevents and thus reduces the transmission of the signal through the composite, hence its absorption. The reflection of signal is dependent on the mismatch of the composite medium with respect to the surrounding air. It can be quantified via the contrast in dielectric constant between air and polymer composite. In brief, the contrast in dielectric constant induces a mismatch in characteristic impedance Z defined in (3) and (6): the higher the ratio Zp/Zair, the higher the reflection factor at input of the composite, denoted Γ and defined in Equation (14):
where Zp and Zair are defined in Equations (3) and (6). When Zp strongly differs from Zair, i.e., becoming either much higher or much lower, Γ tends towards its maximal value equal to unity. Conversely, when Zp and Zair are close to each other, the reflection coefficient Γ is close to zero, meaning that there is a matching between the two media, air and polymer.
In order to understand why the presence of air decreases the reflection, we recall that the reflection at input of the foamed composite depends on the material forming the composite. When the composite is foamed, its permittivity is lowered since it is a mix of that of air and that of polymer, thus lower than the latter and closer to that of air. As a consequence, Zp becomes closer to Zair and Γ is decreased. As Γ is lowered, the penetration of the signal is facilitated, hence the absorption increases by virtue of Equation (11).
Table 2 summarises the values of the dielectric constant of foamed and unfoamed solid composites. The contrast is highest for case n°2, showing also the highest difference between absorption of foamed and solid sample, as illustrated in Figure 4b. By comparing the values marked in bold face in Table 1 and results in Figure 4, we conclude that the model reproduces experimental results well. Indeed, for case n°1 absorption reaches 75% for both simulation in Figure 4a and Table 1. For case n°2, Figure 4b, the simulated reflection reaches 0.18%, which corresponds to 10 log10(0.15) = −8.44 dB. This value is very close to that reported as measured in Table 1. Finally, for case n°3, Figure 4c, reflection is around 20%, i.e., −6.99 dB, very close to the measured −7 dB reported in Table 1, while absorption is around 70–80% for both measurements and simulation.
As a conclusion of this section, the presence of air clearly reduces reflection and increases absorption in foamed conductive composites.
3.4. Parametric Study
In this section, we perform a parametric study of the behaviour of the absorption A and reflection R. The varying parameters are: the thickness t of the wall, the size d of the air cell, the frequency f and the total length D of the foamed composite. The nominal values of the varying parameters are taken from case n°1 reported in Table 1. For the sake of brevity, results for case n°2 and 3 are not presented here. We expect that conclusions for cases n°2 and 3 are very similar to those drawn in the present section for case n°1.
Nominal values considered are:
f = 20 GHz
d = 15 μm
t = 5 μm
εr = 6
σ = 2 S/m
D = 20 mm
3.4.1. Influence of Thickness of Wall and Size of Cell
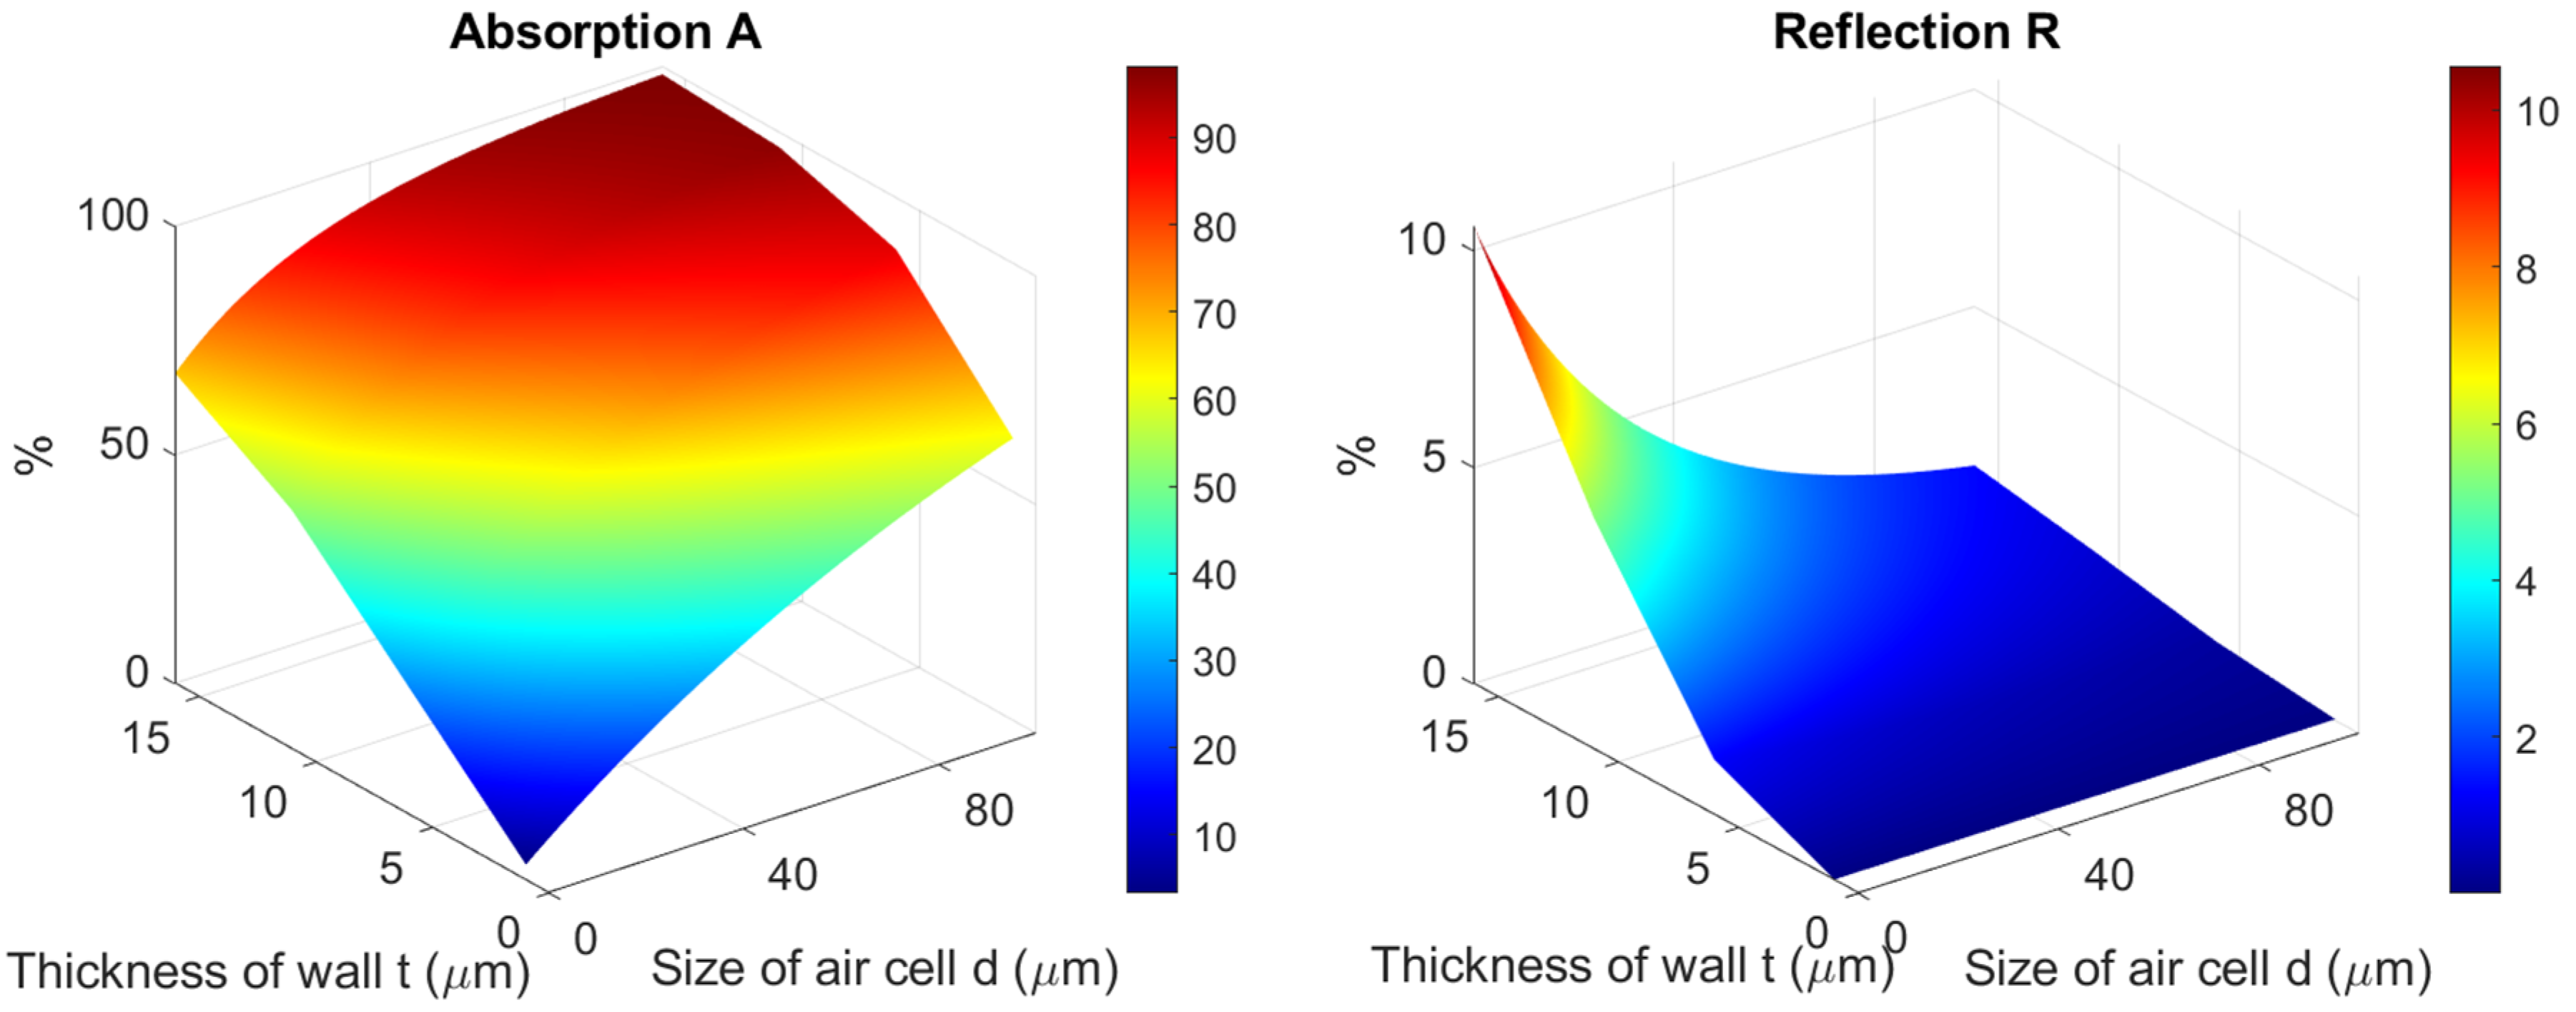
Figure 5 shows the evolution of absorption factor A and reflection factor R as a function of the thickness t of the cell’s wall and of the size d of the cell filled with air. The reflection R strongly decreases when the size of the cell increases. Indeed, increasing the size of the cell increases the fraction of air in the composite, and thus decreases the dielectric constant εr of the composite formed by the mix of air and polymer. As a consequence, the reflection factor Γ defined in Section 3.3.2 decreases with the content in air, which favours the penetration of the signal, hence its absorption in the composite due to the presence of conductive charges, modelled by the conductivity σ. Finally, for low values of cell size d, the reflection slightly increases with wall thickness t. Indeed, the higher t, the higher the content of material having a dielectric constant higher than one, responsible for reflection. Additionally, as announced, the reduction in R favours the increase in A.
3.4.2. Influence of Electromagnetic Parameters of Polymer
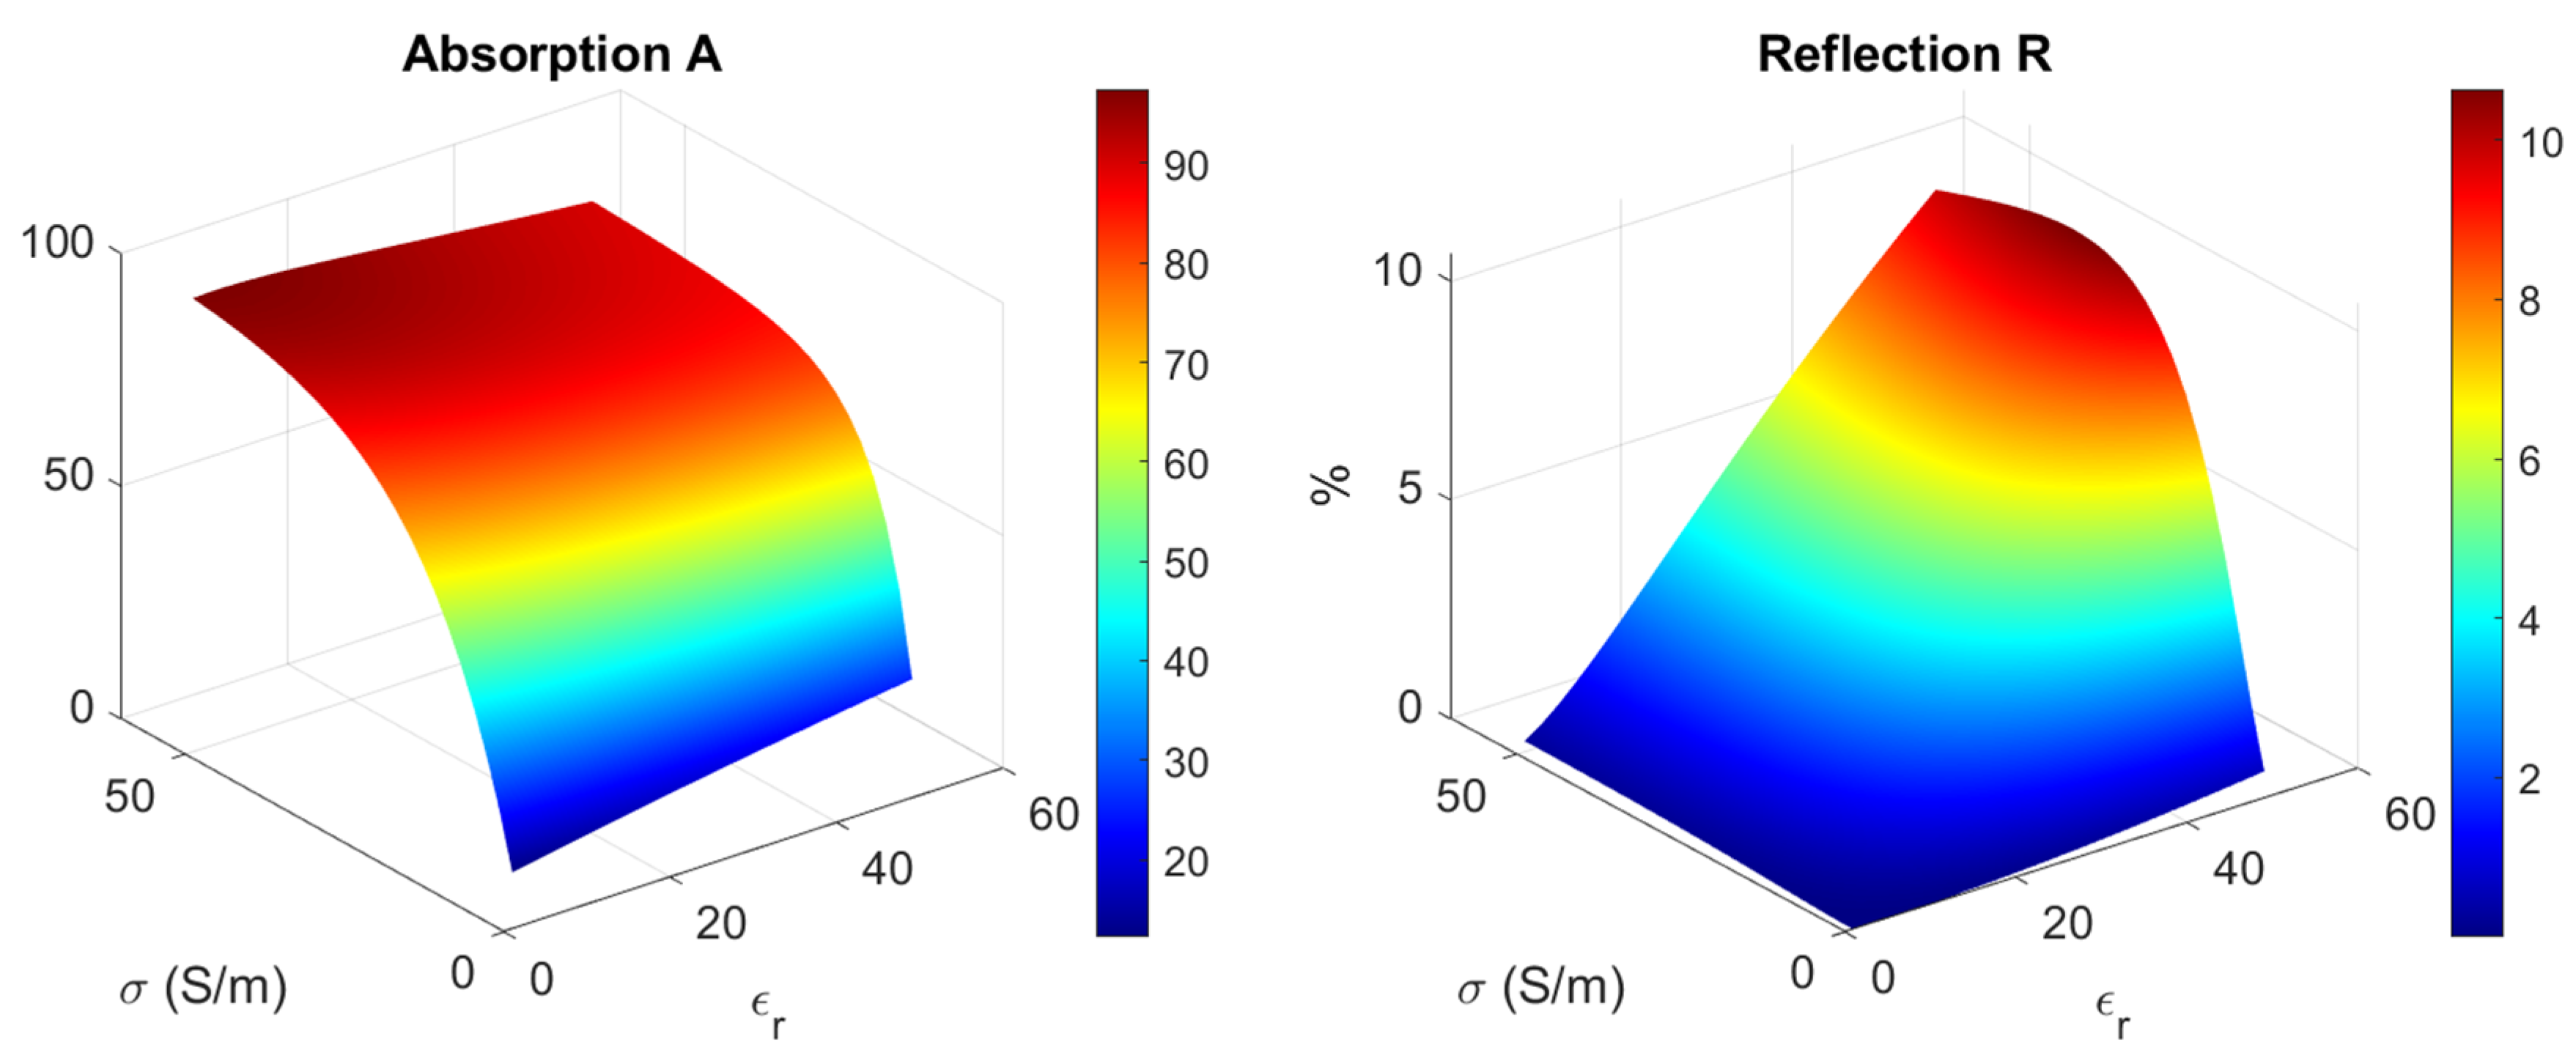
Figure 6 shows the evolution of absorption factor A and reflection factor R as a function of the dielectric constant εr and conductivity σ of the polymer composite forming the walls of the cellular pore. As expected, the absorption increases with the conductivity, since conductive charges present in the composite attenuate the signal through ohmic dissipation, while the dielectric constant has almost no influence. On the other hand, the reflection strongly increases with both dielectric constant and conductivity. This behaviour is related to the expression of the reflection coefficient Γ at input interface of the composite foam, already discussed in Section 3.3.2 and given by Expression (14). For highly conductive media, the conductivity must be taken into account in Expression (14) of Γ, rewritten as Expression (15):
As a matter of fact, reflection R is directly linked to Γ and increases (with as upper limit 1 or 100%) when εr and/or σ increases, which is well verified in Figure 6 (right).
3.4.3. Influence of Frequency and Size of Cell
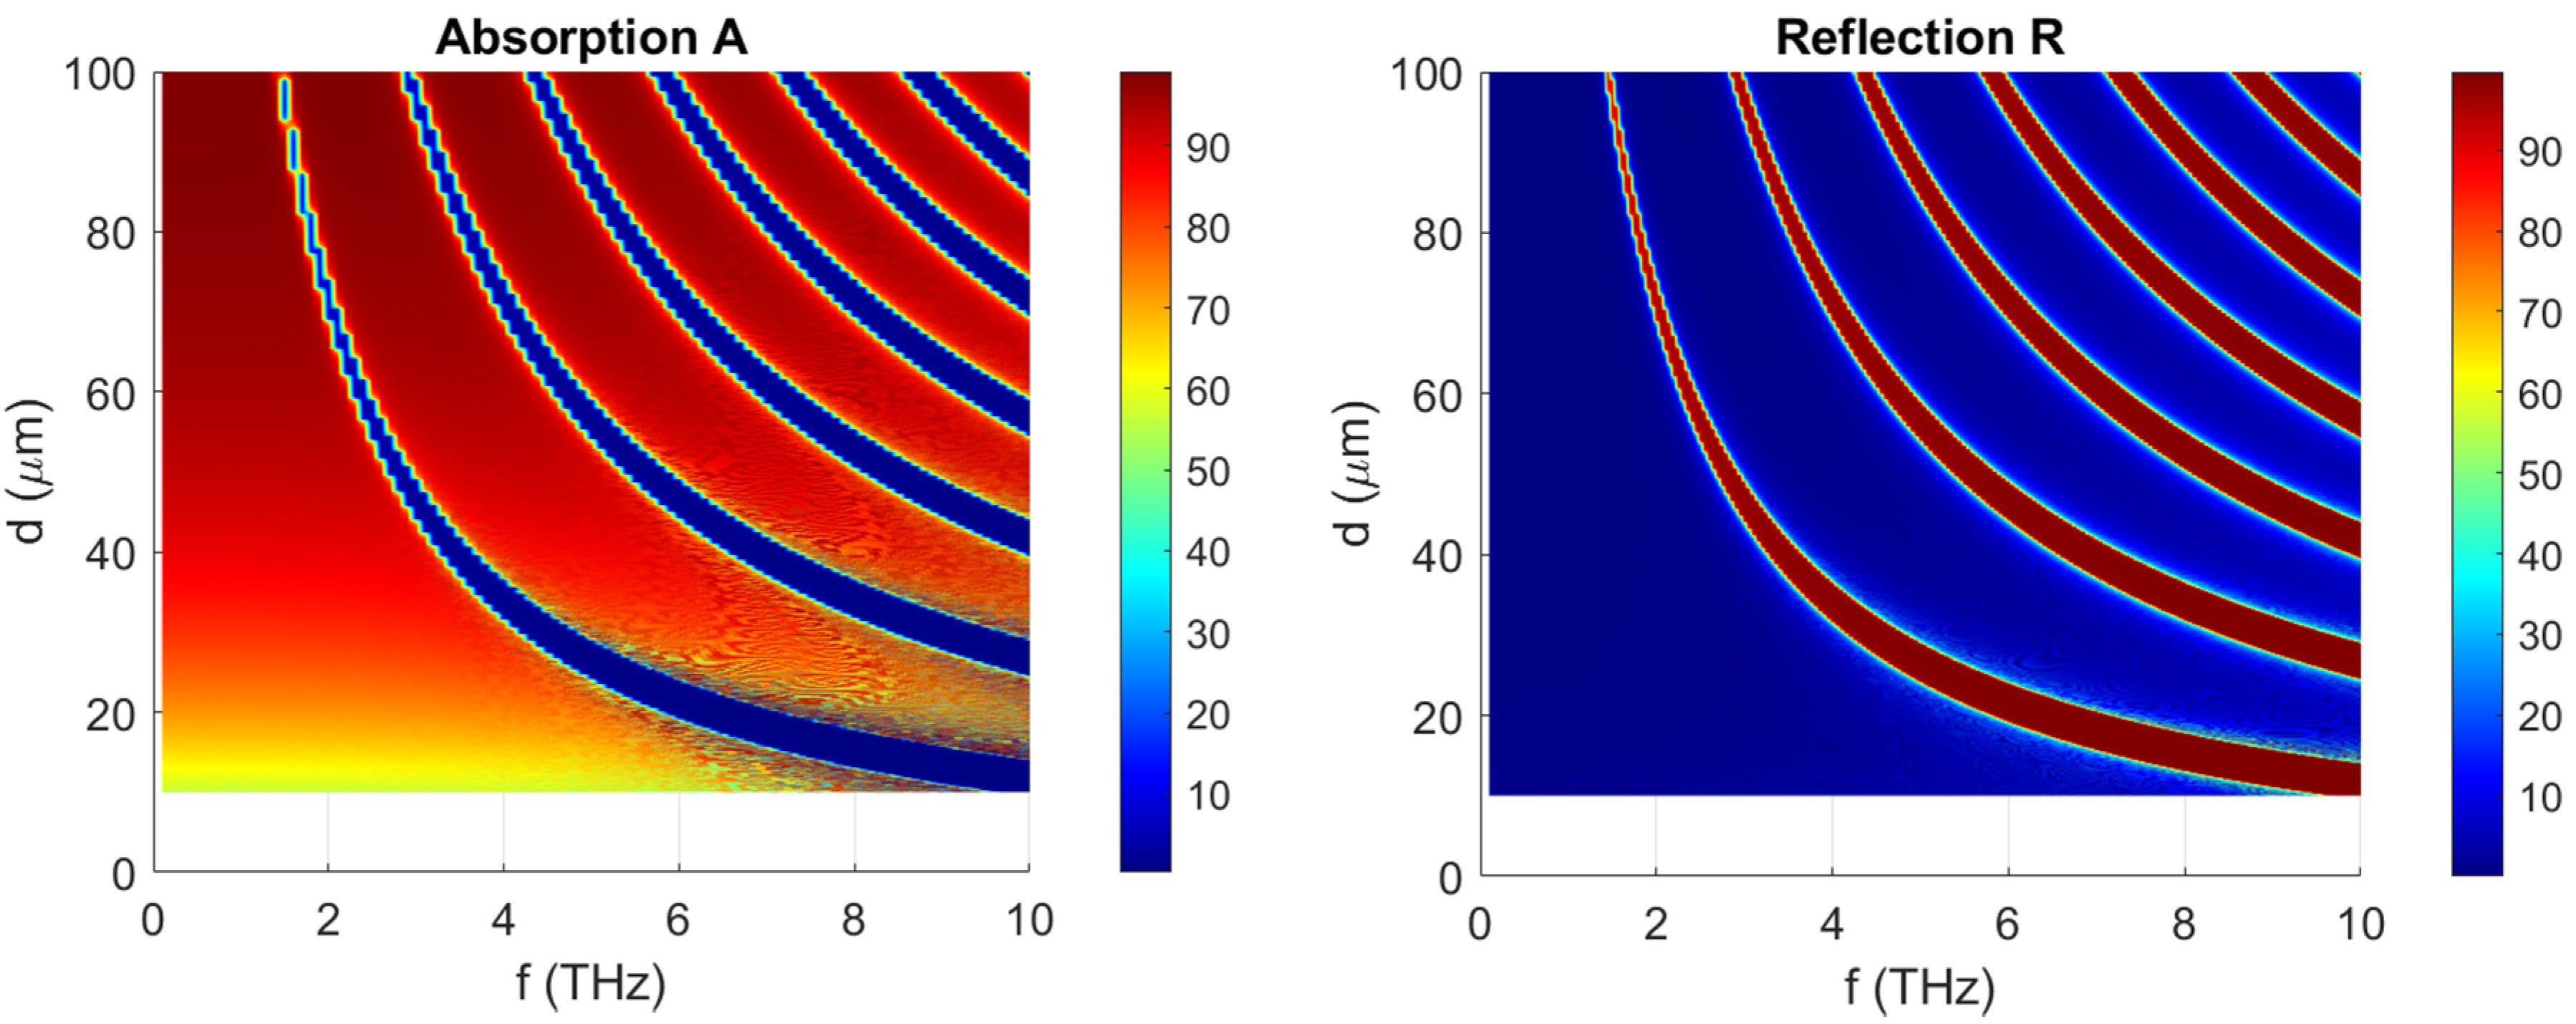
Figure 7 shows an in-plane view of the dependence of A and R in the THz frequency range, with as an additional parameter the size d of the air cell. As explained already in Section 3.3.1 and Equation (13), the interaction between the walls of the foam and the signal occurs when the size d is a multiple of the wavelength; the condition (13) can be rewritten as Equation (16):
This means that frequency as a function of d follows a 1/x curve clearly visible in the (f, d) plane shown in Figure 7. Minimal reflection occurs when maximum absorption is reached. In Figure 7, valleys of minima and summits of maxima are clearly visible, since deep blue areas in R plots corresponds to hot red areas in A plots. The absorption curve in Figure 7 also reveals that the absorption level strongly increases from 10% to almost 100% each time Equation (16) is satisfied, that is when absorption follows a summit along a 1/x path in the (f, d) plane.
On the other hand, Figure 8 shows the behaviour of A and R versus d in the microwave frequency range, i.e., from 1 to 40 GHz. The variation is monotonous with respect to d and f, and shows no local minimum nor maximum. This confirms the assertion that multiple reflections are not enhancing absorption in the microwave frequency range, since no resonant interactions with walls occur in this range, as verified in Figure 8.
3.4.4. Influence of Global Thickness of Composite
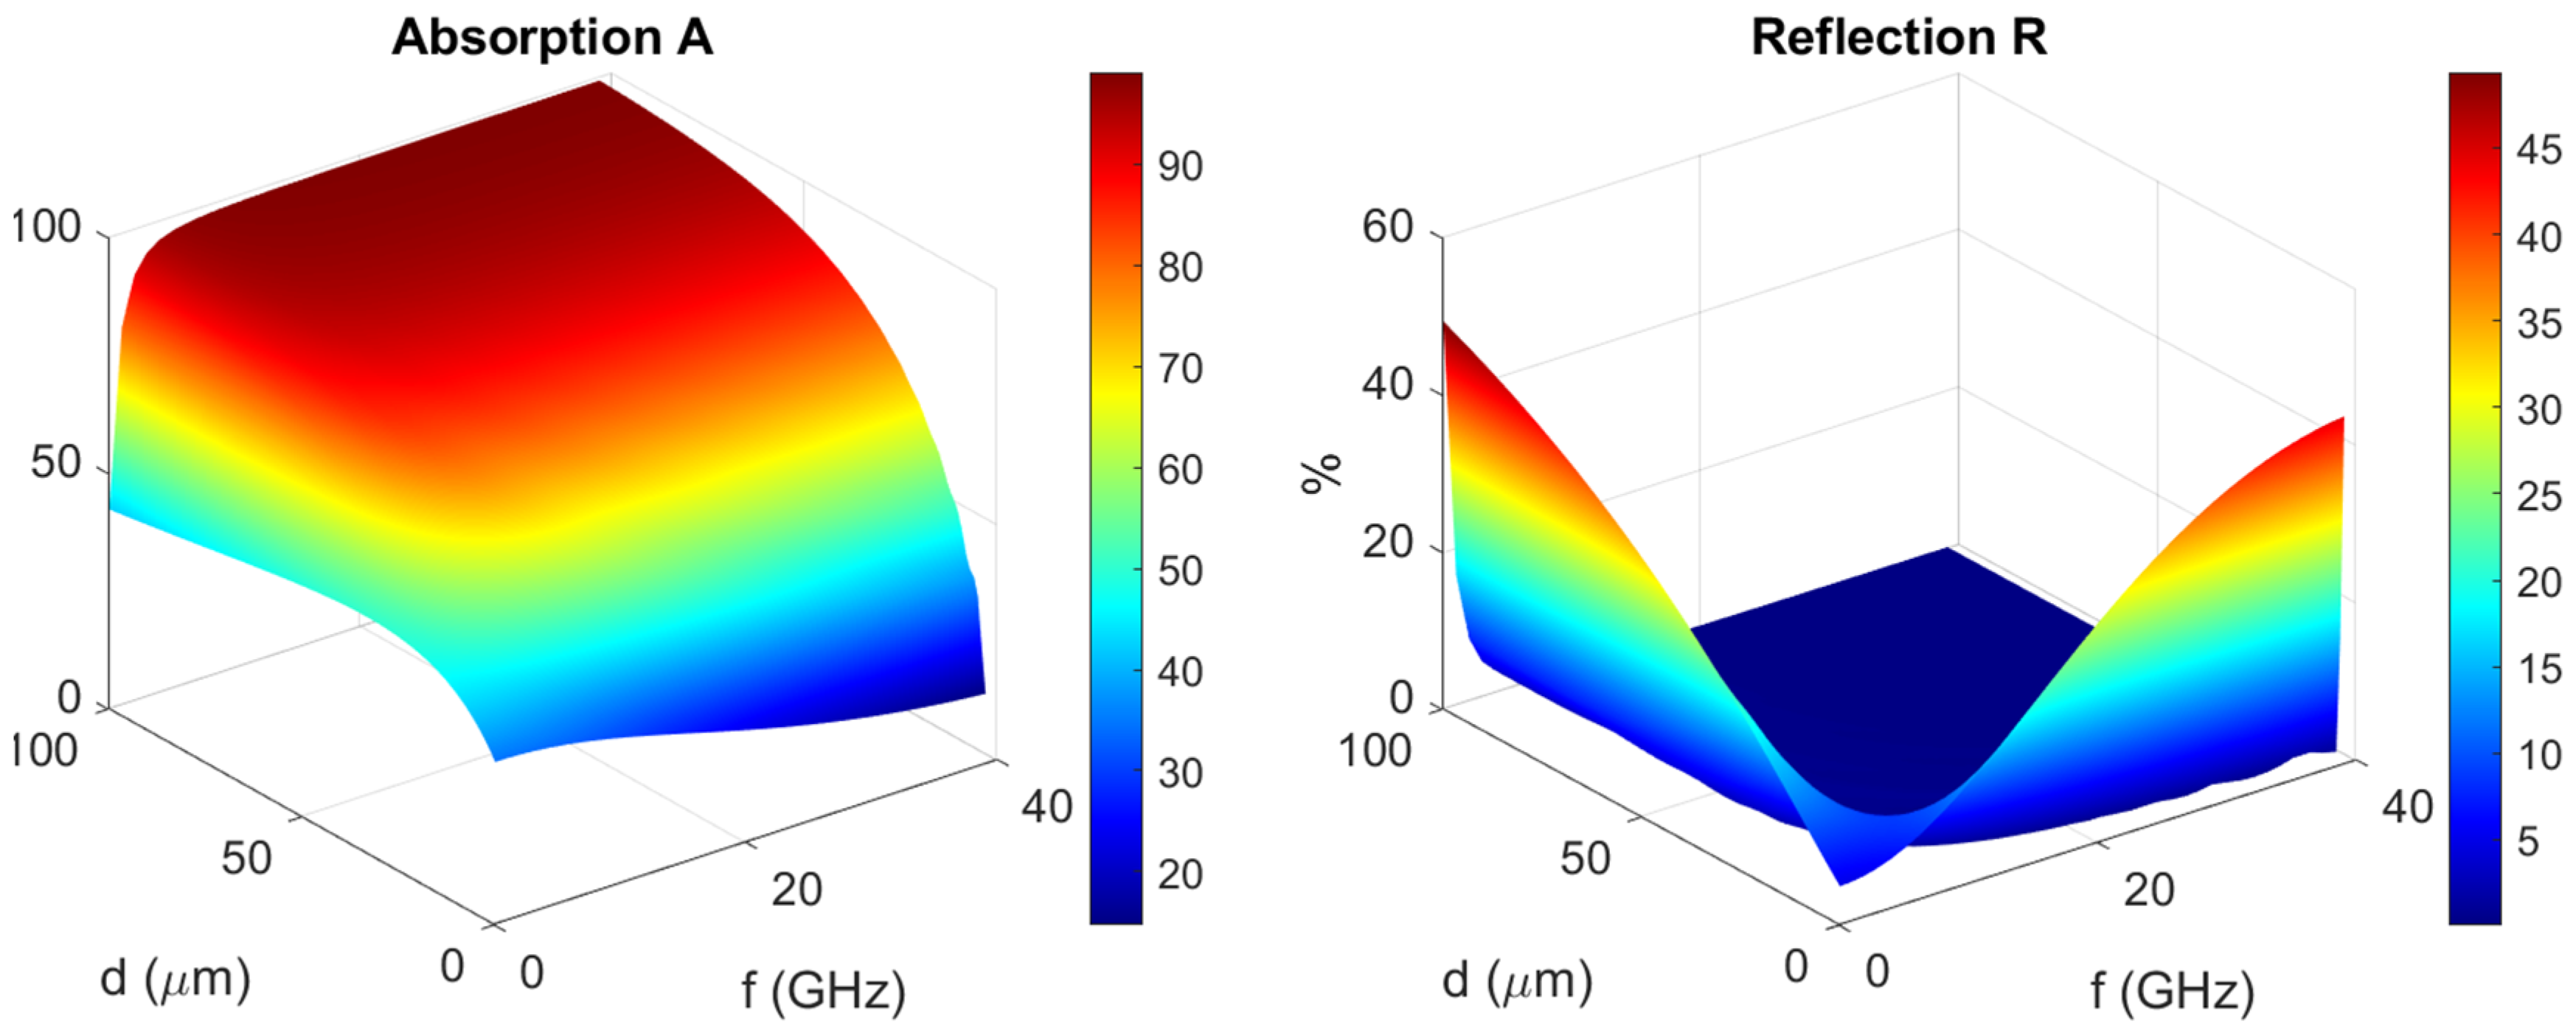
Figure 9 explores the behaviour of A and R as a function of frequency f and total thickness D of the foamed composite. It is observed that absorption increases with both parameters. The increase with D is easily explained by the fact that increasing D increases the content in conductive charges in the composite that directly impact the conductivity, and hence, the absorption capacity of the composite.
The dependence on frequency is less obvious. It is related to the frequency behaviour of the complex permittivity of the composite foam. This parameter is a function of the parameters of the polymer forming the foam. For case n°1, the dielectric constant of the polymer εr is equal to 6, while its conductivity σ is equal to 2. Applying a volumetric law enables us to calculate the complex permittivity of the foamed composite defined by (17), denoted εrf:
Figure 10 shows the frequency dependence of the complex permittivity of the foam. Obviously, the dependence of the imaginary part is very similar to that of reflection R. This is explained by the relation (15) linking reflection to complex permittivity.
3.5. Guidelines for the Design of Foamed Composites for Microwave Absorption
The analysis performed in Section 3.3 and Section 3.4 enables us to establish guidelines for the design of conductive foamed composites dedicated to absorption.
The following recommendations are formulated:
- The reflection factor at input of the foamed composite has to be minimised in order to favour absorption. For this:
- The fraction of air inside the foam has to be maximised; in other words, the ratio d/t has to be maximised, see Section 3.3.2 and Section 3.4.1, Figure 5.
- The dielectric constant of the composite material has to be as low as possible, in order to minimise the reflection R by virtue of (15), see Section 3.4.2, Figure 6.
- The absorption can be directly favoured by increasing the global thickness D of the composite (Section 3.4.4 and Figure 9); for some applications, however, compactness is a key issue so that a trade-off between thickness and absorption must be found.
- The absorption is also favoured by the conductivity of the composite material forming the foam (see Section 3.4.2 and Figure 6). However, a prohibitive conductivity can induce a prohibitive reflection R that reduces the penetration of the microwave signal in the foamed composite. Again, a trade-off between absorption and reflection has to be found.
3.6. Towards an Optimised Design
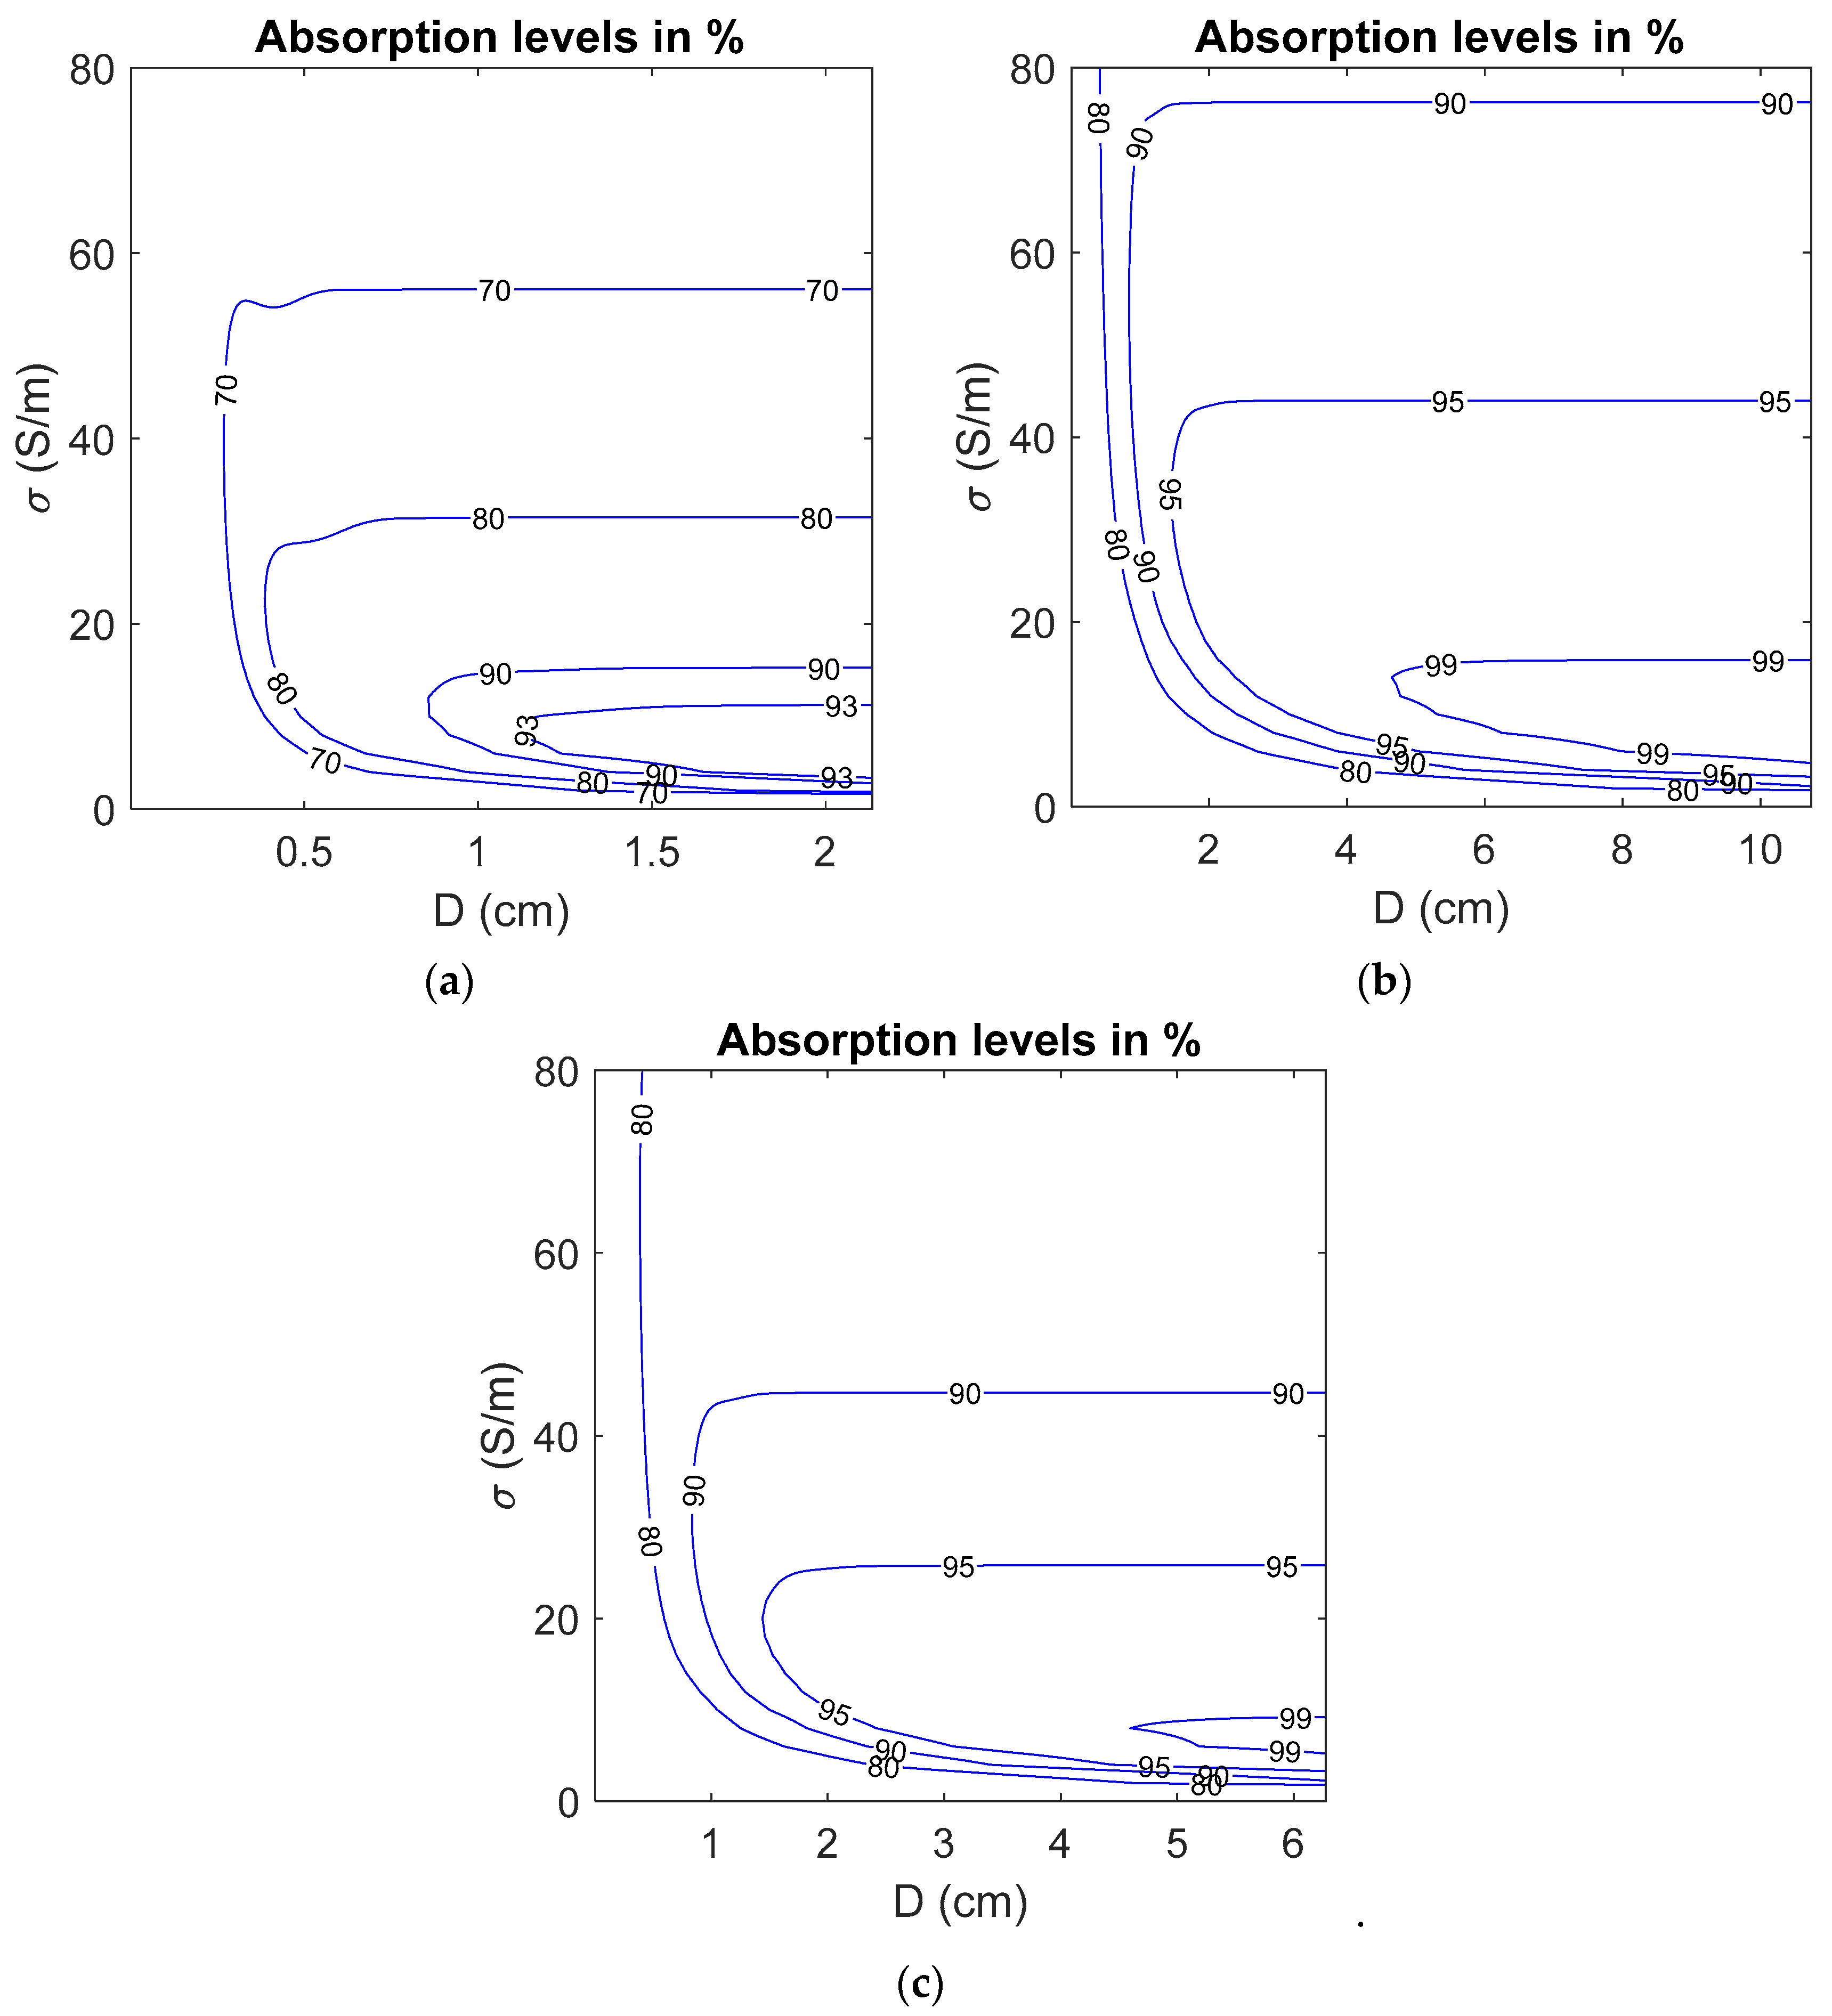
In order to illustrate the trade-off between conductivity and global thickness, Figure 11 shows contour plots of absorption A as a function of σ and D for the three cases presented in this paper; for each case, it is possible to find a set {σ, D} matching an absorption level higher than 90%, for a thickness not exceeding 2 cm and a conductivity below 10 S/m. Reaching a 99% level of absorption is possible for the case 1 and 2 at the price of increasing the thickness to nearly 6 cm.
As a final comment, the fine tuning of the conductivity tailors the absorption correlated to the thickness. The control of the conductivity induced by conductive loads in the polymer can be mastered by various techniques, including co-precipitation melt blending or extrusion, as presented in [11,12,13].
Additionally, it has to be highlighted that that the ultimate goal is the design of foamed composites for microwave absorption; hence, the model has to be used as a predictive tool, meaning that the dielectric constant of the solid composite polymer is considered as an input of the model and can be measured before the foaming process, as well as its conductivity, which is also an input parameter.
4. Conclusions
In this paper, we discuss the factors influencing microwave absorption in polymer foamed conductive composite using a 1D model developed for the prediction of the absorption of microwave power in microcellular foamed composites. It is shown that absorption and reflection are correlated in the sense that a high reflection prevents the proper absorption of the signal.
In addition, our simulations show that reflective interactions with the walls of the foam play no significant role in the absorption in the microwave range, since it is only enhanced in the THz frequency range, where the wavelength of the signal is of the same order of magnitude as the size of the foam’s cell.
Next, the crucial influence of the presence of air over the level of absorption is illustrated. The presence of air decreases the reflection level at the input of the composite in order to facilitate the penetration of the signal inside the foamed composite. In turn, the conductivity of the charges present in the composite forming the walls of the foam is responsible for the absorption of the signal. Finally, the thickness of the foamed composite also influences the absorption, since increasing the global thickness increases the number of conductive charges present in the foam.
These various features are exemplified through the proposed parametric analysis, which leads to a conclusion about the necessity to perform some trade-offs for the design of efficient and compact microwave foamed absorbers.
Funding
This research received no external funding.
Institutional Review Board Statement
Not applicable.
Informed Consent Statement
Not applicable.
Data Availability Statement
The data presented in this study are easily reproducible using the model presented in the article. Simulation data generated by the model and shown in the different figures can be made available on reasonable request from the corresponding author.
Acknowledgments
The author thanks the team of CERM Laboratory, University of Liège, Belgium, for fruitful collaboration in the field of foamed nanocomposites dedicated to EMI shielding.
Conflicts of Interest
The author declares no conflict of interest.
Appendix A
Here, we provide the formulas allowing the conversion of a chain matrix into the corresponding matrix. We are interested in the conversion of the whole structure, meaning that we consider and the air impedance Zair as input variables.
The matrix is rewritten for convenience:
Next, the matrix is written as:
The elements of the matrix are written as a function of A, B, C and D as:
References
- Violette, N. Compatibility Handbook; Springer: Berlin, Germany, 2013. [Google Scholar]
- Thomassin, J.M.; Jérôme, C.; Pardoen, T.; Bailly, C.; Huynen, I.; Detrembleur, C. Polymer/Carbon based composites as Electromagnetic Interference (EMI) shielding materials. Mater. Sci. Eng. Rep. 2013, 74, 211–232. [Google Scholar] [CrossRef]
- Yang, J.; Liao, X.; Li, J.; He, G.; Zhang, Y.; Tang, W.; Wang, G.; Li, G. Light-weight and flexible silicone ruber/MWCNTs/Fe3O4 nanocomposite foams for efficient electromagnetic interference shielding and microwave Absorption. Compos. Sci. Technol. 2019, 181, 107670. [Google Scholar] [CrossRef]
- Cheng, J.B.; Shi, H.G.; Cao, M.; Wang, T.; Wang, Y.Z. Porous carbon materials for microwave absorption. Mater. Adv. 2020, 1, 2631. [Google Scholar] [CrossRef]
- Xiong, L.; Yu, M.; Liu, J.; Li, S.; Xue, B. Preparation and evaluation of the microwave absorption properties of template-free graphene foam-supported Ni nanoparticles. RSC Adv. 2017, 7, 14733. [Google Scholar] [CrossRef] [Green Version]
- Ye, X.; Cheng, Z.; Ai, S.; Hou, B.; Zhang, J.; Liang, X.; Zhou, Q.; Liu, H.; Cui, S. Porous SiC/melamine-derived carbon foam frameworks with excellent electromagnetic wave absorbing capacity. J. Adv. Ceram. 2019, 8, 479–488. [Google Scholar] [CrossRef] [Green Version]
- Kumar, R.; Sharma, A.; Pandey, A.; Chaudhary, A.; Dwivedi, N.; Shafeeq, M.; Mondal, D.P.; Srivastava, A.K. Lightweight carbon-red mud hybrid foam toward fire-resistant and efficient shield against electromagnetic interference. Sci. Rep. 2020, 10, 9913. [Google Scholar] [CrossRef]
- Zhang, C.; Li, H.; Zhuo, Z.; Dugnani, R.; Sun, C.; Chen, Y.; Liu, H. Facile fabrication of ultra-light and highly resilient PU/RGO foams for microwave absorption. RSC Adv. 2017, 7, 41321. [Google Scholar] [CrossRef] [Green Version]
- Zhou, X.; Zhang, C.; Zhang, M.; Feng, A.; Qua, S.; Zhang, Y.; Liu, X.; Jia, Z.; Wu, G. Synthesis of Fe3O4/carbon foams composites with broadened bandwidth and excellent electromagnetic wave absorption performance. Compos. Part A 2019, 127, 105627. [Google Scholar] [CrossRef]
- Ye, X.; Chen, Z.; Li, M.; Wang, T.; Zhang, J.; Wu, C.; Zhou, Q.; Liu, H.; Cui, S. Reticulated SiC coating reinforced carbon foam with tunable electromagnetic microwave absorption performance. Compos. Part B 2019, 178, 107479. [Google Scholar] [CrossRef]
- Monnereau, L.; Urbanczyk, L.; Thomassin, J.M.; Alexandre, M.; Jérôme, C.; Huynen, I.; Bailly, C.; Detrembleur, C. Supercritical CO2 and polycarbonate based nanocomposites: A critical issue for foaming. Polymer 2014, 55, 2422–2431. [Google Scholar] [CrossRef]
- Thomassin, J.M.; Pagnoulle, C.; Bednarz, L.; Huynen, I.; Jerome, R.; Detrembleur, C. Foams of polycaprolactone/MWNT nanocomposites for efficient EMI reduction. J. Mater. Chem. 2008, 18, 792–796. [Google Scholar] [CrossRef]
- Tran, M.P.; Thomassin, J.M.; Alexandre, M.; Jerome, C.; Huynen, I.; Detrembleur, C. Nanocomposite Foams of Polypropylene and Carbon Nanotubes: Preparation, Characterization, and Evaluation of their Performance as EMI Absorbers. Macromol. Chem. Phys. 2015, 216, 1302–1312. [Google Scholar] [CrossRef]
- Saib, A.; Platteborze, R.; Huynen, I. Experimental demonstration of the origin of Photonic Bandgap creation and associated defect modes in microwave planar circuits. Microw. Opt. Tech. Let. 2004, 41, 5–9. [Google Scholar] [CrossRef]
- Saib, A.; Huynen, I. Transmission lines on Periodic Bandgap metamaterials: From microwaves to optics applications. J. Opt. A Pure Appl. Opt. 2005, 7, 124–132. [Google Scholar] [CrossRef]
- Danlée, Y.; Huynen, I.; Bailly, C. Thin smart multilayer microwave absorber based on hybrid structure of polymer and carbon nanotubes. App. Phys. Let. 2012, 100, 213105. [Google Scholar] [CrossRef]
- Danlée, Y.; Bailly, C.; Huynen, I. Thin and flexible multilayer polymer composite structures for effective control of microwave electromagnetic absorption. Compos. Sci. Technol. 2014, 100, 182–188. [Google Scholar] [CrossRef]
- Pozar, D. Microwave Engineering, 4th ed.; John Wiley & Sons: New York, NY, USA, 2012. [Google Scholar]
- Dobrowolski, J. Scattering Parameters in RF and Microwave Circuit Analysis and Design; Artech House: New York, NY, USA, 2016. [Google Scholar]
Figure 1.
Schematic 1D representation of a foam illuminated by an incident microwave signal (drawing not to scale). The air cell is modelled by a squared area of size a by virtue of Equation (1). The dashed blue rectangle indicates the area where the model is applied; the structure has to be replicated along the vertical direction in order to obtain a two-dimensional representation of the foam.

Figure 2.
Transmission T, reflection R and absorption A obtained from model (5)–(7) applied to sample case n°3. Note that 1 THz = 1000 GHz.
Figure 2.
Transmission T, reflection R and absorption A obtained from model (5)–(7) applied to sample case n°3. Note that 1 THz = 1000 GHz.

Figure 3.
Normalised electric field calculated inside three first sections of foamed composite; the x-axis covers the penetration depth of the microwave signal along three successive cells and 2 separating conductive walls, i.e., from 0 to 3 d + 2 t = 150 μm, while the y-axis covers the height of the squared cell, i.e., from 0 to d = 46.3 μm, corresponding to sample case n°3, for 5 different frequencies: (a) 2, (b) 3.33, (c) 4.5, (d) 6.1 and (e) 7.55 THz. Conductive walls are located from 46.5 to 51.5 μm, and from 98 to 103.5 μm, as indicated by dashed lines.


Figure 4.
Reflection R and absorption A modelled for the three cases of Table 1, for 2 configurations of composite: foam (solid curve) and solid (dashed curve); (a) case n°1, (b) case n°2 and (c) case n°3.
Figure 4.
Reflection R and absorption A modelled for the three cases of Table 1, for 2 configurations of composite: foam (solid curve) and solid (dashed curve); (a) case n°1, (b) case n°2 and (c) case n°3.


Figure 5.
Absorption A (left) and reflection R (right) function of thickness of cell wall t and size of air-filled cell d modelled for the case n°1, and for nominal values f = 20 GHz, εr = 6 and σ = 2 S/m for the composite polymer forming the walls.
Figure 5.
Absorption A (left) and reflection R (right) function of thickness of cell wall t and size of air-filled cell d modelled for the case n°1, and for nominal values f = 20 GHz, εr = 6 and σ = 2 S/m for the composite polymer forming the walls.

Figure 6.
Absorption A (left) and reflection R (right) function of dielectric constant εr and conductivity σ of cell wall for the case n°1, and for f = 20 GHz.
Figure 6.
Absorption A (left) and reflection R (right) function of dielectric constant εr and conductivity σ of cell wall for the case n°1, and for f = 20 GHz.

Figure 7.
In-plane view of absorption A (left) and reflection R (right) function of frequency f and size d of cell, and for nominal values εr = 6 and σ = 2 S/m corresponding to case n°1.
Figure 7.
In-plane view of absorption A (left) and reflection R (right) function of frequency f and size d of cell, and for nominal values εr = 6 and σ = 2 S/m corresponding to case n°1.

Figure 8.
Absorption A (left) and reflection R (right) function of frequency f and size d of cell, and for nominal values εr = 6 and σ = 2 S/m corresponding to case n°1.
Figure 8.
Absorption A (left) and reflection R (right) function of frequency f and size d of cell, and for nominal values εr = 6 and σ = 2 S/m corresponding to case n°1.

Figure 9.
Absorption A (left) and reflection R (right) function of frequency f and total thickness D for the case n°1, for nominal values εr = 6, σ = 2 S/m for the composite polymer forming the walls.
Figure 9.
Absorption A (left) and reflection R (right) function of frequency f and total thickness D for the case n°1, for nominal values εr = 6, σ = 2 S/m for the composite polymer forming the walls.

Figure 10.
Frequency dependence of the complex permittivity of foamed composite corresponding to case n°1.
Figure 10.
Frequency dependence of the complex permittivity of foamed composite corresponding to case n°1.

Figure 11.
Contour plot of absorption levels for nominal frequency f = 20 GHz; (a) case n°1, (b) case n°2 and (c) case n°3.
Figure 11.
Contour plot of absorption levels for nominal frequency f = 20 GHz; (a) case n°1, (b) case n°2 and (c) case n°3.


Table 1.
Main characteristic values for the three samples considered in this study. Case n°1 is illustrated by SEM image shown in ([11], Figure 11 (right)), case n°2 by SEM image shown in ([12], Figure 2d) and case n°3 by SEM image shown in ([13], Figure 3d).
| Sample Composite | Case n°1 | Case n°2 | Case n°3 |
|---|---|---|---|
| Cell size d (μm) | 15 | 80 | 46.3 |
| Frequency range (GHz) | 15–17 | 26–40 | 28–38 |
| Wall thickness t (μm) | 2 | 7 | 5 |
| Overall thickness D (mm) | 20 | 20 | 8 |
| A (%) | 75/75 | − | 70/76 |
| R (dB) | − | 8.2/8.7 | 7/7 |
| EMI (dB) | − | 72/75 | 50/54 |
Table 2.
Dielectric constant, characteristic impedance ratio and input reflection coefficients for unfoamed and foamed materials, corresponding to samples reported in Table 1.
Table 2.
Dielectric constant, characteristic impedance ratio and input reflection coefficients for unfoamed and foamed materials, corresponding to samples reported in Table 1.
| Sample Composite | Case n°1 | Case n°2 | Case n°3 |
|---|---|---|---|
| Dielectric constant εr of solid composite | 6 | 30 | 18.7 |
| Dielectric constant εr of foamed composite | 1.35 | 4 | 3.18 |
| Zp/Zair = 1/ for solid composite | 0.408 | 0.182 | 0.2351 |
| Zp/Zair = 1/ for foamed composite | 0.8607 | 0.5 | 0.5608 |
| Γ for solid composite | 0.421 | 0.692 | 0.693 |
| Γ for foamed composite | 0.075 | 0.333 | 0.2814 |
Publisher’s Note: MDPI stays neutral with regard to jurisdictional claims in published maps and institutional affiliations. |
© 2021 by the author. Licensee MDPI, Basel, Switzerland. This article is an open access article distributed under the terms and conditions of the Creative Commons Attribution (CC BY) license (https://creativecommons.org/licenses/by/4.0/).
Share and Cite
MDPI and ACS Style
Huynen, I. Investigation of Microwave Absorption Mechanisms in Microcellular Foamed Conductive Composites. Micro 2021, 1, 86-101. https://doi.org/10.3390/micro1010007
AMA Style
Huynen I. Investigation of Microwave Absorption Mechanisms in Microcellular Foamed Conductive Composites. Micro. 2021; 1(1):86-101. https://doi.org/10.3390/micro1010007
Chicago/Turabian StyleHuynen, Isabelle. 2021. "Investigation of Microwave Absorption Mechanisms in Microcellular Foamed Conductive Composites" Micro 1, no. 1: 86-101. https://doi.org/10.3390/micro1010007