Article

Qualification of Human Liver Microsomes for Antibacterial Activity Screening of Drug Metabolites

Proteomics Center of Excellence, The Chemistry of Life Processes Institute, Northwestern University, Evanston, IL 60208, USA
Appl. Microbiol. 2023, 3(1), 104-118; https://doi.org/10.3390/applmicrobiol3010009
Submission received: 9 December 2022 / Revised: 14 January 2023 / Accepted: 21 January 2023 / Published: 22 January 2023

Abstract

:
Microsomes are commonly used to perform in vitro drug metabolism, predominantly to form phase I drug metabolites. Pooled microsomes from multiple donors can contain microorganisms from underlying microbial diseases. Exposure to microbes can also occur during extraction if aseptic processing is compromised. Although microbial presence does not affect the metabolic activity of microsomes, presence of unwanted microorganisms can cause interference if the downstream application of microsomal drug metabolites is screening for antibacterial activity. In this work, traditional biochemical tests and advanced proteomics-based identification techniques were used to identify two gram-negative bacteria in pooled human liver microsomes. Several decontamination procedures were assessed to eradicate these two bacteria from the microsomes without affecting its metabolic capacity, and organic extraction was found to be the most convenient and efficient approach to decontaminate microsomes and screen drug metabolites for antibacterial activity against methicillin-resistant Staphylococcus aureus (MRSA).

1. Introduction

Drugs, xenobiotics, or exogenous substances undergo a series of biotransformation processes when introduced into the body, which are also known as metabolism. There are different enzymes that can act on drugs or xenobiotics to either activate them by introducing a reactive group or deactivate them by conjugating polar moieties to help them be excreted from the body [1]. The rate and extent of drug metabolism are highly variable [2] and depend on the presence of different enzymes, which can vary among human populations [3]. Additionally, patients with reduced hepatic function or liver diseases can also show variability in drug metabolism [4,5]. Primarily, the purpose of the metabolism is to reduce the lipophilicity or increase the hydrophilicity of the drugs so that, after eliciting the therapeutic activity, they can be excreted from the body. For prodrugs, however, metabolism actually activates the drugs so that they can exhibit the pharmacodynamic responses [6]. Several prodrugs that have no intrinsic activity before metabolism are metabolized into active compounds showing intended pharmacodynamic responses, e.g., diamorphine, codeine, enalapril, and levodopa [7]. Drug metabolism occurs in three phases [8]. In phase I, a reactive group is introduced into the drug predominately by different cytochrome P450s (CYPs) enzymes through various reactions such as oxidation, reduction, and hydrolysis. During phase II, polar moieties such as glutathione, glucuronic acid, acetic acid, sulfuric acid, etc. are conjugated to the drugs. Finally, in phase III, transporters remove the drugs and their metabolites from the body.
The liver is the primary site of drug metabolism. Additionally, metabolism occurs in the skin and gastrointestinal tract [9]. Performing drug metabolism in vitro has been a keen interest of scientists for various reasons, including deciphering the metabolic routes, identification of metabolites, studying differences in metabolism between species, studying toxicity, assessing for potential in-vivo study, etc. In-vitro drug metabolism can be performed using cellular organelles such as liver slices or hepatocytes, subcellular fractions such as S9, cytosolic or microsomal fractions, and metabolizing enzymes such as CYP P450s [10]. Liver slices and hepatocytes mimic the in-vivo condition the most among different approaches available for drug metabolism, but contain both phase I and phase II drug metabolizing enzymes (DMEs) [11]. Three different fractions can be obtained from liver slices or hepatocytes through differential centrifugation: S9, cytosolic, and microsomal fractions. The S9 fraction contains both DMEs I and II, but the microsomal and cytosolic fractions contain only DMEs I and DME II, respectively [10]. Use of a specific group of enzymes, such as a specific CYP P450 variant or a flavin monooxygenase, necessitates that the drug of interest is a substrate for that enzyme. In general, since phase I DMEs are reported to activate prodrugs, they can be explored for drug metabolite profiling for activity analysis. Drug metabolism has remained an active field of research in drug discovery and development to identify and assess the metabolites for biological activity and to estimate inter-patient variability in pharmacodynamic response, elimination, toxicity, and safety profiling [12,13,14].
Among different approaches of drug discovery, drug repurposing (also known as drug repositioning) is an expanding approach that involves exploring a novel clinical use of an existing drug approved for a different disease indication [15]. It has become a commonplace to explore novel therapeutic activity of existing drugs for neglected diseases due to reduced cost, effort, and time [16,17,18,19,20]. Drug repurposing can also facilitate identification of a combinatory effect, mechanism of action, and new drug classes. We adopted a drug repurposing approach to screen chemical libraries to explore antibacterial activities against methicillin-resistant Staphylococcus aureus (MRSA) by a comparative screening of unmetabolized (UM) and pre-metabolized (PM) by human liver microsome chemical libraries [21,22]. We performed microsomal metabolism to obtain phase I drug metabolites, as microsomes contain the major phase I DMEs [23] and assessed them for improved activity in a whole- cell-based fluorescence assay, as described in Ayon et al. [21]. The microsomes used in this study were pooled from 50 donors, which is a good representation of the types of variability expected among patients due to age, gender, ethnicity, and physiological condition. However, a major bottleneck of this screening effort was the identification and eradication of the microbial content from the microsomes without affecting their metabolic capacity. There are established diagnostic protocols for microbial identification, including Gram staining and biochemical testing, but they often lack accuracy in identifying the genus and species of the strain and are time consuming. Use of probes, sequencing, and mass spectrometry-based approaches has tremendously improved the accuracy and speed of microbial identification [24]. Matrix-assisted laser desorption ionization time-of-flight (MADLI-TOF) mass spectrometry uses proteomics workflow to identify microorganisms based on signature proteins [25,26,27,28] and can accurately identify bacteria and yeast grown in agar plates and from blood culture broths in a clinical setting [29]. In this work, we demonstrated the identification of contaminating bacteria present in human liver microsomes using MALDI-TOF mass spectrometry and ways to decontaminate them without affecting the metabolic activity using various approaches.

2. Materials and Methods

2.1. General

Control CYP substrates included a panel of six standard drugs: phenacetin, tolbutamide, dextromethorphan, coumarin, chlorzoxazone, and diclofenac, all of which were from Sigma-Aldrich. Cation-adjusted Muller–Hinton (CAMH) broth and Leconostoc mesenteroids glucose-6-phosphate dehydrogenase (G6PDH) were also from Sigma-Aldrich. Glucose-6-phosphate (G6P) and β-nicotinamide adenine dinucleotide phosphate (NADP+) were from Alfa Aesar (a division of Thermo Fisher Scientific). Sheep blood agar (SBA) plates were from Fisher Scientific, SpectraTM MRSA plates were from Thermo Scientific, and Mannitol Salt Agar (MSA) plates were from Sigma-Aldrich. Petri dishes were from USA Scientific. Proteomics based microbial identification was performed on a Bruker ultrafleXtreme MALDI-TOF/TOF mass spectrometer, and LC-MS/MS based microsomal metabolic activity assessment was performed on a Sciex QTrap mass spectrometer coupled to a Shimadzu HPLC system using electrospray ionization (ESI). All other reagents used were from standard sources and were reagent grade or better. The MRSA strain F–182 (ATCC 43300) was from American Type Culture Collection (ATCC).

2.2. Initial Observation and Diagnosis of Microbial Content

During initial library screening, difference in turbidity was observed between microsomal treated (PM) and non-treated samples (UM) [30]. The MRSA stock was prepared from a single colony of MRSA F–182 (ATCC 43300) grown in a CAMH agar plate containing 16 µg/mL cefoxitin. Briefly, a single colony was carefully selected using a sterile loop and grown in 20 mL CAMH media overnight at 35 °C with shaking. The next day, the overnight culture was used to start a secondary culture with freshly prepared CAMH media. The secondary culture was grown until 0.6 OD, diluted 100 times, and 500 µL of aliquots were prepared and stored in –80 °C. The culture was thawed and 50 µL was plated into a CAMH agar plate, sheep blood agar plate, Spectra MRSA plates, and mannitol salt agar plates, in duplicates. Similarly, 50 µL of microsomes were plated in those four different types of agar plates. The plates were incubated in an inverted position overnight at 35 °C, and the next day they were checked for growth and morphology. Gram staining and catalase testing were performed according to the American Society for Microbiology protocol [31,32,33].

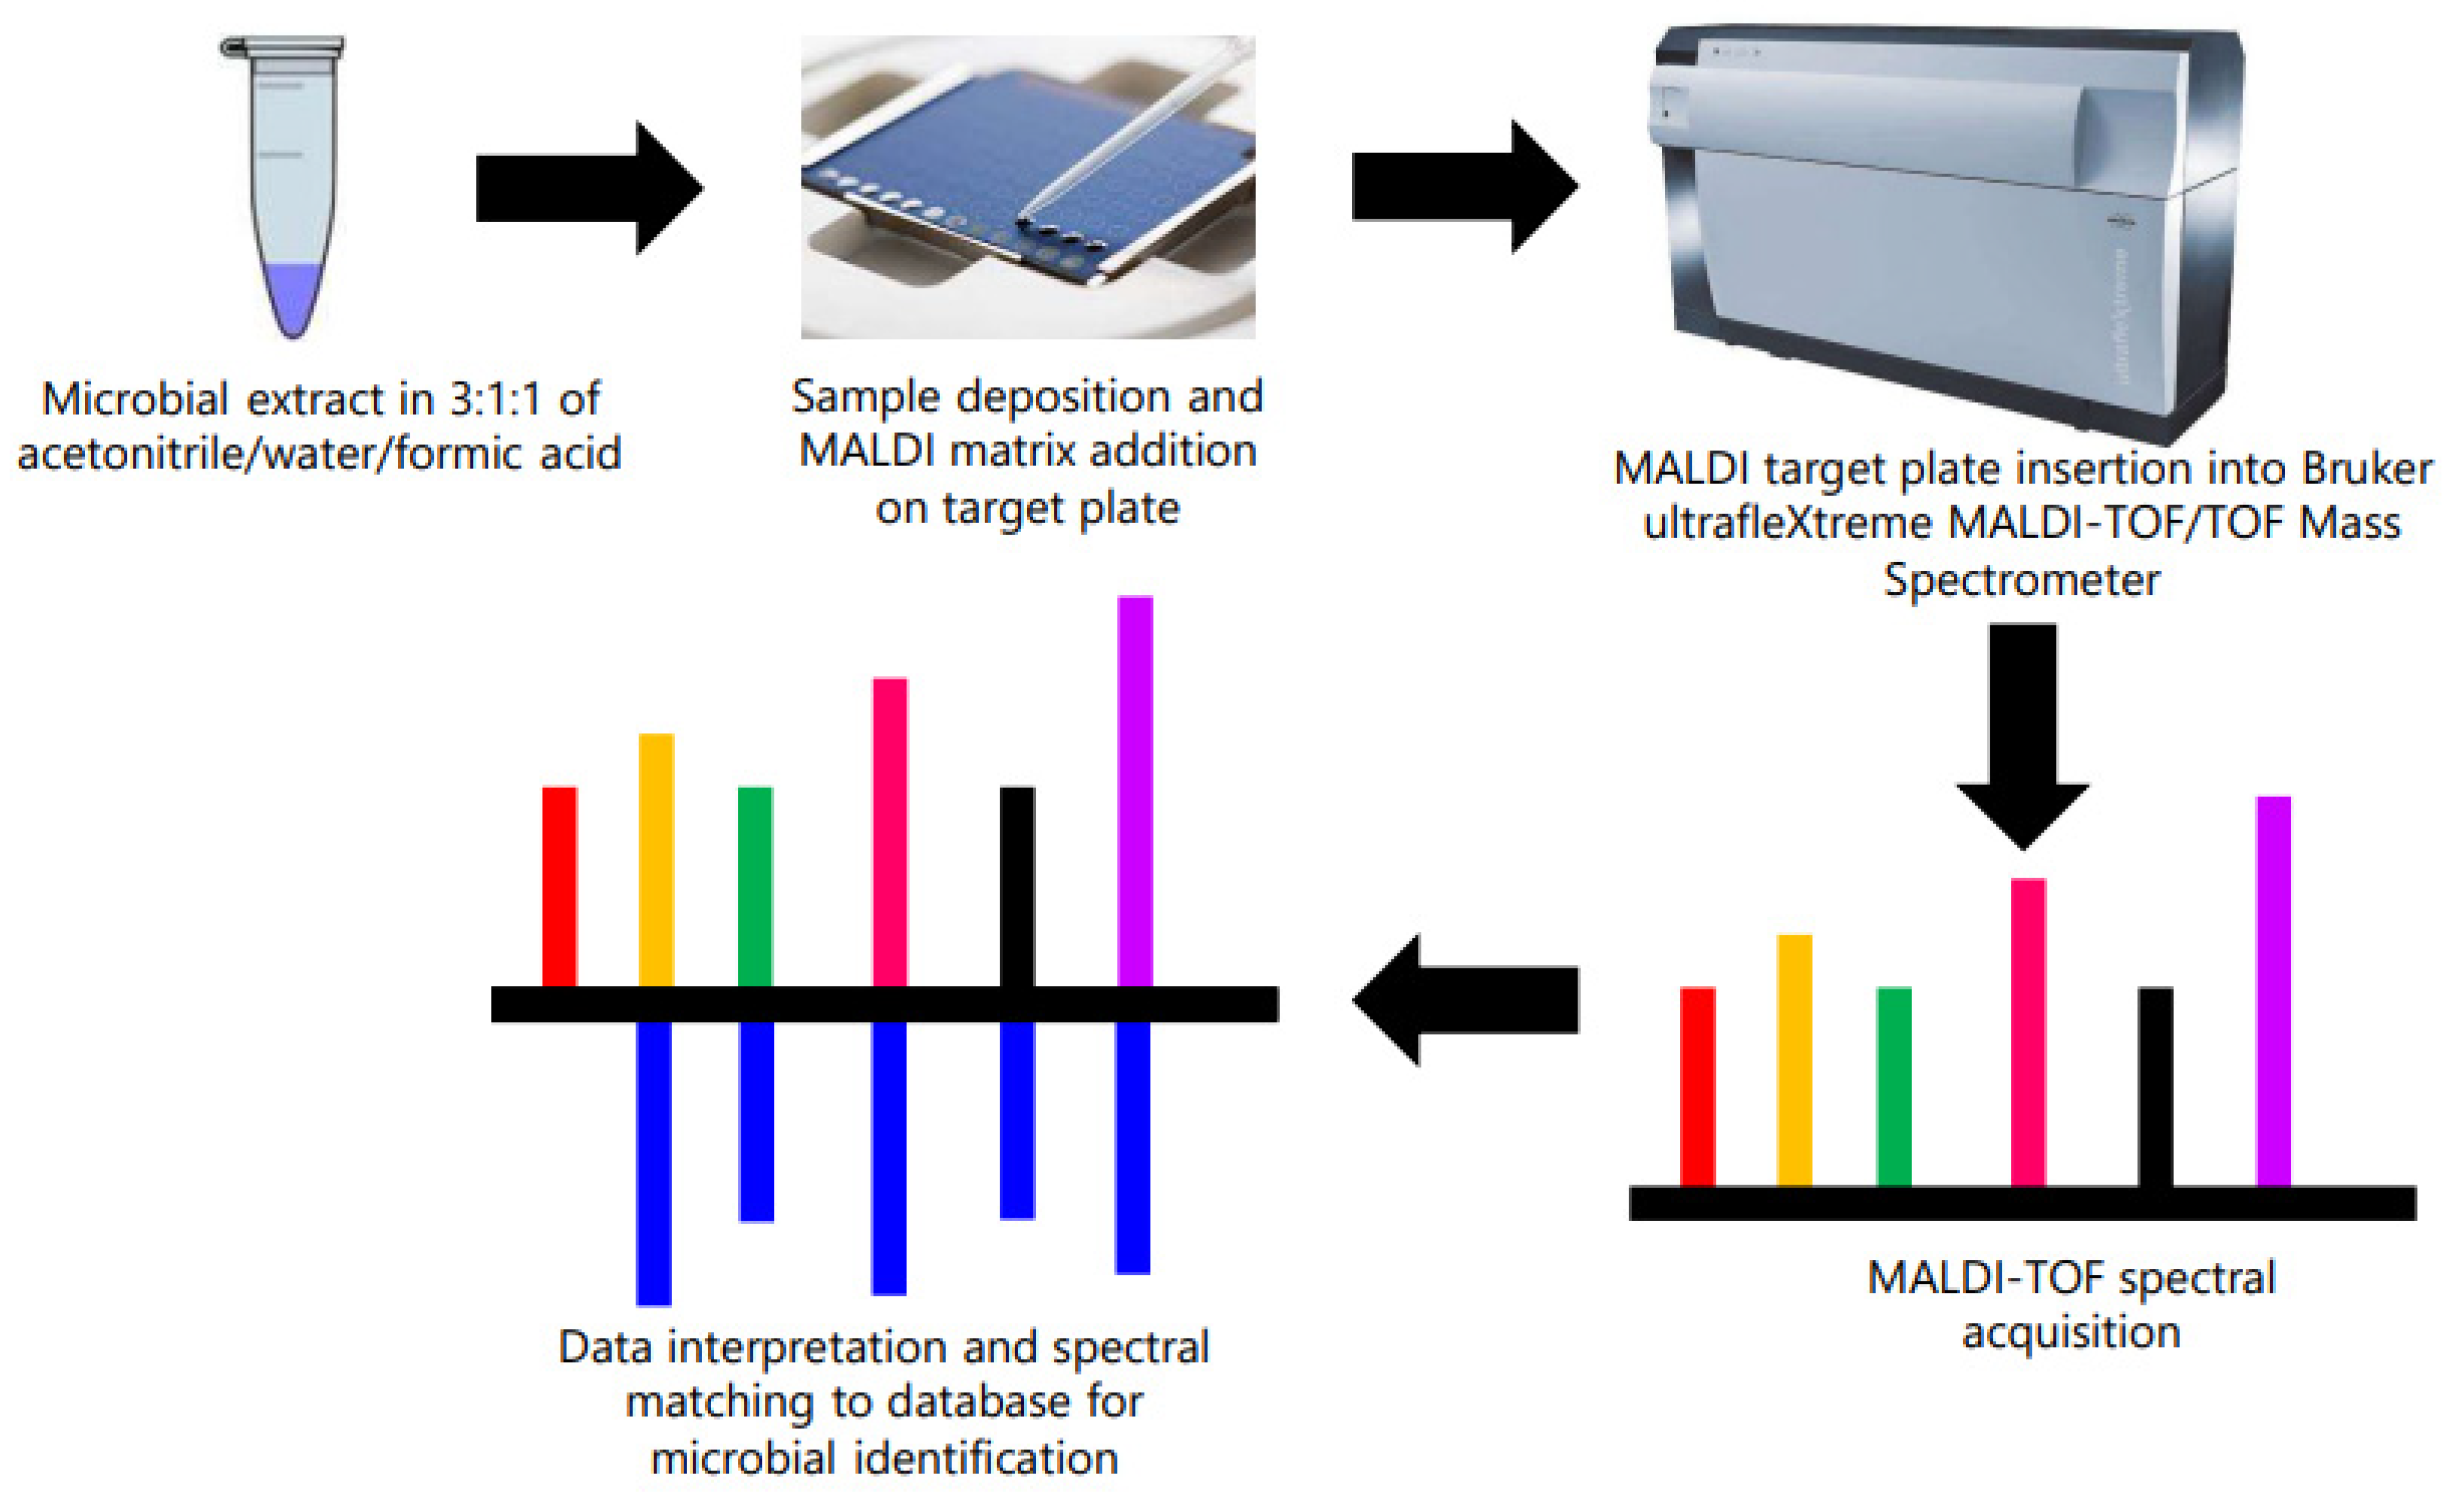
2.3. Identification of Contaminant Bacteria from Microsome Using MALDI-TOF/TOF

Identification of unknown microorganisms present in microsomes was carried out on a MALDI-TOF/TOF mass spectrometer (Bruker ultrafleXtreme). Before analysis, the MALDI target plate was cleaned according to manufacturer’s instructions. Bacterial test standard (BTS) solution containing Escherichia coli was prepared by adding 1000 µL of 1:1 of water/acetonitrile with 0.25% trifluoroacetic acid and mixed with a pipette. The BTS solution was then centrifuged at 13,000 rpm for 2 min and aliquoted, and kept at –20 °C until it was used. The microbial sample was prepared according to manufacturer’s instructions using both direct transfer of colony and extraction protocol [34,35,36,37] (Figure 1).
For direct transfer, individual colonies were smeared onto a clean spot on a MALDI target plate with 1 µL BTS. Once dried, 1 µL MALDI-matrix, α-cyano-4-hydroxycinnamic acid (HCCA) solution was added onto the spots containing the sample, allowed to dry, and then loaded onto the mass spectrometer for spectral acquisition. For organic extraction, single colonies were picked up using a sterile 1 µL inoculation loop and were transferred to sterile microcentrifuge tubes containing 300 µL of sterile water. A volume of 900 µL of 100% ethanol was then added to each tube and the contents were mixed well using a vortex mixer. The tubes were then centrifuged at 13,000 rpm for 2 min and the supernatants were discarded. The step was repeated one more time for a second extraction. The tubes were then air-dried for 5 min at room temperature inside a biosafety hood. To each of the dried tubes, a 25-µL volume of 70% aqueous formic acid was then added, resuspended with pipetting up and down, and then an additional 25 µL of 100% acetonitrile was added. The samples were vortexed well and centrifuged at 13,000 rpm for 2 min. From each sample, 1 µL of supernatant was removed and deposited onto a MALDI target plate along with 1 µL of BTS, which was then air-dried, and then 1 µL HCCA was added. Upon drying, the target plate was then inserted into the MALDI-TOF mass spectrometer for spectral recording. Once the spectral recording was acquired, the BioTyper 3.1 software matched the acquired spectrum against a database to provide the final identification result.

2.4. Approaches to Decontaminate Microsomes

In order to sterilize the microsomes, several approaches were attempted and evaluated. We first attempted to sterilize the microsomes by exposing them to ultraviolet light [38] for up to 120 min inside a biosafety level (BSL) 2 hood. At different time points under UV exposure, 10 µL of microsomes were taken out and plated onto CAMH agar plates with and without a panel of selective agents (NaCl, cefoxitin, polymyxin B, and ketoconazole) to observe the effect of UV exposure on microsomal contamination.
We then performed thermal pasteurization [39], in which the microsomes were exposed to 70 °C in a water bath for 30 min and checked for contamination by plating sample onto CAMH agar plates. We also assessed various selective agents for MRSA, including 3% NaCl [40], 8–16 µg/mL cefoxitin [41], 2 µg/mL polymyxin [42], and 1 µg/mL ketoconazole [43]. Finally, we evaluated organic extraction and reconstitution with 100% dimethyl sulfoxide (DMSO) to decontaminate the microsomes. Briefly, the PM plates post metabolism were centrifuged at 4000× g for 30 min using a Sorvall RT6000 refrigerated centrifuge at 4 °C, and the supernatants were transferred to fresh sterile cluster tube plates. To the microsomal pellets were then added 200 µL of 100% DMSO, which were mixed with a pipette and centrifuged again at 4000× g for 30 min, and then the resulting supernatant was combined with the first supernatant. The combined supernatants were then frozen at −80 °C and dried under a strong vacuum (<50 μmHg) in a Genevac Quatro centrifugal concentrator. Finally, the dried library plates were reconstituted with 200 µL of 100% DMSO to provide a 1 mM PM FDA working library [21] for screening.

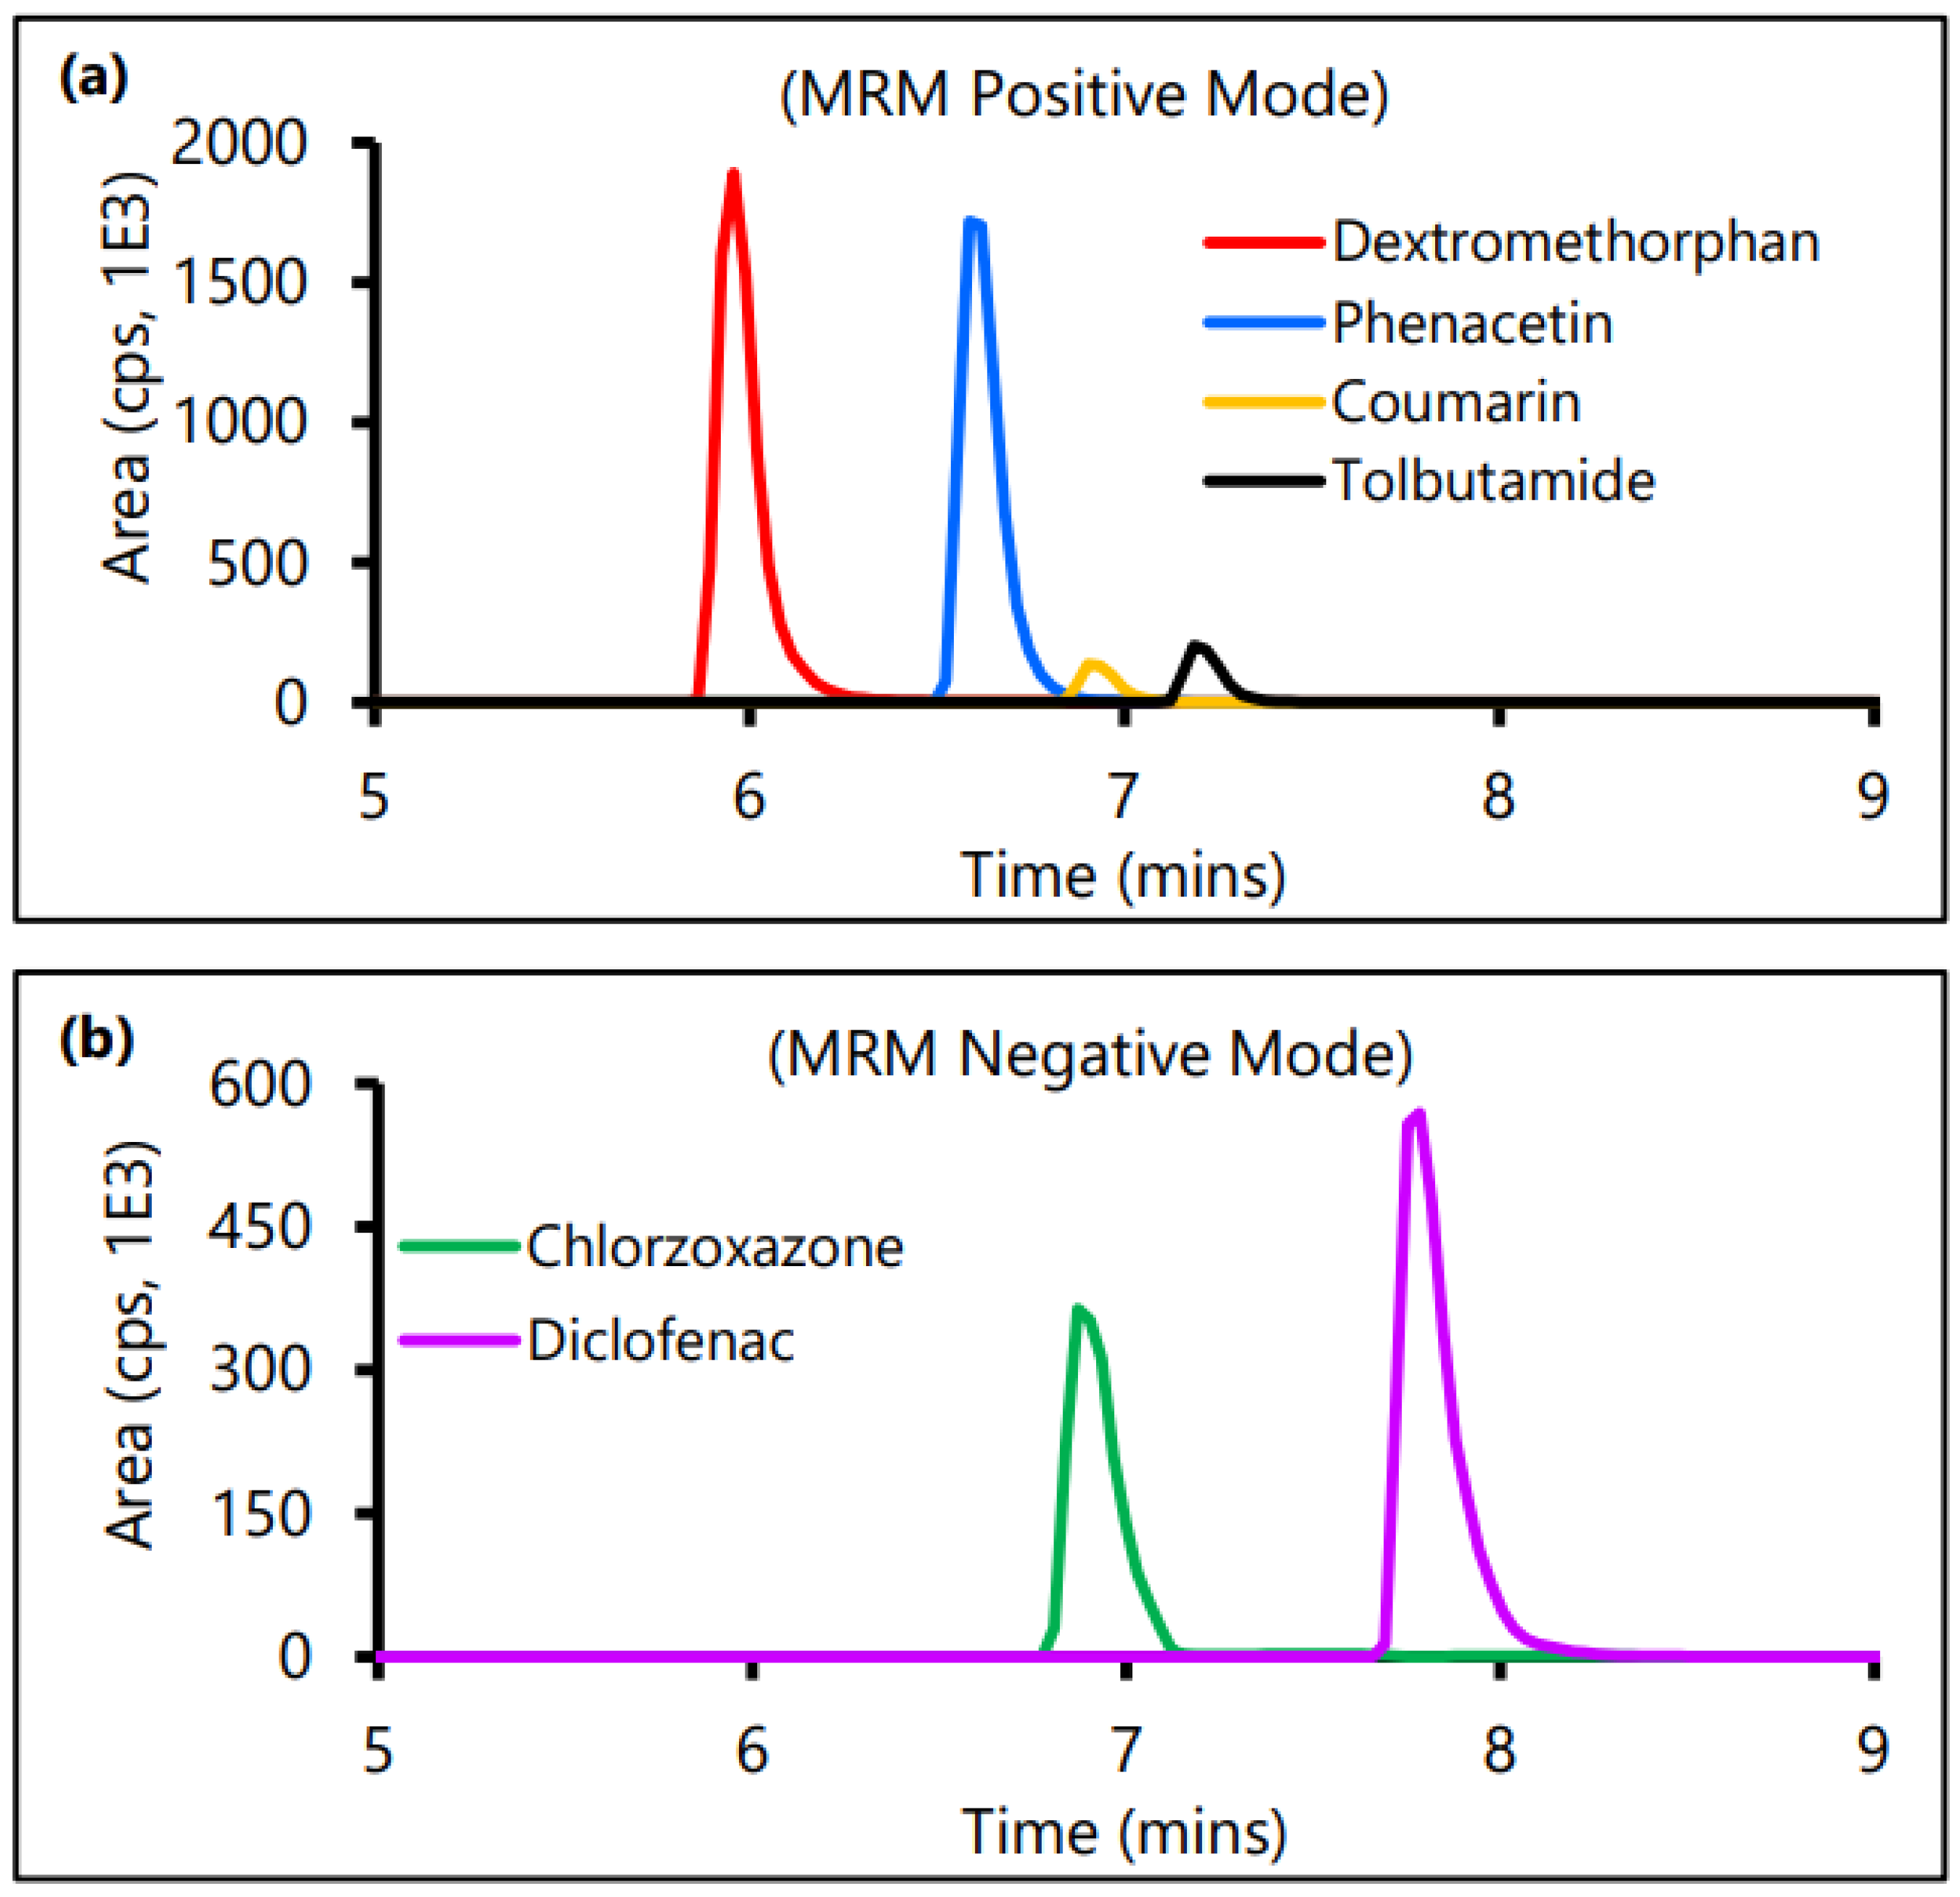
2.5. LC-MS/MS-Based Analytical Method Development for Control CYP Substrates

Stock solutions of six standard CYP substrates at a concentration of 100 µM were prepared in 10% acetonitrile with 0.1% formic acid and were used to tune various compound- and source-dependent parameters (Table 1) using the automated quantitative optimization wizard of Analyst 1.6.2 and a triple quadrupole mass spectrometer (Sciex QTrap 3200) coupled with a Shimadzu HPLC.
The most intense Q3 fragments were selected for the final multiple reaction monitoring (MRM) method [44]. Four of the control CYP substrates, phenacetin, tolbutamide, dextromethorphan, and coumarin were detected in positive MRM mode (pH 2) (Figure 2a) and the remaining two control CYP substrates, chlorzoxazone and diclofenac, were detected in negative MRM mode (Figure 2b).
For tracking the major metabolite formation for each control CYP substrate, MRM channels were created based on the parameters for their parent drugs and included in the developed positive and negative MRM methods. Precursor ion (Q1) masses for the metabolites were added based on the major CYP reaction they undergo (Figure 3).
For example, tolbutamide (Figure 3b), coumarin (Figure 3d), chlorzoxazone (Figure 3e), and diclofenac (Figure 3f), all undergo CYP-mediated hydroxylation [45] and their major metabolite channel was included as Q1 = m/z of parent drug—proton + m/z of a hydroxyl group, i.e., m/z of parent + 16. Phenacetin and dextromethorphan, on the contrary, undergo CYP-mediated dealkylation [45], more specifically, deethylation (Figure 3a) and demethylation (Figure 3c), respectively; and their major metabolite channel was included as Q1 = m/z of parent drug—m/z of an ethyl group + proton (m/z of parent — 28) and Q1 = m/z of parent drug—m/z of a methyl group + proton (m/z of parent — 14), respectively. Selection of fragment ion (Q3) masses for each of these metabolites was based on MS/MS fragmentation of the counterpart parent ions. Water with formic acid and acetonitrile with 0.1% formic acid were used as solvent A and B, respectively, in the following gradient: 5% B (0–2 min), 5–95% B (2–10 min), 95–5% B (10–11 min) with 4 min post-equilibration for both positive and negative mode detection with a 0.3 mL/min flow rate and a Kromasil C18 column (100 × 3.0 mm, 5-micron particle size).

2.6. Time Kinetics Analysis of Drug Metabolism

The microsomal reaction buffer, consisting of 50 mM potassium phosphate (pH 7.4), 2 mM MgCl2, 4 mM G6P, 1 unit/mL of G6PDH, and 0.5 mg/mL of total microsomal protein was used to evaluate the metabolic activity of the microsomes. A standard mixture of control CYP substrates, at a concentration of 100 µM of each, was incubated with the microsomal reaction buffer [21]. At different time points, 10 µL of the sample was taken out, to which was added 90 µL of 10% acetonitrile with 0.1% formic acid. The samples were analyzed in triplicate using the developed analytical methods in both positive and negative MRM mode. Rate and extent of metabolism were calculated using the following formula, as discussed in Knights, K. M. et al. [23]:
%   P a r e n t   c o m p o u n d   d e p l e t i o n = 100 ( p e a k   a r e a   a t   t   m i n p e a k   a r e a   a t   0   m i n × 100 )
R a t e   o f   d e p l e t i o n   ( p m o l / m i n / m g ) = ( C × 1000 ) B × T
where ΔC = [peak area at 0 min]—[peak area at t min], t = the time at which each observation is made, B = microsome concentration (mg/mL), T = incubation time (min), and 1000 is the conversion factor from nmol to pmol.

3. Results and Discussion

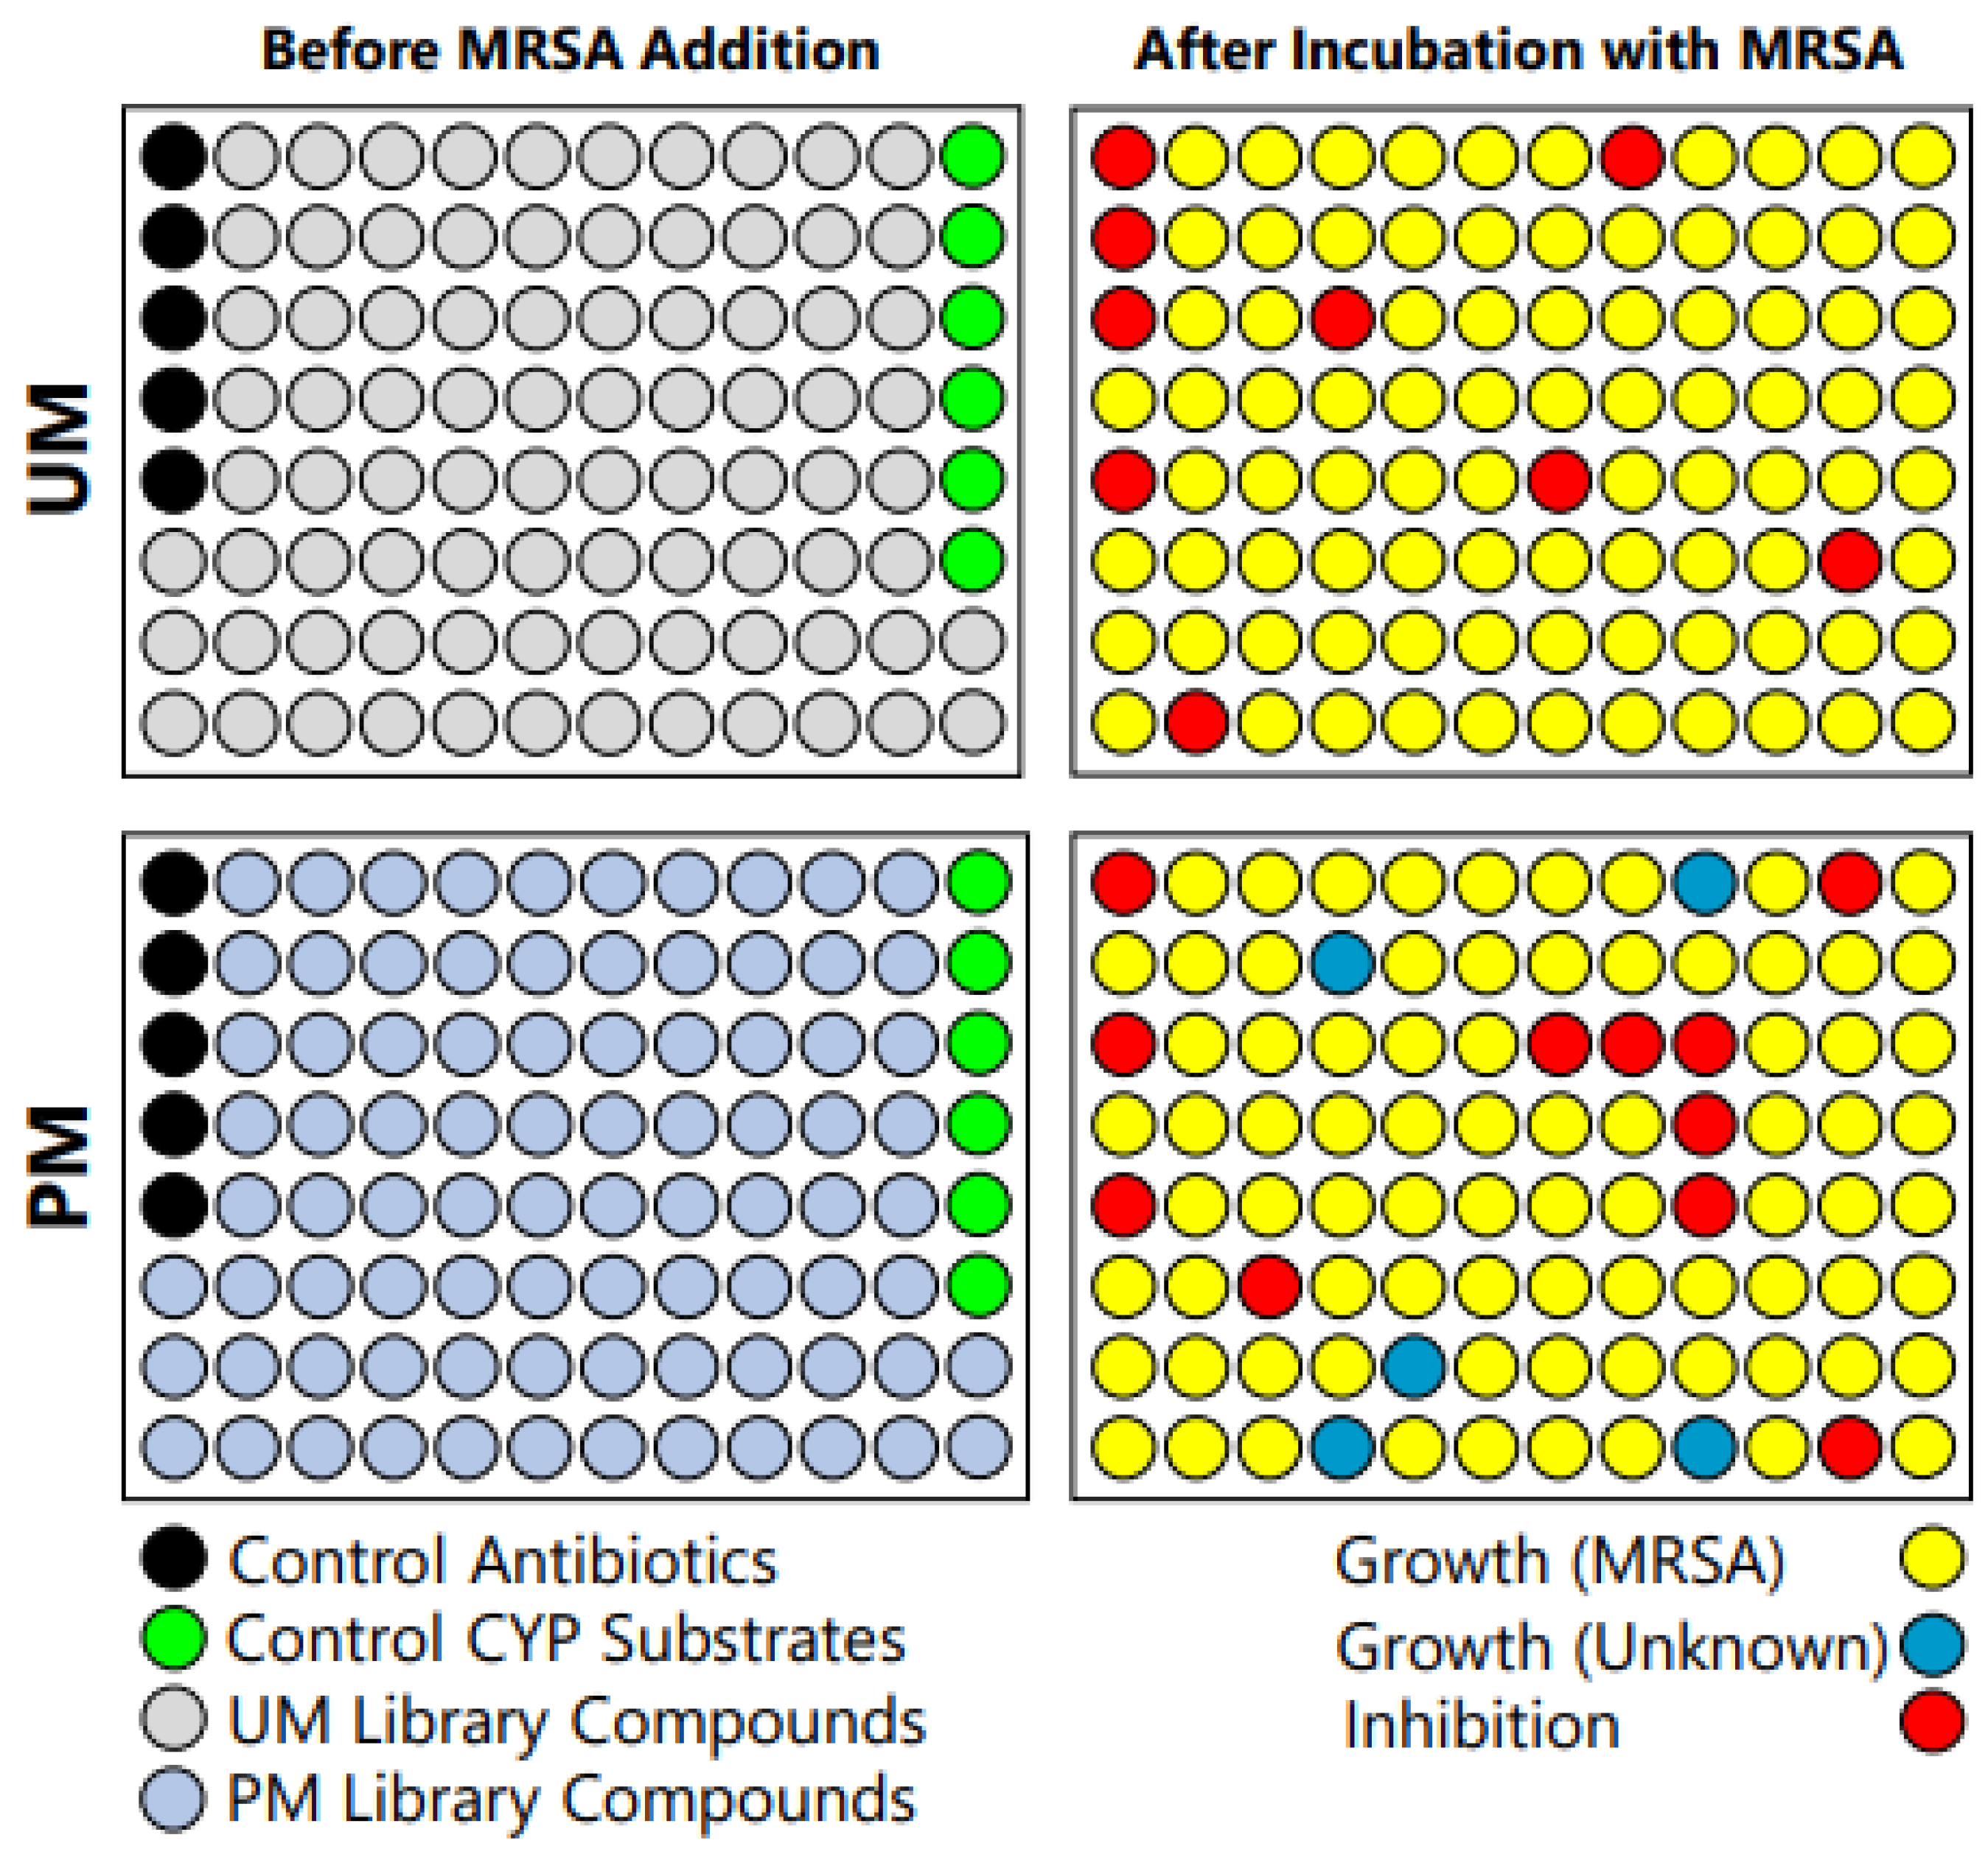
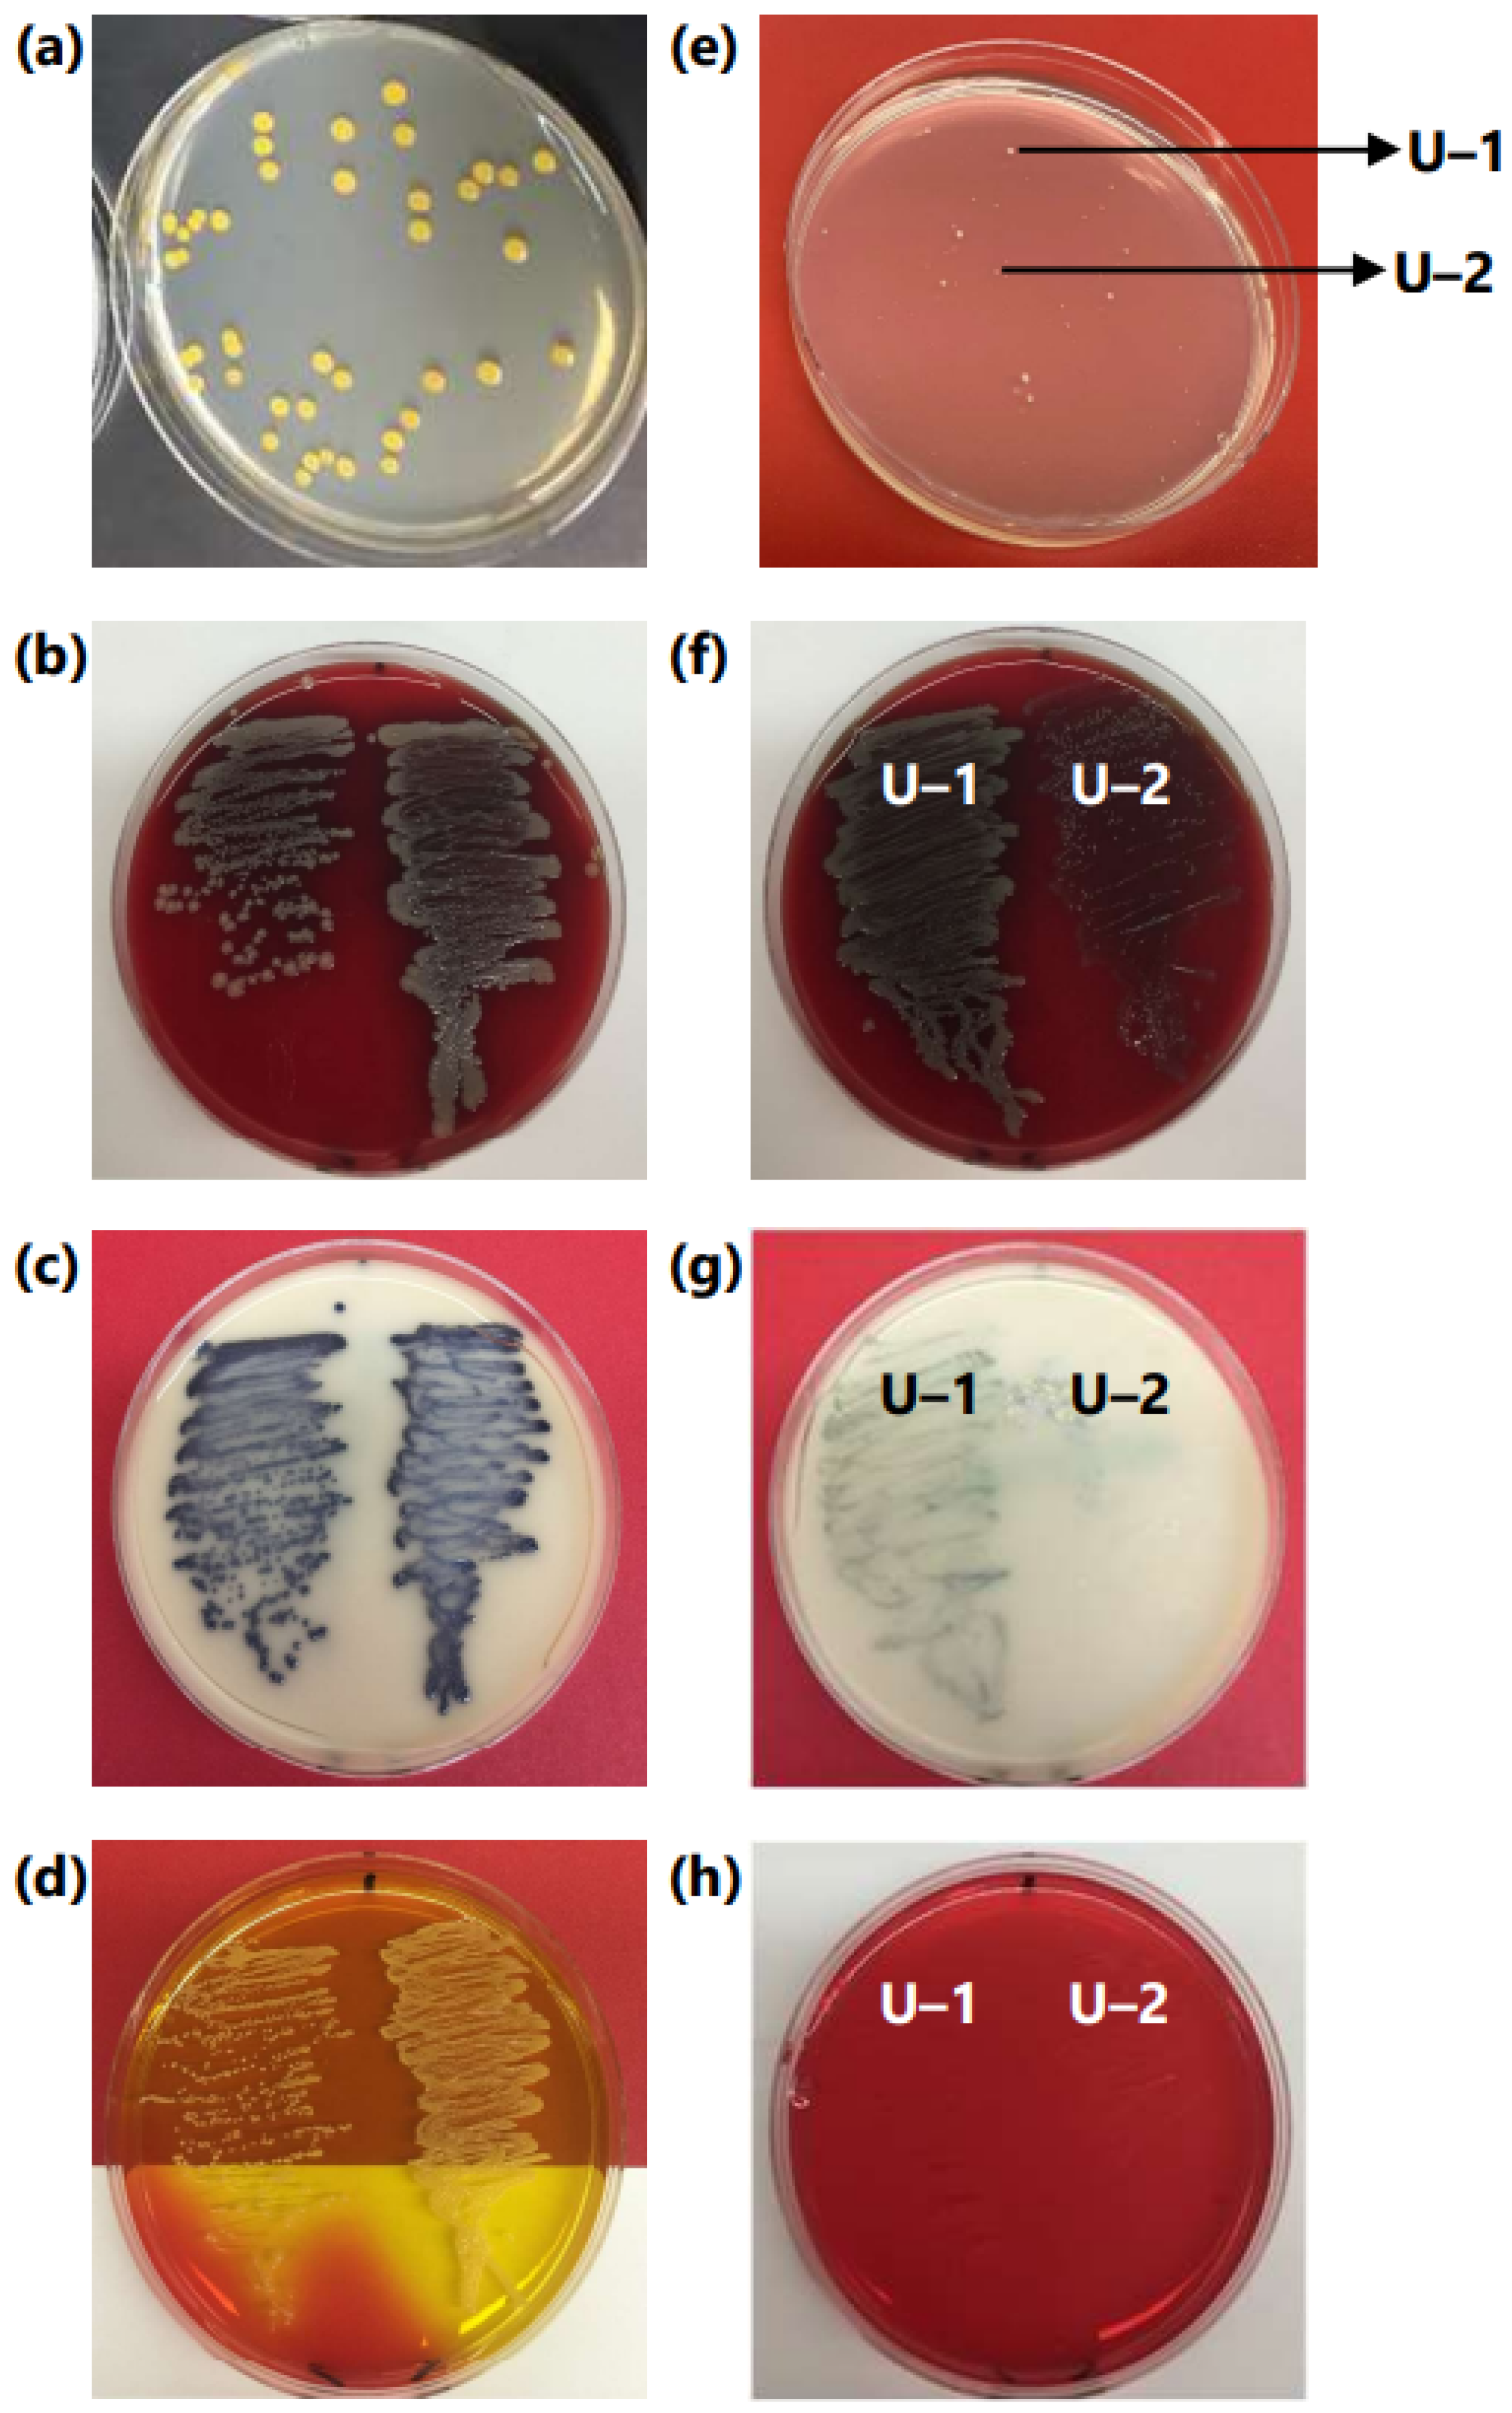
3.1. Initial Observation of Contamination in PM Library Plates

In our first set of screenings, we observed different types of turbidity in wells only in the PM library plates (depicted in Figure 4).
The control antibiotics panel, consisting of vancomycin, ampicillin, doxycycline, and chloramphenicol showed activity; however, the z-score [46] was below 0.5 and the separation between the control antibiotics (known actives) and the control CYP substrates (known inactives) was small [47] (data not shown).

3.2. Assessment of MRSA and Microsome Stock

Examination of our MRSA stock showed circular, convex, and golden-yellow-colored colonies on the CAMH agar plate (Figure 5a).
On the contrary, microsome stocks exhibited the presence of two different types of colonies, both of which were visually different from the MRSA stock (Figure 5e). MRSA stocks exhibited what appeared to be β–hemolysis in SBA plates, represented by breakdown of the hemoglobin of the red blood cells (Figure 5b) in the vicinity of a bacterial colony, which is characteristic of some strains of MRSA [48]. MRSA stocks also exhibited blue denim-colored colonies on Spectra MRSA plates (Figure 5c) and a change in color of the MSA plates from red to yellow (Figure 5d), both of which are characteristic and selective patterns for MRSA growth [49,50]. The results from these non-selective and selective plates confirmed the integrity and quality of the MRSA stock used in the screening. The two unknown microsomal contaminants were labeled as U–1 and U–2, and on SBA plates they exhibited β– and α–hemolysis [48], respectively (Figure 5f). Both U–1 and U–2 showed negative results on Spectra MRSA (Figure 5g) and MSA (Figure 5h) plates, confirming that the two unknown organisms were not MRSA [49,50]. Gram staining confirmed U–1 and U–2 to be gram-negative bacteria, as they appeared pink, along with the control Escherichia coli, whereas gram-positive bacteria (MRSA) appeared violet [32,51] (data not shown). Catalase testing was negative for U–1 and positive for U–2 (Figure S1).

3.3. MALDI-TOF/TOF Identification of Contaminant Bacteria from Microsomes

Identification without organic extraction resulted in poor identification, with a low BioTyper ID score. Organic extraction with ethanol yielded better results, with an excellent BioTyper ID score, as listed in Table 2, whereas an ID score between 2.300 and 3.000 indicated a secure genus and highly probable species identification.
Escherichia coli was used as a control and identified with a BioTyper ID score of 2.303. U–1 and U–2 were identified as Stenotrophomonas maltophilia and Chryseobacterium indolegenes, with BioTyper ID scores of 2.395 and 2.556, respectively. The ID score values were excellent, according to the reference provided by the manufacturer (Table S1), which confirmed accurate and confident identification of both contaminant bacteria present in the microsomes.

3.4. Comparison and Correlation of MALDI-TOF/TOF Data with Biochemical Testing

MALDI-TOF/TOF analysis identified U–1 as Stenotrophomonas maltophilia, which is an aerobic, motile, non-fermentative, gram-negative bacteria [52]. Previously, it was also known as Pseudomonas maltophilia and Xanthomonas maltophilia. Although aerobic, it has been reported to grow in the absence of oxygen by using nitrate as the terminal electron acceptor [53]. The bacteria were circular in shape and colorless to opaque (Figure 5e). They exhibited what appeared to be β-hemolysis on SBA plates (Figure 5f), no denim-blue characteristic pattern on Spectra MRSA plates (Figure 5g), and no change in color of phenol red on MSA agar plate (Figure 5h). Stenotrophomonas maltophilia are non-fermentative bacteria and are reported to show β-hemolysis to no hemolysis depending on the strain [52,54]. Gram staining exhibited a pink color due to entrapment of counter stain; safranin (data not shown) and catalase tests were negative (Figure S1) [52].
U–2 was identified as Chryseobacterium indologenes by MALDI-TOF/TOF analysis and is also a gram-negative bacterium. Chryseobacterium indologenes, formerly known as Flavobacterium indologenes, is anerobic, non-motile, and filamentous [55], which also explained their survival during the processing, storage, and handling of microsomes Their colonies appeared to be opaque (Figure 5e). They appeared to be non-hemolytic on SBA plates (Figure 5f), exhibited no denim-blue color on Spectra MRSA plates (Figure 5g), and did not change the color of phenol red on MSA plates (Figure 4h). Chryseobacterium indologenes is non-fermentative [56], and is reported to exhibit no hemolysis of blood cells [57], which supports the findings observed from the selective agar plates. Gram staining exhibited a pink color (data not shown) and catalase testing was positive (Figure S1) [56,57].
The observation of the biochemical tests and gram staining aligned well with the published literature [52,54,56,57] and supports the MALDI-TOF/TOF-based identification of both the contaminant bacteria present in the microsomes and their corresponding excellent BioTyper ID scores. Both Stenotrophomonas maltophilia and Chryseobacterium indologenes are gram-negative bacilli, the former is aerobic and motile, and the latter is anaerobic and non-motile. Both of these bacteria are reported to be present in soil, aqueous environment, plants, and most importantly, in catheters and endoscopes used in hospitals [55,58,59]. Although it varies with strains, both of these bacteria have the ability to form biofilms on plastic and metal surfaces, and have resistance to a variety of antibiotics and heavy metals [60,61], which might explain their presence in microsomes. As discussed earlier, the microsomes used in this study were pooled, after death, from 50 different patients of different ages, genders, and nationalities, many of whom had different underlying physical conditions, as reported on the material safety datasheet. Both of these bacteria are opportunistic nosocomial pathogens which can affect immune-compromised patients, such as the elderly, or patients with other immunological disorders [62]. Contamination of the liver microsomes might come from one infected liver or may be of a nosocomial nature. It might also be possible for contamination to occur during preparation or handling of the microsome, if aseptic conditions (e.g., sterile water, instruments etc.) were not strictly maintained. Both of these bacteria have low pathogenesis but exhibit resistance to a number of antibiotics [53,63]. Presence of unwanted microbes in microsomes can interfere with antibacterial activity screening of drug metabolites if not properly removed from the reaction mixture after the metabolism takes place.

3.5. Decontamination of Microsome

UV sterilization of the microsomes with 0–120 min of exposure did not yield much improvement in decontamination of the microsomes (Figure S2a), but degraded the library compounds, as observed, by no activity and higher minimum inhibitory concentrations of known control antibiotics. However, in the presence of selective agents, contaminant microsomal microbes disappeared within 60–120 min (Figure S2b). Pasteurization, on the contrary, offered some advantages for sterilizing the microsomes. However, it was inconvenient to warm the PM library plates on a hot water bath, primarily because it was difficult to avoid water getting inside the library plates, as exposing them directly to heat could have degraded library compounds. Additionally, a large enough water bath to sterilize the entirety of the PM library plates in a time-effective way was not feasible. Use of a panel of selective agents consisting of NaCl, cefoxitin, polymyxin B, and ketoconazole also showed removal of growths of Stenotrophomonas maltophilia and Chryseobacterium indologenes but was not cost-effective, and displayed a complex combination effect with test compounds against MRSA. However, using 100% DMSO resulted in total elimination of both contaminants from microsomes post-metabolism (Figure S3). DMSO, like many other organic solvents, has the ability to inhibit the growth of bacteria and/or kill them. Various studies suggest that a 20% DMSO solution can completely kill various gram-positive and gram-negative bacteria, including Staphylococcus aureus, Escherichia coli, Pseudomonas aeruginosa, Bacillus megaterium, Bacillus subtilis, Saccharomyces cerevisiae, Micrococcus species [64,65,66], etc. In addition, DMSO provides better long-term stability when compared to other organic solvents, while ensuring solubility of a wide variety of compounds [67].

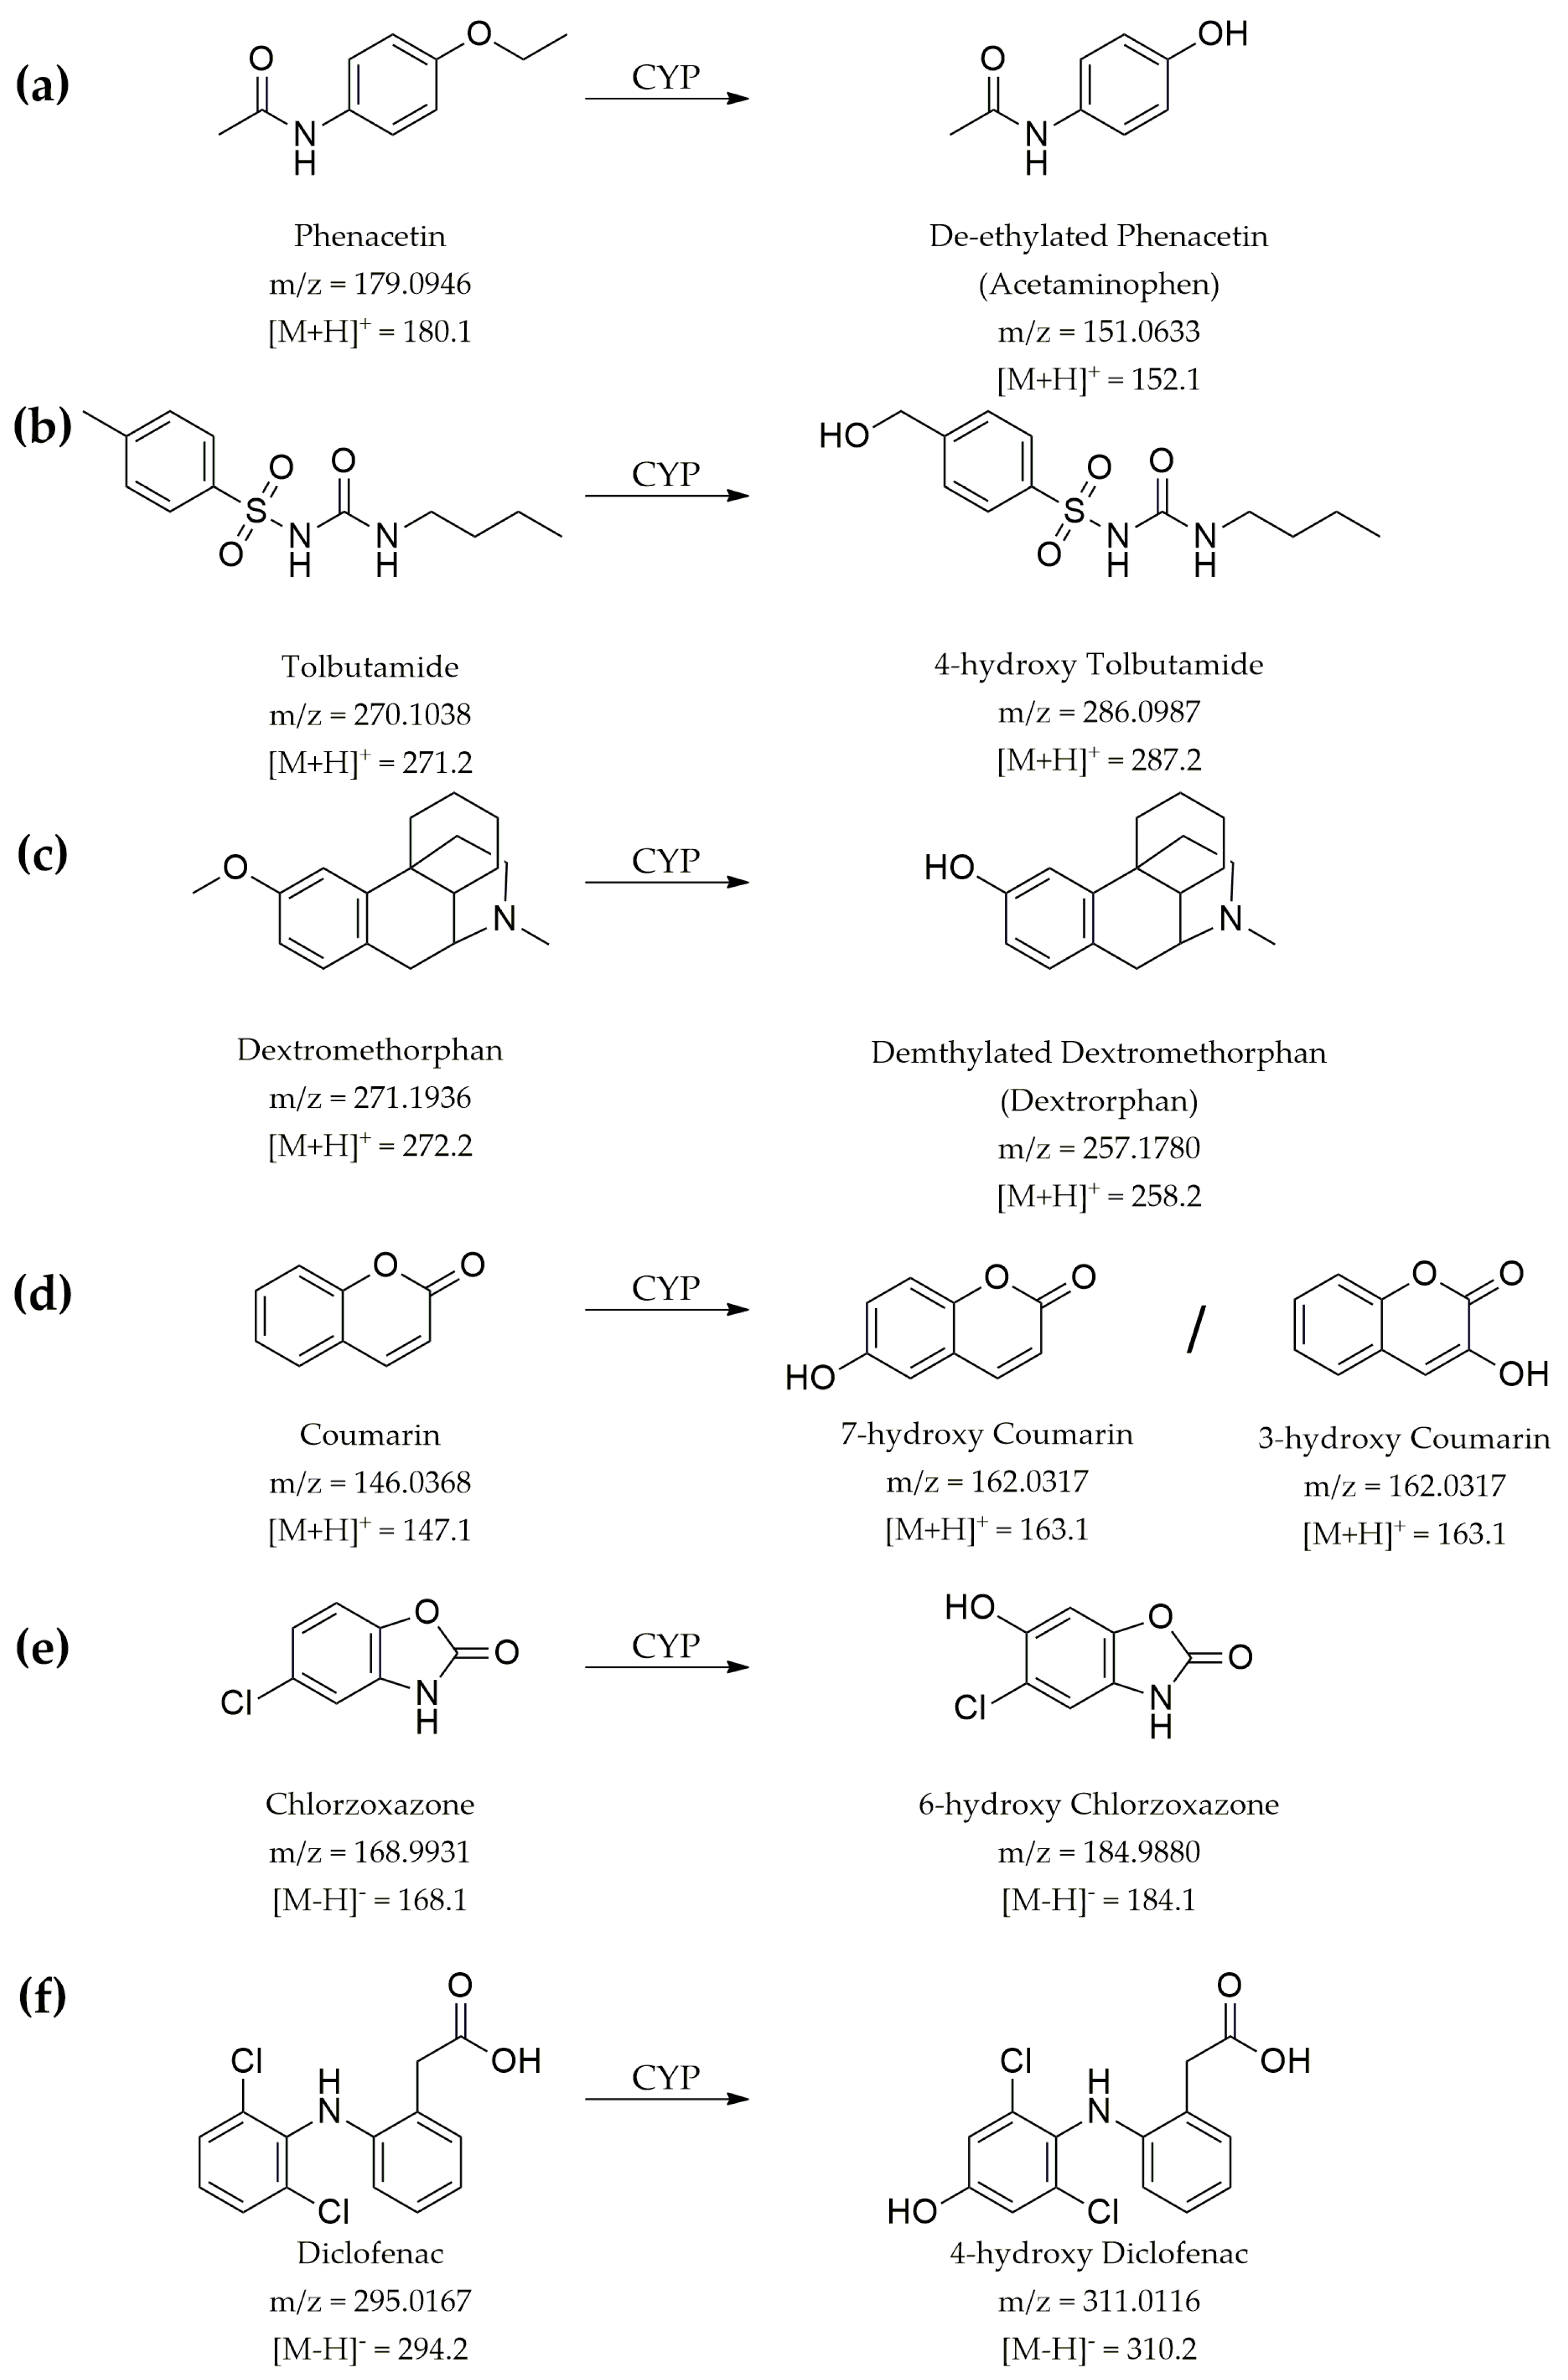
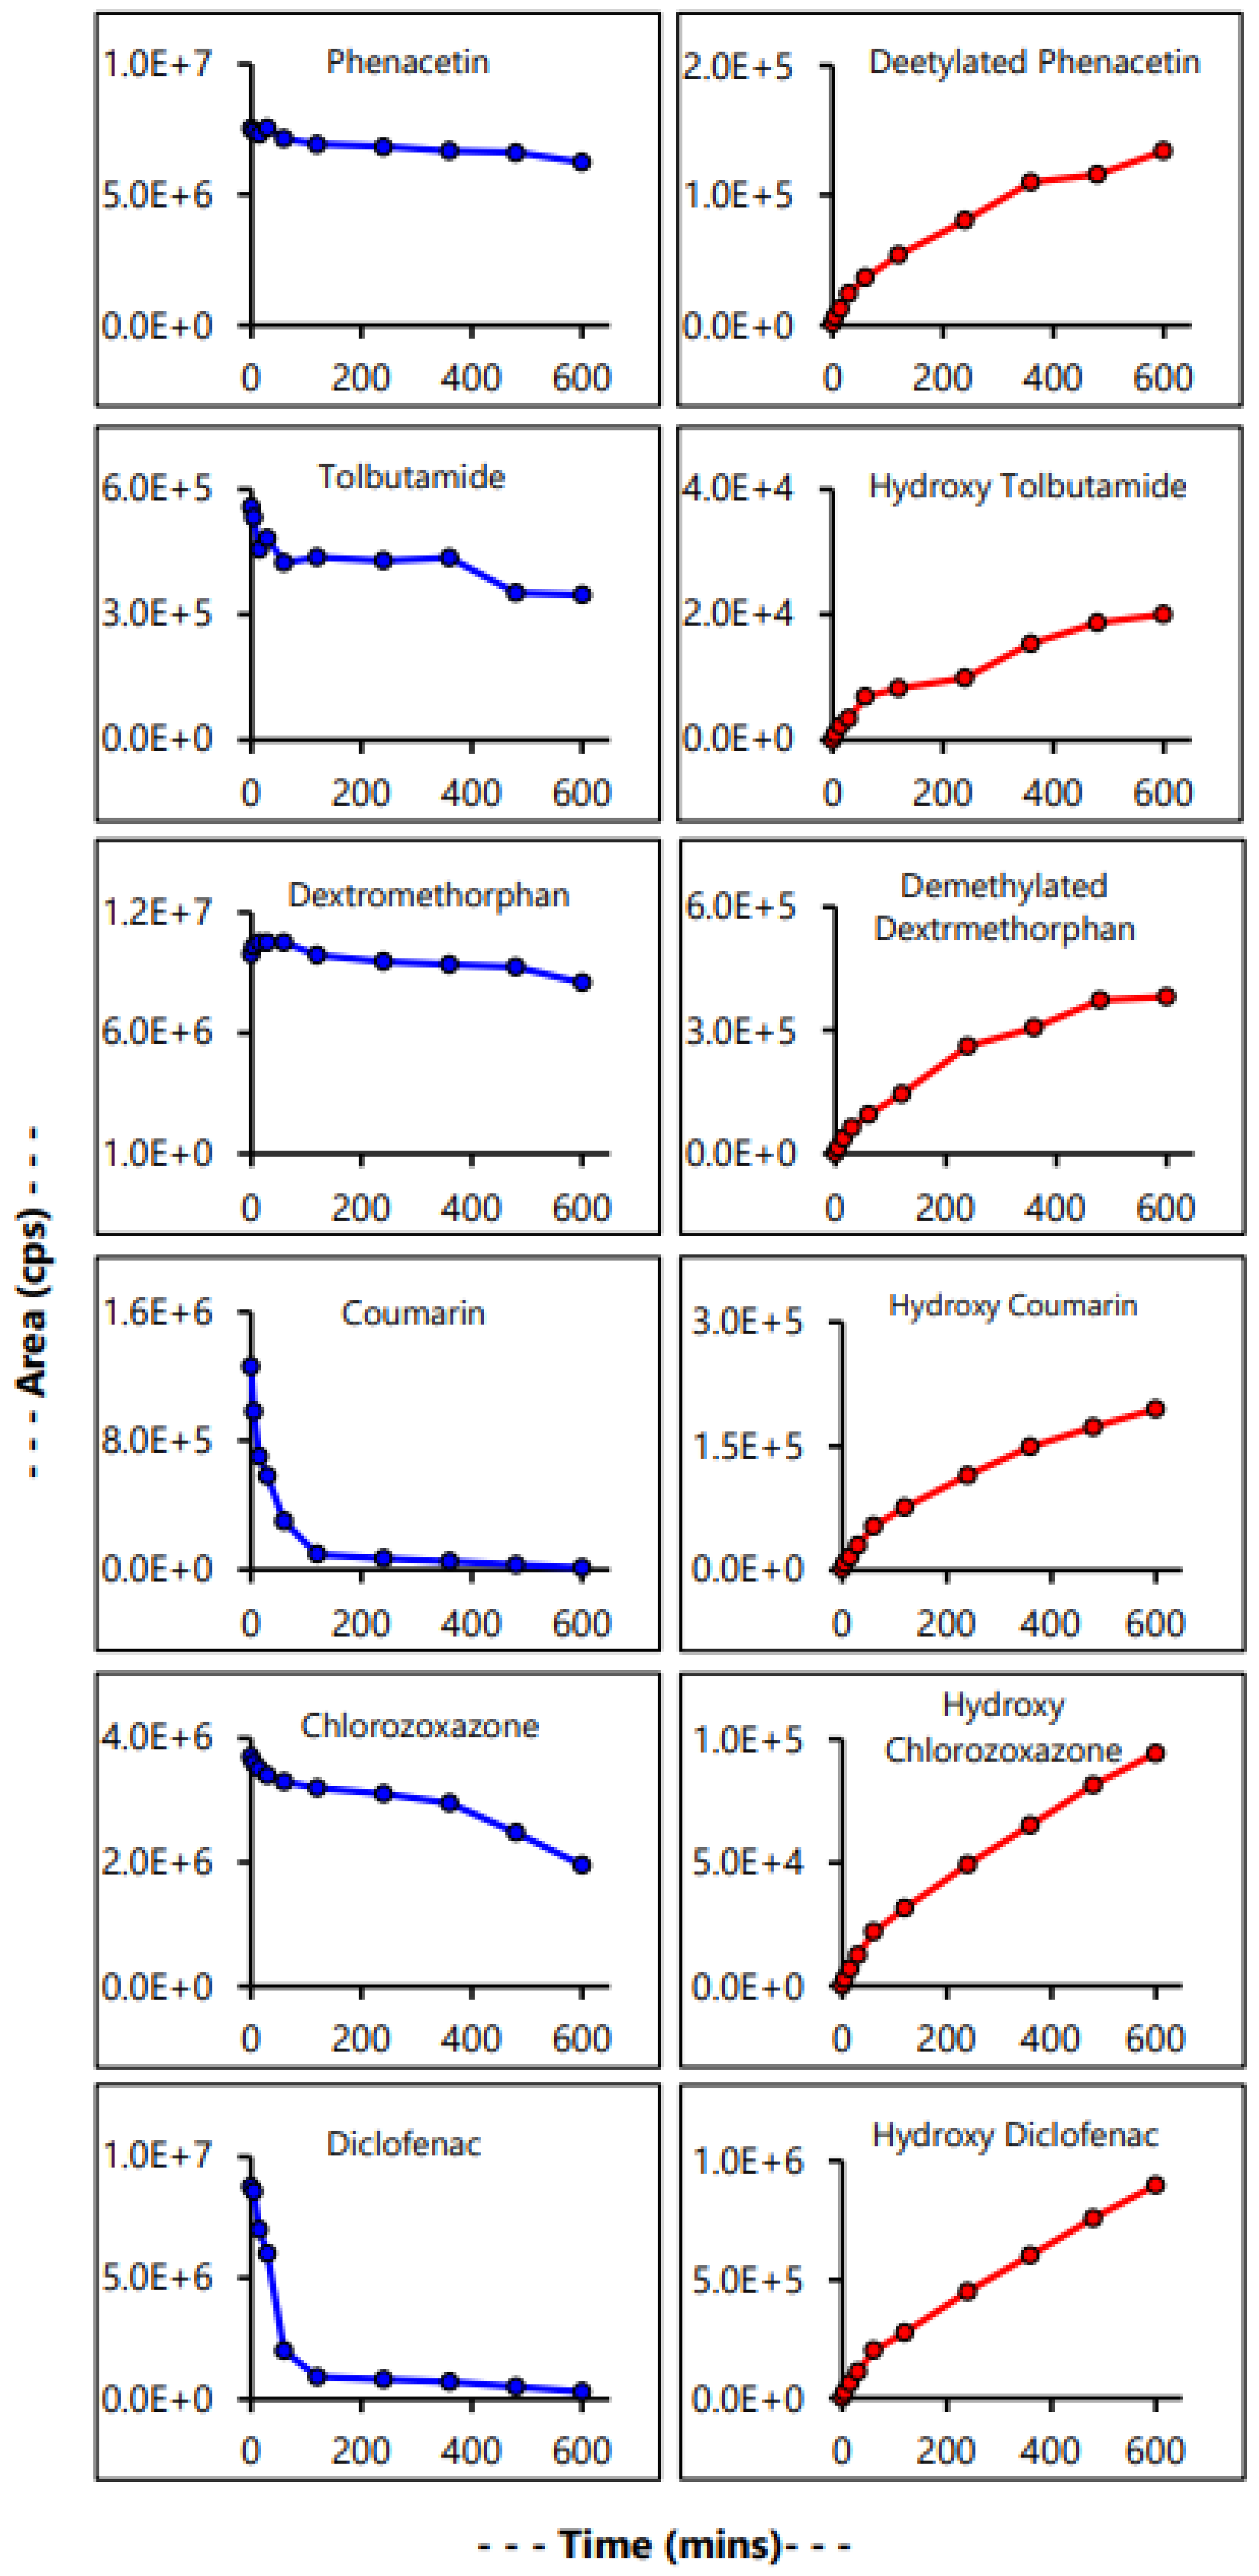
3.6. Evaluation of Microsomal Drug Metabolism

Chlorzoxazone and diclofenac showed better sensitivity in MRM-negative mode, whereas the other four control CYP substrates, phenacetin, tolbutamide, dextromethorphan, and coumarin, provided better sensitivity in MRM-positive mode. Time kinetics study, as determined by the analytical LC-MS/MS method, showed almost complete metabolism of coumarin and diclofenac within 10 h (Figure 6); however, other drugs showed a less extensive, i.e., slower, rate of metabolism. LC-MS/MS analysis also demonstrated formation of the major metabolites for each control CYP substrate (Figure 6). Percent of drug metabolized, and the rate of drug metabolism were calculated according to Equations (1) and (2), as mentioned in the method section, and are listed in Table 3.
The rate of drug metabolism observed in our in vitro metabolism system was comparable to the reported values, and indicated that extraction of the microsomal reaction of the drug library using 100% DMSO decontaminated the microsomes and did not affect the metabolism. It has been reported that organic solvent should be kept below 1% to have no effect on metabolic capacity of human liver microsomes [68], which also varies with the drug substrates, and a concentration of DMSO as low as 0.1% has been reported to show a strong effect on phenacetin metabolism using human liver microsomes [69]. Therefore, microsomal decontamination with DMSO could not be performed before the metabolism reaction was undertaken for further downstream applications.

4. Conclusions

In our drug-repurposing attempt, we also evaluated microsomes from two additional sources (Figure S4), all of which were pooled from 50+ donors and found to have the presence of microorganisms, which implies that the microbes were most probably derived from the donors’ bloodstream or their liver, and was not due to handling. Identified bacteria have very similar characteristics, such as low pathogenesis, high resistance to various antibiotics, and natural ubiquity, which can explain their presence in microsomal stock. MALDI-TOF/TOF identification correlated strongly with biochemical approaches and published literature, and exhibited the clinical application of mass spectrometry in microbial diagnosis. Out of several approaches attempted for decontaminating the microsomes without affecting their metabolic activity in a time- and cost-effective way, treatment with 100% DMSO post-metabolism provided the best results. However, it is a common practice to use an organic solvent post in vitro metabolism for further downstream application. If downstream application involves antimicrobial activity screening, then early steps need to be taken to assess the quality of the microsomes and to sterilize microsomes without affecting their metabolic capacity. Microsomal metabolic function was assessed using control CYP substrate- and LC-MS/MS-based analytical methods and exhibited 50–100% metabolism for the controls. In addition, use of 100% DMSO provided the identical condition to the original library in which the drugs were dissolved. Use of DMSO as the decontaminating agent was economical and convenient. This study demonstrates the use of traditional and mass spectrometry-based approaches to identify unknown microorganisms, as well as the use of DMSO to decontaminate microsomes without affecting their metabolic function, allowing screening of the chemical library against MRSA post-metabolism, which can be helpful for preventing new infections and the development of unknown microbial resistance.

Supplementary Materials

The following supporting information can be downloaded at: https://www.mdpi.com/article/10.3390/applmicrobiol3010009/s1, Figure S1. Results of catalase test. Figure S2. Effect of UV radiation on microsomal contaminants. Figure S3. Effect of DMSO on microsomal contaminant. Figure S4. Assessment of microsomes for other sources using CAMH-Agar solid media. Table S1. Reference table to interpret BioTyper score for microbial ID.

Funding

This research received no external funding.

Data Availability Statement

The data presented in this study are available on request from the corresponding author.

Acknowledgments

Part of this work was supported by a UMKC School of Graduate Studies Research grant to Navid Jubaer.

Conflicts of Interest

The authors declare no conflict of interest.

References

  1. Stanley, L.A. Chapter 27—Drug Metabolism. In Pharmacognosy; Badal, S., Delgoda, R., Eds.; Academic Press: Boston, MA, USA, 2017; pp. 527–545. [Google Scholar]
  2. Tillement, J.P.; Tremblay, D. 5.02—Clinical Pharmacokinetic Criteria for Drug Research. In Comprehensive Medicinal Chemistry II; Taylor, J.B., Triggle, D.J., Eds.; Elsevier: Oxford, UK, 2007; pp. 11–30. [Google Scholar]
  3. Pinto, N.; Dolan, M.E. Clinically relevant genetic variations in drug metabolizing enzymes. Curr. Drug Metab. 2011, 12, 487–497. [Google Scholar] [CrossRef] [PubMed] [Green Version]
  4. Prescott, L.F.; Forrest, J.A.; Adjepon-Yamoah, K.K.; Finlayson, N.D. Drug metabolism in liver disease. J. Clin. Pathol. Suppl. (R. Coll. Pathol.) 1975, 9, 62–65. [Google Scholar] [CrossRef] [PubMed] [Green Version]
  5. Paintaud, G.; Bechtel, Y.; Brientini, M.P.; Miguet, J.P.; Bechtel, P.R. Effects of liver diseases on drug metabolism. Therapie 1996, 51, 384–389. [Google Scholar] [PubMed]
  6. Rautio, J.; Meanwell, N.A.; Di, L.; Hageman, M.J. The expanding role of prodrugs in contemporary drug design and development. Nat. Rev. Drug Discov. 2018, 17, 559–587. [Google Scholar] [CrossRef] [PubMed]
  7. Liu, X.; Wang, H.; Liang, X.; Roberts, M.S. Chapter 30—Hepatic Metabolism in Liver Health and Disease. In Liver Pathophysiology; Muriel, P., Ed.; Academic Press: Boston, MA, USA, 2017; pp. 391–400. [Google Scholar]
  8. Almazroo, O.A.; Miah, M.K.; Venkataramanan, R. Drug Metabolism in the Liver. Clin. Liver Dis. 2017, 21, 1–20. [Google Scholar] [CrossRef]
  9. Ilowite, N.T.; Laxer, R.M. Chapter 6—Pharmacology and Drug Therapy. In Textbook of Pediatric Rheumatology, 6th ed.; Cassidy, J.T., Laxer, R.M., Petty, R.E., Lindsley, C.B., Eds.; W.B. Saunders: Philadelphia, PA, USA, 2011; pp. 71–126. [Google Scholar]
  10. Jia, L.; Liu, X. The conduct of drug metabolism studies considered good practice (II): In vitro experiments. Curr. Drug Metab. 2007, 8, 822–829. [Google Scholar] [CrossRef] [Green Version]
  11. Gómez-Lechón, M.J.; Castell, J.V.; Donato, M.T. Hepatocytes—The choice to investigate drug metabolism and toxicity in man: In vitro variability as a reflection of in vivo. Chem. Biol. Interact. 2007, 168, 30–50. [Google Scholar] [CrossRef]
  12. Gasser, R. Importance of Drug Metabolism in Drug Discovery and Development. In Molecular and Applied Aspects of Oxidative Drug Metabolizing Enzymes; Arinç, E., Schenkman, J.B., Hodgson, E., Eds.; Springer: Boston, MA, USA, 1999; pp. 183–193. [Google Scholar]
  13. Gibson, G.G.; Skett, P. Pathways of drug metabolism. In Introduction to Drug Metabolism; Gibson, G.G., Skett, P., Eds.; Springer: Boston, MA, USA, 1994; pp. 1–34. [Google Scholar]
  14. Zhang, Z.; Tang, W. Drug metabolism in drug discovery and development. Acta Pharm. Sin. B 2018, 8, 721–732. [Google Scholar] [CrossRef]
  15. Medina-Franco, J.L.; Yoo, J.; Dueñas-González, A. Chapter 13—DNA Methyltransferase Inhibitors for Cancer Therapy. In Epigenetic Technological Applications; Zheng, Y.G., Ed.; Academic Press: Boston, MA, USA, 2015; pp. 265–290. [Google Scholar]
  16. Pushpakom, S.; Iorio, F.; Eyers, P.A.; Escott, K.J.; Hopper, S.; Wells, A.; Doig, A.; Guilliams, T.; Latimer, J.; McNamee, C.; et al. Drug repurposing: Progress, challenges and recommendations. Nat. Rev. Drug Discov. 2019, 18, 41–58. [Google Scholar] [CrossRef]
  17. Kumar, A.P.; Lukman, S.; Nguyen, M.N. Drug Repurposing and Multi-Target Therapies. In Encyclopedia of Bioinformatics and Computational Biology; Ranganathan, S., Gribskov, M., Nakai, K., Schönbach, C., Eds.; Academic Press: Oxford, UK, 2019; pp. 780–791. [Google Scholar]
  18. Roy, A.; Chaguturu, R. Chapter 3—Holistic Drug Targeting. In Innovative Approaches in Drug Discovery; Patwardhan, B., Chaguturu, R., Eds.; Academic Press: Boston, MA, USA, 2017; pp. 65–88. [Google Scholar]
  19. Demkow, U. Chapter 11—Next Generation Sequencing in Pharmacogenomics. In Clinical Applications for Next-Generation Sequencing; Demkow, U., Płoski, R., Eds.; Academic Press: Boston, MA, USA, 2016; pp. 217–240. [Google Scholar]
  20. Osakwe, O.; Rizvi, S.A.A. Introduction. In Social Aspects of Drug Discovery, Development and Commercialization; Osakwe, O., Rizvi, S.A.A., Eds.; Academic Press: Boston, MA, USA, 2016; pp. xvii–xxx. [Google Scholar]
  21. Ayon, N.J.; Gutheil, W.G. Dimensionally Enhanced Antibacterial Library Screening. ACS Chem. Biol. 2019, 14, 2887–2894. [Google Scholar] [CrossRef]
  22. Ayon, N.J.; Gutheil, W.G. Correction to “Dimensionally Enhanced Antibacterial Library Screening”. ACS Chem. Biol. 2021, 16, 1610–1611. [Google Scholar] [CrossRef]
  23. Knights, K.M.; Stresser, D.M.; Miners, J.O.; Crespi, C.L. In Vitro Drug Metabolism Using Liver Microsomes. Curr. Protoc. Pharmacol. 2016, 74, 7.8.1–7.8.24. [Google Scholar] [CrossRef] [PubMed]
  24. Plongla, R.; Miller, M.B. Chapter 12—Molecular Testing for Diseases Associated with Bacterial Infections. In Diagnostic Molecular Pathology; Coleman, W.B., Tsongalis, G.J., Eds.; Academic Press: Cambridge, MA, USA, 2017; pp. 139–150. [Google Scholar]
  25. Patel, R. MALDI-TOF MS for the Diagnosis of Infectious Diseases. Clin. Chem. 2015, 61, 100–111. [Google Scholar] [CrossRef] [Green Version]
  26. McElvania Tekippe, E.; Shuey, S.; Winkler, D.W.; Butler, M.A.; Burnham, C.A. Optimizing identification of clinically relevant Gram-positive organisms by use of the Bruker Biotyper matrix-assisted laser desorption ionization-time of flight mass spectrometry system. J. Clin. Microbiol. 2013, 51, 1421–1427. [Google Scholar] [CrossRef] [Green Version]
  27. Westblade, L.F.; Jennemann, R.; Branda, J.A.; Bythrow, M.; Ferraro, M.J.; Garner, O.B.; Ginocchio, C.C.; Lewinski, M.A.; Manji, R.; Mochon, A.B.; et al. Multicenter study evaluating the Vitek MS system for identification of medically important yeasts. J. Clin. Microbiol. 2013, 51, 2267–2272. [Google Scholar] [CrossRef] [PubMed] [Green Version]
  28. Singhal, N.; Kumar, M.; Kanaujia, P.K.; Virdi, J.S. MALDI-TOF mass spectrometry: An emerging technology for microbial identification and diagnosis. Front. Microbiol. 2015, 6, 791. [Google Scholar] [CrossRef] [PubMed] [Green Version]
  29. Schubert, S.; Weinert, K.; Wagner, C.; Gunzl, B.; Wieser, A.; Maier, T.; Kostrzewa, M. Novel, improved sample preparation for rapid, direct identification from positive blood cultures using matrix-assisted laser desorption/ionization time-of-flight (MALDI-TOF) mass spectrometry. J. Mol. Diagn. 2011, 13, 701–706. [Google Scholar] [CrossRef] [PubMed]
  30. Ayon, N.J. Metabolomics and Chemical Library Screening for Antibacterial Drug Discovery. Ph.D. Thesis, University of Missouri, Kansas City, MA, USA, 2020. [Google Scholar]
  31. Smith, A.C.; Hussey, M.A. Gram Stain Protocol. Am. Soc. Microbiol. 2005, 1, 1–9. [Google Scholar]
  32. McClelland, R. Gram’s stain: The key to microbiology. MLO Med. Lab Obs. 2001, 33, 20–22, 25–28, quiz 30-21. [Google Scholar]
  33. Reiner, K. Catalase Test Protocol. Am. Soc. Microbiol. 2010. [Google Scholar]
  34. Schmitt, B.H.; Cunningham, S.A.; Dailey, A.L.; Gustafson, D.R.; Patel, R. Identification of anaerobic bacteria by Bruker Biotyper matrix-assisted laser desorption ionization-time of flight mass spectrometry with on-plate formic acid preparation. J. Clin. Microbiol. 2013, 51, 782–786. [Google Scholar] [CrossRef] [Green Version]
  35. Schulthess, B.; Bloemberg, G.V.; Zbinden, R.; Bottger, E.C.; Hombach, M. Evaluation of the Bruker MALDI Biotyper for identification of Gram-positive rods: Development of a diagnostic algorithm for the clinical laboratory. J. Clin. Microbiol. 2014, 52, 1089–1097. [Google Scholar] [CrossRef] [Green Version]
  36. Schulthess, B.; Bloemberg, G.V.; Zbinden, A.; Mouttet, F.; Zbinden, R.; Böttger, E.C.; Hombach, M. Evaluation of the Bruker MALDI Biotyper for Identification of Fastidious Gram-Negative Rods. J. Clin. Microbiol. 2016, 54, 543. [Google Scholar] [CrossRef] [PubMed]
  37. Hsueh, P.R.; Lee, T.F.; Du, S.H.; Teng, S.H.; Liao, C.H.; Sheng, W.H.; Teng, L.J. Bruker biotyper matrix-assisted laser desorption ionization-time of flight mass spectrometry system for identification of Nocardia, Rhodococcus, Kocuria, Gordonia, Tsukamurella, and Listeria species. J. Clin. Microbiol. 2014, 52, 2371–2379. [Google Scholar] [CrossRef] [PubMed] [Green Version]
  38. Katara, G.; Hemvani, N.; Chitnis, S.; Chitnis, V.; Chitnis, D.S. Surface disinfection by exposure to germicidal UV light. Indian J. Med. Microbiol. 2008, 26, 241–242. [Google Scholar] [CrossRef] [PubMed]
  39. Fellows, P.J. 11—Pasteurisation. In Food Processing Technology, 4th ed.; Fellows, P.J., Ed.; Woodhead Publishing: Soston, UK, 2017; pp. 563–580. [Google Scholar]
  40. Chapman, G.H. The Significance of Sodium Chloride in Studies of Staphylococci. J. Bacteriol. 1945, 50, 201–203. [Google Scholar] [CrossRef] [PubMed] [Green Version]
  41. Fang, H.; Hedin, G. Use of Cefoxitin-Based Selective Broth for Improved Detection of Methicillin-Resistant Staphylococcus aureus. J. Clin. Microbiol. 2006, 44, 592. [Google Scholar] [CrossRef] [Green Version]
  42. Hermsen, E.D.; Sullivan, C.J.; Rotschafer, J.C. Polymyxins: Pharmacology, pharmacokinetics, pharmacodynamics, and clinical applications. Infect. Dis. Clin. N. Am. 2003, 17, 545–562. [Google Scholar] [CrossRef]
  43. Sud, I.J.; Feingold, D.S. Action of antifungal imidazoles on Staphylococcus aureus. Antimicrob. Agents Chemother. 1982, 22, 470–474. [Google Scholar] [CrossRef] [Green Version]
  44. Ayon, N.J.; Sharma, A.D.; Gutheil, W.G. LC-MS/MS-Based Separation and Quantification of Marfey’s Reagent Derivatized Proteinogenic Amino Acid DL-Stereoisomers. J. Am. Soc. Mass. Spectrom. 2019, 30, 448–458. [Google Scholar] [CrossRef]
  45. Walsky, R.L.; Obach, R.S. Validated assays for human cytochrome P450 activities. Drug Metab. Dispos. 2004, 32, 647–660. [Google Scholar] [CrossRef] [PubMed] [Green Version]
  46. Zhang, J.H.; Chung, T.D.; Oldenburg, K.R. A Simple Statistical Parameter for Use in Evaluation and Validation of High Throughput Screening Assays. J. Biomol. Screen. 1999, 4, 67–73. [Google Scholar] [CrossRef]
  47. Roy, A. Early Probe and Drugg Discovery in Academia: A Minireview. High-Throughput 2018, 7, 4. [Google Scholar] [CrossRef] [PubMed]
  48. Buxton, R. Blood Agar Plates and Hemolysis Protocols. Am. Soc. Microbiol. 2005. [Google Scholar]
  49. Peterson, J.F.; Riebe, K.M.; Hall, G.S.; Wilson, D.; Whittier, S.; Palavecino, E.; Ledeboer, N.A. Spectra MRSA, a new chromogenic agar medium to screen for methicillin-resistant Staphylococcus aureus. J. Clin. Microbiol. 2010, 48, 215–219. [Google Scholar] [CrossRef] [Green Version]
  50. Sharp, S.E.; Searcy, C. Comparison of mannitol salt agar and blood agar plates for identification and susceptibility testing of Staphylococcus aureus in specimens from cystic fibrosis patients. J. Clin. Microbiol. 2006, 44, 4545–4546. [Google Scholar] [CrossRef] [Green Version]
  51. Bartholomew, J.W.; Mittwer, T. The Gram stain. Bacteriol. Rev. 1952, 16, 1–29. [Google Scholar] [CrossRef]
  52. Denton, M.; Kerr, K.G. Microbiological and clinical aspects of infection associated with Stenotrophomonas maltophilia. Clin. Microbiol. Rev. 1998, 11, 57–80. [Google Scholar] [CrossRef] [Green Version]
  53. Crossman, L.C.; Gould, V.C.; Dow, J.M.; Vernikos, G.S.; Okazaki, A.; Sebaihia, M.; Saunders, D.; Arrowsmith, C.; Carver, T.; Peters, N.; et al. The complete genome, comparative and functional analysis of Stenotrophomonas maltophilia reveals an organism heavily shielded by drug resistance determinants. Genome Biol. 2008, 9, R74. [Google Scholar] [CrossRef] [Green Version]
  54. Mahdi, O.; Eklund, B.; Fisher, N. Laboratory culture and maintenance of Stenotrophomonas maltophilia. Curr. Protoc. Microbiol. 2014, 32, Unit-6F.1. [Google Scholar] [CrossRef] [Green Version]
  55. Hsueh, P.R.; Teng, L.J.; Ho, S.W.; Hsieh, W.C.; Luh, K.T. Clinical and microbiological characteristics of Flavobacterium indologenes infections associated with indwelling devices. J. Clin. Microbiol. 1996, 34, 1908–1913. [Google Scholar] [CrossRef] [Green Version]
  56. Mukerji, R.; Kakarala, R.; Smith, S.J.; Kusz, H.G. Chryseobacterium indologenes: An emerging infection in the USA. BMJ Case Rep. 2016, 2016, bcr2016214486. [Google Scholar] [CrossRef] [PubMed] [Green Version]
  57. Srinivasan, G.; Muthusamy, S.; Raveendran, V.; Joseph, N.M.; Easow, J.M. Unforeseeable presentation of Chryseobacterium indologenes infection in a paediatric patient. BMC Res. Notes 2016, 9, 212. [Google Scholar] [CrossRef] [PubMed] [Green Version]
  58. Berg, G.; Roskot, N.; Smalla, K. Genotypic and phenotypic relationships between clinical and environmental isolates of Stenotrophomonas maltophilia. J. Clin. Microbiol. 1999, 37, 3594–3600. [Google Scholar] [CrossRef] [PubMed]
  59. Chang, Y.-T.; Lin, C.-Y.; Chen, Y.-H.; Hsueh, P.-R. Update on infections caused by Stenotrophomonas maltophilia with particular attention to resistance mechanisms and therapeutic options. Front. Microbiol. 2015, 6, 893. [Google Scholar] [CrossRef] [PubMed]
  60. Pompilio, A.; Piccolomini, R.; Picciani, C.; D’Antonio, D.; Savini, V.; Di Bonaventura, G. Factors associated with adherence to and biofilm formation on polystyrene by Stenotrophomonas maltophilia: The role of cell surface hydrophobicity and motility. FEMS Microbiol. Lett. 2008, 287, 41–47. [Google Scholar] [CrossRef] [Green Version]
  61. Christakis, G.B.; Perlorentzou, S.P.; Chalkiopoulou, I.; Athanasiou, A.; Legakis, N.J. Chryseobacterium indologenes Non-Catheter-Related Bacteremia in a Patient with a Solid Tumor. J. Clin. Microbiol. 2005, 43, 2021. [Google Scholar] [CrossRef] [Green Version]
  62. Schoch, P.E.; Cunha, B.A. Pseudomonas maltophilia. Infect. Control. 1987, 8, 169–173. [Google Scholar] [CrossRef]
  63. Kirby, J.T.; Sader, H.S.; Walsh, T.R.; Jones, R.N. Antimicrobial susceptibility and epidemiology of a worldwide collection of Chryseobacterium spp.: Report from the SENTRY Antimicrobial Surveillance Program (1997–2001). J. Clin. Microbiol. 2004, 42, 445–448. [Google Scholar] [CrossRef] [Green Version]
  64. Ansel, H.C.; Norred, W.P.; Roth, I.L. Antimicrobial activity of dimethyl sulfoxide against Escherichia coli, Pseudomonas aeruginosa, and Bacillus megaterium. J. Pharm. Sci. 1969, 58, 836–839. [Google Scholar] [CrossRef]
  65. Fedorka-Cray, P.J.; Cray, W.C., Jr.; Anderson, G.A.; Nickerson, K.W. Bacterial tolerance of 100% dimethyl sulfoxide. Can. J. Microbiol. 1988, 34, 688–689. [Google Scholar] [CrossRef] [PubMed]
  66. Dyrda, G.; Boniewska-Bernacka, E.; Man, D.; Barchiewicz, K.; Słota, R. The effect of organic solvents on selected microorganisms and model liposome membrane. Mol. Biol. Rep. 2019, 46, 3225–3232. [Google Scholar] [CrossRef] [PubMed] [Green Version]
  67. Cheng, X.; Hochlowski, J.; Tang, H.; Hepp, D.; Beckner, C.; Kantor, S.; Schmitt, R. Studies on Repository Compound Stability in DMSO under Various Conditions. J. Biomol. Screen. 2003, 8, 292–304. [Google Scholar] [CrossRef] [PubMed] [Green Version]
  68. Chauret, N.; Gauthier, A.; Nicoll-Griffith, D.A. Effect of common organic solvents on in vitro cytochrome P450-mediated metabolic activities in human liver microsomes. Drug Metab. Dispos. 1998, 26, 1–4. [Google Scholar] [PubMed]
  69. Nirogi, R.; Kandikere, V.; Bhyrapuneni, G.; Ponnamaneni, R.K.; Palacharla, R.; Manoharan, A. Effect of dimethyl sulfoxide on in vitro cytochrome P4501A2 mediated phenacetin O-deethylation in human liver microsomes. Drug Metab. Dispos. 2011, 39, 2162–2164. [Google Scholar] [CrossRef] [PubMed]
Figure 1. Schematics of identification of contaminating microorganisms using MALDI-TOF/TOF.
Applmicrobiol 03 00009 g001
Figure 2. Multiple reaction monitoring (MRM) chromatograms of control CYP substrates. (a) Positive mode, (b) negative mode.
Applmicrobiol 03 00009 g002
Figure 3. Microsomal (CYP-mediated) biotransformation of the control CYP substrates. Chemical structure, compound name, exact mass (m/z), observed positively ([M+H]+) or negatively ([M−H]) charged species and major metabolites for (a) Phenacetin, (b) Tolbutamide, (c) Dextromethorphan, (d) Coumarin, (e) Chlorzoxazone and (f) Diclofenac.
Applmicrobiol 03 00009 g003
Figure 4. Schematics of observation of contamination in PM library plates.
Applmicrobiol 03 00009 g004
Figure 5. Assessment of MRSA and microsome using non-selective and selective solid nutrient media. (a,e)—CAMH; (b,f)—SBA; (c,g)—Spectra MRSA; (d,h)—MSA plates for (ad): MRSA; (eh): U–1 and U–2. U—contaminant microorganisms from microsome (unknowns).
Applmicrobiol 03 00009 g005
Figure 6. Time kinetics study of control CYP substrates. Blue line indicates disappearance of parent drug, with respect to time; red line indicates formation of major drug metabolite, with respect to time.
Applmicrobiol 03 00009 g006
Table 1. Compound- and source-dependent parameters for control CYP substrate analytical method development a.
Control CYP SubstrateQ1Q3DP (V)EP (V)CEP (V)CE (V)Retention Time (min)
Phenacetin180.1110.1469.512276.59
Tolbutamide271.2172.1416.516187.19
Dextromethorphan272.2213.1617.516355.96
Coumarin147.1103.1463.013236.90
Chlorzoxazone168.1132.1−50−11.5−10−286.87
Diclofenac294.2250.1−25−7.0−14−167.75
a Global method parameters: curtain gas (CUR): 20 (arbitrary unit), collision-associated dissociation (CAD): high, source temperature (TEM): 300 °C, gas flow 1 (GS1): 50 (arbitrary unit), gas flow 2: 50 (arbitrary unit), ion spray voltage (IS): 5500 for positive mode and −4500 for negative mode, collision cell exit potential (CXP): 4 V for positive mode and −2 V for negative mode. DP—declustering potential, EP—entrance potential, CEP—collision cell entry potential, CE—collision energy, V—voltage.
Table 2. Contaminant bacteria identified from microsomes by MALDI-TOF/TOF analysis and associated BioTyper ID score.
SampleIdentified MicroorganismBioTyper ID Score
U–1 Stenotrophomonas maltophilia2.395
U–2Chryseobacterium inodologenes2.556
Control
(Bacterial Test Standard)
Escherichia coli2.303
BioTyper ID score of 2.300–3.000 indicates secure genus and highly probable species identification, (Manufacturer’s instructions: Bruker).
Table 3. Extent and rate of metabolism for the control CYP substrates.
Control CYP Substrate% MetabolizedRate (pmol/mg/min) per µM of Substrate
Phenacetin65.98%6.4
Tolbutamide51.55%4.2
Dextromethorphan54.59%2.6
Coumarin100%6.7
Chlorzoxazone60.05%2.9
Diclofenac95.42%25.9
Disclaimer/Publisher’s Note: The statements, opinions and data contained in all publications are solely those of the individual author(s) and contributor(s) and not of MDPI and/or the editor(s). MDPI and/or the editor(s) disclaim responsibility for any injury to people or property resulting from any ideas, methods, instructions or products referred to in the content.

