Article

Enhanced Anti-Melanogenic Effect of Adlay Bran Fermented with Lactobacillus brevis MJM60390

1
Interdisciplinary Program of Biomodulation, Myongji University, Yongin 17058, Korea
2
Natural Product Research Team, Biocenter, Gyeonggido Business and Science Accelerator, Suwon 16229, Korea
3
Myongji Bioefficacy Research Center, Myongji University, Yongin 17058, Korea
*
Author to whom correspondence should be addressed.
These authors contributed equally to this work.
Appl. Microbiol. 2022, 2(3), 502-515; https://doi.org/10.3390/applmicrobiol2030039
Submission received: 23 June 2022 / Revised: 19 July 2022 / Accepted: 19 July 2022 / Published: 20 July 2022

Abstract

:
Fermentation is a traditional technique used to increase nutrients, flavonoids, vitamins, minerals, and the flavor of raw materials. In this study, adlay bran was fermented by Lactobacillus brevis MJM60390 (FAB), and the anti-melanogenic effect was investigated. The results demonstrated that FAB significantly suppressed melanin accumulation in mouse melanogenic B16F10 cells, and the activity was higher than non-fermented adlay bran (NFAB). The molecular mechanism study showed that FAB inhibited melanin synthesis by suppressing the gene expression of melanocortin 1 receptor (Mc1r), melanocyte-inducing transcription factor (Mitf), tyrosinase (Tyr), tyrosinase-related protein-1 (Trp-1), and tyrosinase-related protein-2 (Trp-2) genes. Western blotting analysis showed that FAB strongly decreased the expression of Tyr, Trp-1, and Trp-2 compared to NFAB. Furthermore, phenolic compounds such as gallic acid, p-coumaric acid, ferulic acid, and sinapic acid, which are known for their anti-melanogenic effects, were significantly increased in FAB compared with NFAB. These findings suggest that FAB holds great potential as an anti-melanogenic agent and can be used for the development of whitening cosmetics.

1. Introduction

Melanin is a pigment manufactured by melanocytes in the epidermal skin layer. It also contributes to skin color [1]. Pigmentation protects the skin from ultraviolet (UV) radiation damage and environmental pollutants [2]. However, an excessive accumulation or abnormal distribution of melanin can affect health and beauty and cause pigmentation disorders such as albinism, freckles, seborrhoeic keratoses, sun spots, post-inflammatory hyperpigmentation, and melasma [3,4,5].
Melanogenesis, the melanin synthesis process, is initiated by the action of tyrosinase, which controls the rate of L-tyrosine hydroxylation to L-3,4-dihydroxyphenylalanine (L-DOPA) and oxidizes L-DOPA to o-quinone [6]. DOPAquinone continues to transform to DOPAchrome. Then, DOPAchrome is converted to 5,6-dihydroxyindole-2-carboxylic acid (DHICA) by tyrosinase-related protein-2 (Trp-2) or DOPAchrome tautomerase, and finally, tyrosinase-related protein-1 (Trp-1) catalyze DHICA to form eumelanin [7,8,9]. UV rays, α-melanocyte-stimulating hormone (α-MSH), isobutylmethylxanthine (IBMX), and forskolin are factors that impact melanogenesis [10,11]. In α-MSH stimulating process, α-MSH firstly attaches to the melanocortin 1 receptor (Mc1r) on melanocytes and initiates signaling downstream of the Mc1r. Downstream signaling of Mc1r involves the activation of cyclic adenosine monophosphate (cAMP) and element-binding protein (CREB). A previous study reported that microphthalmia-associated transcription factor (Mitf) expression was increased by the participation of cAMP and the activation of Mitf transcription factor upregulated tyrosinase, Trp-1, and Trp-2 expression, resulting in increased melanocyte pigmentation [6]. Further, the increased generation of reactive oxygen species (ROS) by excessive UVB irradiation exposure stimulated melanocytes to synthesize more melanin [12].
Adlay (Coix, Job’s tears) has been traditionally used for skin whitening in Korea, and it has been reported to treat inflammation [13], allergies [14], microbes [15], and cancer [16]. Adlay seeds include four parts: the hull, testa, bran, and endosperm. The bran contains abundant phenolic acids and flavonoids (e.g., gallic acid, p-coumaric acid, ferulic acid, nobiletin, naringenin, tangeretin, rutin, and quercetin) [17,18], which exert numerous bioactive effects such as anti-hyperlipidemic [19], anti-cancer [20], anti-inflammatory, and antioxidant activities [21,22]. Adlay is widely planted in East Asia, including South Korea, and adlay bran is a byproduct of the adlay milling process. It was reported that adlay bran contained higher contents of phytochemical compositions than hulled and polished fractions [23]. Despite containing abundant active ingredients, adlay bran is almost used as livestock feed or compost. Thus, developing cosmetics using adlay bran is a good way to increase the value of waste material.
Fermentation has been used as a traditional method to preserve, improve nutrition and taste, and prolong the time that raw materials may be used [24,25]. Lactic acid bacteria (LAB) are major microorganisms used in the dairy, wine, fermented vegetable products, meat, and food industries [26,27]. Lactobacillus is also very important in the fermentation process to increase the bioactivity of phenolic acids and antioxidant activities [28,29]. In previous studies, rice bran fermented with Lactobacillus rhamnosus was reported to reduce melanogenesis through downregulation of Mitf [30] and reduced cytotoxicity after fermentation [31]. Adlay extracted by the supercritical fluid CO2 was reported to reduce melanin production [32]. However, there is no research on the anti-melanogenic effects of adlay bran and LAB-fermented adlay bran extracted with ethanol. Therefore, this study investigated the anti-melanogenic activity of LAB-fermented adlay bran in B16F10 cells and analyzed the phenolic compounds in adlay bran extracts.

2. Materials and Methods

2.1. Cell Culture

The B16F10 mouse melanocyte cell line was purchased from the American Type Culture Collection (Rockville, MD, USA). For the experiments, B16F10 cells (passages from 5 to 10) were used. The growth medium was Dulbecco’s modified Eagle’s medium (DMEM; Hyclone; GE Healthcare Lifesciences, Logan, UT, USA) supplemented with 10% fetal bovine serum (FBS) and penicillin (10,000 U/mL), and streptomycin (100 μg/mL). The cells were cultivated in an incubator at 37 °C with 5% CO2.

2.2. Preparation of Adlay Bran Extracts

Adlay (Coix lachrymal-jobi) bran was obtained from a local mill of Yeoncheon, the main place for the production of adlay in Korea. The adlay bran powder was mixed with water in a ratio of 20:80 (w:w) to make bran sludge and sterilized at 121 °C for 20 min.
Lactobacillus brevis MJM60390 was isolated from fermented vegetables in our previous study [33]. For seed culture, MJM60390 was inoculated to 50 mL of De Man, Rogosa, and Sharpe (MRS) broth and incubated anaerobically at 37 °C for 16 h. Then, the sterilized adlay bran sludge was inoculated with 0.1% (v/v) of the seed culture of L. brevis MJM60390 and incubated statically at 37 °C for 48 h (FAB). As a control, adlay bran sludge without inoculation of L. brevis MJM60390 (NFAB) was incubated under the same conditions.
Next, the adlay bran (fermented or non-fermented) was extracted with 70% ethanol (1:3, v/v) for 24 h at room temperature. The solid part was discarded after centrifugation (6000 rpm for 20 min), and the supernatant was filtered with Whatman filter paper No. 1, evaporated, and freeze-dried at −80 °C for 24 h. The freeze-dried extract powder from fermented (FAB) and non-fermented (NFAB) adlay bran was preserved at −20 °C until further experiments.

2.3. Cell Viability Assay

To determine the cytotoxicity of adlay bran extracts, the (3-(4,5-dimethylthiazol-2-yl)-2,5-diphenyltetrazolium bromide (MTT) assay was conducted. B16F10 cells were cultured in 96-well plates at a density of 5 × 10⁴ cells/well in a fresh, complete culture medium. Different concentrations (0.01–1000 μg/mL) of NFAB and FAB were treated in the cells and incubated for 72 h. Then, the cells were treated with 5 mg/mL of MTT (Sigma Chemical Co., St. Louis, MO, USA) (100 μg/well) for an additional 4 h. Finally, the supernatant was removed, and 200 μL of dimethylsulfoxide (DMSO) was added to dissolve the formazan crystals, the metabolite of MTT. The formazan concentration was detected by a microplate reader at 570 nm (TECAN Spectrofluor Plus, Maennedorf, Switzerland). The cell viability was determined relative to the non-treated group.

2.4. Determination of Melanin Content

B16F10 cells were seeded in 6-well plates at 5 × 10⁴ cells/mL for 24 h. After 24 h, the cells were treated with or without 100 nM α-MSH and adlay bran extracts and incubated for 72 h. Arbutin (Sigma Chemical Co., St. Louis, MO, USA) was used as the positive control. At the end of the treatment, the cultured medium and cell pellet were collected to determine the extracellular and intracellular melanin content. For intracellular melanin, after washing three times with phosphate-buffered saline (PBS), the cells were harvested with 1 N NaOH containing 10% DMSO and then heated at 60 °C for 2 h to dissolve melanin. The melanin content was measured at 405 nm using a microplate reader. The total melanin content was normalized to the concentration of total protein. The protein content was measured using a BCA kit (Thermo Scientific, Rockford, IL, USA).

2.5. Intracellular Tyrosinase Activity Assay

B16F10 cells (1 × 10⁵ cells/well) were plated in 6-well plates and incubated for 24 h. Then, the cells were treated with or without 100 nM α-MSH and arbutin or adlay bran extract at various concentrations (0.01–100 μg/mL) for another 72 h. At the end of the treatments, the cells were washed three times with PBS and lysed with radioimmunoprecipitation assay (RIPA) buffer on ice for 30 min. After that, the lysed cells were centrifuged (14,000 rpm, 10 min), and 20 μL of the supernatant was dropped into a 96-well plate and treated with 200 μL of 0.1% L-DOPA, and incubated at 37 °C for 30 min. A microplate reader was used to measure tyrosinase activity at a wavelength of 475 nm, and tyrosinase activity was normalized to the total protein concentration.

2.6. RNA Isolation and RT-qPCR

Reverse transcription-quantitative polymerase chain reaction (RT-qPCR) analysis was used to analyze the mRNA gene levels in B16F10 cells. First, total RNA was extracted from B16F10 cells using a Takara kit (TaKaRa MiniBEST Universal RNA Extraction Kit, Takara Bio Inc., Kusatsu, Shiga, Japan). cDNA was synthesized from 1 μg of total RNA using another Takara kit (PrimeScript™ RT Reagent Kit with gDNA Eraser, Takara Bio Inc.) according to the manufacturer’s guidelines. RT-qPCR was carried out with cDNA, TB Green Premix Ex Taq (Takara Bio Inc.), and primers for melanocortin 1 receptor (Mc1r), melanocyte-inducing transcription factor (Mitf), tyrosinase (Tyr), Trp-1, and Trp-2. In all assays, Mc1r, Mitf, Tyr, Trp-1, and Trp-2 cDNA, were amplified using the following program: 94 °C for 10 min; 45 repetitions of 94 °C for 15 s, 60 °C for 1 min; and finally, 95 °C for 10 s, 65 °C for 60 s, and 97 °C for 1 s. The RT-qPCR primers are shown in Table 1.

2.7. Western Blot Analysis

Mouse melanogenic B16F10 cells were cultured with 100 nM α-MSH in the presence or absence of adlay bran extracts or arbutin for 48 h. The cells were washed with cold PBS and lysed by RIPA buffer containing a 1% protease inhibitor cocktail for 30 min on ice. The lysates were centrifuged (14,000 rpm, 10 min), the supernatant was collected, and a Pierce™ BCA Protein Assay Kit was used to measure the protein concentrations. Samples containing the same amount of protein (30 μg) underwent 10% sodium dodecyl sulfate-polyacrylamide gel electrophoresis (SDS-PAGE) and were transferred to polyvinylidene fluoride (PVDF) membranes. The membranes were blocked with 3% bovine serum albumin (BSA) in Tris-buffered saline (TBS) at 4 °C for 1 h and then incubated with primary antibodies specific to Tyr (1:100, Santa Cruz, CA, USA), Trp-1 (1:1000, Abcam, Fremont, CA, USA), Trp-2 (1:2000, Abcam), and β-actin (1:1000, Abcam) at 4 °C for 16 h. The membranes were washed twice with Tris-buffered saline containing 0.1% (v/v) Tween-20 (TBS-T), once with TBS every 10 min, and incubated with horseradish peroxidase-conjugated secondary antibodies (1:10,000) for 1 h at room temperature. Then, the membranes were washed twice with TBS-T and once with TBS. The immunoreactive bands were enhanced using a chemiluminescence reagent, and membrane images were captured. Finally, the ImageJ program (NIH, Bethesda, MD, USA) was used to quantitate the protein expression. All experiments were performed in triplicate.

2.8. Analysis of Some Major Free Phenolic Compounds in Adlay Bran Extracts

To compare the change of free phenolic compounds of adlay ethanol extracts after fermentation, NFAB and FAB were dissolved at the same concentration (50 mg/mL) and applied to high-performance liquid chromatography (HPLC). Gallic acid, p-coumaric acid, ferulic acid, and sinapic acid (St. Louis, MO, USA) were dissolved in methanol at the concentration of 5, 10, 20, 50, 100 μg/mL to make the standard curves. High-performance liquid chromatography (HPLC) analysis was performed to determine some of the phenolic components in adlay bran extracts using a C18 column. The samples were separated using a mobile phase of 0.1% formic acid (solvent A) and 100% acetonitrile (solvents B) at a flow rate of 1 mL/min and detection at 280 nm. The gradient system was 5% B in 0–5 min; 5–10% B in 5–10 min; 10–20% B in 15–20 min; 20–30% B in 20–45 min; 30–50% B in 45–50 min; 50–5% B in 50–55 min; and 5% B in 55–65 min. Polytetrafluoroethylene (PTFE) membranes (0.2 μm) were used to filter the samples before injection onto the HPLC instrument. The comparison of the HPLC retention time and the UV spectra of standard compounds was used to identify gallic acid, p-coumaric acid, ferulic acid, and sinapic acid in the extracts. The concentration of the phenolic compounds in the samples was calculated based on the curves of the standard compounds.

3. Results

3.1. Effect of Adlay Bran Extracts on Melanocyte Proliferation

Before the study of the anti-melanogenic effects of adlay bran extracts, the concentration of NFAB and FAB that was safe and non-toxic to skin cells was determined. B16F10 cells were treated with different doses of adlay bran extracts, and the viability of the cells was accessed by MTT assay. Neither NFAB nor FAB were cytotoxic up to a dose of 100 μg/mL (Figure 1).

3.2. Effect of Adlay Bran Extracts on Melanin Content

The inhibitory effect of adlay bran extracts on melanogenesis was investigated by treating B16F10 cells with the samples and α-MSH for 72 h. At the end of treatment, intracellular and extracellular melanin content was determined. The images of the cell pellet and cultured media of B16F10 cells (Figure 2) demonstrated that NFAB and FAB strongly suppressed α-MSH-induced melanin accumulation in B16F10 cells. Figure 2A,B show that NFAB and FAB significantly inhibited intracellular melanin and extracellular melanin content in a dose-dependent manner compared to the α-MSH group. When compared at the same concentration, FAB showed higher suppressing activity than NFAB at the concentration of 12.5 to 50 μg/mL for extracellular melanin and at 12.5 and 50 μg/mL for intracellular melanin (Figure 2C,D).

3.3. Effect of Adlay Bran Extracts on Tyrosinase Activity

The influence of NFAB and FAB on cellular tyrosinase, the main enzyme involved in melanin synthesis, was examined in α-MSH-stimulated B16F10 cells. Under α-MSH-treated conditions, tyrosinase activity was strongly upregulated to 160.44% compared to the non-treated group. However, cellular tyrosinase activity was significantly inhibited by NFAB and FAB in a dose-dependent manner. Cellular tyrosinase was significantly decreased by 65.94% and 78.68% by NFAB and FAB at a concentration of 100 μg/mL stronger than NFAB (Figure 3A). Moreover, FAB reduced tyrosinase activity stronger than NFAB at all concentrations higher than 12.5 μg/mL, especially at 50 μg/mL (17.34%) (Figure 3B).

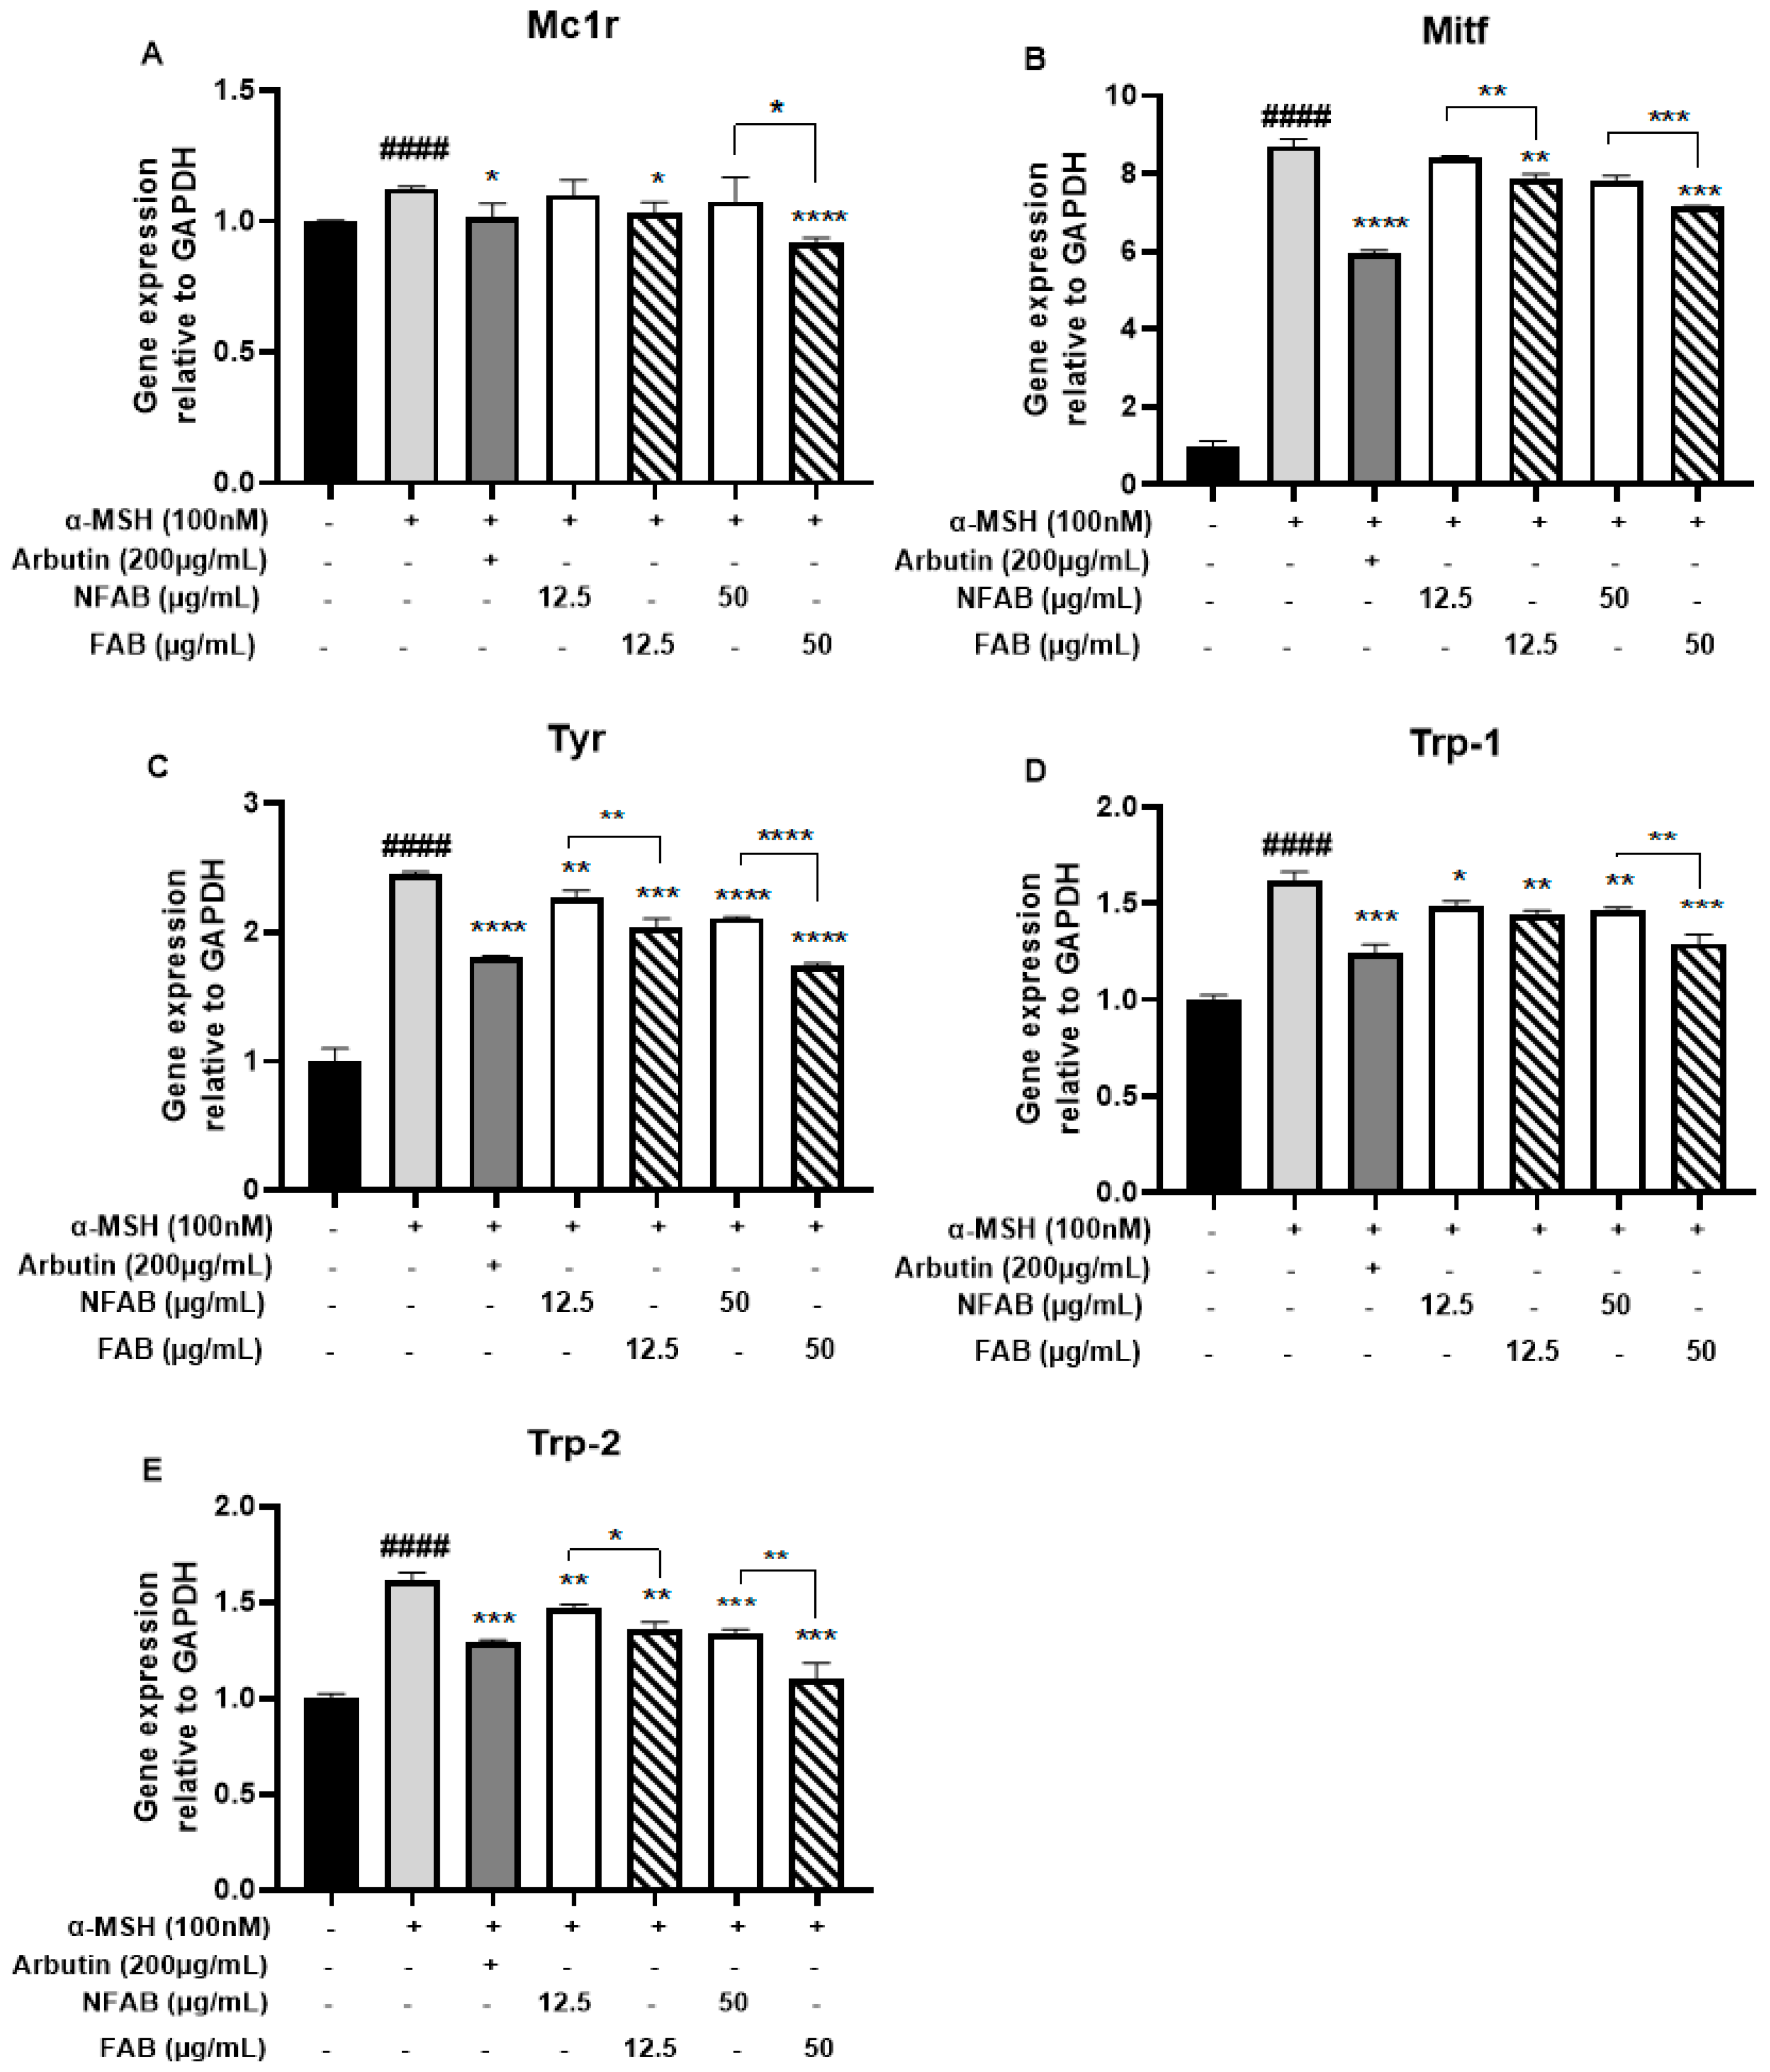
3.4. Effect of Adlay Bran Extracts on the Gene Expression of Mc1r, Mitf, Tyr, Trp-1, and Trp-2 in B16F10 Cells

Real-time qPCR was used to assess the effect of NFAB and FAB on the expression of the melanogenesis-related genes, such as Mc1r, Mitf, Tyr, Trp-1, and Trp-2. As the above results showed that FAB significantly decreased both intra- and extracellular melanin at the concentration of 12.5 and 50 μg/mL when compared to NFAB (Figure 2C,D), gene expression was only examined at the concentrations of 12.5 and 50 μg/mL for NFAB and FAB.
The results in Figure 4 showed that α-MSH upregulated the expression of Mc1r, Mitf, and Mitf downstream genes such as Tyr, Trp-1, and Trp-2. Both NFAB and FAB downregulated Mitf, Tyr, Trp-1, and Trp-2, and the effect of FAB was stronger than that of arbutin, the positive control. Further, FAB also inhibited the level of melanogenesis-related genes more strongly than NFAB, with significant effects at 50 μg/mL. In addition, only FAB significantly inhibited the Mc1r gene level, while it was not affected by NFAB.

3.5. Effect of Adlay Bran Extracts on Melanogenic Enzyme Protein Expression in B16F10 Cells

Tyr is a major protein that participates in melanogenesis. Trp-1, which converts DOPAchrome to 5,6-dihydroxyindole-2-carboxylic acid, and Trp-2, which oxidizes 5,6-dihydroxyindole-2-carboxylic acid are also very important enzymes associated with the melanogenesis. The regulatory effect of NFAB and FAB on melanin-related proteins Tyr, Trp-1, and Trp-2 was evaluated by western blot (Figure 5).
When B16F10 cells were stimulated by α-MSH, there was a significant increase in Tyr, Trp-1, and Trp-2 protein expression. However, NFAB and FAB strongly inhibited α-MSH-stimulated Tyr, Trp-1, and Trp-2 expression in B16F10 cells. When compared to the NFAB group, the FAB treatment also significantly decreased the protein levels of Tyr, Trp-1, and Trp-2. Tyr was decreased by about 3-folds at 50 μg/mL.

3.6. Changes in Phenolic Compounds in Adlay Bran Extracts after Fermentation

The concentration of some phenolic compounds in adlay ethanol extracts of the non-fermented adlay bran extract was compared to that of the extract fermented with Lactobacillus brevis MJM60390 for 48 h. Four active free phenolic compounds were identified, gallic acid, p-coumaric acid, ferulic acid, and sinapic acid (Figure 6). The concentration of all of these four components in FAB significantly increased by 1.71, 1.77, 1.86, and 1.79-folds, respectively, compared to NFAB (Table 2), indicating that fermentation enhanced the bioactive compounds of NFAB.

4. Discussion

Skin color is impacted by intrinsic factors (genetics, skin types, and stress) and extrinsic factors (sunlight exposure and environmental pollution) [3,34,35,36]. Human skin color stems from the outermost layer of the skin, where melanin is produced by melanocytes. Pigmentation of the skin produced by exposure to UV radiation can protect the skin against harmful UV damage. However, the overproduction of melanin leads to aesthetic problems, such as melasma, pigmentation of ephelides, freckles, and age spots [3,37]. Melanin is synthesized in melanosomes by melanocytes. In melanogenesis, the tyrosinase enzyme is responsible for the transformation of l-tyrosine to l-3,4-l-DOPA and l-DOPA to DOPAquinone. DOPAquinone is an intermediate that is common to the eumelanin (brown/black pigment) and pheomelanin (red/yellow pigment) synthetic pathways. During the process of eumelanin synthesis, DOPAquinone transforms to DOPAchrome and is converted to 5,6-dihydroxyindole-2-carboxylic acid (DHICA) by tyrosinase-related protein-2 or DOPAchrome tautomerase, and finally, Trp-1 catalyzed DHICA to form eumelanin [6,38]. Therefore, compounds that inhibit the effects of tyrosinase, Trp-1, and Trp-2 are important for the regulation of skin pigmentation. Further, overexposure to UVB irradiation leads to the increased generation of ROS, which can stimulate melanocytes to produce more melanin [12]. Antioxidants can be ROS scavengers. Therefore, compounds with high antioxidant activity also have the potential to become anti-melanogenic agents.
Traditional pharmacological substances, such as L-ascorbic acid, kojic acid, arbutin, corticosteroids, and hydroquinone, have been used as anti-melanogenic agents, lightening skin tone through the limited activity of tyrosinase or decreasing the number of melanocytes present [39,40]. However, almost all of these agents have drawbacks, which include cytotoxicity, instability, heat sensitivity, contact dermatitis, irritation, high toxicity, and carcinogenic potential [41,42,43]. Therefore, studies by research institutions and cosmetic companies have been conducted to develop safer alternative skin-lightening agents, such as natural compounds or plant extracts with high antioxidant activity, lower price, and more stability and effectiveness.
In this research, we reported that adlay bran extract inhibited melanogenesis and that it has potential applications as a whitening ingredient for functional cosmetics. In this study, melanin content and tyrosinase, which were significantly increased by α-MSH stimulation, were significantly inhibited by NFAB and FAB (Figure 2 and Figure 3). Tyrosinase activity in FAB treatment was remarkably reduced compared with NFAB treatment at concentrations higher than 12.5 μg/mL (Figure 3). However, at the highest concentration (100 μg/mL), melanin concentration was not significantly different between FAB and NFAB, perhaps because at this dose, the melanin content in the adlay-treated group was already lower than that in the non-treated group and had reached a minimal melanin concentration in B16F10 cells, which could not be decreased further (Figure 2).
Moreover, NFAB did not show a difference in the level of Mc1r and Mitf genes, whereas FAB inhibited Mc1r and Mitf. FAB also showed a greater downregulating effect on the expression of Tyr, Trp-1, and Trp-2 genes than NFAB (Figure 4). The protein expression of Tyr, Trp-1, and Trp-2 was also more strongly inhibited by FAB, especially Tyr protein expression at 50 μg/mL FAB (Figure 5). Altogether, these observations suggested that the anti-melanogenic effect of NFAB and FAB resulted from the inhibition of the gene levels of tyrosinase, Trp-1, and Trp-2. Further, fermentation also enhanced the anti-melanogenic effect of FAB by downregulating the protein expression of Tyr, Trp-1, and Trp-2.
There are three types of phenolic acid that exist in plants: free, soluble conjugated, and insoluble bound types. Free-form phenolic can be easily extracted, while the conjugated and bound forms of phenolic compounds need to be alkaline hydrolyzed before extraction [44]. In this study, 70% ethanol was used for extraction because a simple extraction process is very important for industrial applications. Thus, only free phenolic compounds can be extracted. HPLC analysis showed that free phenolic compounds such as gallic acid, p-coumaric acid, ferulic acid, and sinapic acid significantly increased after fermentation (Table 2). Fermentation is a biochemical process that can increase the nutritional component of plant materials by converting conjugated forms of phenolic compounds to free forms of phenolic compounds by the enzymes produced by the microorganisms. For example, aglycones increased in whole soybean flour fermented with fungus Aspergillus oryzae CCT 4359 [45], free phenolic acids were enhanced in LAB-fermented whole grain barley and oat groat [28], and the levels of aglycones, flavanols, and gallic acid increased in cheonggukjang (Korean traditional fermented soybean) which was fermented by Bacillus pumilus HY1 [46]. The increase of free form of phenolic compounds in this study may be due to the enzymatic hydrolyzation of conjugated or bound form of phenolic acids to free form by L. brevis MJM60390 during fermentation.
In our study, free phenolic compounds such as gallic acid, p-coumaric acid, ferulic acid, and sinapic acid significantly increased after fermenting with Lactobacillus brevis MJM60390 (Table 2). Those phenolic compounds have been reported for their ability to inhibit melanin synthesis [47,48,49,50,51]. Therefore, the enhancement of the phenolic compounds such as gallic acid, p-coumaric acid, ferulic acid, and sinapic acid by fermentation may be one of the reasons contributing to the greater anti-melanogenesis effect of LAB-fermented adlay bran. On the other hand, we cannot exclude the possibility that some other compounds may contribute to the increased activity since bacteria can produce many secondary metabolites during fermentation. And many of these secondary were reported to have biological functions. Further exploration should be done in future work to figure out the active compounds by purifications. In addition, the effect of the interactions between these known and unknown compounds on the anti-melanogenesis activity cannot be ignored.

5. Conclusions

In conclusion, our results demonstrated that the anti-melanogenesis effect of adlay bran was improved by the fermented process. FAB suppressed both intracellular and extracellular melanin synthesis in B16F10 melanocyte cells. FAB downregulated mRNA expression of Mc1r, Mitf, Tyr, Trp-1, and Trp-2 genes. The protein levels of tyrosinase, tyrosinase-related protein-1, and tyrosinase-related protein-2 were strongly inhibited by FAB. The increased phenolic component such as gallic acid, p-coumaric acid, ferulic acid, and sinapic acid after fermentation may contribute to the enhanced whitening effects of FAB. Based on these results, this study suggested FAB has a greater anti-melanogenesis effect than NFAB and has potential for use in whitening cosmetics.

Author Contributions

H.T.N. and M.G. designed and conducted the experiments and wrote the manuscript. Y.-H.C. and C.W.C. analyzed the chemical components. J.-W.S. and J.C. acquired funds, designed the experiments, and revised the manuscript. All authors have read and agreed to the published version of the manuscript.

Funding

This work was supported by the Korea Institute of Planning and Evaluation for Technology in Food, Agriculture and Forestry (IPET) through Technology Commercialization Support Program funded by Ministry of Agriculture, Food and Rural Affairs (MAFRA) (Grant No. 821030–3).

Institutional Review Board Statement

Not applicable.

Informed Consent Statement

Not applicable.

Data Availability Statement

The raw data used to support the findings of this study will be made available by the authors, without undue reservation, to any qualified researcher.

Conflicts of Interest

The authors declare no conflict of interest.

References

  1. Ortonne, J. Normal and abnormal skin color. In Annales de Dermatologie et de Vénéréologie; Elsevier: Amsterdam, The Netherlands, 2012; pp. S125–S129. [Google Scholar]
  2. Brenner, M.; Hearing, V.J. The protective role of melanin against UV damage in human skin. Photochem. Photobiol. 2008, 84, 539–549. [Google Scholar] [CrossRef] [PubMed] [Green Version]
  3. Costin, G.-E.; Hearing, V.J. Human skin pigmentation: Melanocytes modulate skin color in response to stress. FASEB J. 2007, 21, 976–994. [Google Scholar] [CrossRef] [PubMed]
  4. Choi, Y.-H.; Choi, C.W.; Lee, J.Y.; Ahn, E.-K.; Oh, J.S.; Hong, S.S. Phytochemical constituents of Coix lachryma-jobi var. ma-yuen roots and their tyrosinase inhibitory activity. J. Appl. Biol. Chem. 2017, 60, 49–54. [Google Scholar] [CrossRef]
  5. Braun-Falco, O.; Plewig, G.; Wolff, H.H.; Burgdorf, W.H. Disorders of Melanin Pigmentation. In Dermatology; Springer: Berlin/Heidelberg, Germany, 2000; pp. 1013–1042. [Google Scholar]
  6. Hearing, V.J. Determination of melanin synthetic pathways. J. Investig. Dermatol. 2011, 131, E8. [Google Scholar] [CrossRef] [Green Version]
  7. D’Mello, S.A.; Finlay, G.J.; Baguley, B.C.; Askarian-Amiri, M.E. Signaling pathways in melanogenesis. Int. J. Mol. Sci. 2016, 17, 1144. [Google Scholar] [CrossRef] [PubMed] [Green Version]
  8. Kondo, T.; Hearing, V.J. Update on the regulation of mammalian melanocyte function and skin pigmentation. Expert Rev. Dermatol. 2011, 6, 97–108. [Google Scholar] [CrossRef] [Green Version]
  9. Slominski, A.; Zmijewski, M.A.; Pawelek, J. L-tyrosine and L-dihydroxyphenylalanine as hormone-like regulators of melanocyte functions. Pigment Cell Melanoma Res. 2012, 25, 14–27. [Google Scholar] [CrossRef] [Green Version]
  10. Busca, R.; Ballotti, R. Cyclic AMP a key messenger in the regulation of skin pigmentation. Pigment Cell Res. 2000, 13, 60–69. [Google Scholar] [CrossRef]
  11. Slominski, A.; Wortsman, J.; Luger, T.; Paus, R.; Solomon, S. Corticotropin releasing hormone and proopiomelanocortin involvement in the cutaneous response to stress. Physiol. Rev. 2000, 80, 979–1020. [Google Scholar] [CrossRef] [Green Version]
  12. De Jager, T.; Cockrell, A.; Du Plessis, S. Ultraviolet light induced generation of reactive oxygen species. Ultrav. Light Hum. Health Dis. Environ. 2017, 996, 15–23. [Google Scholar]
  13. Otsuka, H.; Hirai, Y.; Nagao, T.; Yamasaki, K. Anti-inflammatory activity of benzoxazinoids from roots of Coix lachryma-jobi var. ma-yuen. J. Nat. Prod. 1988, 51, 74–79. [Google Scholar] [CrossRef] [PubMed]
  14. Yu, F.; Gao, J.; Zeng, Y.; Liu, C.X. Effects of adlay seed oil on blood lipids and antioxidant capacity in hyperlipidemic rats. J. Sci. Food Agric. 2011, 91, 1843–1848. [Google Scholar] [CrossRef] [PubMed]
  15. Ishiguro, Y.; Okamoto, K.; Sakamoto, H.; Sonoda, Y. Antimicrobial substances coixindens A and B in etiolated seedlings of adlay [Coix lachryma-jobi]. J. Agric. Chem. Soc. Jpn. 1993, 67, 1405–1410. [Google Scholar]
  16. Taddese, S.; Weiss, A.S.; Neubert, R.H.; Schmelzer, C.E. Mapping of macrophage elastase cleavage sites in insoluble human skin elastin. Matrix Biol. 2008, 27, 420–428. [Google Scholar] [CrossRef]
  17. Yao, H.-T.; Lin, J.-H.; Chiang, M.-T.; Chiang, W.; Luo, M.-N.; Lii, C.-K. Suppressive effect of the ethanolic extract of adlay bran on cytochrome P-450 enzymes in rat liver and lungs. J. Agric. Food Chem. 2011, 59, 4306–4314. [Google Scholar] [CrossRef]
  18. Huang, S.-H.; Ng, L.-T. Quantification of polyphenolic content and bioactive constituents of some commercial rice varieties in Taiwan. J. Food Compos. Anal. 2012, 26, 122–127. [Google Scholar] [CrossRef]
  19. Wang, L.; Sun, J.; Yi, Q.; Wang, X.; Ju, X. Protective effect of polyphenols extract of adlay (Coix lachryma-jobi L. var. ma-yuen Stapf) on hypercholesterolemia-induced oxidative stress in rats. Molecules 2012, 17, 8886–8897. [Google Scholar] [CrossRef] [Green Version]
  20. Kuo, C.-C.; Chen, H.-H.; Chiang, W. Adlay (薏苡 yì yĭ; “soft-shelled Job’s tears”; the seeds of Coix lachryma-jobi L. var. ma-yuen Stapf) is a Potential Cancer Chemopreventive Agent toward Multistage Carcinogenesis Processes. J. Tradit. Complement. Med. 2012, 2, 267–275. [Google Scholar] [CrossRef] [Green Version]
  21. Chen, H.-J.; Chung, C.-P.; Chiang, W.; Lin, Y.-L. Anti-inflammatory effects and chemical study of a flavonoid-enriched fraction from adlay bran. Food Chem. 2011, 126, 1741–1748. [Google Scholar] [CrossRef]
  22. Huang, D.-W.; Wu, C.-H.; Shih, C.-K.; Liu, C.-Y.; Shih, P.-H.; Shieh, T.-M.; Lin, C.-I.; Chiang, W.; Hsia, S.-M. Application of the solvent extraction technique to investigation of the anti-inflammatory activity of adlay bran. Food Chem. 2014, 145, 445–453. [Google Scholar] [CrossRef]
  23. Wu, T.-T.; Charles, A.L.; Huang, T.-C. Determination of the contents of the main biochemical compounds of Adlay (Coxi lachrymal-jobi). Food Chem. 2007, 104, 1509–1515. [Google Scholar] [CrossRef]
  24. Mukherjee, R.; Chakraborty, R.; Dutta, A. Role of fermentation in improving nutritional quality of soybean meal—A review. Asian Australas. J. Anim. Sci. 2016, 29, 1523. [Google Scholar] [CrossRef] [PubMed] [Green Version]
  25. Galati, A.; Oguntoyinbo, F.A.; Moschetti, G.; Crescimanno, M.; Settanni, L. The cereal market and the role of fermentation in cereal-based food production in Africa. Food Rev. Int. 2014, 30, 317–337. [Google Scholar] [CrossRef]
  26. Taskila, S.; Ojamo, H. The Current Status and Future Expectations in Industrial Production of Lactic Acid by Lactic Acid Bacteria; IntechOpen: Vienna, Austria, 2013. [Google Scholar]
  27. Rhee, S.J.; Lee, J.-E.; Lee, C.-H. Importance of Lactic Acid Bacteria in Asian Fermented Foods. In Microbial Cell Factories; BioMed Central: London, UK, 2011; pp. 1–13. [Google Scholar]
  28. Hole, A.S.; Rud, I.; Grimmer, S.; Sigl, S.; Narvhus, J.; Sahlstrøm, S. Improved bioavailability of dietary phenolic acids in whole grain barley and oat groat following fermentation with probiotic Lactobacillus acidophilus, Lactobacillus johnsonii, and Lactobacillus reuteri. J. Agric. Food Chem. 2012, 60, 6369–6375. [Google Scholar] [CrossRef] [PubMed]
  29. Ngan, N.T.; Dao, D. Investigating The Effect of Ratio Lactobacilus acidophillus to The Antioxidant of Fermented Eggplant (Solanum melongena). J. Food Nutr. Sci. 2015, 3, 140–142. [Google Scholar]
  30. Chung, S.-Y.; Seo, Y.-K.; Park, J.-M.; Seo, M.-J.; Park, J.-K.; Kim, J.-W.; Park, C.-S. Fermented rice bran downregulates MITF expression and leads to inhibition of α-MSH-induced melanogenesis in B16F1 melanoma. Biosci. Biotechnol. Biochem. 2009, 73, 1704–1710. [Google Scholar] [CrossRef]
  31. Rashid, N.; Jamaluddin, A.; Ghani, A.; Razak, D.; Jonit, J.; Mansor, A.; Manan, M. Quantification of phenolic compounds changes by Aspergillus oryzae on rice bran fermentation. Food Res. 2018, 3, 133–137. [Google Scholar] [CrossRef]
  32. Huang, H.-C.; Hsieh, W.-Y.; Niu, Y.-L.; Chang, T.-M. Inhibitory effects of adlay extract on melanin production and cellular oxygen stress in B16F10 melanoma cells. Int. J. Mol. Sci. 2014, 15, 16665–16679. [Google Scholar] [CrossRef] [Green Version]
  33. Lee, Y.; Kim, N.; Werlinger, P.; Suh, D.-A.; Lee, H.; Cho, J.-H.; Cheng, J. Probiotic Characterization of Lactobacillus brevis MJM60390 and In Vivo Assessment of Its Antihyperuricemic Activity. J. Med. Food 2022, 25, 367–380. [Google Scholar] [CrossRef]
  34. Krutmann, J.; Schikowski, T.; Morita, A.; Berneburg, M. Environmentally-induced (extrinsic) skin aging: Exposomal factors and underlying mechanisms. J. Investig. Dermatol. 2021, 141, 1096–1103. [Google Scholar] [CrossRef]
  35. Yaar, M.; Gilchrest, B.A. Skin aging: Postulated mechanisms and consequent changes in structure and function. Clin. Geriatr. Med. 2001, 17, 617–630. [Google Scholar] [CrossRef]
  36. Barsh, G.S. What controls variation in human skin color? PLoS Biol. 2003, 1, e27. [Google Scholar] [CrossRef] [PubMed] [Green Version]
  37. Choi, W.; Yin, L.; Smuda, C.; Batzer, J.; Hearing, V.J.; Kolbe, L. Molecular and histological characterization of age spots. Exp. Dermatol. 2017, 26, 242–248. [Google Scholar] [CrossRef] [Green Version]
  38. Ito, S. A chemist’s view of melanogenesis. Pigment Cell Res. 2003, 16, 230–236. [Google Scholar] [CrossRef] [Green Version]
  39. Chang, N.-F.; Chen, Y.-S.; Lin, Y.-J.; Tai, T.-H.; Chen, A.-N.; Huang, C.-H.; Lin, C.-C. Study of hydroquinone mediated cytotoxicity and hypopigmentation effects from UVB-irradiated arbutin and deoxyarbutin. Int. J. Mol. Sci. 2017, 18, 969. [Google Scholar] [CrossRef] [Green Version]
  40. Draelos, Z.D. Skin lightening preparations and the hydroquinone controversy. Dermatol. Ther. 2007, 20, 308–313. [Google Scholar] [CrossRef] [PubMed]
  41. Charlín, R.; Barcaui, C.B.; Kac, B.K.; Soares, D.B.; Rabello-Fonseca, R.; Azulay-Abulafia, L. Hydroquinone-induced exogenous ochronosis: A report of four cases and usefulness of dermoscopy. Int. J. Dermatol. 2008, 47, 19–23. [Google Scholar] [CrossRef]
  42. Spínola, V.; Mendes, B.; Câmara, J.S.; Castilho, P.C. Effect of time and temperature on vitamin C stability in horticultural extracts. UHPLC-PDA vs iodometric titration as analytical methods. LWT—Food Sci. Technol. 2013, 50, 489–495. [Google Scholar] [CrossRef]
  43. Ookubo, N.; Michiue, H.; Kitamatsu, M.; Kamamura, M.; Nishiki, T.-i.; Ohmori, I.; Matsui, H. The transdermal inhibition of melanogenesis by a cell-membrane-permeable peptide delivery system based on poly-arginine. Biomaterials 2014, 35, 4508–4516. [Google Scholar] [CrossRef]
  44. Gao, Y.; Ma, S.; Wang, M.; Feng, X.-Y. Characterization of free, conjugated, and bound phenolic acids in seven commonly consumed vegetables. Molecules 2017, 22, 1878. [Google Scholar] [CrossRef] [Green Version]
  45. Da Silva, L.H.; Celeghini, R.M.; Chang, Y.K. Effect of the fermentation of whole soybean flour on the conversion of isoflavones from glycosides to aglycones. Food Chem. 2011, 128, 640–644. [Google Scholar] [CrossRef]
  46. Cho, K.M.; Hong, S.Y.; Math, R.K.; Lee, J.H.; Kambiranda, D.M.; Kim, J.M.; Islam, S.M.A.; Yun, M.G.; Cho, J.J.; Lim, W.J. Biotransformation of phenolics (isoflavones, flavanols and phenolic acids) during the fermentation of cheonggukjang by Bacillus pumilus HY1. Food Chem. 2009, 114, 413–419. [Google Scholar] [CrossRef]
  47. Kim, Y.-J. Antimelanogenic and antioxidant properties of gallic acid. Biol. Pharm. Bull. 2007, 30, 1052–1055. [Google Scholar] [CrossRef] [Green Version]
  48. Su, T.-R.; Lin, J.-J.; Tsai, C.-C.; Huang, T.-K.; Yang, Z.-Y.; Wu, M.-O.; Zheng, Y.-Q.; Su, C.-C.; Wu, Y.-J. Inhibition of melanogenesis by gallic acid: Possible involvement of the PI3K/Akt, MEK/ERK and Wnt/β-catenin signaling pathways in B16F10 cells. Int. J. Mol. Sci. 2013, 14, 20443–20458. [Google Scholar] [CrossRef] [Green Version]
  49. Boo, Y.C. p-Coumaric acid as an active ingredient in cosmetics: A review focusing on its antimelanogenic effects. Antioxidants 2019, 8, 275. [Google Scholar] [CrossRef] [PubMed] [Green Version]
  50. Maruyama, H.; Kawakami, F.; Lwin, T.-T.; Imai, M.; Shamsa, F. Biochemical characterization of ferulic acid and caffeic acid which effectively inhibit melanin synthesis via different mechanisms in B16 melanoma cells. Biol. Pharm. Bull. 2018, 41, 806–810. [Google Scholar] [CrossRef] [Green Version]
  51. Yoon, H.S.; Lee, N.-H.; Hyun, C.-G.; Shin, D.-B. Differential effects of methoxylated p-coumaric acids on melanoma in B16/F10 cells. Prev. Nutr. Food Sci. 2015, 20, 73. [Google Scholar] [CrossRef] [Green Version]
Figure 1. Effect of adlay bran extracts on the viability of melanocytes. Viability of the murine melanoma cells following adlay bran extracts treatment. B16F10 cells were treated with 0.01 to 100 μg/mL of NFAB (A) or FAB (B), and the cell viability was measured after 72 h treatment. Results are presented as the mean ± standard deviation of triplicate independent experiments. ** p < 0.01, *** p < 0.001 compared with non-treatment group.
Applmicrobiol 02 00039 g001
Figure 2. Effects of adlay bran extract on melanin content in B16F10 cells. B16F10 cells were treated with or without α-MSH (100 nM) and adlay bran extracts (12.5–100 μg/mL) or Arbutin (200 μg/mL) for 72 h. After treatment, the intracellular melanin content (A) and extracellular melanin content (B) were measured at 405 nm. Melanin content at the same concentrations between NFAB and FAB was compared: intracellular melanin (C) and extracellular melanin (D). Results are presented as the mean ± standard deviation of triplicate independent experiments. ### p < 0.001 compared with the non-treatment group; * p < 0.05, ** p < 0.01, *** p < 0.001, **** p < 0.0001 compared with the α-MSH group (A,B) or NFAB group at same concentration (C,D).
Applmicrobiol 02 00039 g002
Figure 3. Effects of adlay bran extracts on tyrosinase activity in B16F10 cells. B16F10 cells were treated with or without α-MSH (100 nM) and adlay bran extracts (12.5–100 μg/mL) or Arbutin (200 μg/mL) for 72 h. After treatment, the tyrosinase activity (A) was measured at 475 nm. Tyrosinase activity at the same concentrations between NFAB and FAB was compared (B). Results are presented as the mean ± standard deviation of triplicate independent experiments. ### p < 0.0001 compared with the non-treatment group; * p < 0.05, ** p < 0.01, *** p < 0.001, **** p < 0.0001 compared with the α-MSH group (A) or NFAB group at same concentration (B).
Applmicrobiol 02 00039 g003
Figure 4. Effects of adlay bran extracts on mRNA expression of Mc1r, Mitf, Tyr, Trp-1, Trp-2 in B16F10 cells. B16F10 cells were treated with or without α-MSH (100 nM) and adlay bran extracts or Arbutin (200 μg/mL) for 2 h or 24 h. After treatment, the mRNA expression of Mc1r (A), Mitf (B), Tyr (C), Trp-1 (D), and Trp-2 (E) was measured and normalized to GAPDH expression. Results are presented as the mean ± standard deviation of triplicate independent experiments #### p < 0.0001 compared with the non-treatment group, * p < 0.05, ** p < 0.01, *** p < 0.001, **** p < 0.0001 compared with the α-MSH group or NFAB group at the same concentration.
Applmicrobiol 02 00039 g004
Figure 5. Effect of adlay bran extracts on melanogenic protein expression in B16F10 cells. B16F10 cells were treated with α-MSH treatment in the absence or presence of adlay bran extracts, or Arbutin (200 μg/mL) for 48 h. Protein expression was determined by western blotting (A) and protein levels of Tyrosinase/β-actin (B), Tyrosinase related Protein Trp-1/β-actin (C), Trp-2/β-actin (D) were quantified by the ImageJ program. Results are presented as the mean ± standard deviation of triplicate independent experiments #### p < 0.0001 compared with the non-treatment group, * p < 0.05, ** p < 0.01, *** p < 0.001, **** p < 0.0001 compared with the α-MSH or NFAB group at the same concentration.
Applmicrobiol 02 00039 g005
Figure 6. HPLC analysis of phenolic compounds in adlay bran extracts. The UV absorption spectrum from 200 nm to 400 nm and the linearity for each standard compound were shown in the chromatogram.
Applmicrobiol 02 00039 g006
Table 1. Sequences of primers (mouse) used in RT-qPCR.
NamePrimerSequence (5′ to 3′)
TyrForwardAAGAATGCTGCCCACCATGG
ReverseCACGGTCATCCACCCCTTTG
Trp-1ForwardCAGTGCAGCGTCTTCCTGAG
ReverseTTCCCGTGGGAGCACTGTAA
Trp-2ForwardCGTGCTGAACAAGGAATGC
ReverseCGAAGGATATAAGGGCCACTC
MitfForwardATCCCATCCACCGGTCTCTG
ReverseCCGTCCGTGAGATCCAGAGT
Mc1rForwardTCATCGTCCTCTGCCCTCAG
ReverseGCAGCACCTCCTTGAGTGTC
GapdhForwardGGTTGTCTCCTGCGACTTCA
ReverseTGGTCCAGGGTTTCTTACTCC
Table 2. Free phenolic compounds of adlay bran extracts.
Free Phenolic Compounds (mg/100 g Extract)SamplesLinearity and Linear Range for Standard
NFABFAB
Gallic acid29.81 ± 1.7751.11 ± 0.97 **** Applmicrobiol 02 00039 i001
p-Coumaric acid23.15 ± 0.3441.01 ± 0.98 **** Applmicrobiol 02 00039 i002
Ferulic acid83.37 ± 1.59155.07 ± 2.36 **** Applmicrobiol 02 00039 i003
Sinapic acid24.35 ± 1.9443.75 ± 1.76 *** Applmicrobiol 02 00039 i004
*** p < 0.001, **** p < 0.0001 compared with FAB.
Publisher’s Note: MDPI stays neutral with regard to jurisdictional claims in published maps and institutional affiliations.

