
Biospeckle Analysis and Biofilm Electrostatic Tests, Two Useful Methods in Microbiology

 , , and
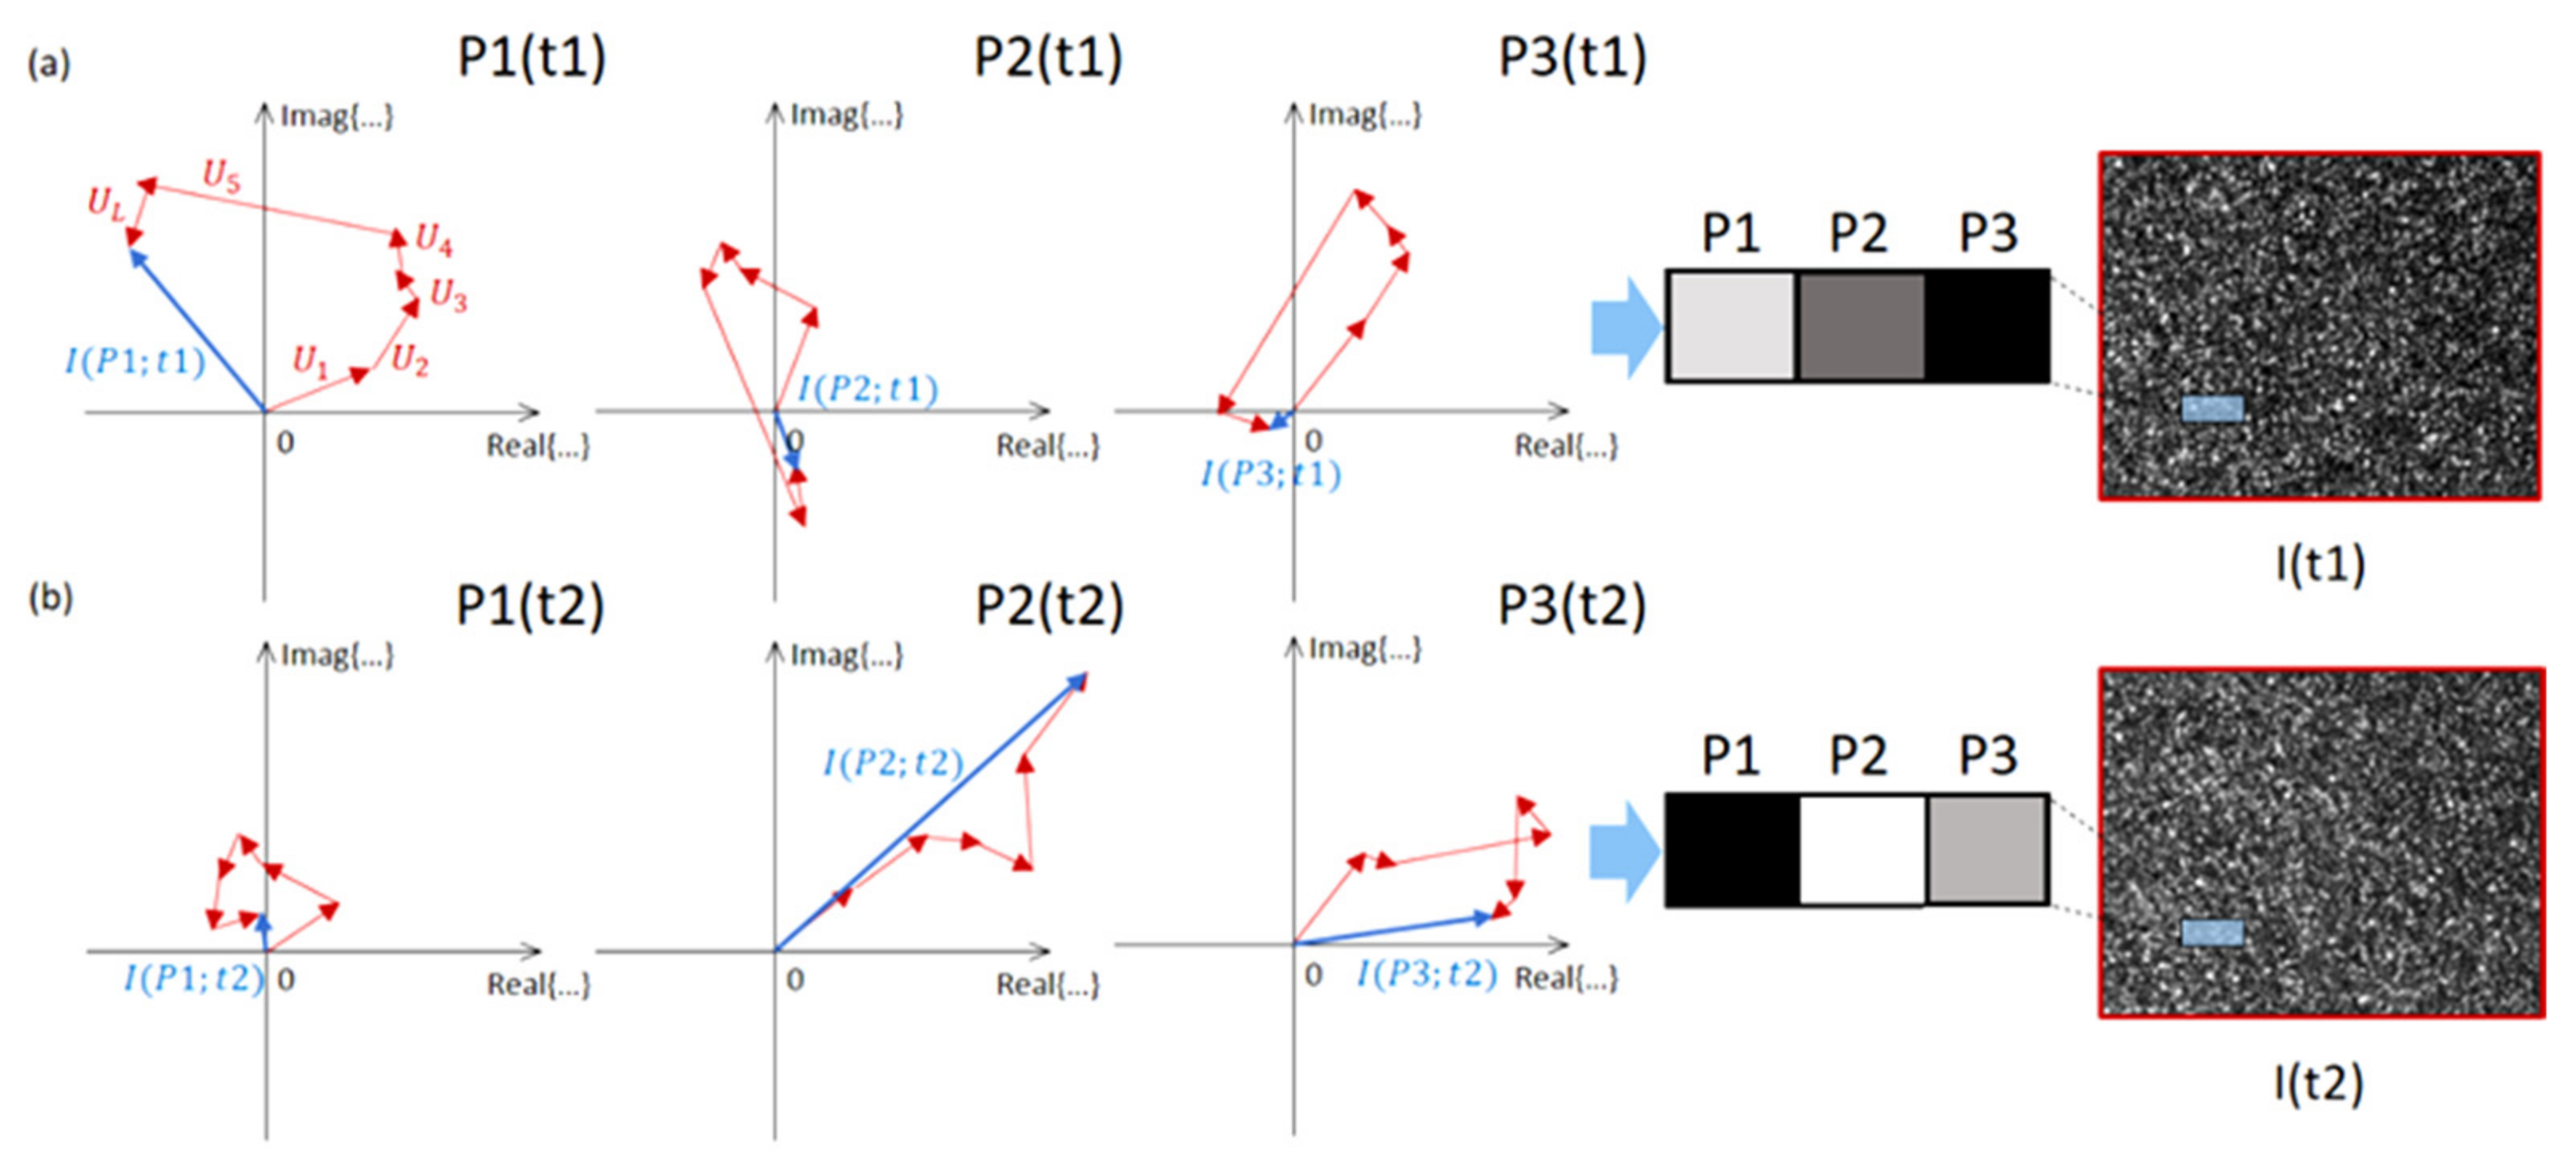
Abstract
:1. Introduction
2. Biospeckle Analysis
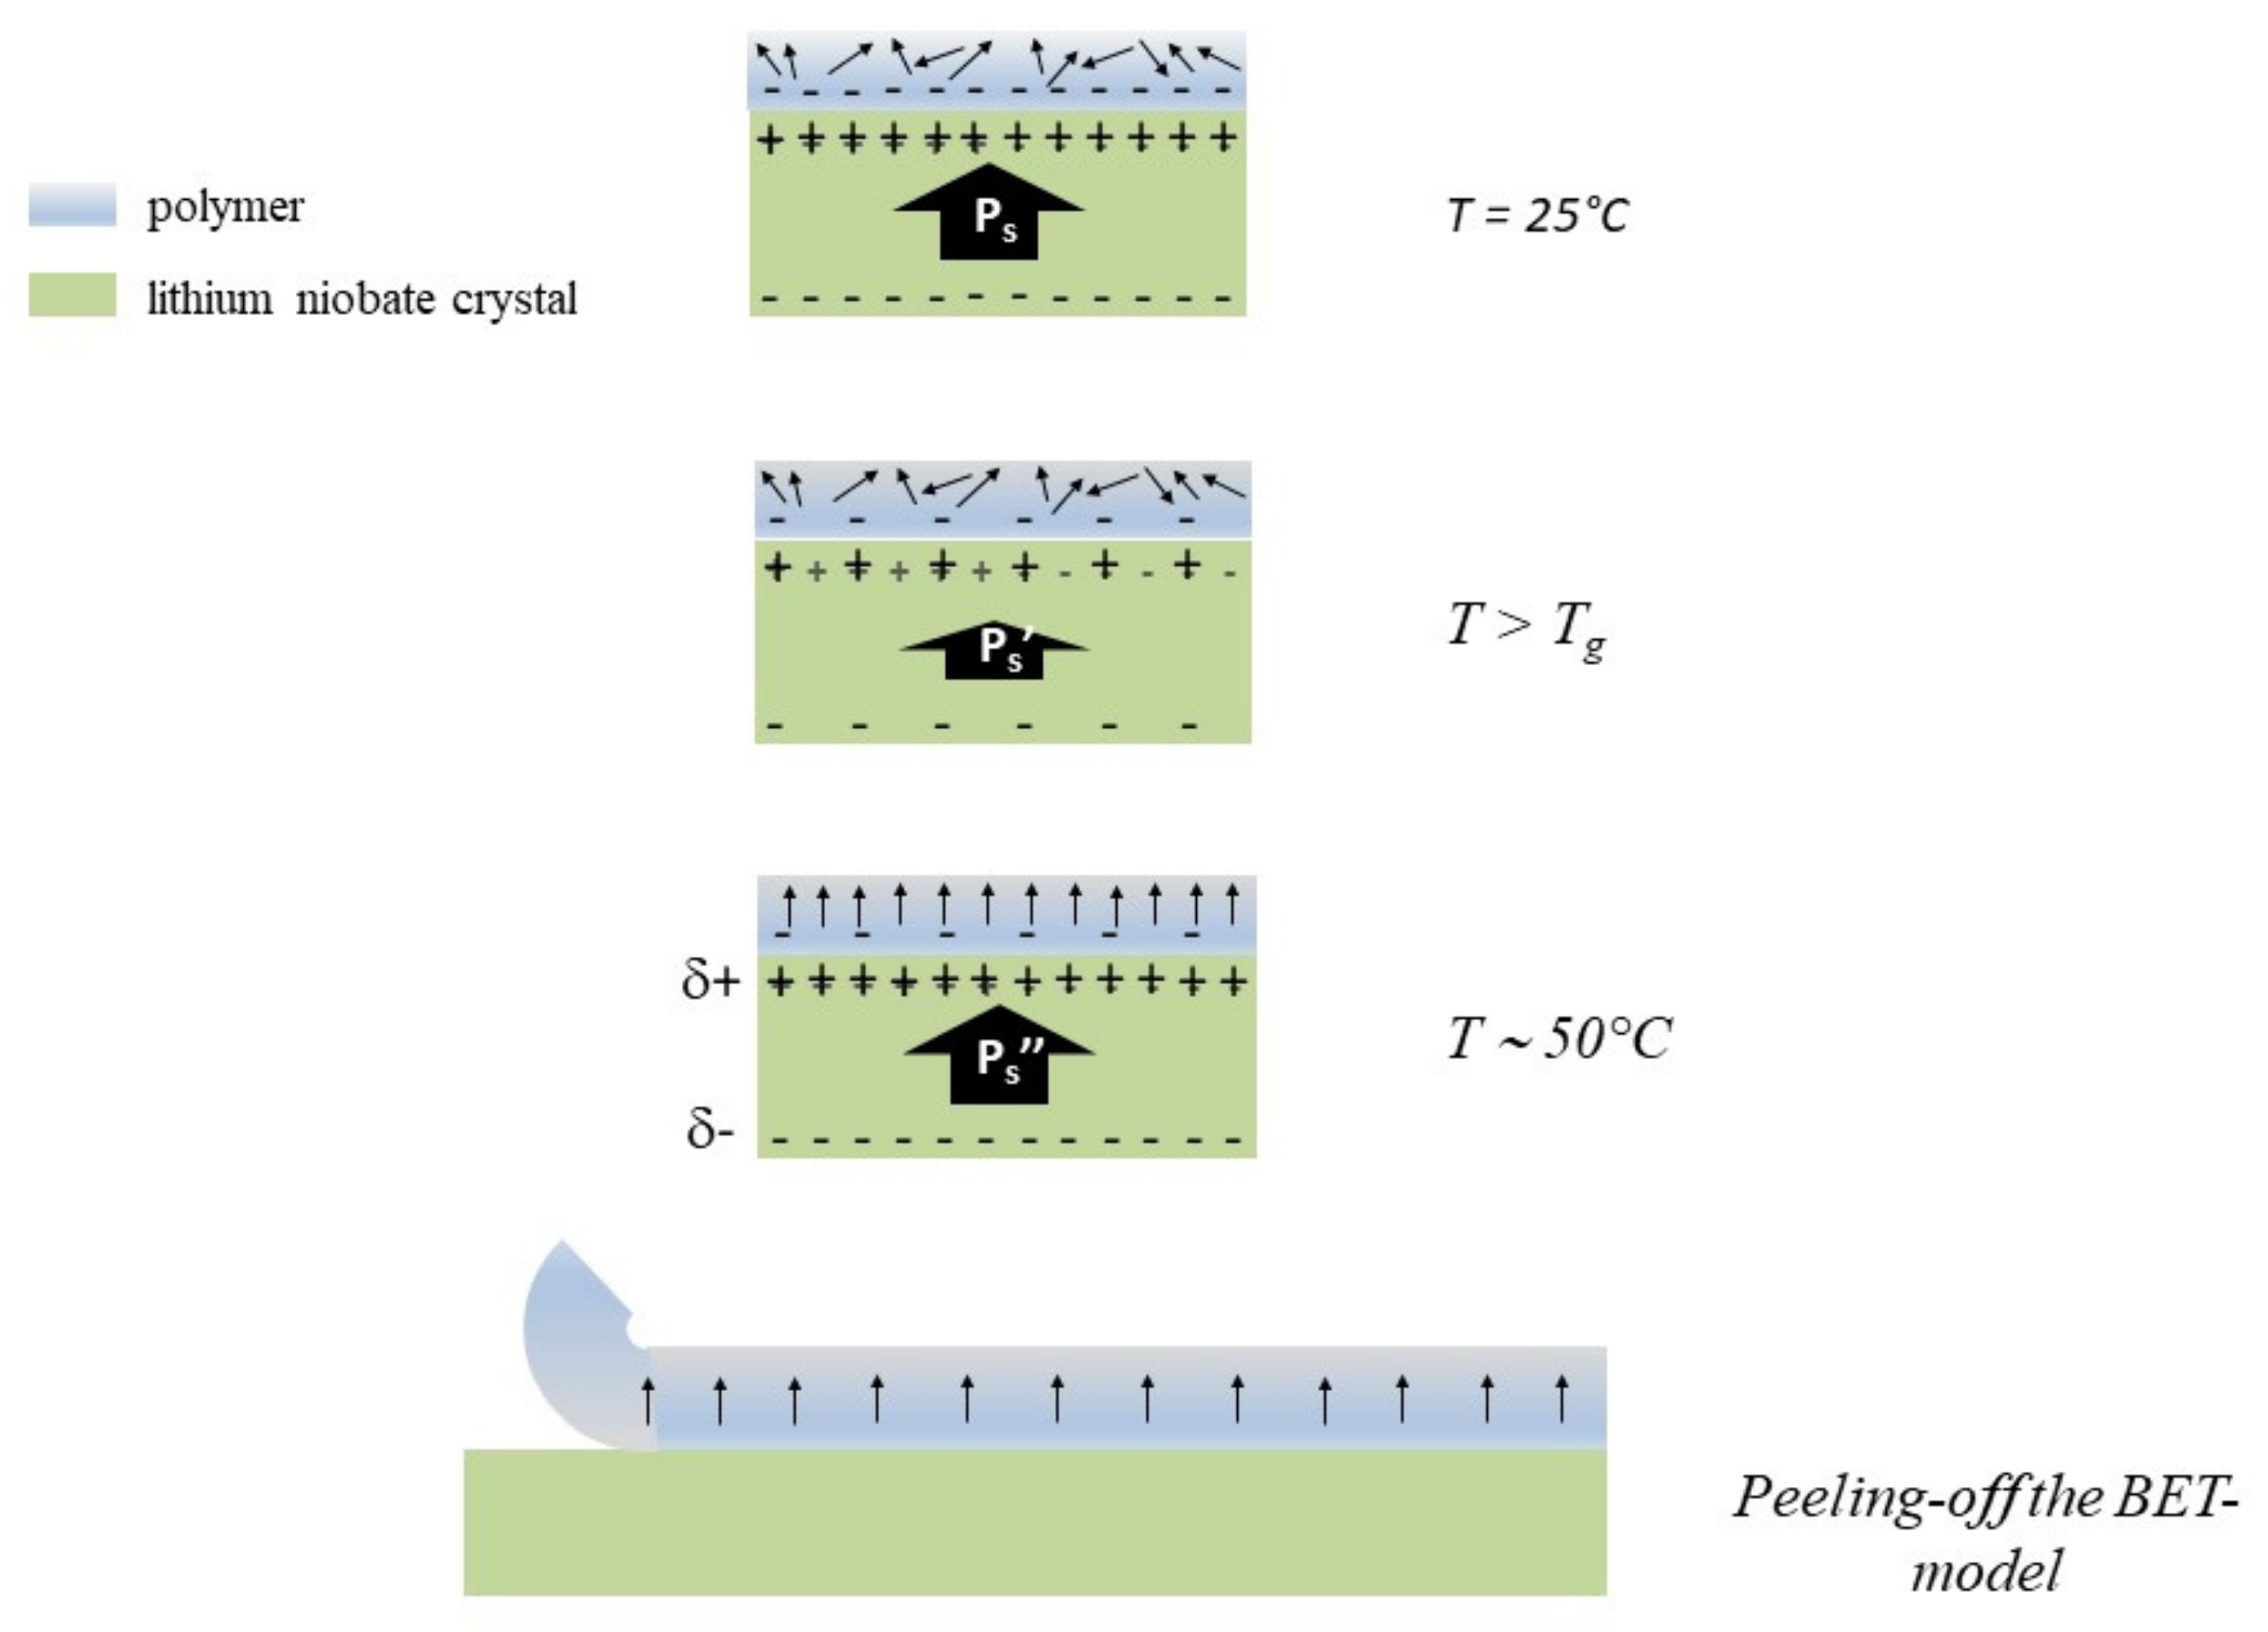
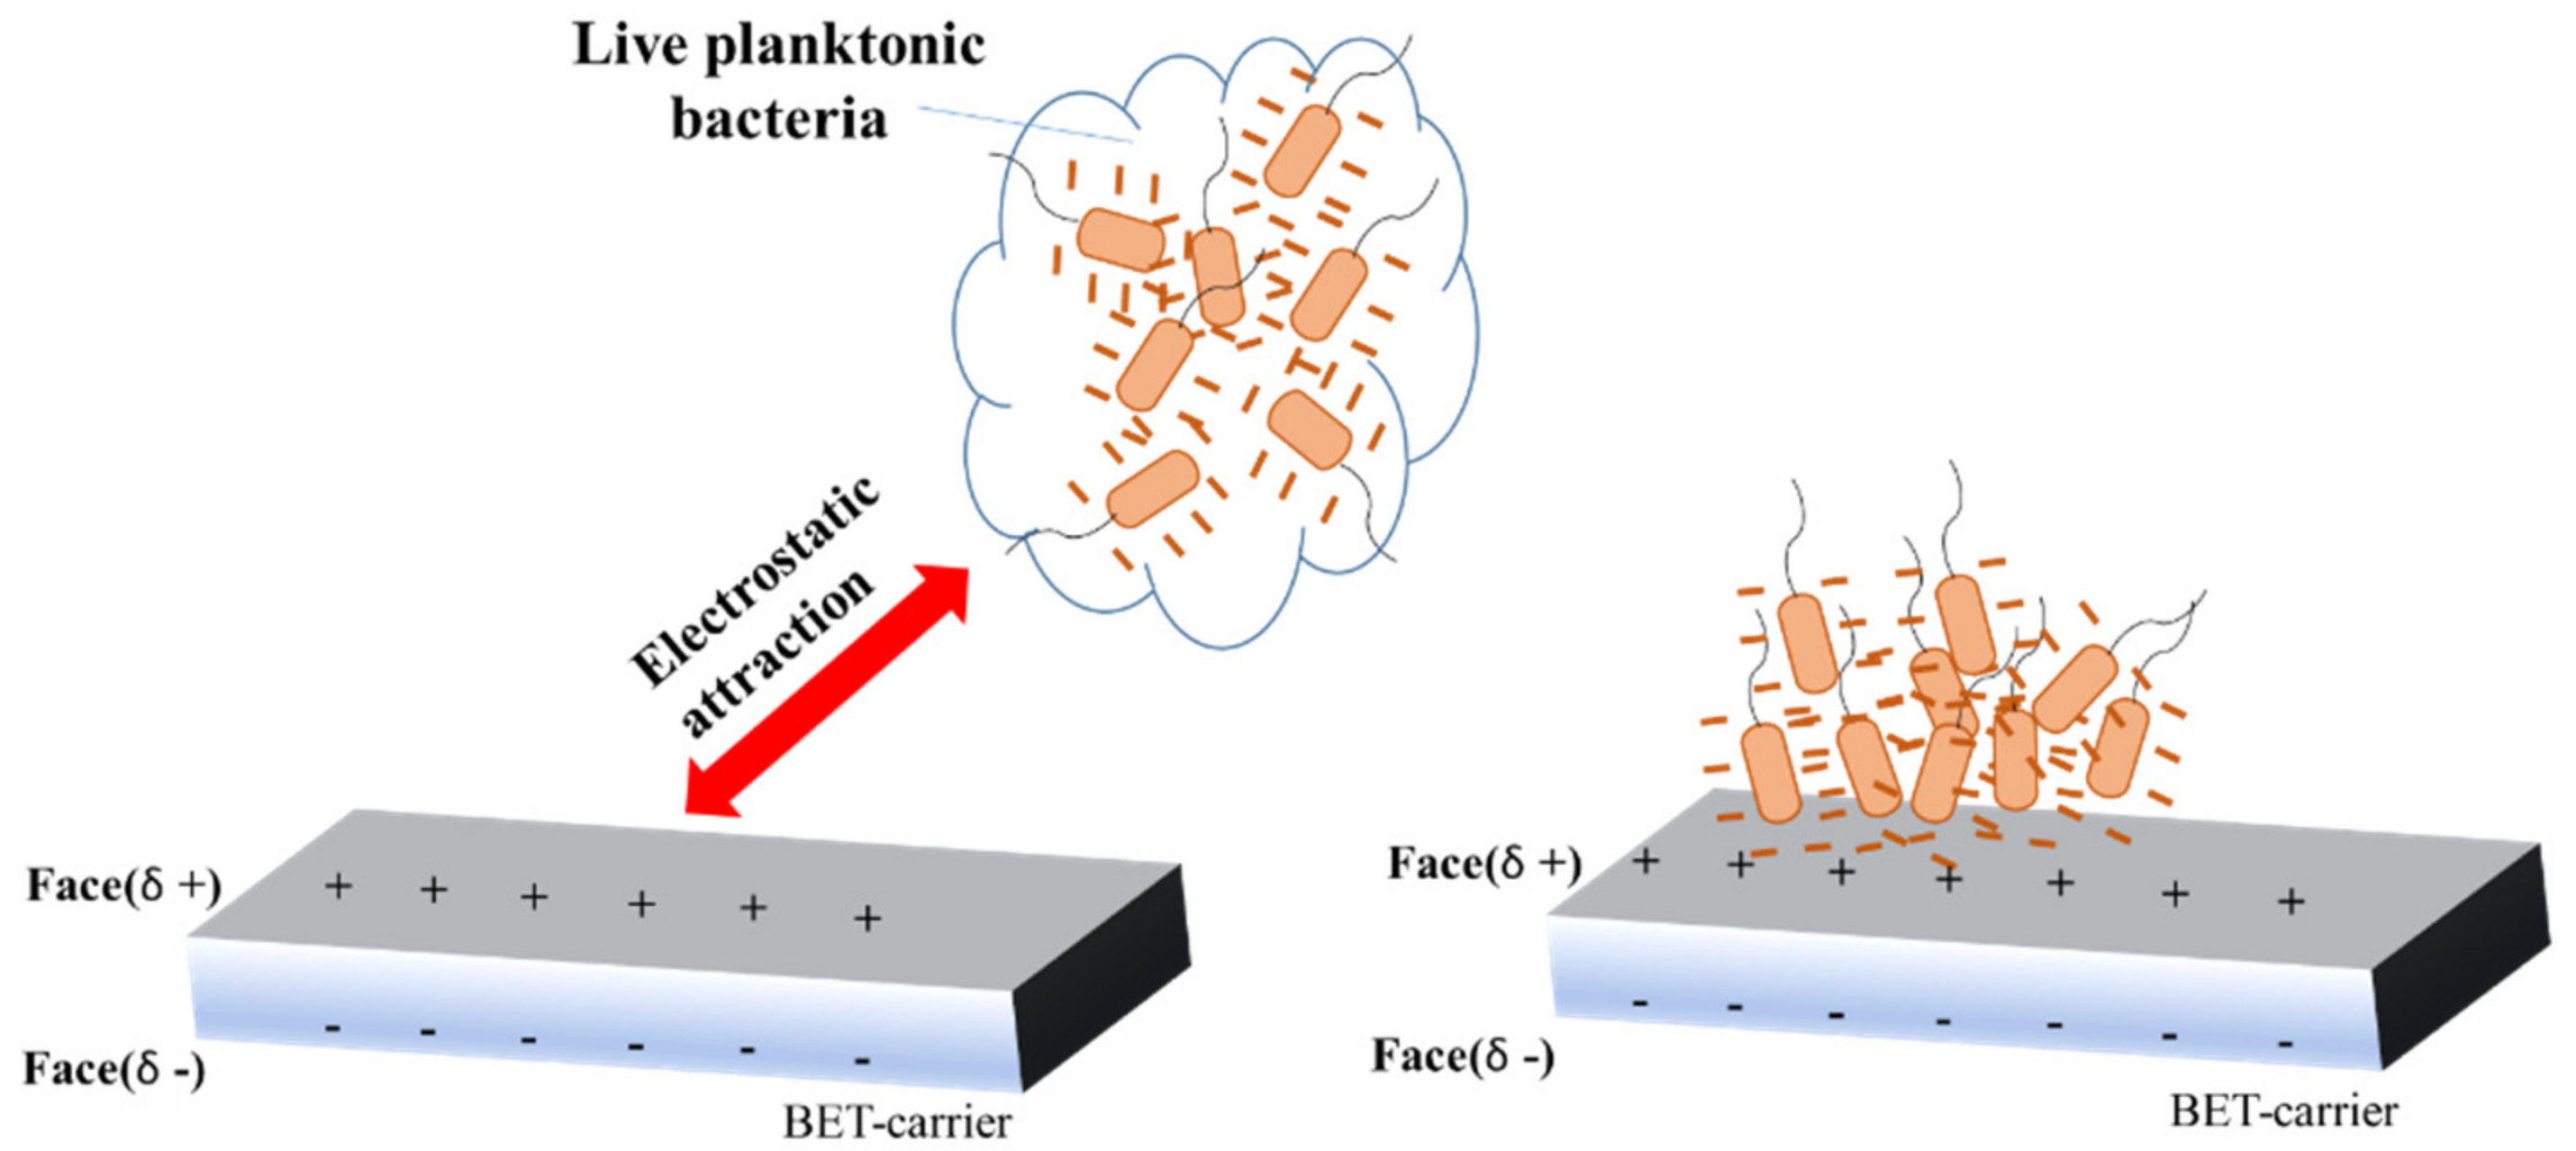
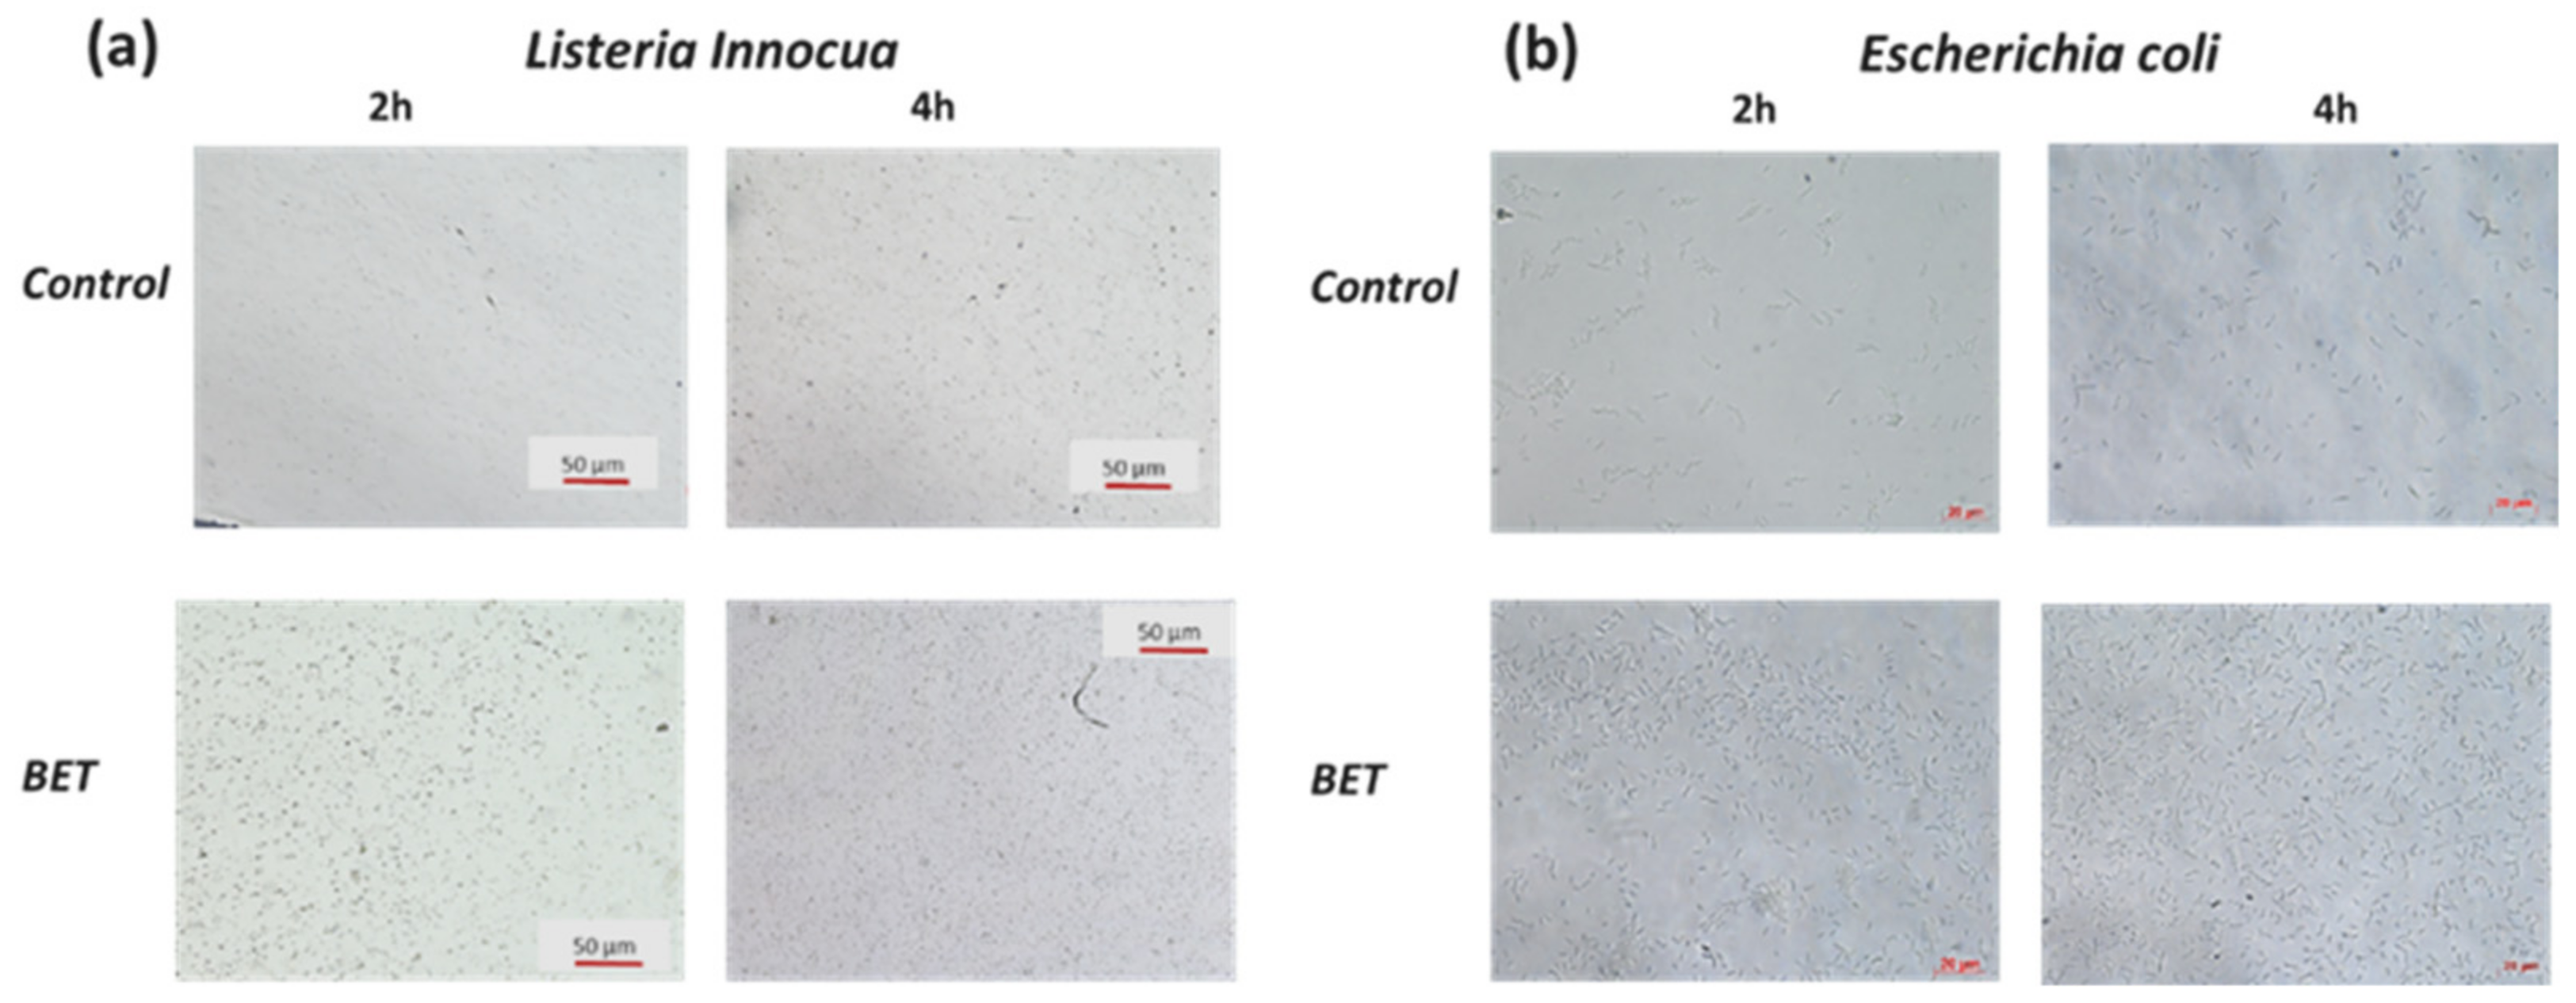
3. Biofilm Electrostatic Test
4. Conclusions
Author Contributions
Funding
Institutional Review Board Statement
Informed Consent Statement
Data Availability Statement
Conflicts of Interest
References
- Bos, R.; van der Mei, H.C.; Busscher, H.J. Physico-Chemistry of Initial Microbial Adhesive Interactions−its Mechanisms and Methods for Study. FEMS Microbiol. Rev. 1999, 23, 179–230. [Google Scholar] [CrossRef]
- Hall-Stoodley, L.; Costerton, J.W.; Stoodley, P. Bacterial Biofilms: From the Natural Environment to Infectious Diseases. Nat. Rev. Microbiol. 2004, 2, 95–108. [Google Scholar] [CrossRef]
- Conlon, B.P.; Nakayasu, E.S.; Fleck, L.E.; La Fleur, M.D.; Isabella, V.M.; Coleman, K.; Leonard, S.N.; Adkins, J.N.; Lewis, K. Activated ClpP Kills Persisters and Eradicates a Chronic Biofilm Infection. Nature 2013, 503, 365–370. [Google Scholar] [CrossRef] [Green Version]
- Hook, A.L.; Chang, C.Y.; Yang, J.; Luckett, J.; Cockayne, A.; Atkinson, S.; Mei, Y.; Roger Bayston, R.; Irvine, D.J.; Langer, R.; et al. Combinatorial Discovery of Polymers Resistant to Bacterial Attachment. Nat. Biotechnol. 2012, 30, 868–875. [Google Scholar] [CrossRef]
- Fletcher, M. The effects of culture concentration and age, time, and temperature on bacterial attachment to polystyrene. Can. J. Microbol. 1977, 23, 1–6. [Google Scholar] [CrossRef]
- Ferreira, V.; Wiedmann, M.; Teixeira, P.; Stasiewicz, M.J. Listeria monocytogenes persistence in food-associated environments: Epidemiology, strain characteristics, and implications for public health. J. Food Prot. 2014, 77, 150–170. [Google Scholar] [CrossRef]
- Borucki, M.K.; Peppin, J.D.; White, D.; Loge, F.; Call, D.R. Variation in biofilm formation among strains of Listeria monocytogenes. Appl. Environ. Microbiol. 2003, 69, 7336–7342. [Google Scholar] [CrossRef] [Green Version]
- Djordjevic, D.; Wiedmann, M.; McLandsborough, L.A. Microtiter plate assay for assessment of Listeria monocytogenes biofilm formation. Appl. Environ. Microbiol. 2002, 68, 2950–2958. [Google Scholar] [CrossRef] [Green Version]
- Ceri, H.; Olson, M.E.; Stremick, C.; Read, R.R.; Morck, D.; Buret, A. The Calgary Biofilm Device: New technology for rapid determination of antibiotic susceptibilities of bacterial biofilms. J. Clin. Microbiol. 1999, 37, 1771–1776. [Google Scholar] [CrossRef] [Green Version]
- Harrison, J.J.; Ceri, H.; Yerly, J.; Stremick, C.A.; Hu, Y.; Martinuzzi, R.; Turner, R.J. The use of microscopy and three-dimensional visualization to evaluate the structure of microbial biofilms cultivated in the Calgary Biofilm Device. Biol. Proced. Online 2006, 8, 194–215. [Google Scholar] [CrossRef] [Green Version]
- Ali, L.; Khambaty, F.; Diachenko, G. Investigating the suitability of the Calgary Biofilm Device for assessing the antimicrobial efficacy of new agents. Bioresource Technol. 2006, 97, 1887–1893. [Google Scholar] [CrossRef]
- Edmonds, J.M.; Collett, P.J.; Valdes, E.R.; Skowronski, E.W.; Pellar, G.J.; Emanuel, P.A. Surface sampling of spores in dry-deposition aerosols. Appl. Environ. Microbiol. 2009, 75, 39–44. [Google Scholar] [CrossRef] [Green Version]
- Grand, I.; Bellon-Fontaine, M.N.; Herry, J.M.; Hilaire, D.; Moriconi, F.X.; Naitali, M. Possible overestimation of surface disinfection efficiency by assessment methods based on liquid sampling procedures as demonstrated by in situ quantification of spore viability. Appl. Environ. Microbiol. 2011, 77, 6208–6214. [Google Scholar] [CrossRef] [PubMed] [Green Version]
- Azeredo, J.; Azevedo, N.F.; Briandet, R.; Cerca, N.; Coenye, T.; Costa, A.R.; Desvaux, M.; Di Bonaventura, M.; Hébraud, M.; Jaglic, Z. Critical review on biofilm methods. Cri. Rev. Microbiol. 2017, 43, 313–351. [Google Scholar] [CrossRef] [PubMed] [Green Version]
- Olivares, E.; Badel-Berchoux, S.; Provot, C.; Jaulhac, B.; Prévost, G.; Bernardi, T.; Jehl, F. The BioFilm Ring Test: A rapid method for routine analysis of Pseudomonas aeruginosa biofilm formation kinetics. J. Clin. Microbiol. 2016, 54, 657–661. [Google Scholar] [CrossRef] [PubMed] [Green Version]
- Chavant, P.; Gaillard-Martinie, B.; Talon, R.; Hébraud, M.; Bernardi, T. A new device for rapid evaluation of biofilm formation potential by bacteria. J. Microbiol. Methods 2007, 68, 605–612. [Google Scholar] [CrossRef]
- Nagant, C.; Tré-Hardy, M.; Devleeschouwer, M.; Dehaye, J.P. Study of the initial phase of biofilm formation using a biofomic approach. J. Microbiol. Methods 2010, 82, 243–248. [Google Scholar] [CrossRef]
- Di Domenico, E.G.; Toma, L.; Provot, C.; Ascenzioni, F.; Sperduti, I.; Prignano, G.; Ensoli, F. Development of an in vitro assay, based on the biofilm ring test®, for rapid profiling of biofilm-growing bacteria. Front. Microbiol. 2016, 7, 1429. [Google Scholar] [CrossRef]
- Di Domenico, E.G.; Cavallo, I.; Guembe, M.; Prignano, G.; Gallo, M.T.; Bordignon, V.; Ensoli, F. The clinical Biofilm Ring Test: A promising tool for the clinical assessment of biofilm-producing Candida species. FEMS Yeast Res. 2018, 18, foy025. [Google Scholar] [CrossRef]
- Crémet, L.; Corvec, S.; Batard, E.; Auger, M.; Lopez, I.; Pagniez, F.; Caroff, N. Comparison of three methods to study biofilm formation by clinical strains of Escherichia coli. Diagn. Microbiol. Infect. Dis. 2013, 75, 252–255. [Google Scholar] [CrossRef]
- Stepanovic, S.; Vukovic, D.; Dakic, I.; Savic, B.; Svabic-Vlahovic, M. A Modified Microtiter-Plate Test for Quantification of Staphylococcal Biofilm Formation. J. Microbiol. Methods 2000, 40, 175–179. [Google Scholar] [CrossRef]
- Blázquez-Castro, A.; García-Cabañes, A.; Carrascosa, M. Biological applications of ferroelectric materials. Appl. Phys. Rev. 2018, 5, 041101. [Google Scholar] [CrossRef] [Green Version]
- Kukhtarev, N.V.; Kukhtareva, T.V.; Jones, J.; Ward, E.W.; Sarkisov, S.S.; Curley, M.J.; Sugak, D.Y. Interaction of micro-organisms (fungi and bacteria) with optical and electronic materials. In Optical System Contamination: Effects, Measurements, and Control VII; International Society for Optics and Photonics: Seattle, WA, USA, 2002; Volume 4774, pp. 272–279. [Google Scholar]
- Miccio, L.; Marchesano, V.; Mugnano, M.; Grilli, S.; Ferraro, P. Light induced DEP for immobilizing and orienting Escherichia coli bacteria. Opt. Lasers Eng. 2016, 76, 34–39. [Google Scholar] [CrossRef]
- Rega, R.; Gennari, O.; Mecozzi, L.; Grilli, S.; Pagliarulo, V.; Ferraro, P. Bipolar patterning of polymer membranes by pyroelectrification. Adv. Mater. 2016, 28, 454–459. [Google Scholar] [CrossRef]
- Rega, R.; Gennari, O.; Mecozzi, L.; Grilli, S.; Pagliarulo, V.; Ferraro, P. Pyro-electrification of polymer membranes for cell patterning. In AIP Conference Proceedings; D’Amore, A., Acierno, D., Grassia, L., Eds.; AIP Publishing: Melville, NY, USA, 2016; Volume 1736, p. 020042. ISBN 978-0-7354-1390-0/. [Google Scholar] [CrossRef]
- Gennari, O.; Marchesano, V.; Rega, R.; Mecozzi, L.; Nazzaro, F.; Fratianni, F.; Coppola, R.; Masucci, L.; Mazzon, E.; Bramanti, A.; et al. Pyroelectric Effect Enables Simple and Rapid Evaluation of Biofilm Formation. ACS Appl. Mater. Interfaces 2018, 10, 15467–15476. [Google Scholar] [CrossRef]
- Rega, R.; Gennari, O.; Mecozzi, L.; Pagliarulo, V.; Mugnano, M.; Oleandro, E.; Nazzaro, F.; Ferraro, P.; Grilli, S. Pyro-electrification of freestanding polymer sheets: A new tool for cation-free manipulation of cell adhesion in vitro. Front. Chem. 2019, 7, 429. [Google Scholar] [CrossRef]
- Oleandro, E.; Rega, R.; Mugnano, M.; Nazzaro, F.; Ferraro, P.; Grilli, S. Quantitative determination of rapid biomass formation on pyro-electrifiedpolymer sheets. Biofilm 2021, 3, 100040. [Google Scholar] [CrossRef]
- Gennari, O.; Rega, R.; Mugnano, M.; Oleandro, E.; Mecozzi, L.; Pagliarulo, V.; Grilli, S. A skin-over-liquid platform with compliant microbumps actuated by pyro-EHD pressure. NPG Asia Mater. 2019, 11, 1. [Google Scholar] [CrossRef] [Green Version]
- Bhowmick, S.; Iodice, M.; Gioffrè, M.; Breglio, G.; Irace, A.; Riccio, M.; Coppola, S. Investigation of pyroelectric fields generated by lithium niobate crystals through integrated microheaters. Sens. Actuators A Phys. 2017, 261, 140–150. [Google Scholar] [CrossRef]
- Rega, R.; Gennari, O.; Mecozzi, L.; Pagliarulo, V.; Bramanti, A.; Ferraro, P.; Grilli, S. Maskless arrayed nanofiber mats by bipolar pyroelectrospinning. ACS Appl. Mater. Interfaces 2019, 11, 3382–3387. [Google Scholar] [CrossRef]
- Lettieri, S.; Rega, R.; Pallotti, D.K.; Gennari, O.; Mecozzi, L.; Maddalena, P.; Ferraro, P.; Grilli, S. Direct Evidence of Polar Ordering and Investigation on Cytophilic Properties of Pyroelectrified Polymer Films by Optical Second Harmonic Generation Analysis. Macromolecules 2017, 50, 7666–7671. [Google Scholar] [CrossRef]
- Nazzaro, F.; Fratianni, F.; De Martino, L.; Coppola, R.; De Feo, V. Effect of essential oils on pathogenic bacteria. Pharmaceuticals 2013, 6, 1451–1474. [Google Scholar] [CrossRef]
- Goodmann, J.W. Some fundamental properties of speckle. J. Opt. Soc. Am. 1976, 66, 1145. [Google Scholar] [CrossRef]
- Bianco, V.; Memmolo, P.; Leo, M.; Montresor, S.; Distante, C.; Paturzo, M.; Pixart, P.; Javidi, B.; Ferraro, P. Strategies for reducing speckle noise in digital holography. Light Sci. Appl. 2018, 7, 48. [Google Scholar] [CrossRef]
- Bianco, V.; Memmolo, P.; Paturzo, M.; Ferraro, P. On speckle suppression in IR digital holography. Opt. Lett. 2016, 41, 5226–5229. [Google Scholar] [CrossRef] [PubMed]
- Montrésor, S.; Memmolo, P.; Bianco, V.; Ferraro, P.; Picart, P. Comparative study of multi-look processing for phase map de-noising in digital Fresnel holographic interferometry. JOSA A 2019, 36, A59–A66. [Google Scholar] [CrossRef] [PubMed]
- Kreis, T. Handbook of Holographic Interferometry: Optical and Digital Methods; Wiley-VCH: Weinheim, Germany, 2005. [Google Scholar] [CrossRef]
- Konokhova, A.I.; Gelash, A.A.; Yurkin, M.A.; Chernyshev, A.V.; Maltsev, V.P. High-Precision Characterization of Individual E. coli Cell Morphology by Scanning Flow Cytometry. Cytometry A 2013, 83, 568–575. [Google Scholar] [CrossRef]
- Jo, Y.; Jung, J.; Kim, M.; Park, H.; Kang, S.; Park, Y. Label-free identification of individual bacteria using Fourier transform light scattering. Opt. Express 2015, 23, 15792–15805. [Google Scholar] [CrossRef]
- Strokotov, D.I.; Yurkin, M.A.; Gilev, K.V.; Van Bockstaele, D.R.; Hoekstra, A.G.; Rubtsov, N.; Maltsev, V.P. Is there a difference between T- and B-lymphocyte morphology? J. Biomed. Opt. 2009, 14, 064036. [Google Scholar] [CrossRef]
- Miao, I.; Hodgson, K.O.; Ishikawa, T.; Larabell, C.A.; LeGros, M.A.; Nishino, Y. Imaging whole Escherichia coli bacteria by using single-particle x-ray diffraction. Proc. Natl. Acad. Sci. USA 2003, 100, 110–112. [Google Scholar] [CrossRef] [Green Version]
- Suchwalko, A.; Buzalewicz, I.; Podbielska, H. Computer-based classification of bacteria species by analysis of their colonies Fresnel diffraction patterns. In Frontiers in Biological Detection: From Nanosensors to Systems; International Society for Optics and Photonics: Seattle, WA, USA, 2012; Volume IV, p. 8212. [Google Scholar]
- Katz, A.; Alimova, A.; Xu, M.; Rudolph, E.; Shah, M.K.; Savage, H.E.; Rosen, R.B.; McCormick, S.A.; Alfano, R.R. Bacteria size determination by elastic light scattering. IEEE J. Sel. Top. Quantum Electron. 2003, 9, 277–287. [Google Scholar] [CrossRef]
- Qin, J.; Chao, K.; Kim, M.S.; Lu, R.; Burks, T.F. Hyperspectral and multispectral imaging for evaluating food safety and quality. J. Food Eng. 2013, 118, 157–171. [Google Scholar] [CrossRef]
- Tao, F.; Peng, Y.; Li, Y.; Chao, K.; Dhakal, S. Simultaneous determination of tenderness and Escherichia coli contamination of pork using hyperspectral scattering technique. Meat Sci. 2012, 90, 851–857. [Google Scholar] [CrossRef]
- Zdunek, A.; Adamiak, A.; Pieczywek, P.M.; Kurenda, A. The biospeckle method for the investigation of agricultural crops: A review. Opt. Lasers Eng. 2014, 52, 276–285. [Google Scholar] [CrossRef]
- Ponder, E. Diffraction patterns produced by bacteria. Exp. Biol. 1934, 11, 54–57. [Google Scholar] [CrossRef]
- Kim, H.; Doh, I.J.; Bhunia, A.K.; King, G.B.; Bae, E. Scalar diffraction modeling of multispectral forward scatter patterns from bacterial colonies. Opt. Express 2015, 23, 8545–8554. [Google Scholar] [CrossRef]
- Yang, H.; Irudayaraj, J. Rapid detection of foodborne microorganisms on food surface using Fourier transform Raman spectroscopy. J. Mol. Struct. 2003, 646, 35–43. [Google Scholar] [CrossRef]
- Isikman, S.O.; Sencan, I.; Mudanyali, O.; Bishara, W.; Oztoprak, C.; Ozcan, A. Color and monochrome lensless on-chip imaging of Caenorhabditis elegans over a wide field-of-view. Lab Chip 2010, 10, 1109–1112. [Google Scholar] [CrossRef] [Green Version]
- Poher, V.; Allier, C.P.; Coutard, J.G.; Hervé, L.; Dinten, J.M. Lensfree in-line holographic detection of bacteria. SPIE-OSA Biomed. Opt. 2011, 8086, 808619. [Google Scholar]
- Allier, C.P.; Hiernard, G.; Poher, V.; Dinten, J.M. Bacteria detection with thin wetting film lensless imaging. Biomed. Opt. Express 2010, 1, 762–770. [Google Scholar] [CrossRef] [Green Version]
- Liu, L.; Ngadi, M.O. Hyperspectral Imaging for Food Quality and Safety Control. Ethiop. J. Appl. Sci. Technol. 2013, SI1, 51–59. [Google Scholar]
- Yao-Ze, F.; El Masry, G.; Sun, D.W.; Scannell, A.G.M.; Walsh, D.; Morcy, N. Near-infrared hyperspectral imaging and partial least squares regression for rapid and reagentless determination of Enterobacteriaceae on chicken fillets. Food Chem. 2013, 138, 1829–1836. [Google Scholar]
- Boas, D.A.; Dunn, A.K. Laser speckle contrast imaging in biomedical optics. J. Biomed. Opt. 2010, 15, 011109. [Google Scholar] [CrossRef] [Green Version]
- Celena, I.; Roberto, A.; Braga, A., Jr.; Ramos, E.M.; Ramos, A.L.S.; Roxael, E.A.R. Application of biospeckle laser technique for determining biological phenomena related to beef aging. J. Food Eng. 2013, 119, 135–139. [Google Scholar]
- Bianco, V.; Mandracchia, B.; Nazzaro, F.; Marchesano, V.; Gennari, O.; Paturzo, M.; Grilli, S.; Ferraro, P. Food quality inspection by speckle decorrelation properties of bacteria colonies. Optical Methods for Inspection, Characterization, and Imaging of Biomaterials III. Proc. SPIE 2017, 10333, 103331N. [Google Scholar] [CrossRef]
- Ansari, M.Z.; Ramírez-Miquet, E.E.; Otero, I.; Rodríguez, D.; Darias, J.G. Real time and online dynamic speckle assessment of growing bacteria using the method of motion history image. J. Biomed. Opt. 2016, 21, 066006. [Google Scholar] [CrossRef] [PubMed]
- Pajuelo, M.; Baldwin, G.; Rabal, H.; Cap, N.; Arizaga, R.; Trivi, M. Bio-speckle assessment of bruising in fruits. Opt. Lasers Eng. 2003, 40, 13–24. [Google Scholar] [CrossRef]
- Ramìrez-Miquet, E.E.; Darias, J.G.; Otero, I.; Rodríguez, D.; Murialdo, S.; Rabal, H.; Trivi, M. Biospeckle Technique for Monitoring Bacterial Colony Growth with Minimal Photo-Exposure Time Associated. IFMBE Proc. 2015, 49, 313–316. [Google Scholar]
- Mandracchia, B.; Palpacuer, J.; Nazzaro, F.; Bianco, V.; Rega, R.; Ferraro, P.; Grilli, S. Biospeckle decorrelation quantifies the performance of alginate-encapsulated probiotic bacteria. IEEE J. Sel. Top. Quantum Electron. 2019, 25, 7200206. [Google Scholar] [CrossRef]
- Bianco, V.; Marchesano, V.; Finizio, A.; Paturzo, M.; Ferraro, P. Self-propelling bacteria mimic coherent light decorrelation. Opt. Express 2015, 23, 9388–9396. [Google Scholar] [CrossRef]
- Heeman, W.; Steenbergen, W.; Gooitzen, M.; van Dam, E.; Boerma, C. Clinical applications of laser speckle contrast imaging: A review. J. Biomed. Opt. 2019, 24, 080901. [Google Scholar] [CrossRef] [Green Version]
- Yao-Ze, F.; Sun, D.W. Determination of total viable count (TVC) in chicken breast fillets by near-infrared hyperspectral imaging and spectroscopic transforms. Talanta 2013, 105, 244–249. [Google Scholar]
- Bonah, E.; Huang, X.; Aheto, J.H.; Osae, R. Application of Hyperspectral Imaging as a Nondestructive Technique for Foodborne Pathogen Detection and Characterization. Foodborne Pathog. Dis. 2019, 16, 712–722. [Google Scholar] [CrossRef]
- Vasefi, F.; Booth, N.; Hazifi, H.; Farkas, D.L. Multimode Hyperspectral Imaging for Food Quality and Safety. In Hyperspectral Imaging in Agriculture, Food and Environment; Maldonado, A.I.L., Rodriguez-Fuentes, H., Vidales Contreras, J.A., Eds.; IntechOpen Ltd.: London, UK, 2018; pp. 11–27. ISBN 978-1-78923-290-5. [Google Scholar] [CrossRef] [Green Version]
- Yeo, B.A.; Watson, I.A.; Wong, J.W.M.; Stewart-Tull, D.E.S. Optical Imaging and Analysis of Speckle Patterns from Escherichia Coli in Disinfectant Solution. In Proceedings of the CLEO/Europe Conference on Lasers and Electro-Optics, Glasgow, UK, 14–18 September 1998; ISBN 0-7803-4233X. [Google Scholar] [CrossRef]
- Watson, A.; Stewart-Tull, D.E.S.; Parton, R.; Peden, I.; Yeo, A.; Tan, B.K.; Ward, G. Laser inactivation of surfaces and detection of bacteria. In Particles on Surfaces 9: Detection, Adhesion and Removal; Mittal, K.L., Ed.; VSP: Leiden, The Netherlands, 2007; pp. 83–94. ISBN 9789067644358. [Google Scholar]
- Ramirez-Miquet, E.; Martí-López, L.; Contreras-Alarcón, O.R. Escherichia coli activity characterization using a laser dynamic speckle technique. Revista Cubana de Física 2011, 28, 1E13–1E17. [Google Scholar]
- Murialdo, S.E.; Sendra, G.H.; Passoni, L.I.; Arizaga, R.; Gonzalez, J.F.; Rabal, H.; Trivi, M. Analysis of bacterial chemotactic response using dynamic laser speckle. J. Biomed. Opt. 2009, 14, 064015. [Google Scholar] [CrossRef]
- Ramírez-Miquet, E.E.; Otero, I.; Rodríguez, D.; Darias, J.G.; Combarro, A.M.; Contreras, O.R. Differences in activity profile of bacterial cultures studied by dynamic speckle patterns. Proc. SPIE 2013, 8587, 85871P. [Google Scholar] [CrossRef]
- Murialdo, M.E.; Passoni, L.; Guzman, M.N.; Sendra, G.H.; Rabal, H.J.; Trivi, M.R.; Gonzalez, J.F. Discrimination of motile bacteria from filamentous fungi using dynamic speckle. J. Biomed. Opt. 2012, 17, 056011. [Google Scholar] [CrossRef] [Green Version]
- Balmages, I.; Bliznuks, D.; Liepins, J.; Zolins, S.; Lihachev, A. Laser speckle time-series correlation analysis for bacteria activity detection. Proc. SPIE 2020, 11359, 113591D. [Google Scholar] [CrossRef]
- Loutfi, H.; Pellen, F.; Jeune, B.L.; Lteif, R.; Kallassy, M.; Brun, G.L.; Abboud, M. Interpretation of the bacterial growth process based on the analysis of the speckle field generated by calibrated scattering media. Opt. Express 2020, 28, 28648–28655. [Google Scholar] [CrossRef]
- Ulianova, O.; Ulyanov, S.; Zaytsev, S.; Saltykov, Y.; Ulyanov, A.; Feodorova, V. LASCA-imaging of GB-speckles: Application for detection of the gene polymorphism in bacterial model. Laser Phys. Lett. 2020, 17, 6. [Google Scholar] [CrossRef]
- Ulianova, O.; Ulyanov, S.; Zaytsev, S.; Saltykov, Y.; Ulyanov, A.; Feodorova, V. Could LASCA-imaging of GB-speckles be applied for a high discrimination and typing of pathogenic bacteria? PLoS ONE 2021, 16, e0245657. [Google Scholar] [CrossRef] [PubMed]
- Zdunek, A.; Muravsky, L.I.; Frankevych, L.; Konstankiewicz, K. New nondestructive method based on spatial-temporal speckle correlation technique for evaluation of apples quality during shelf-life. Int. Agrophys. 2007, 21, 305–310. [Google Scholar]
- Yoon, J.; Lee, K.R.; Park, Y.K. A simple and rapid method for detecting living microorganisms in food using laser speckle decorrelation. arXiv 2016, arXiv:1603.07343. [Google Scholar]
- Braga, R. Challenges to apply the biospeckle laser technique in the field. Chem. Eng. Trans. 2017, 58, 577–582. [Google Scholar]
- Catalano, M.D.; Rivera, F.P.; Braga, R.A. Viability of biospeckle laser in mobile devices. Optik–Int. J. Light Electron. Opt. 2019, 183, 897–905. [Google Scholar] [CrossRef]
- Alves Braga, J.R. When noise became information: State-of-art in biospeckle laser. Ciencia Agrotecnol. 2017, 41, 359–366. [Google Scholar] [CrossRef] [Green Version]
- Passoni, I.; Rabal, H.; Meschino, G.; Trivi, M. Probability mapping images in dynamic speckle classification. Appl. Opt. 2013, 52, 726–733. [Google Scholar] [CrossRef]
- Zhang, Y.; Ceylan Koydemir, H.; Shimogawa, M.M.; Yalcin, S.; Alexander, A.; Liu, T.; Oguz, I.; Huang, Y.; Bai, B.; Yilin Luo, Y.; et al. Motility-based label-free detection of parasites in bodily fluids using holographic speckle analysis and deep learning. Light Sci. Appl. 2018, 7, 108. [Google Scholar] [CrossRef] [PubMed]
- Arizaga, R.; Trivi, M.; Rabal, H. Speckle time evolution characterization by the co-occurrence matrix analysis. Opt. Laser Technol. 1999, 31, 163–169. [Google Scholar] [CrossRef]
- Asadishad, B.; Ghoshal, S.; Tufenkji, N. Method for the direct observation and quantification of survival of bacteria attached to negatively or positively charged surfaces in an aqueous medium. Environ. Sci. Technol. 2011, 45, 8345–8351. [Google Scholar] [CrossRef] [PubMed]
- Hermansson, M. The DLVO theory in microbial adhesion. Colloids Surf. B Biointerfaces 1999, 14, 105–119. [Google Scholar] [CrossRef]
- Christensen, G.D.; Simpson, W.A.; Younger, J.J.; Baddour, L.M.; Barrett, F.F.; Melton, D.M.; Beachey, E.H. Adherence of coagulase-negative staphylococci to plastic tissue culture plates: A quantitative model for the adherence of staphylococci to medical devices. J. Clin. Microbiol. 1985, 22, 996–1006. [Google Scholar] [CrossRef] [PubMed] [Green Version]


Publisher’s Note: MDPI stays neutral with regard to jurisdictional claims in published maps and institutional affiliations. |
© 2021 by the authors. Licensee MDPI, Basel, Switzerland. This article is an open access article distributed under the terms and conditions of the Creative Commons Attribution (CC BY) license (https://creativecommons.org/licenses/by/4.0/).
Share and Cite
Oleandro, E.; Grilli, S.; Rega, R.; Mugnano, M.; Bianco, V.; Valentino, M.; Mandracchia, B.; Nazzaro, F.; Coppola, R.; Ferraro, P. Biospeckle Analysis and Biofilm Electrostatic Tests, Two Useful Methods in Microbiology. Appl. Microbiol. 2021, 1, 557-572. https://doi.org/10.3390/applmicrobiol1030036
Oleandro E, Grilli S, Rega R, Mugnano M, Bianco V, Valentino M, Mandracchia B, Nazzaro F, Coppola R, Ferraro P. Biospeckle Analysis and Biofilm Electrostatic Tests, Two Useful Methods in Microbiology. Applied Microbiology. 2021; 1(3):557-572. https://doi.org/10.3390/applmicrobiol1030036
Chicago/Turabian StyleOleandro, Emilia, Simonetta Grilli, Romina Rega, Martina Mugnano, Vittorio Bianco, Marika Valentino, Biagio Mandracchia, Filomena Nazzaro, Raffaele Coppola, and Pietro Ferraro. 2021. "Biospeckle Analysis and Biofilm Electrostatic Tests, Two Useful Methods in Microbiology" Applied Microbiology 1, no. 3: 557-572. https://doi.org/10.3390/applmicrobiol1030036