1. Introduction
Resource allocation and bioavailability of growth factors, including essential elements, are associated with desirable plant health, photosynthetic efficiency, and energy generation for optimum plant growth and development [
1]. The function of the photosynthetic apparatus is to capture and convert light energy into chemical energy. However, not all the absorbed light energy is used for photosynthesis but rather, some are dissipated in the form of heat or re-emitted as light [
2,
3]. As such, chlorophyll fluorescence indices can be used to assess the efficiency of electron transfer and carbon assimilation in the photosynthesis process. Many studies have shown that variations in growing media fertility alters leaf chlorophyll fluorescence indices and photosynthesis [
4,
5,
6]. These include variations in organic growing media amendments such as biochar, vermicast, and compost applications [
7,
8]. Innovations in treatments and extraction of vermicast and compost to increase their effectiveness on crop growth and development are becoming popular globally but are underexplored.
The properties and efficacy of vermicast (i.e., pure earthworm excreta) are well studied. Vermicast is microbiologically active, rich in humified substances (i.e., humic acid, fulvic acid and humins), mineral elements, amino acids, amides, phytohormones, and various organic compounds belonging to the hydrophilic, aliphatic, and aromatic groups [
9,
10,
11]. These compounds are formed by chemical and microbial alterations of macromolecules such as lipids, proteins, carbohydrates, and nucleic acids in the gut of earthworms. As a result, vermicast has high absorptive power for nutrients and regulatory effects on plant growth, development, and stress tolerance. Generally, organic amendments such as vermicast are a slow-release source of plant nutrients and therefore, it is postulated that microwave treatment of vermicast can enhance plant bioavailability of these nutrients. An earlier study by Abbey et al. [
12] demonstrated that microwave irradiation increases the chemical composition and efficacy of vermicast. Other researchers used microwave to pyrolyze horse manure [
13], advanced oxidation treatment of dairy manure [
14], and anaerobic digestion and biogas generation of swine manure [
15]. However, none of these studies reported microwave irradiation effect on vermicast structural changes and microbial populations.
Microwave irradiation is an electromagnetic wave with a frequency of about 2.45 GHz higher than radio wave, but lower than that of an infrared light [
16]. Vermicast, like the food matrix, contains polar molecules such as water with random orientation. The principle of operation of microwave technology is based on rapid movement of these polar molecules leading to collisions and friction, which generate localized super heating [
16,
17,
18]. Microwave technology is increasingly becoming popular in agriculture and many other industry sectors because it produces fast results and it is cheap, energy efficient, and safe. The present study is a follow up of a previous study [
12] where we reported an increase in nutrient density in microwaved vermicast at power level 400 W, and enhanced plant growth and antioxidant content of Chinese cabbage (
Brassica rapa subsp.
pekinensis). However, we did not investigate vermicast structural and active microbial communities at microwave power level 1000 W, and how microwaved vermicast affect leaf pigmentation, photosynthesis, and crop growth.
Undamaged membranes of microbes comprise phospholipids biomarkers typified by fatty acids that can be associated with a particular microbial taxon [
19]. As such, molecular and biochemical screening of phospholipids fatty acids (PLFAs) can verify active microbial community structure in growing media as recently reported by Lin et al. [
20]. In their study, they used PLFA as biomarkers to assess the active microbial community composition of Gram-positive (G+) and Gram-negative (G−) bacteria, eukaryotes, fungi, and protozoa living in soilless growing media. It is unknown how the electromagnetic wave and heat generated from the microwave irradiation may affect these microbial groups in the vermicast at varied power levels. Therefore, the objective of the present study was to determine the effects of variation in microwave power level from 0 to 1000 W on the physical and chemical properties and active microbial groups in vermicast, and how that impact photosynthesis, growth and yield of kale (
Brassica oleracea var. sabellica) ‘Red Russian’.
2. Materials and Methods
2.1. Materials
The experiment was performed in the research greenhouse located at the Department of Plant, Food, and Environmental Sciences in summer. Organically certified, film-coated seeds of kale ‘Red Russian’ (Aimer, Waterloo, ON, Canada); fresh, moist vermicast produced by Red wiggler worms (Eisenia fetida) (Growing Green Earthworm Castings Inc., Wedgeport, NS, Canada), and Promix BX™ soilless potting mix media (Premier Horticulture Inc., Quakertown, PA, USA) were purchased from a local retailer. The Promix BXTM was a general-purpose peat-based substrate composed of 75–85% sphagnum peat moss; horticultural-grade perlite and vermiculite; dolomitic and calcitic limestone; a wetting agent, and mycorrhizal fungus (Glomus intraradices). A General Electric Microwave Oven (Model No. JES1295STC01, Mabe Canada Inc., Mississauga, ON, Canada) was used to irradiate the vermicast granules at varying power levels.
2.2. Microwave Irradiation of Vermicast
One hundred (100) g of the fresh, moist vermicast was transferred into a clean, microwavable ceramic glass bowl. The vermicast was spread out evenly in the bowl using a spatula before irradiating at microwave power output levels: 200, 400, 600, 800, and 1000 W for 5 min using the method described in Abbey et al. [
12]. In brief, during the heating of the vermicast, the microwave equipment was paused halfway at the 2.5 min mark to stir the vermicast to minimize disruptive heat buildup. The microwave was immediately restarted for another 2.5 min (i.e., total exposure time was 5 min). All the microwave treatments were performed in triplicates. The control treatment (0 W) was a 100 g fresh, moist vermicast that was not microwaved.
2.3. Vermicast Temperature and Water Loss
The temperature of the microwaved vermicast was recorded immediately after the end of 5 min exposure using a glass thermometer. Water loss from the sample was determined from the difference between the initial and final weight after microwave irradiation using the formula:
2.4. Vermicast Physical and Chemical Analysis
Four hundred (400) mL of distilled water were added to each 100 g portion of vermicast treatment including the control, and vortexed for 10 min using an Isotemp stirring plate (model LT1892X1; Thermo Fisher Scientific Inc., Toronto, ON, Canada). The mixture was then kept for 24 h for it to separate into three distinct phases, i.e., suspended particles, liquid, and solid sediment, before analyzing their physical and chemical characteristics. Nitrogen (N), carbon (C) and C/N ratio of the suspended particles and sediments were determined using Variomax CN Macro Elemental Analyzer (Elementar Analysensysteme GmbH, Hanau, Germany). The turbidity of the liquid was determined using turbidity meter (Oakton Instruments, Vernon Hills, IL, USA). The electric conductivity, potential hydrogen ion concentration (pH), total dissolved solids, and salinity were determined using Oakton PCTesterTM 35 multimeter (Spectrum Technologies, Inc., Aurora, IL, USA). The nitrate (NO3−), potassium (K), sodium (Na), and calcium (Ca) contents of the different solutions were also estimated using LAQUA Twin meters (Spectrum Technologies, Inc., Aurora, IL, USA). All analyses were performed in triplicate.
2.5. Vermicast PFLA Extractzion and Active Microbial Analysis
Active microbial analysis was performed after storing the microwaved vermicast and the control samples for one week at 10 °C. The method described by Lin et al. [
20] for PLFA extraction was adopted. In brief, 4 g of ground media of each treatment were added to 10 mL of 2:1 chloroform:methanol (
v/
v) and sonicated using Q700 Sonicator for 5 min at 50 amplitude followed by 5 s of pulse on time, and then 10 s of pulse off time. The supernatant was filtered with Whatman 42 filter paper after 24 h of incubation and dried under a gentle stream of N. Extracted lipids were resuspended in 2 mL chloroform followed by fractionation using a Visiprep™ SPE Vacuum Manifold and Discovery
® DSC-Si SPE columns (50 μm, 70 Å, 100 mg/1 mL) (Sigma-Aldrich, St. Louis, MO, USA). Next, 1.5 mL of the vermicast samples were added to the column followed by 2.0 mL each of chloroform, acetone, and methanol to fractionate lipids into neutral lipids, glycolipids, and phospholipids, respectively. The solution was slowly passed through an extraction tube under vacuum at ca. 30 kPa. The phospholipid fractions were dried under a gentle stream of N and then resuspended in 500 µL of methyl tert-butyl ether (MTBE). Next, 100 µL of solvent was used for gas chromatography-mass spectrometry (GC-MS) analysis. Fatty acids in 100 µL of MTBE samples were derivatized using 50 µL trimethyl sulfonium hydroxide (TMSH) followed by incubation, after which 50 µL samples were mixed with 10 µL of the internal standard methyl nonadecanoate (C18:0 Alkane in MTBE @ 1600 µg/mL) in GC vials and analyzed with flame ionization detection (GC-FID) and GC-MS. A Q-Exactive Orbitrap mass spectrometer was used to analyze the intact microbial lipids. The lipid classes and molecular species were identified using LipidSearch 4.1.9 software (Thermo Fisher Scientific, Waltham, MA, USA) and [
21] with manual confirmation using Xcalibur 4.0.
2.6. Seeding and Transplanting of Kale
Seeds of kale ‘Red Russian’ were started in a 72-cell tray filled with Promix BX™ potting medium alone. Ninety percent of the kale seeds germinated within seven days sowing, and two seedlings were transplanted 28 days after sowing into each 15.24-cm diameter plastic pot filled with 400 g of Promix BX™ and 100 g of the individual vermicast treatment, i.e., microwaved and control. The seedlings in each pot were thinned to one after seven days of transplanting. The plants were watered once daily or as required. No additional nutrient supplement nor vermicast was added throughout the growing period. The mean temperature of the greenhouse was 24/18 ± 2 °C day/night cycle at a mean relative humidity of 72%. Supplementary lighting was provided from a 600 J·s−1 high-pressure sodium lamp to achieve a 12 h light cycle when needed. Plants were harvested at 35 days after transplanting.
2.7. Kale Leaf Anthocyanin and Chlorophyll Contents
Mean chlorophyll (i.e., leaf greenness) and anthocyanin contents of the 3rd and 4th youngest leaves per plant were recorded at final harvest using SPAD 502 Chlorophyll meter (Spectrum Technologies Inc., Aurora, IL., USA) and ACM-200+ Anthocyanin meter (Opti-Science Inc., Hudson, NH, USA), respectively.
2.8. Total Leaf Carotenoid, Chl a and Chl b
Kale leaf carotenoid content was determined as described by Harbone [
22]. In brief, 100 mg of fresh leaf tissue was added to 10 mL of 80% acetone before grinding in a mortar. The homogenate was centrifuged at 3000×
g for 10 min and the absorbance (i.e., optical density, OD) of the supernatant was measured at 480 nm using a UV-Vis spectrophotometer.
The method of Harmut and Lichtenthaler [
23] was used to assess chlorophyll (Chl) a and b. In brief, 1 g of the fresh leaf sample was taken and immediately ground in a mortar with 15 mL of 100% cold methanol. The ground mixture was centrifuge at 10,000×
g at 4 °C for 10 min and the supernatant was collected. The pellets were re-suspended in 10 mL of cold methanol until all the color was removed. The combined extract was made up to 25 mL and the absorbance was measured at 652, 665 and 750 nm using a UV-Vis spectrophotometer. The chlorophylls were calculated as:
2.9. Chlorophyll Fluorescence Indices
Chlorophyll fluorescence indices were assessed using a portable OS30p+ Chlorophyll fluorometer (Opti-Science Inc., Hudson, NH, USA) following the manufacturer’s manual instruction. In brief, the middle portion of the 3rd and 4th youngest leaves were attached with light exclusion (dark adaptation) clips supplied by the manufacturer with the window closed for a duration of 25 min (dark adaptation). After the dark adaption period, the window was opened to admit actinic (photosynthesis) light, and the chlorophyll fluorescence indices were recorded on the fluorometer. The indices measured were maximum quantum yield or efficiency of Photosystem II (Fv/Fm); where Fv, variable fluorescence; Fm, maximum fluorescence at the dark state, and Fv = Fm − Fo; where Fo, minimum fluorescence at the steady state immediately after the clipped portion of the leaf was exposed to actinic light; and Fv/Fo, potential photosynthetic capacity. The dark adaptation phase is known to be characterized by maximum photochemical efficiency and minimum heat dissipation, which provided a baseline for the measurement of Fm [
2,
24].
2.10. Growth and Yield of Kale ‘Red Russian’
Kale ‘Red Russian’ plant height was measured from the longest leaf tip to the collar of the stem using a 30 cm rule. Kale plant yield per treatment was estimated by the fresh weight of edible portion of the harvested crop.
2.11. Greenhouse Experimental Design and Data Analysis
The greenhouse experiment was arranged in a completely randomized design with five replications for each of the microwave irradiation power output levels (i.e., 0–1000 W). The potted kale plants were rearranged biweekly on the bench to offset any unpredictable occurrence due to variations in greenhouse environment. Data collected were subjected to one-way analyses of variance (ANOVA) using Minitab version 19.3 (Minitab Inc., State College, PA, USA). Fisher’s least significant difference (LSD) method was used to separate treatment means when the ANOVA indicated a significant difference at p ≤ 0.05. Microsoft Excel was used to plot graphs to show trends where appropriate. The PFLA was performed with three replications per treatment. Two-dimensional principal component analysis (2-D PCA) biplots was conducted using XLSTATS (Addinsoft Inc., Paris, France). Treatment group comparison analysis at α = 0.05 was performed.
3. Results and Discussion
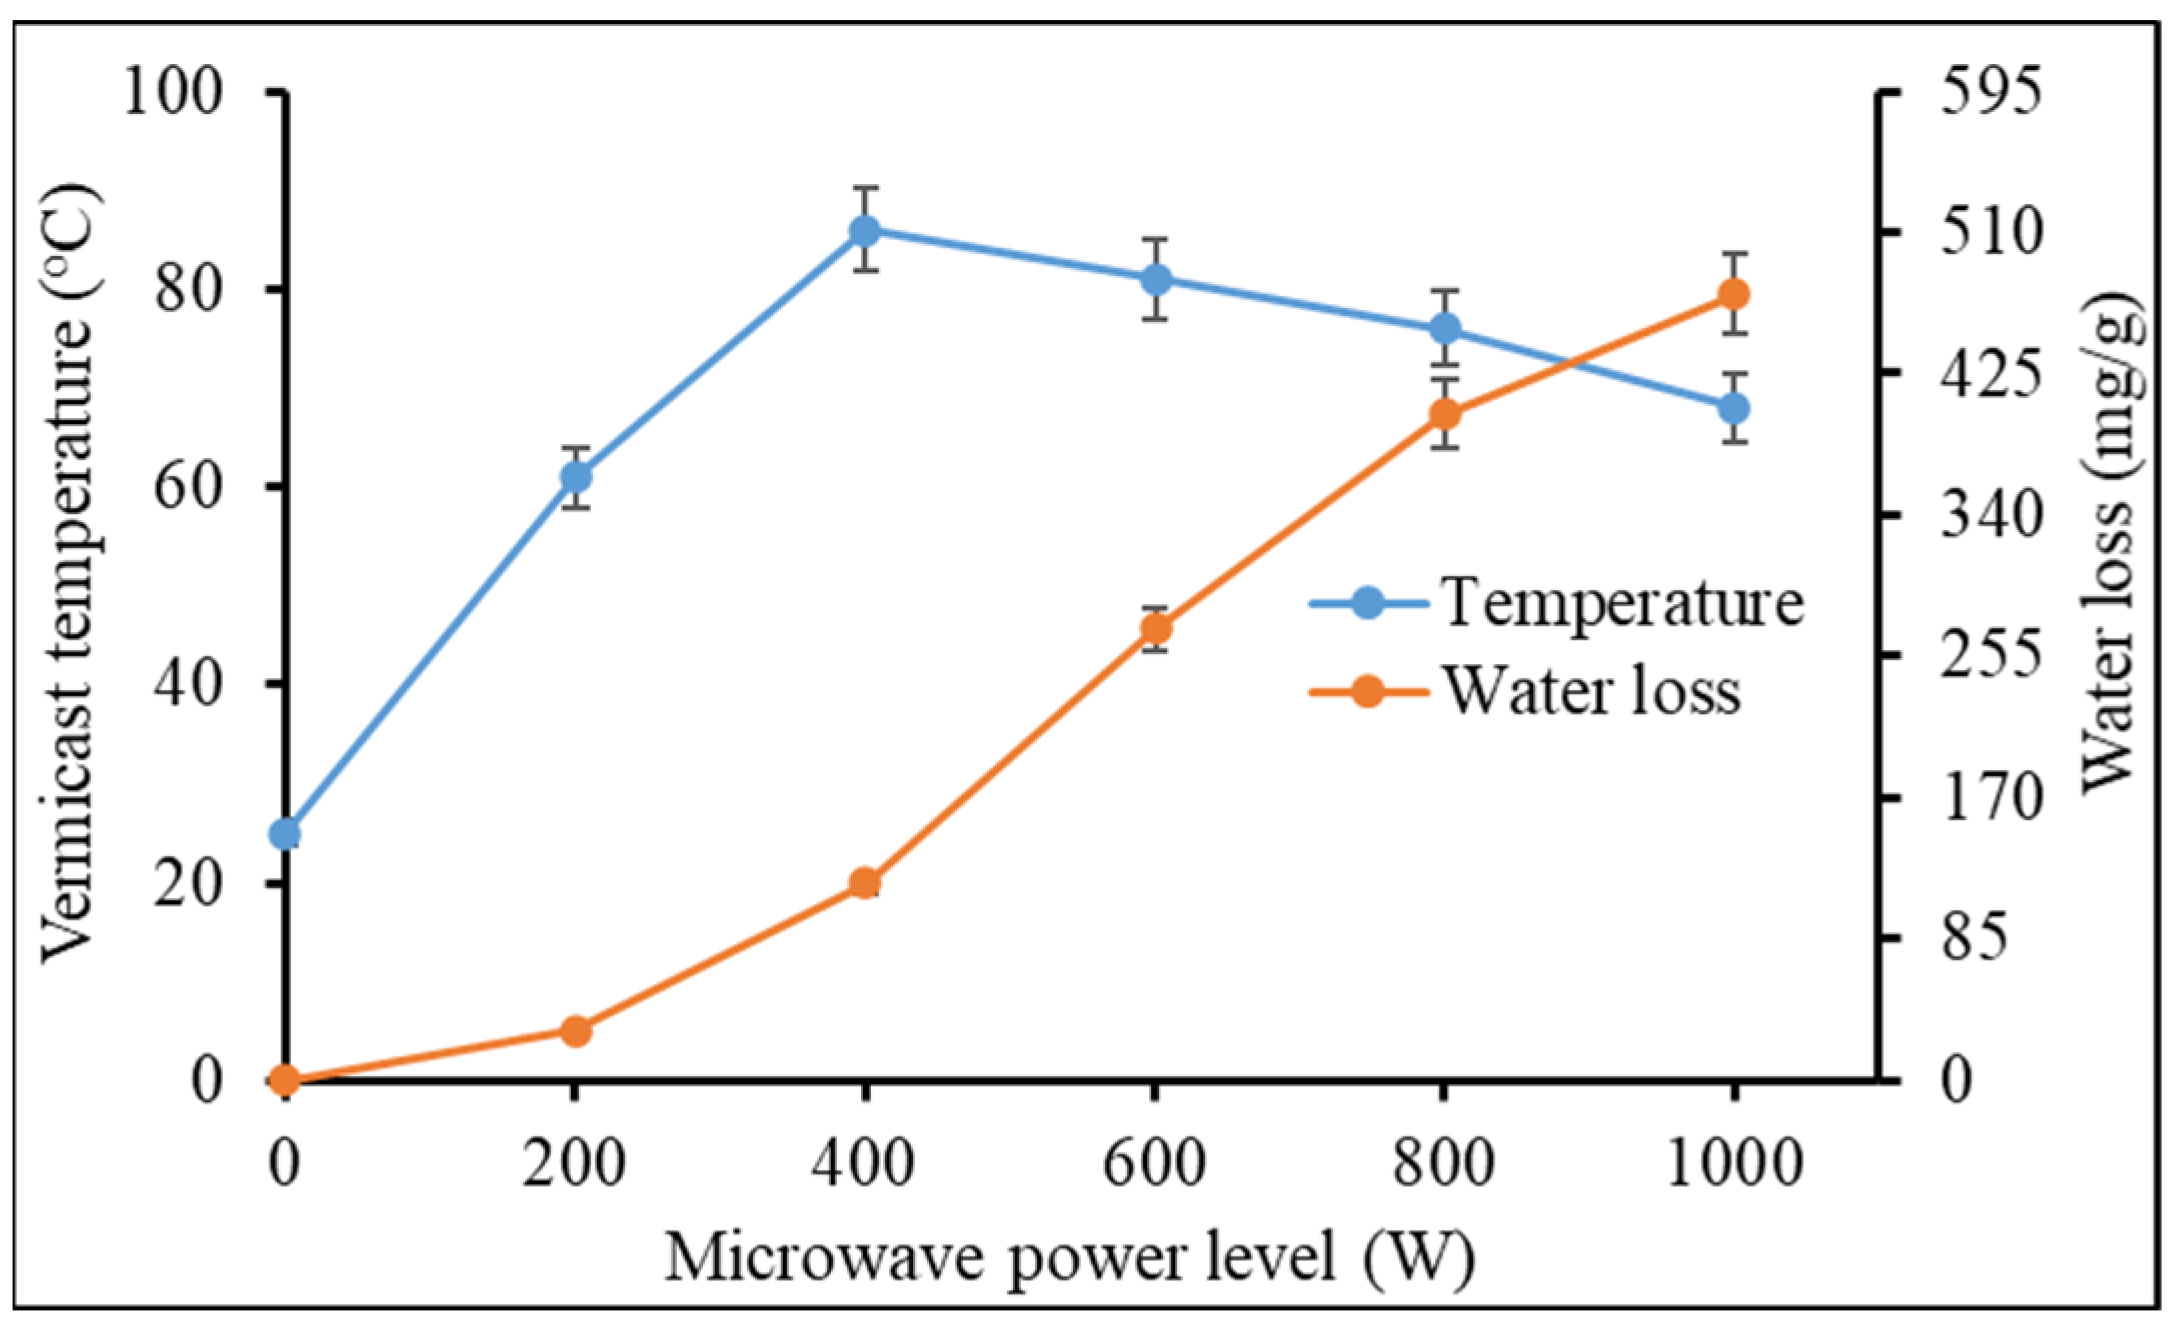
Heat accumulation in the vermicast granules began immediately from the time of exposure to microwave irradiation and rose from 25 °C at 0 W (i.e., fresh, moist vermicast as control) to a peak of 86 °C at 400 W (
Figure 1). After the peak, the temperature of the vermicast granules declined gently to 68 °C at 1000 W, which Abbey et al. [
12] ascribed to a reduction in vermicast moisture content as the microwave power level was increased. Like soil particles, vermicast granules is surmised to have macro- and micro-pores. Most of the free water on the surface and within macro-pores of the vermicast granules seemed to have dissipated at an exponential rate from the 200 W power level (
Figure 1). Water loss increased by ca. 1218.4% at 800 W compared to water loss at 200 W. Water loss (
ca. 18.2%) from micro-pores ensued between 800 W and 1000 W treatments. The operation of the microwave is dependent on rapid movement of water (polar) molecules in the vermicast that generated heat [
16,
18]. Therefore, the reduction in water content at 1000 W remarkably reduced heat accumulation in the vermicast.
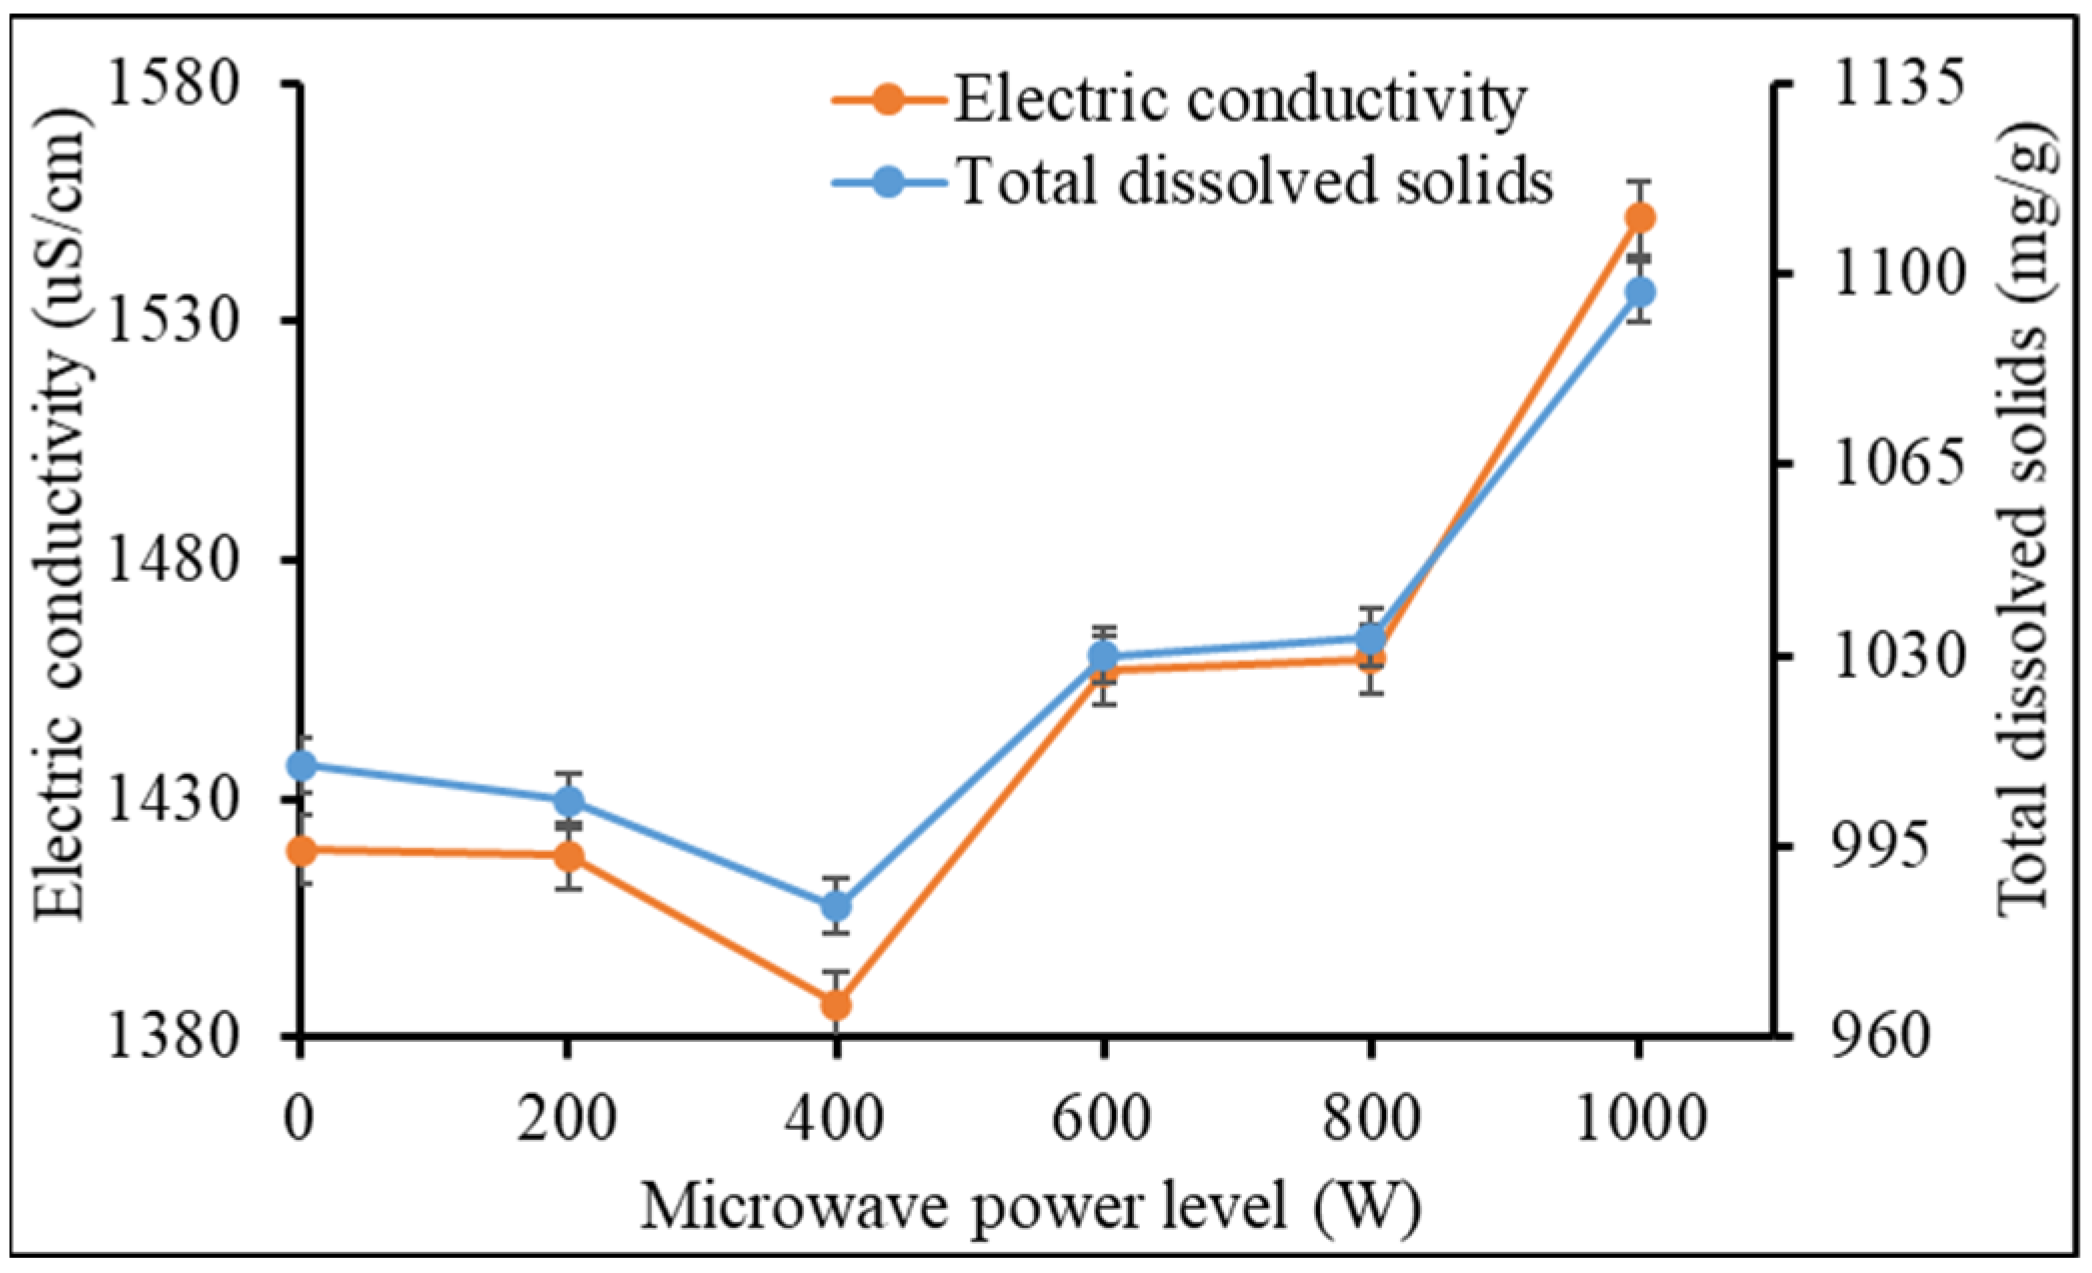
Heat accumulation and water activities can affect the physical and chemical properties of organic media. According to Abbey et al. [
12], the crystalline structure and chemical properties of vermicast can be altered by high temperature leading to volatilization and reductions in chemical activity and/or solubility. In the present study, total dissolved solids, which may include dissolved organic matter and ash, was increased by increasing the microwave power level (
Figure 2).
Ash contains mineral elements that can be ionized in water. Extreme microwave power level can cause microbial disintegration and cell leakage [
25,
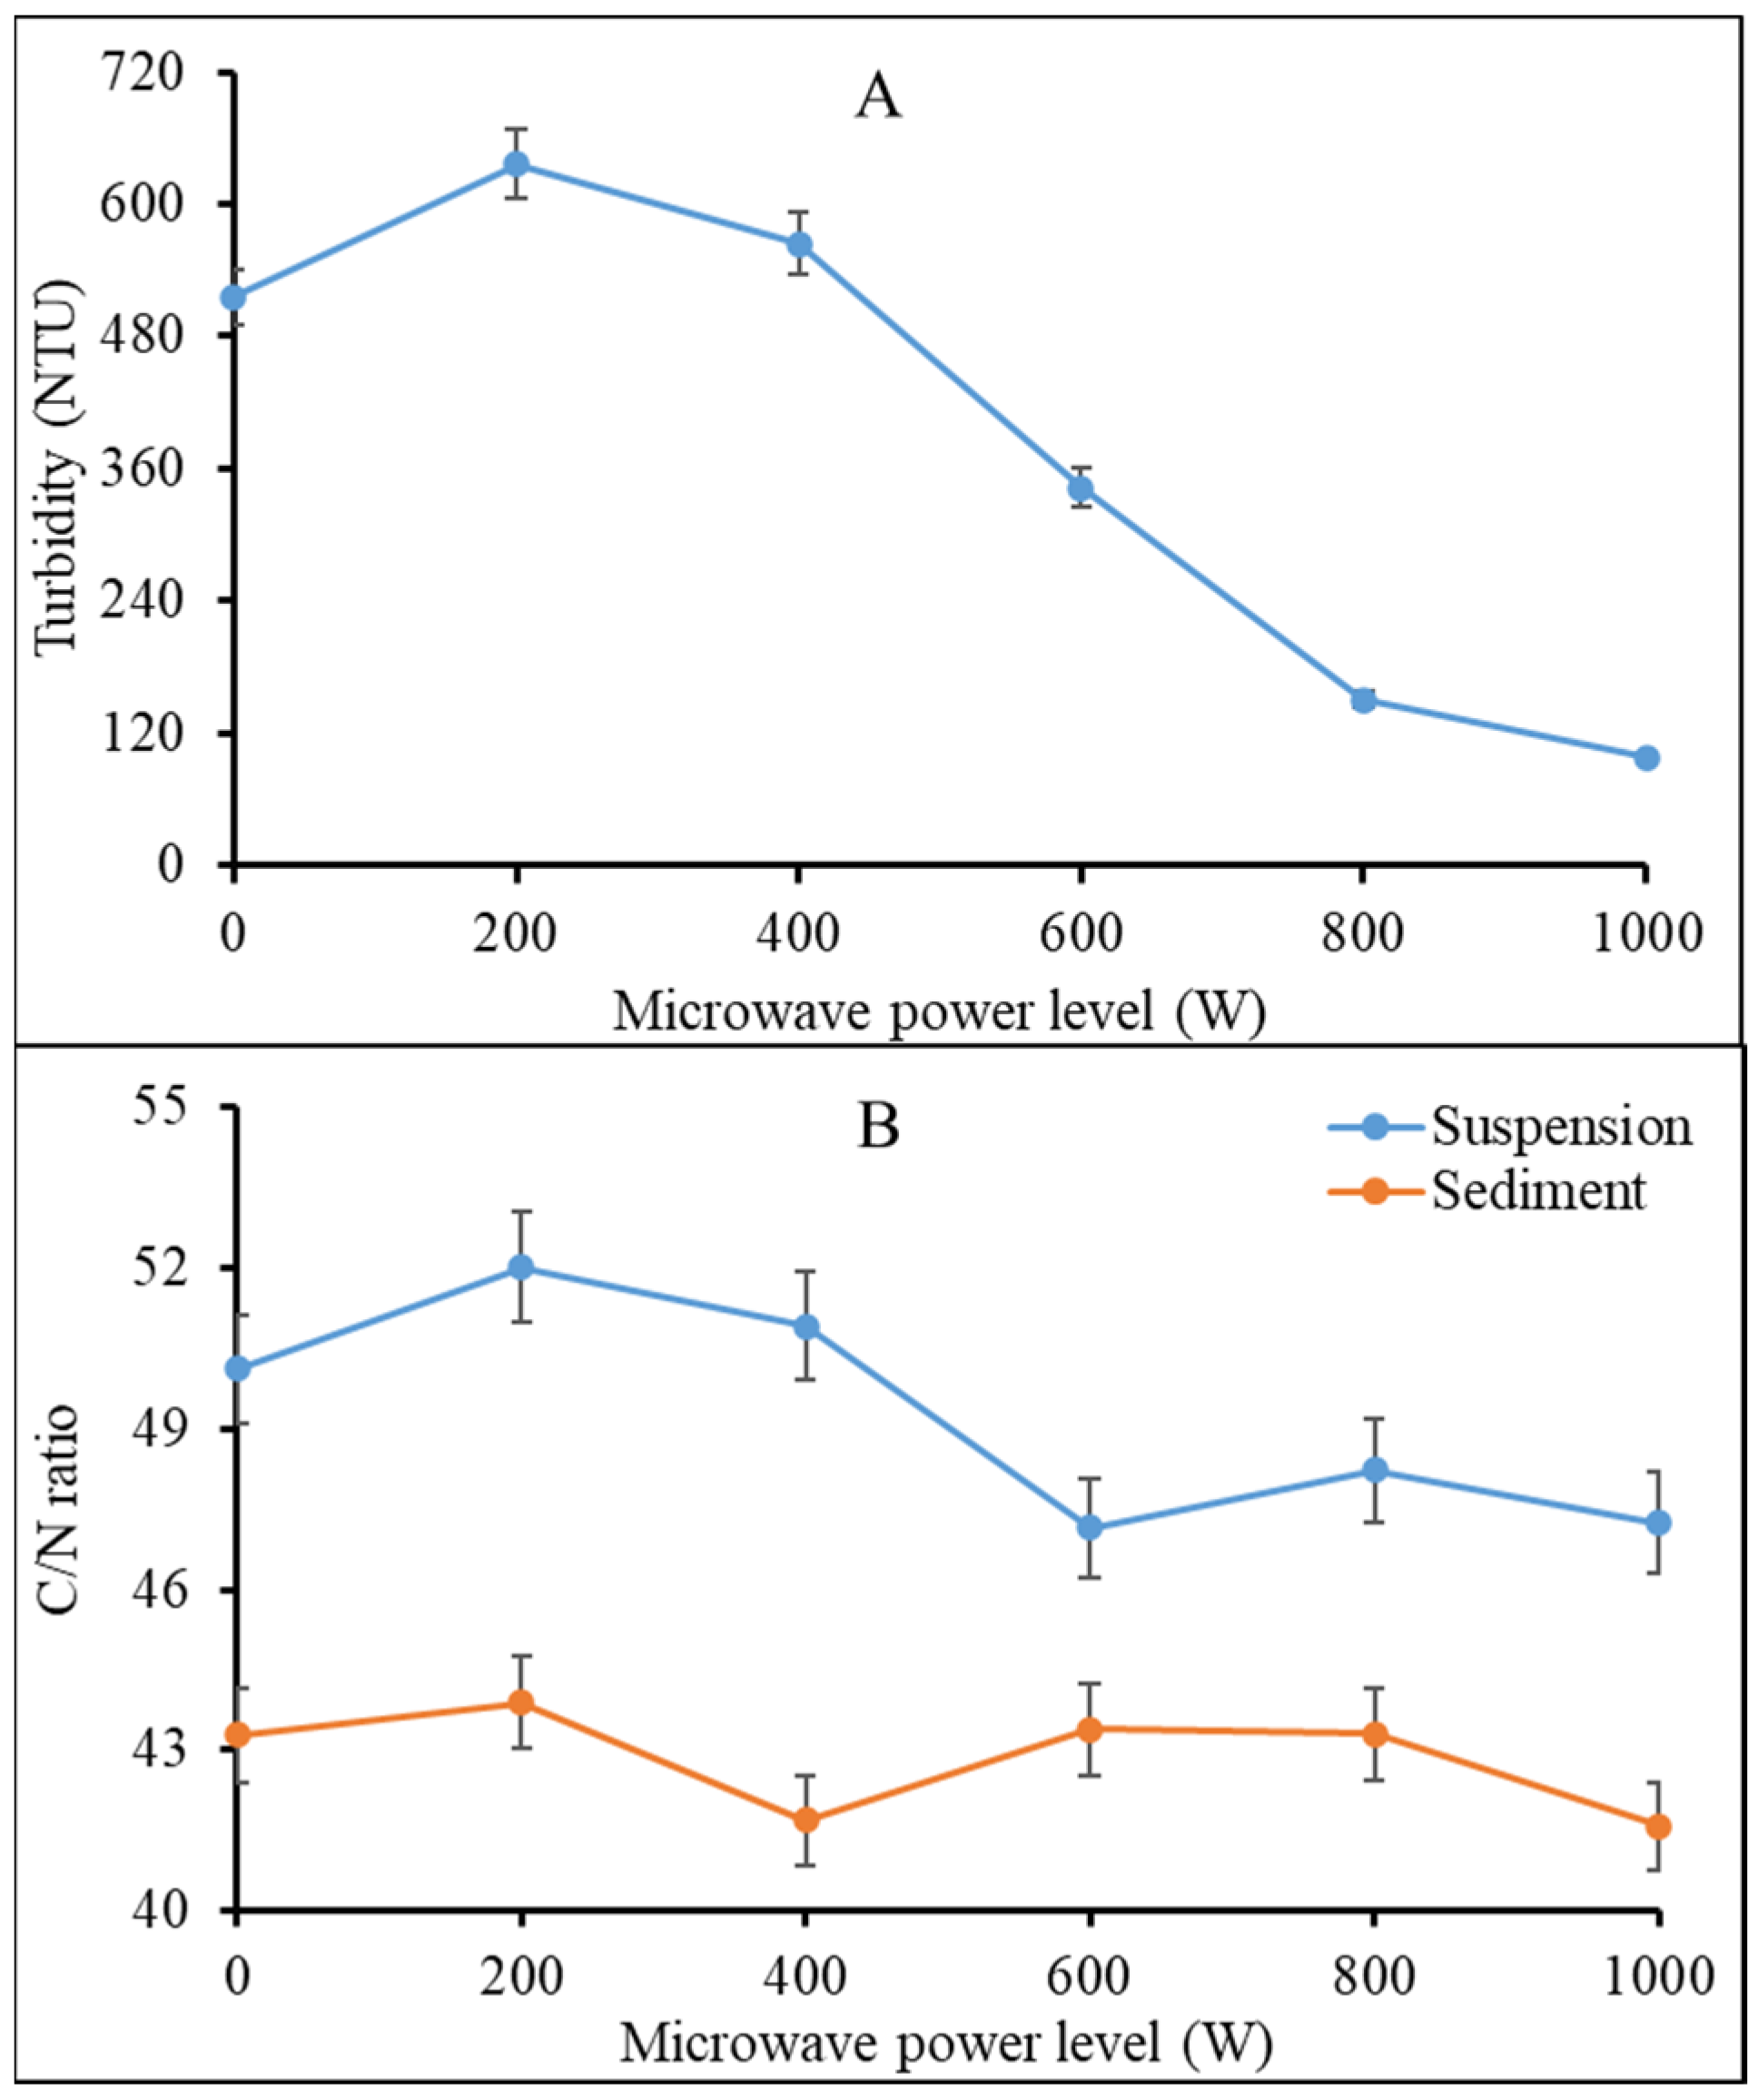
26] and thermal hydrolysis of macromolecules including proteins, nucleic acids, carbohydrates, and lipids. The products from these breakdowns might have increased the ionic concentration of the liquefied microwaved vermicast leading to a sharp increase in total dissolved solids and electric conductivity at ≥400 W. There was a slight but insignificant reduction pH of the liquefied vermicast as the power level was increased from 0 (pH = 6.42) to 1000 W (pH = 6.14) (data not presented). Turbidity of the liquefied vermicast increased between 0 and 200 W due to increased dissolution of particulate matter (
Figure 3A). However, the trend reversed exponentially as the microwave power level was raised above 200 W. This can be attributed to intense heat generation by the microwave that caused charring of organic matter in the vermicast and, consequently, a reduction in turbidity of the liquefied microwaved vermicast. The work of Mong et al. [
13] can explain this finding. They used microwave technology to pyrolyze horse manure and obtained charred waste product.
Figure 3B gives an idea of structural changes in microwaved vermicast, which needs further investigation. Carbon which gives structure to all organic matter including vermicast was higher at lower power levels (i.e., ≤400 W) but was broken down at higher power levels (i.e., ≥600 W).
The C:N ratio of the suspended particles in vermicast microwaved at 200 W, 400 W and the control were high but declined and stabilized from 600 W to 1000 W (
Figure 3B). On the other hand, the C/N ratio of the sediments remained similar for 0–800 W, but dipped at 1000 W. Furthermore, there was a consistent increase in vermicast N, K, Ca and Na contents by ca. 77.1%, 10.4%, 27% and 16.3%, respectively, as microwave power level was increased from 0 to 1000 W (
Figure 4A,B). The total dissolved solids and electric conductivity of the vermicast in
Figure 3, which are often used as estimators of growing media fertility status aligned with the trends in vermicast N, K, Ca and Na in
Figure 4A,B. Although only N, K, Ca, and Na were determined, it is likely many of the other elements in the vermicast were enhanced by the microwave irradiation as well.
Vermicast is enriched with beneficial microbial populations as the feedstock is ingested and passes down the gut of earthworms and excreted. As such, the diversity and abundance of active microbial groups are important determinant of the quality and efficacy of vermicast. In the present study, a total of 26 PFLAs were found and used as biomarkers to assess active microbial groups in the different vermicast treatments (
Table 1) as reported by Zelles [
27] and Lin et al. [
20].
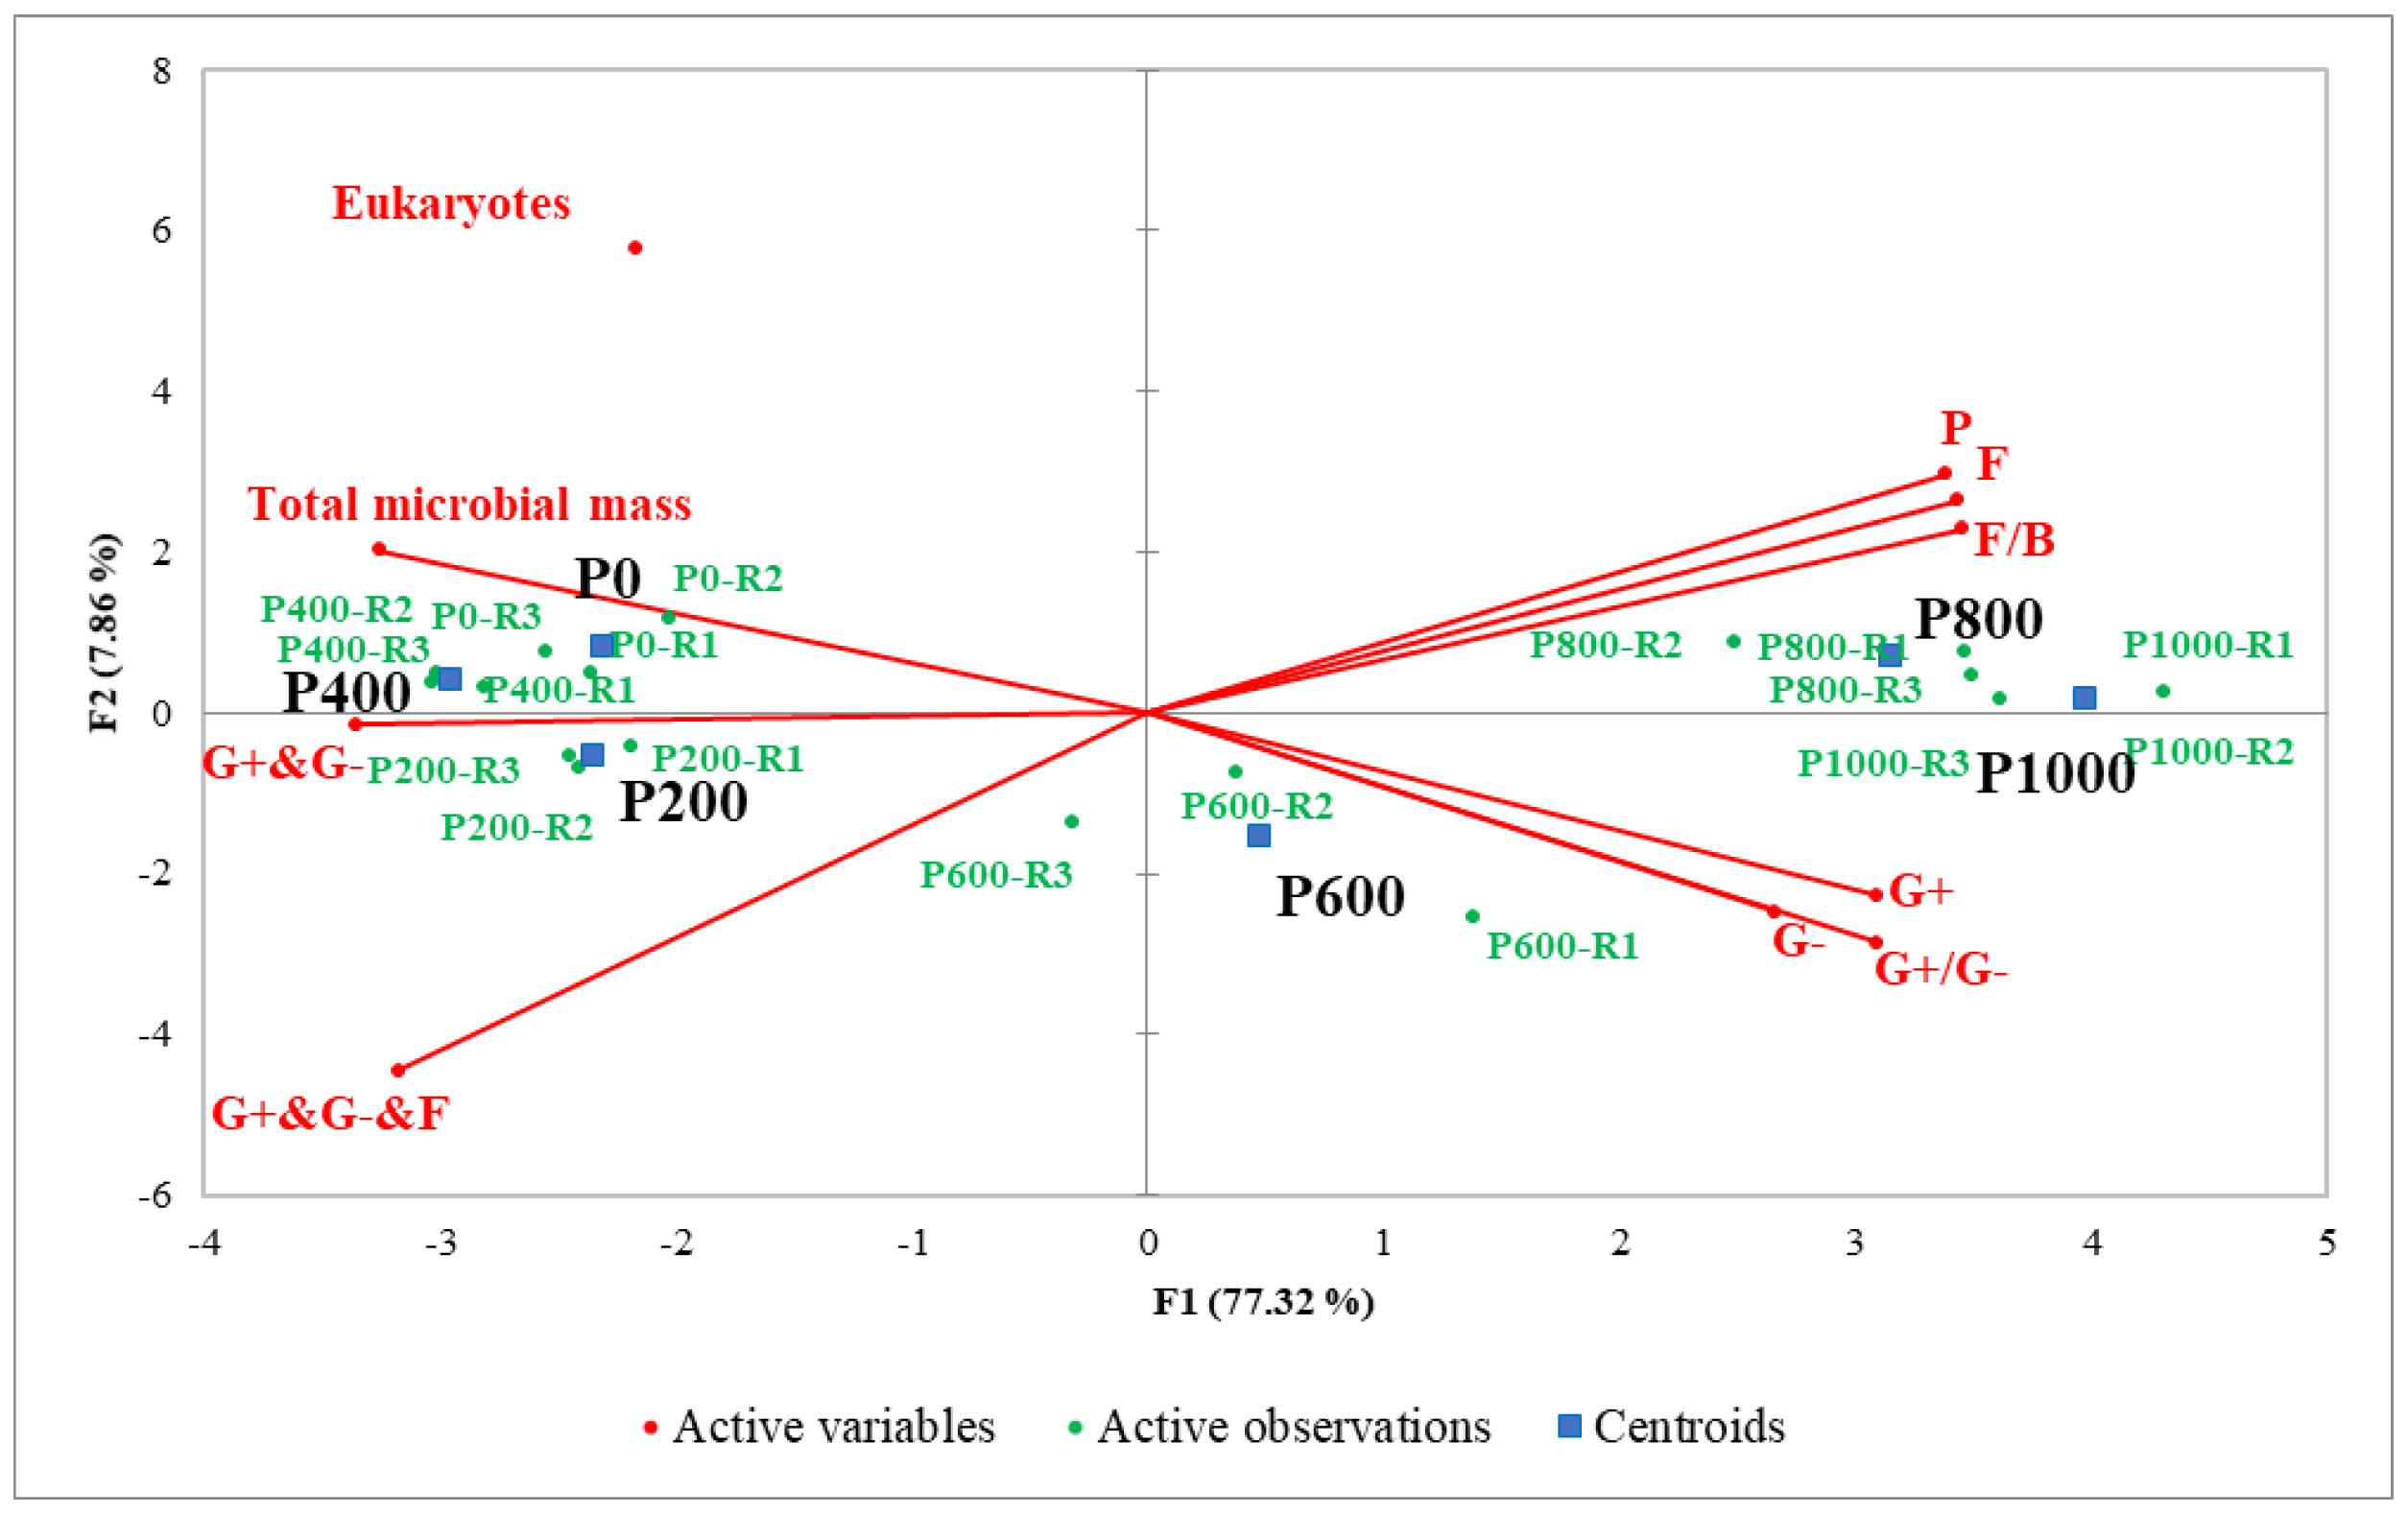
Six microbial groups i.e., Gram-positive (G+), Gram-negative (G−), G + G−, fungi, protozoa, and eukaryotes were present in the different vermicast treatments based on the standard community structure method reported by Hedrick et al. [
28]. The 2D-PCA biplot in
Figure 5 explains ca. 85% of the total variability in dataset, and the association between the active microbial groups and the different microwaved vermicast treatments. Vermicast treated at microwave power levels 600 W, 800 W, and 1000 W can be associated with high numbers of protozoa, G+, G−, G + G− bacteria and fungi compared to the other treatments. This result suggested that the higher the microwave power level, the greater abundance of the active protozoa, fungi, and bacteria groups in the vermicast. Furthermore, the ratios of fungi/bacteria and G+/G− in the vermicast remarkably increased when microwave power level was ≥800 W. On the other hand, the control (0 W), 200 W, and 400 W treated vermicast can be associated with higher eukaryotes. However, the trend for the total microbial mass was 200 W = 400 W > 0 W > 600 W = 800 W = 1000 W. As expected, it seemed total microbial mass increased at lower power levels i.e., 0–400 W due to the low impact of microwave irradiation on the presented vermicast. It can be surmised that as the power level was increased to >600 W, thermophilic microbes survived in the vermicast and/or the killing of some microbes gave way to others to dominate. Moreover, the increase in total bacterial (G+ and G−) and total bacterial and fungi (G+ and G− and F) groups can be associated with vermicast treated at lower power level of ≤400 W (
Figure 5). Therefore, microwave irradiation disintegration of microbial cells and organic matter, and thermal transformation of macromolecules at high microwave power level culminated in the increased vermicast nutrients and conductivity (
Figure 3 and
Figure 4). The microwave effect on vermicast led to a differential response of kale ‘Red Russian’ as presented below.
The anthocyanin and chlorophyll contents of the kale leaves were significantly (
p = 0.01) increased with the application of microwaved vermicast (
Table 2). For anthocyanin, the increment was ca. 23.5% and ca. 13.7%; and for chlorophyll, it was ca. 13.8% and
ca. 11.9% for the 400 W and 600 W treated vermicast, respectively, compared to the control. There were no significant (
p > 0.05) differences in anthocyanin and chlorophyll among the other microwave treatments. According to Mielke et al. [
29], a strong positive exponential relationship exists between SPAD value of leaf greenness and their Chl a and Chl b contents as found for kale in the present study (
Table 2). Similarly, kale leaf tissue carotenoids content was increased by growing in vermicast microwaved at 400 W or 600 W and was significantly (
p = 0.001) reduced by the 800 W and 1000 W treatments (
Table 2). The control and 200 W effects on carotenoids were intermediate. Thus, kale leaf pigmentation did not vary significantly (
p > 0.05) and were higher for the 400 W and 600 W treatments. Leaf pigments such as carotenoids, anthocyanin and chlorophyll are essential for photosynthesis, plant health and growth [
30]. For instance, carotenoids serve as photoprotectors of the photosynthetic apparatus and light-harvesting pigment in situations where the light-capturing capacity of chlorophylls in the visible spectrum is compromised [
31].
Stomatal conductance of the kale leaves ranged between 0.11–0.14 mol/m
2/s and was not significantly (
p > 0.05) different between the different microwave power levels (
Table 2). However, there were slight increases in stomatal conductance of kale plants grown in vermicast microwaved at 400 W followed by the 600 W. Transpiration and photosynthesis rates were increased by an average of 15.7% and 18.7%, respectively, for plants grown in the vermicast treated at 400 W or 600 W compared to the average for the control, 200 W, 800 W and 1000 W (
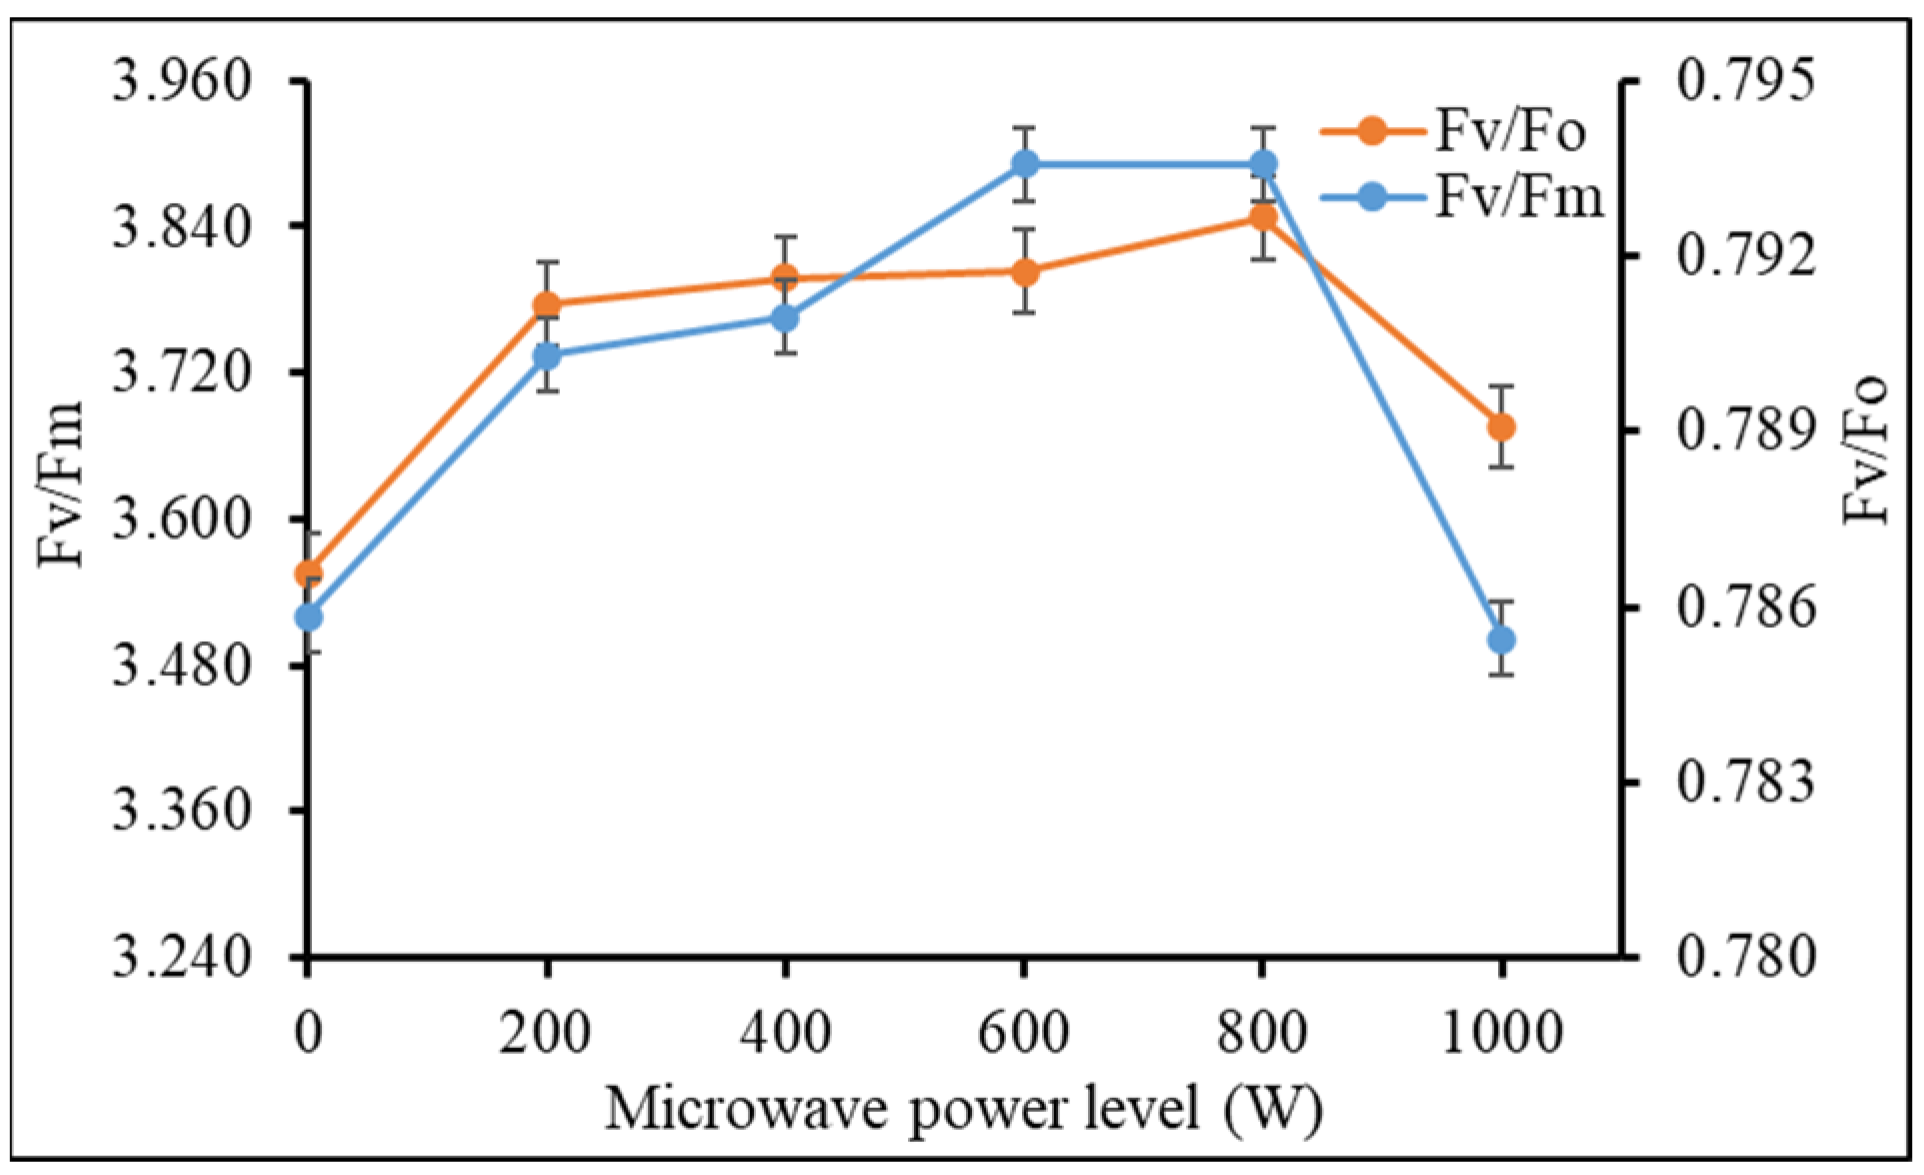
Table 2). Chlorophyll fluorescence indices were analyzed to better understand how microwave vermicast impact the photosynthetic apparatus. After 28 days of transplanting, it was found that maximum quantum yield or efficiency of Photosystem II (Fv/Fm) and potential photosynthetic capacity (Fv/Fo) in kale leaves increased as microwave power level used to treat the vermicast increased up to 800 W before declining at 1000 W (
Figure 6). Fv/Fm and Fv/Fo values were similarly high for the 400 W, 600 W and 800 W seconded by treatment 200 W, and similarly low for the control and 1000 W treatments. The chlorophyll fluorescence indices confirm the trend in the photosynthesis rate.
The physiological responses of kale plants grown in vermicast microwaved at 400 W and 600 W have been consistent (
Table 2 and
Figure 6) and therefore they were expected to be healthy and more productive. The height of kale plants applied with vermicast treated at 400 W was significantly (
p = 0.043) highest followed by treatments 600 W and 1000 W, which were not statistically (
p > 0.05) different from the former (
Table 2). Plant heights were similar in the control, 200 W and the 800 W microwaved vermicast. Final harvest weight of the edible leaves of kale ‘Red Russian’ differed significantly (
p = 0.020) with variations in microwave power level (
Table 2). The overall best performing treatment can be ascribed to the 400 W microwaved vermicast, although the final yield was not statistically (
p > 0.05) different from those of the 200 W and the 600 W. This conforms to the conclusion reached by Abbey et al. [
12] for Chinese cabbage. That is, the yield of kale grown in the 400 W microwaved vermicast was 8.8% higher than the average for plants in the 200 W and the 600 W microwaved vermicast. Additionally, yield did not vary between plants grown in the 0 W, 800 W and 1000 W treated vermicast, and the average was ca. 23.1% less than that for the 400 W.


