1. Introduction
According to the WHO, over 55% of the world’s population lives in urban areas, and this is set to rise to 68% by 2050 [
1]. Urban road traffic creates a range of threats, including injuries, air and noise pollution, and barriers to safe physical activity. The World Economic Forum estimated 42% of the 105,000 road traffic deaths recorded annually in the 56 countries of the UNECE region occur in built-up areas (2017) [
2]. Mobility also stands as a problematic matter regarding the social inclusion of disadvantaged groups that can be deprived of such an important aspect of human well-being.
In 2021, the average expenditure for transportation (internal costs) was 1970 EUR per capita in EU-27 and 2100 EUR per capita in Italy [
3,
4]. In 2019, the share of household expenditure destined to satisfy mobility needs in Europe was estimated at about 13.2% and has grown by 4% in the last 10 years. In Italy, it has a similar trend, having grown by 3.2%. In particular, the expenditure for the purchase of private vehicles increased by 3% since 2010, while the one for its running costs decreased by 3%. Finally, the expenditure for the purchase of transportation services was reduced by a quarter.
In Europe, over 60% of citizens live in urban areas of over 10,000 inhabitants, and their mobility accounts for 40% of all CO
2 emissions of road transport. The external costs for passenger road transport, according to the European Handbook on External Costs of Transport (HB) [
5], amount to around EUR 625 billion in Europe (2016 value). A total of 38% of these costs are attributable to accidents and 32% to congestion, which is almost entirely (amounting to 90%) caused by passenger cars. Congestion in the EU is often located in and around urban areas and costs nearly EUR 100 billion, or 1% of the EU’s GDP annually [
6].
Commuting plays a key role in urban mobility as it significantly affects the overall traffic volume and, consequently, the quality of life in modern societies.
According to the data collected by ISFORT (
www.isfort.it, accessed on 7 May 2023) in the annual survey on the mobility habits of Italian citizens, travel on weekdays for study and work reasons accounted for 36.6% in 2019 and reached 44.7% for the number of extra-urban trips [
7].
Italian commuters travel mainly by car and motorbike: around 70% in 2019, as collected by an ISTAT (
www.istat.it, accessed on 7 May 2023) survey [
8]; 33% of students are driven to school/university [
9].
Commuters and students travel at the same hours; thus, they are the main contributors to traffic congestion. The management of such movements can significantly reduce road transport impacts.
Furthermore, in recent years, the arising of alternative work locations (such as shared workplaces that are neither the office nor home), the introduction of smart working and teleworking, and the increased flexibility in working hours have made it particularly challenging to understand the commuting mobility patterns [
10,
11,
12,
13,
14].
For this reason, several research works are now focused on modeling home-to-work dynamics [
15,
16,
17], as well as developing methodologies to effectively plan and optimize specific transportation solutions [
18].
Further research analyzed the sustainability of specific commuting modes, such as public transport [
19,
20], carsharing [
21] and bike sharing [
22], carpooling [
23], and active modes (walking and cycling) in comparison to private cars [
24]. Moreover, the authors of [
25,
26] have directed their attention towards investigating the reasons for modal choice in home-to-work travels. Eventually, a comprehensive literature review adopting a multi-perspective approach was given in [
27], with the aim of exploring statistical trends in commuting behaviors sourced from the literature on transport, planning, geography, economics, psychology, sociology, and medicine.
Within this broader context, numerous initiatives have also been undertaken by governments, corporations, and individuals to promote sustainable commuting and mitigate the energy and environmental consequences of travel [
28,
29,
30]. In this view, it is crucial to design tailored methodologies and tools for both the ex ante investigation of travel patterns and needs of employees and the ex post evaluation of the implemented strategies.
For example, in [
31], the author analyzed the attitude of 352 small Oxfordshire firms towards staff travel and green commuter plans, suggesting that larger firms are more likely to apply effective actions in the short term. Additionally, the authors in [
32] applied a combination of real-time monitoring and time-integrated techniques to estimate the dose of various pollutants inhaled by commuters in the metropolitan area of Milan, Italy. In [
33], the authors introduced a system that aims to assess the effectiveness of corporate mobility as a service (CMaaS) in Sweden. This system involves the identification of key performance indicators (KPIs) and the provision of feedback to companies. Additionally, ref. [
34] focused on carrying out cost-effective shared transport models for female corporates in developing countries, specifically conducting a case study on 132 corporations in Dhaka, Bangladesh. The time and cost of the service are shared between corporates during morning and evening peak hours, while multiple services such as healthcare and the delivery of social goods are also provided in the remaining time. Lastly, ref. [
35] presented preliminary findings related to an on-demand shared ride-hailing commuting service in Barcelona. The study highlighted the positive feedback from users regarding service comfort while also addressing the challenge of striking a fair compromise between the service’s profitability and the considerably higher price compared to public transport.
Despite the large number of studies, findings in this research field are limited and fragmented, and there is still a lack of exhaustive methodologies for the assessment of commuting services.
This study aims to contribute to bridging this gap by proposing a methodological framework for evaluating home-to-work shuttle services from an energy and environmental perspective. The work includes a real case study of the collective transport service operated in the ENEA “Casaccia” Research Centre before the COVID-19 pandemic. Specifically, we conducted a comprehensive and detailed ex post cost–benefit analysis, considering two alternative scenarios—with and without the shuttle service. The comparison between scenarios was conducted by reconstructing the multi-modal mobility patterns of everyone, enabling us to estimate energy consumption, air pollutant emissions, and costs.
This paper is organized as follows: the remainder of the introduction focuses on the role of the mobility managers, as they are responsible for developing the company’s home-to-work travel plan.
Section 2 describes the adopted methodology to reconstruct the home-to-work travel patterns with and without a shuttle service and to estimate the energy consumption, the polluting emissions, and the monetary costs for both cases. In
Section 3, we describe the ENEA “Casaccia” case study, and in
Section 4, we discuss the main findings together with their implications from an energy and environmental perspective. Finally, conclusions and future research directions are presented in
Section 5.
Mobility Management in Italy
The New European Urban Mobility Framework (811/2021) [
36] was published in 2021, in line with the Green Deal objectives. Between the initiatives to enforce and accelerate the climatic and energetic transition, the framework encourages public and private organizations, such as companies, hospitals, schools, or tourist attractions, to develop mobility management plans and actions that promote low- and zero-emission means of mobility, such as public transport, active mobility, or shared mobility.
In Italian legislation, the role of the ‘Mobility Manager’ (MM) was introduced in 1998 for large companies in polluted cities. In 2020, a new decree of the Minister of Transport and Sustainable Mobility established the mandatory position for smaller companies and schools in municipalities with over 50,000 inhabitants, not only for reducing the negative impacts of transportation but also for social distancing and smart working management in the COVID-19 emergency.
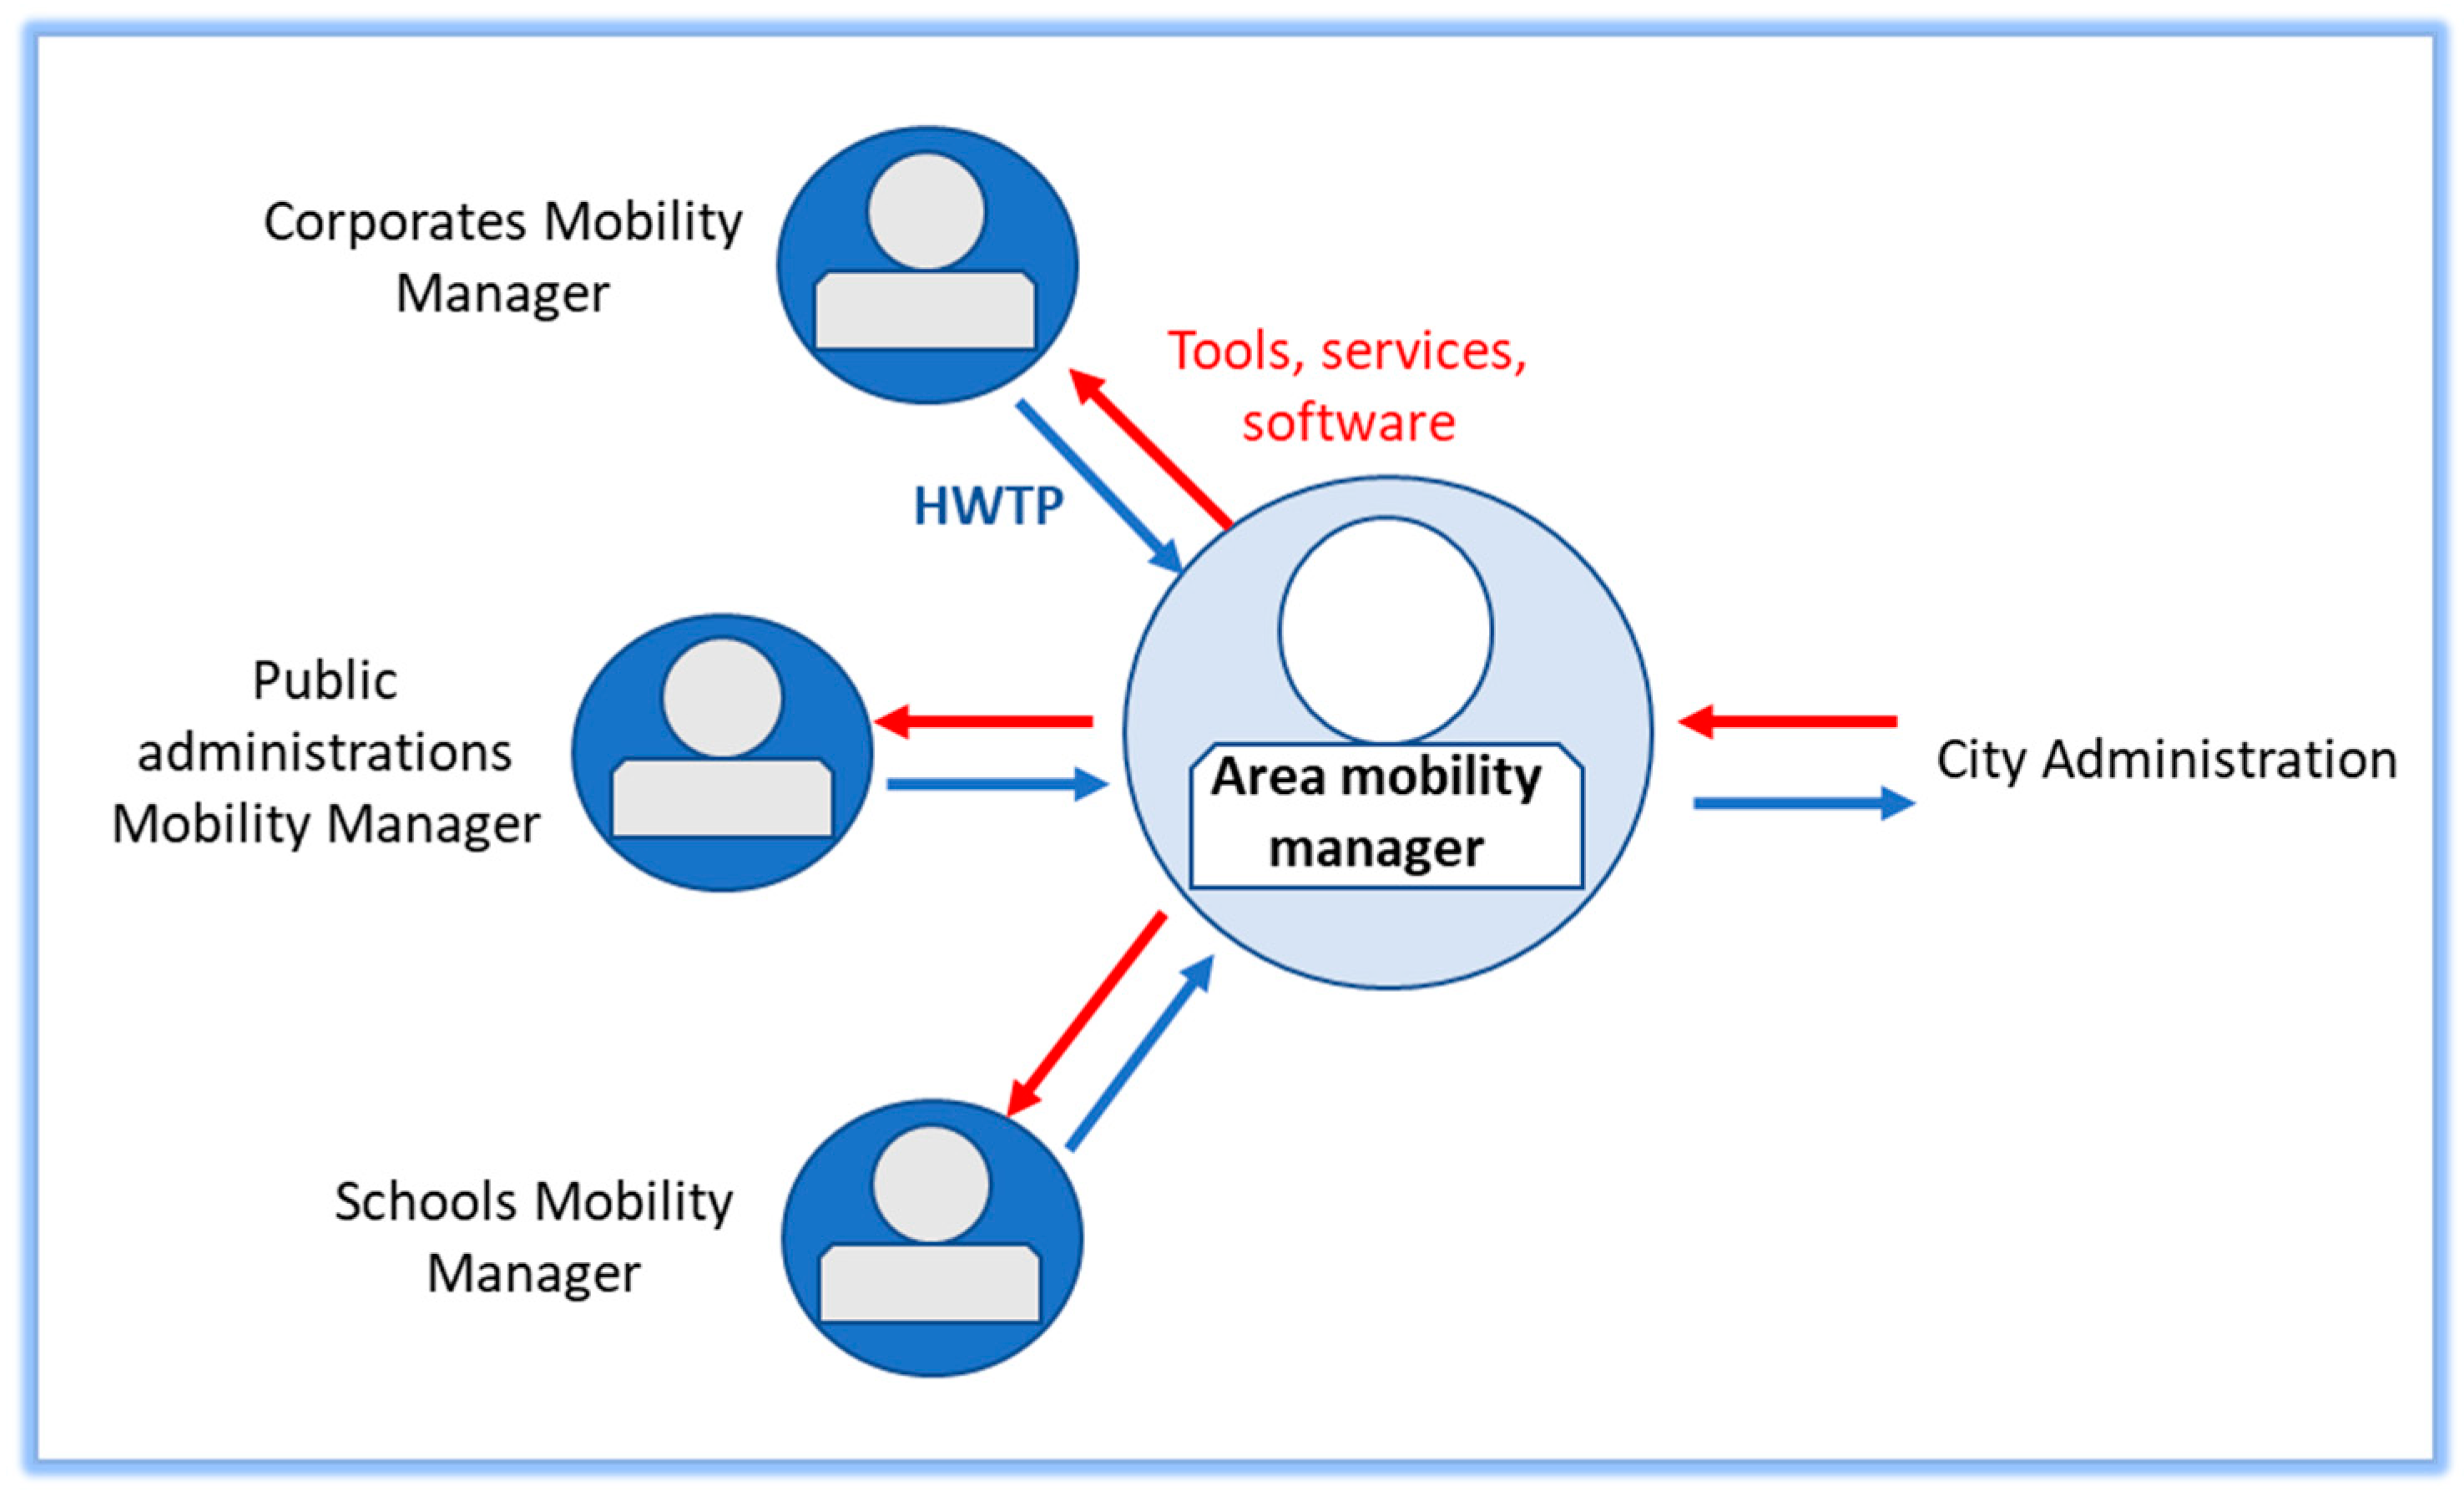
The MM is responsible for preparing and revising the company center’s “Home-to-Work Travel Plan” (HWTP) that sets the framework for the organization of all the employees’ home-to-work journeys by promoting the use of carpooling, car sharing, and collective cabs, as well as public transport, cycling, and walking. The aim is to reduce the use of private transport by giving employees useful information and creating a culture of sustainable mobility in coordination with the high-level mobility manager (so-called “Area MM”) of local administration, who collects all the HWTPs (
Figure 1). He can help corporate MMs to prepare their HWTP by providing support tools, and he can review the public transport supply. He may also provide subsidies for local public transport (LPT) annual passes.
In 2021, a ministerial guideline for preparing the HWTP was published, and for the first time, a EUR 50 million fund has been assigned to support the work of MMs.
2. Methods
With the aim of evaluating the benefits of a home-to-work shuttle service, two scenarios have been built and evaluated: the first one includes the shuttles service, and the second one does not. Shuttle users’ behavior for H–W travels has then been investigated in the two scenarios.
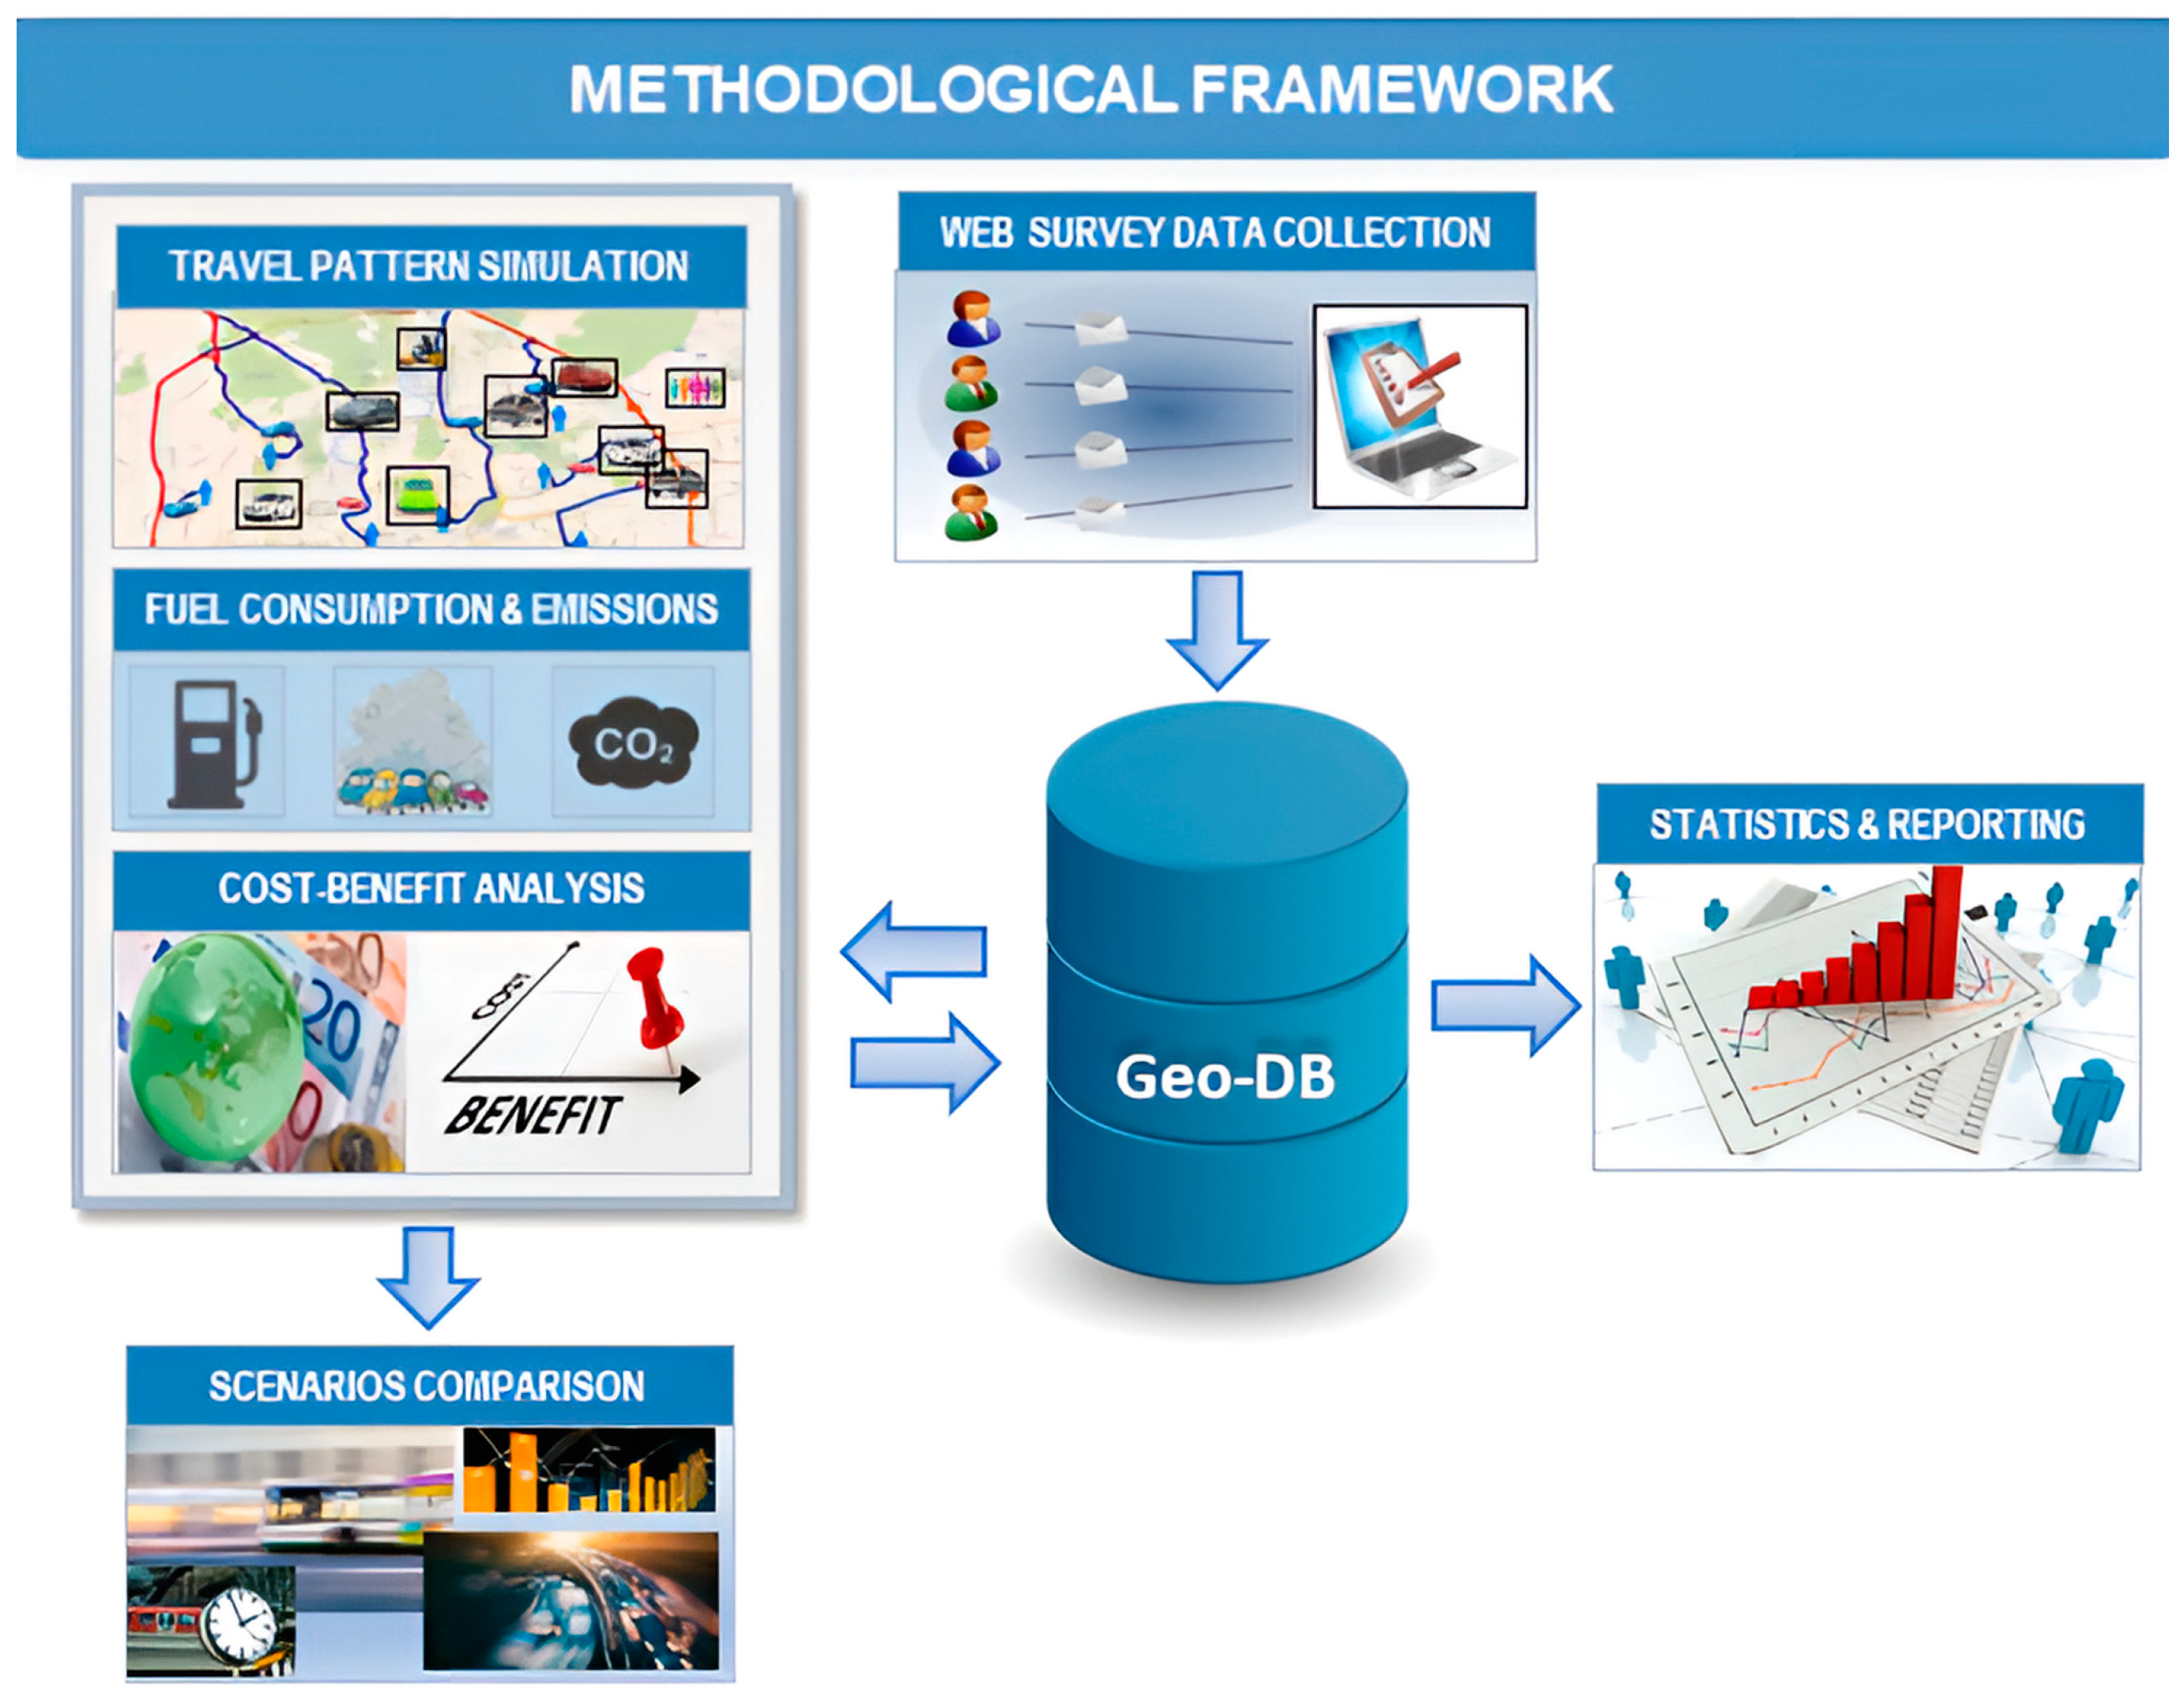
This study, therefore, involves three main tasks (
Figure 2, on the left):
The reconstruction of the individual home-to-work routes on the road network when not using collective transport.
The estimation of energy consumption and pollutant emissions of both private vehicles and shuttles.
The evaluation of environmental and economic benefits achieved by carrying out the service.
For the first task, a survey has been submitted to the employees to acquire the following insights:
Starting location (home).
Use of the company shuttles: selected line, weekly frequency, up/down stop, access mode to stop.
Modal choice carried out as an alternative to collective transport.
Occupancy and characteristics of the own vehicle used for home-to-work travel (fuel supply, registration year, EURO standard, engine size).
Once the employees who use the shuttle service have been selected and their starting points have been acquired, the individual route, and related travel time, have been reconstructed for the different scenarios.
The company manager of the shuttle service provided us with the shuttle itineraries, which included the route from the depot to the first stop. Similar to our previous works [
37,
38], we adopted a graph search algorithm to reconstruct the fastest path on the road network for employees who declared the use of their private vehicles as an alternative to shuttles.
The graph properties allowed us to extract trip distances covered on urban, suburban, and motorway roads and to distinguish them between urbanized and rural areas. This grouping is useful respectively for estimating fuel consumption and pollutants emissions and for computing external costs.
The environmental impacts of LPT services used as an alternative to company shuttles have not been considered, as they do not basically change whether or not Casaccia’s employees use public buses. Vice versa, in order to compare transport performance from an individual point of view, the travel time of home-to-work movements by the LPT services was calculated, acquiring georeferenced information on the bus lines and their attributes (sequence of stops, trip times, frequency of service, etc.). This data can be obtained from open data on public transport, such as train timetables and bus General Transit Feed Specification (GTFS).
Emissions of volatile organic compounds (VOCs), nitrogen oxides (NO
X), particulate matter (PM2.5), and carbon dioxide (CO
2), and fuel consumptions (FCs) are estimated based on the methodology described in the EMEP/EEA emission inventory guidebook (GB) [
39]. As the km driven by cars and coaches are reconstructed, consumptions and VOC, NO
x, and PM2.5 emissions are calculated by multiplying the distances by the factors relative to the specific vehicle, fuel, engine size, and European Emission Standard. The consumption and emission factors (EFs) are distinguished by traffic situations (urban–rural–highway), corresponding to different average speeds. They can be assessed from the EF speed dependence functions derived from measured data collected in a range of scientific programs involving several European laboratories.
Equation (1) is used for the emission estimation of pollutant i for urbanization area k (densely urbanized, all others):
where
= emission factor for vehicle category j (fuel, size, emission standard) and urban, rural, and highway modes [g/km];
= distance traveled by vehicle j in k urbanization areas and urban, rural, and highway modes.
Once the mileage, noxious emissions, and travel time have been estimated, the cost analysis has been carried out, calculating both internal and external costs.
As for the internal costs, investment and running costs of employees’ private cars, LPT fares, and travel time costs have been considered. The internal cost for car users must be evaluated with national-specific information on car model investment and running costs related to an average annual mileage. The internal cost of the scenario that includes shuttle service is simply the cost of the service paid by the employer.
As for the external costs, the Handbook on External Costs [
5,
40] unit values have been adopted. Their discounted values are shown in
Table 1.
The overall external costs produced by single users, for both scenarios, have been estimated by multiplying these values by the following inputs: noxious emissions mass for air pollution and the greenhouse effect, mileages for road congestion, and accidents.
Specifically, for the congestion and safety costs, the mileage must be disaggregated into different traffic situations. In a similar manner, the external costs of local pollutants (NOX, VOC, PM2.5) are dependent on the specific urbanization level (densely urbanized areas and others), so km must be disaggregated for different urbanized areas.
There is no double counting of the costs associated with travel time and those relating to congestion, as the former pertains to individual travelers, while the latter pertains to the community of road users.
Noise impacts have been neglected.
The comparison of the two scenarios may consider, first of all, the reduction in private cars’ mileage and the difference between emissions and energy consumption. Then the costs can be compared.
3. Case Study
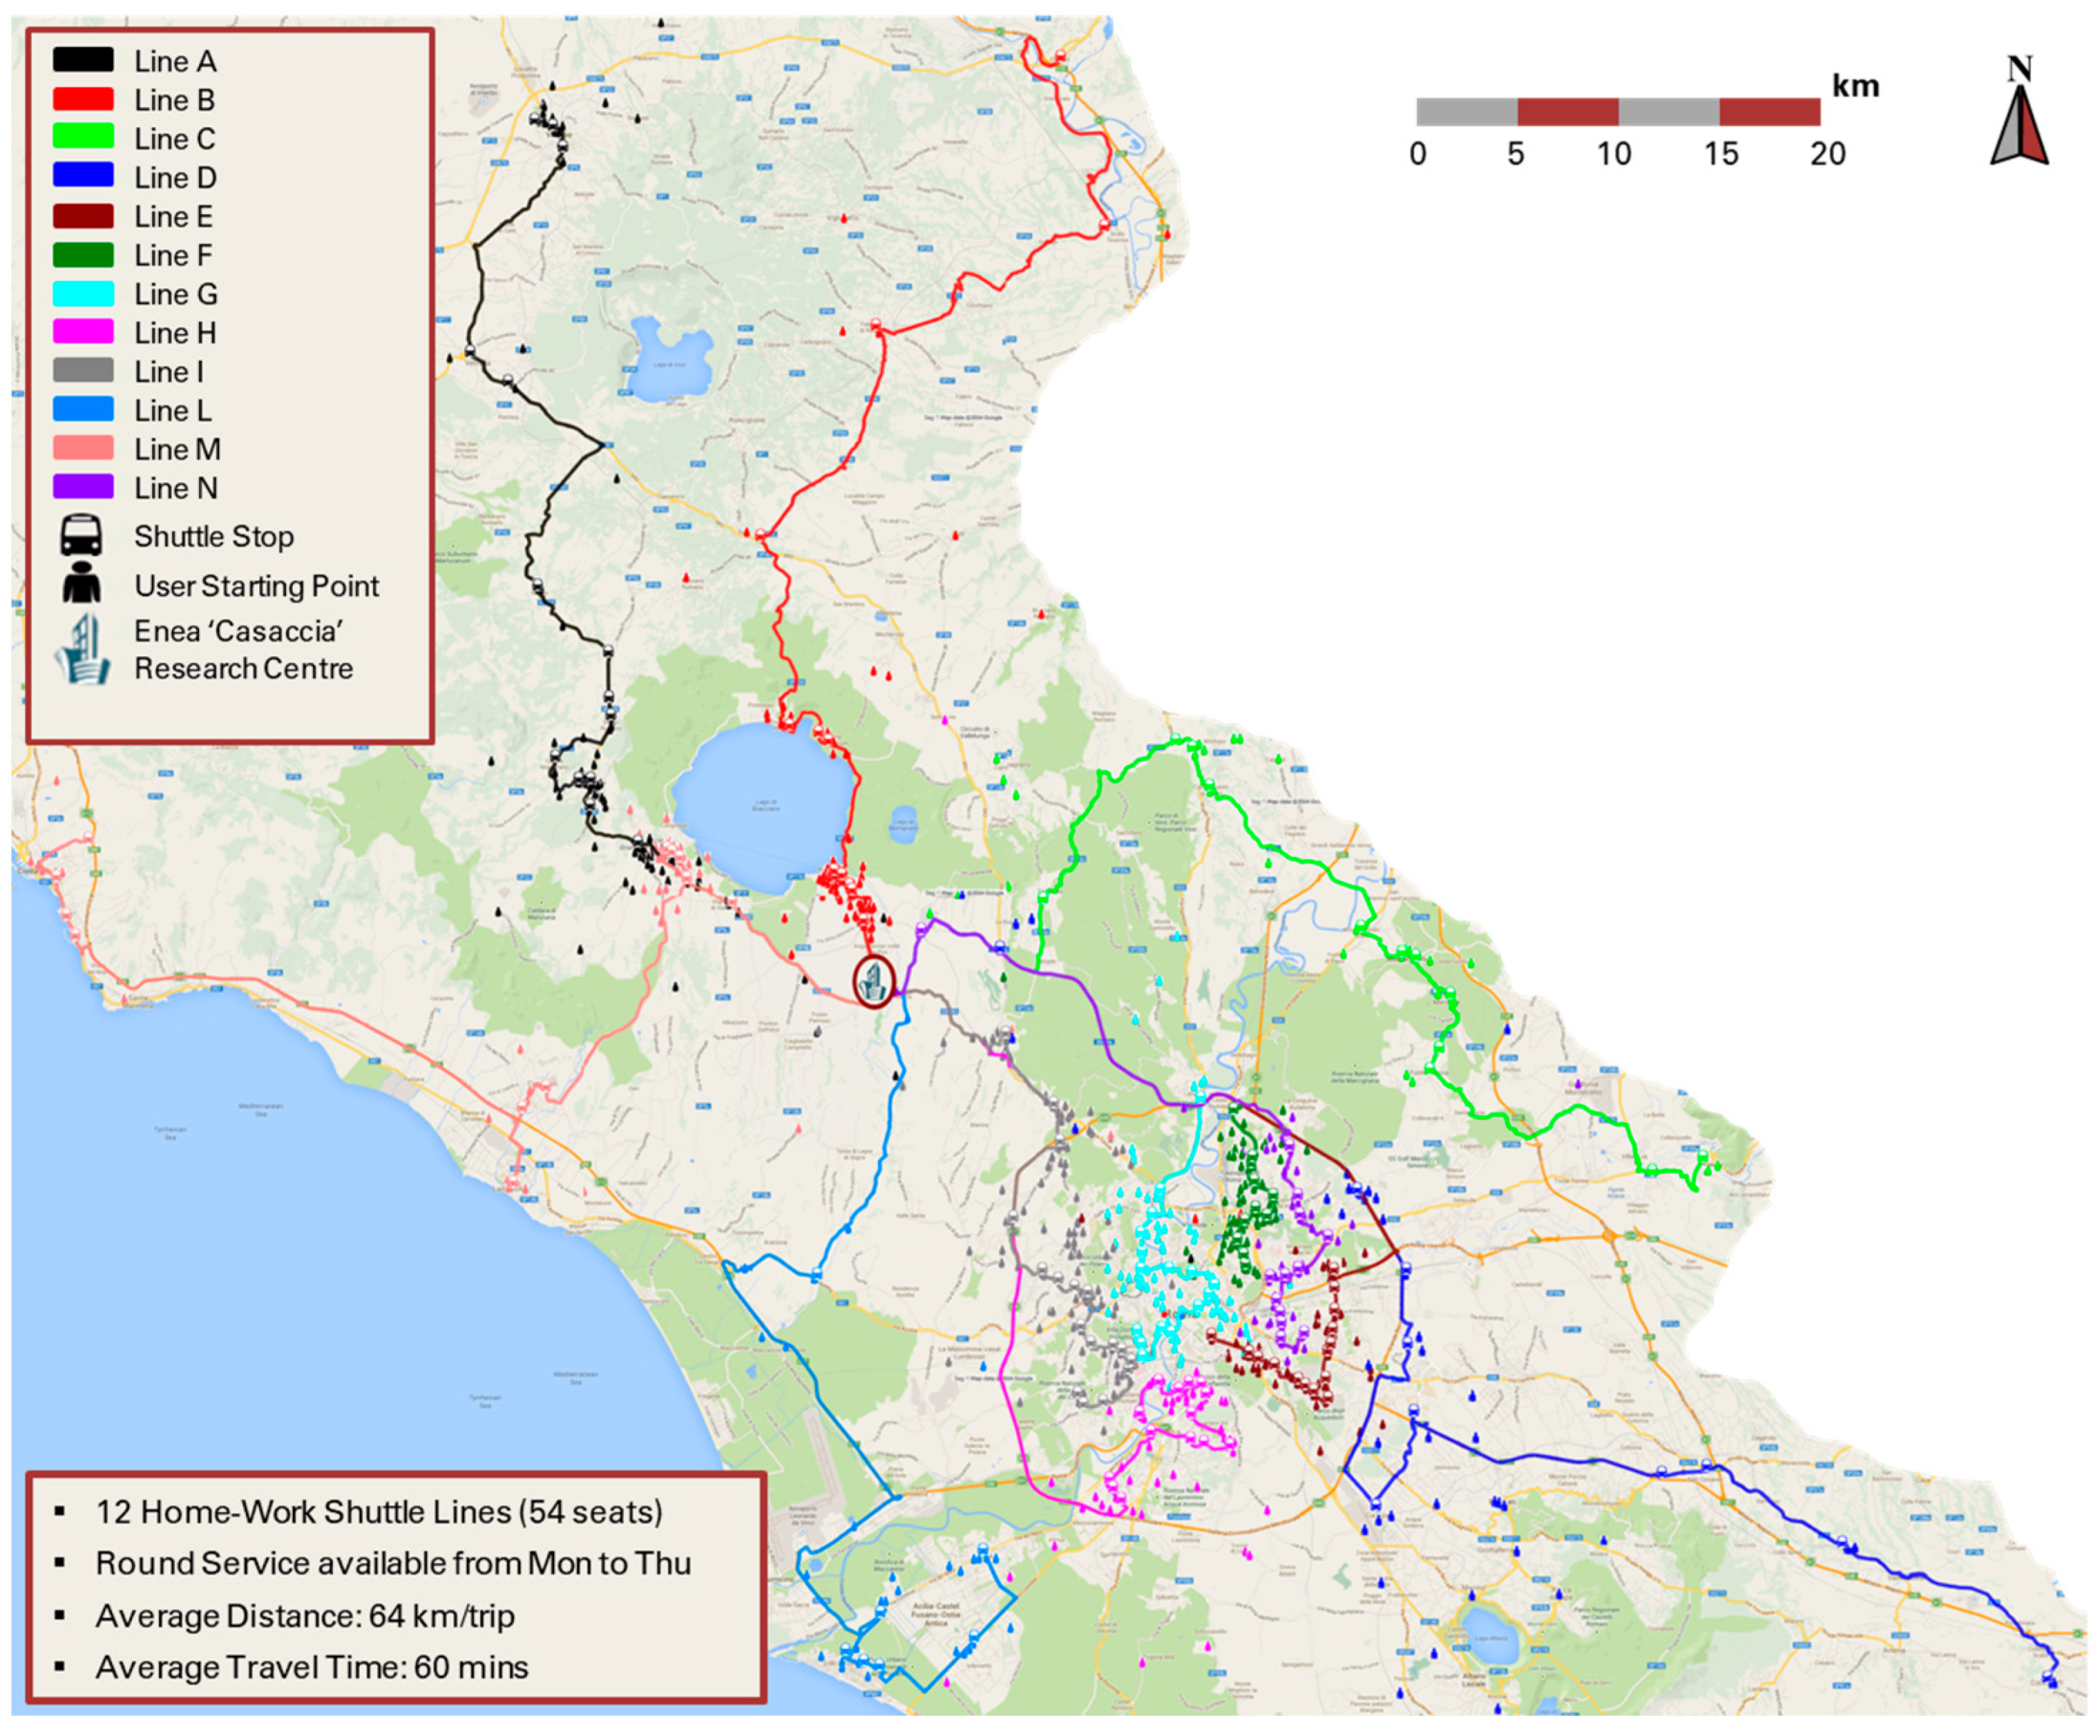
We focused our study on the home-to-work mobility of the ENEA “Casaccia” Research Centre. The center is located about 25 km from the center of Rome to the northwest. During the analysis period, “Casaccia” had around 1200 staff and was visited daily by over 300 guests from various organizations and institutions. From Monday to Thursday, a coach service on 12 routes was available to reach and leave the center, transporting up to 54 passengers, both employees and guests (180 days per year). Of these, six crossed the internal area of Rome, while the remaining six connected “Casaccia” to peripheral areas outside the city boundary (see
Table 2). The entire fleet consisted of standard diesel coaches, with emission standards EURO V. The average covered distance was 64 km/trip, whilst the total average travel time was 60 min.
Figure 3 shows a schematic map of the shuttle routes together with the related stops and the approximate spatial distribution of the company service demand.
In order to conduct the survey, we took advantage of the LimeSurvey application (
www.limesurvey.org, accessed on 7 May 2023), a free online tool that allows a user-friendly design of the questionnaire and an effective visualization of the results. A total of 1340 regular visitors to “Casaccia” were invited to fill in the survey, and 955 people participated, about 71% of the total; of these, 903 answered all the questions. By considering only the complete answers, the resulting margin of error is approximately 2%, with a confidence level of 99%. To estimate the margin of error
, we adopted the following equation:
, where
is the standard deviation of the population,
is the number of
by which a given proportion deviates from the mean, and
is the population size. However, it is worth noting that individuals who did not respond to the questionnaire are likely to be mostly people who do not use the service.
We designed the survey questions to acquire all the data listed before, and we also asked the main reason for not using the collective transport (lack of flexibility in timetables, long distance to the stop, high travel time) for future improvement in the service.
To ensure complete privacy for survey participants, personally identifiable information was anonymized, except for people who explicitly consented to their processing to obtain a personal “green card”. This card reports, if any, the reduction in fuel consumption and pollutant emissions in connection with the specific use of the collective transport service.
Results of the survey were also stored in a PostgreSQL database to easily post-process the data in a GIS environment due to its built-in extension for georeferenced objects. This was also essential to reconstruct the travel patterns on the road network. For this purpose, we took advantage of the TomTom Multinet map database (
www.tomtom.com, accessed on 7 May 2023) to obtain knowledge on the road network (arcs, nodes) and traffic attributes (restrictions, maneuvers, etc.) that are crucial for routing purposes.
At the same time, georeferenced information on lines and their attributes (sequence of stops, journey times, frequency of service, etc.) were obtained from open data (
dati.comune.roma.it, accessed on 7 May 2023) of public transport provided by the Rome Mobility Agency (Roma Servizi per la Mobilità). Starting from this information, we developed a specific Python script to determine the most efficient path on public transport. The software code is based on the connection scan algorithm [
41].
Once we acquired individual starting points of the shuttle users, we reconstructed their routes by private cars users and LPT users.
Similarly, shuttle itineraries were reconstructed based on the stop coordinates, and they included the route from the depot to the first stop.
We also accounted for the access time to the stops for each mode of transport. Specifically, we considered an average speed of 4 km/h for the walking sections, 15 km/h for urban bus lines, 25 km/h for tram and metro paths, 30 km/h for the train ones, and 30 km/h and 70 km/h for urban and extra-urban car routes, respectively.
The trip distances structured in this way were the input for the estimation of fuel consumption and pollutant emissions.
The two scenarios—called HWS (home-to-work shuttles service) and NO-HWS—are constructed according to the results of the survey, taking into account 529 shuttles users and their declarations in a what-if situation without operating the HWS. In total, 330 of the 529 employees answered that they would use their own car, while 129 would still use LPT.
For the emissions and consumption estimation, the national emission factors published by ISPRA [
42], the Italian Institute responsible for Annual National Emissions Inventory, were used. The national consumption and the CO
2 factors are based on the chemical composition of automotive fuels monitored by ISPRA, with ad hoc studies [
43].
The cost analysis of the two scenarios was conducted using the following parameter values.
For the internal costs of the HWS scenario:
- −
The running cost is set equal to the expense for the 12 shuttle lines paid by the employer (258 EUR/day per line) for 180 days per year.
- −
An average value of 12.8 EUR
2022/hour (value of non-working time for commuting) for employees' travel time private cost—including travel time at the stop—was assumed, as indicated in the European manual to assess the value of travel time [
40].
In the NO-HWS scenario, the internal costs were distinguished between car users and LPT users.
For the first group (330 users), the investment and running costs were estimated using the ACI tool [
44] for the most recurring car models of the employees’ fleet. The annual mileage for gasoline and hybrid vehicles was assumed to be equal to 15,000 km per year, whilst for diesel, LPG, and CNG cars, 20,000 km was assumed. The fuel expense provided by the ACI tool was updated by applying the average 2022 national prices (
Table 3), only taking into account the vehicle fleet of the employees of the ENEA “Casaccia” Research Centre.
As for the LTP users’ group, the internal cost consists of the price of the annual pass weighted on home-to-work travel days and the travel time costs.
The private travel time costs were also considered. This study was carried out only for the outward journey, so the return travel time was assumed to be equal to the outward travel.
The emission and cost results of the two scenarios compared in this study are listed in
Table 4 and
Table 5. The inputs have been derived from survey data and route reconstruction. Estimated direct impacts are also factored in for cost computation.
4. Results
The main results of the survey processing are reported and discussed below. Specifically, we first present some basic statistics related to home-to-work travel behavior, including the use of the collective service and the characteristics of the private vehicle fleet. Subsequently, we focus on the comparison between collective and private transport based on energy, environmental and economic analysis.
4.1. Survey Data Analysis
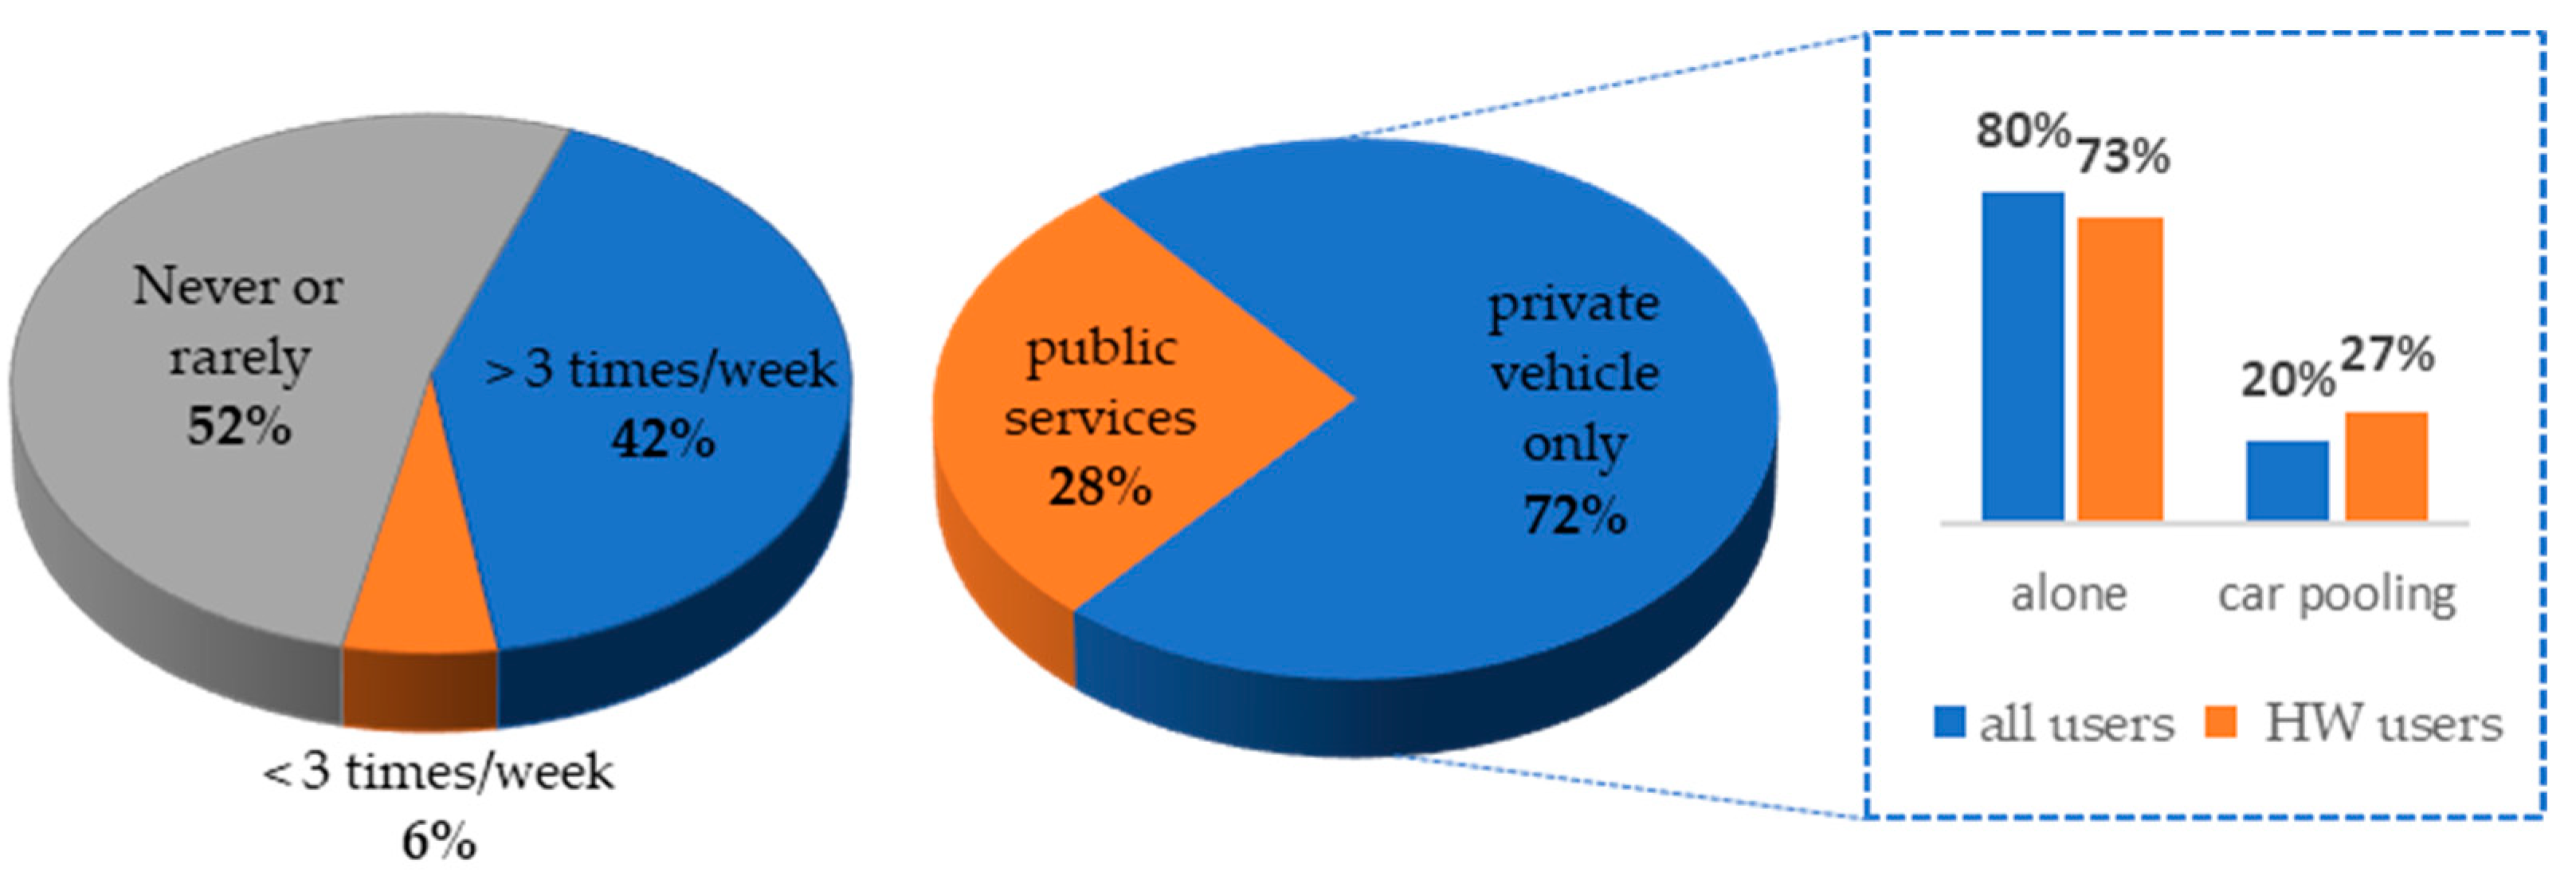
The survey answers showed an equal distribution between people who use the company service at least once a week and those who do not at all. Among the former, 42% use the service 3–4 days a week, while 6% take the shuttles no more than 1–2 times (
Figure 4). It is worth noting that a significant portion (28%) of the commuters who use the company service also use public transportation as an alternative. Furthermore, the remaining 72%, while exclusively using a private vehicle as an alternative, share the journeys by car with a percentage of 22%.
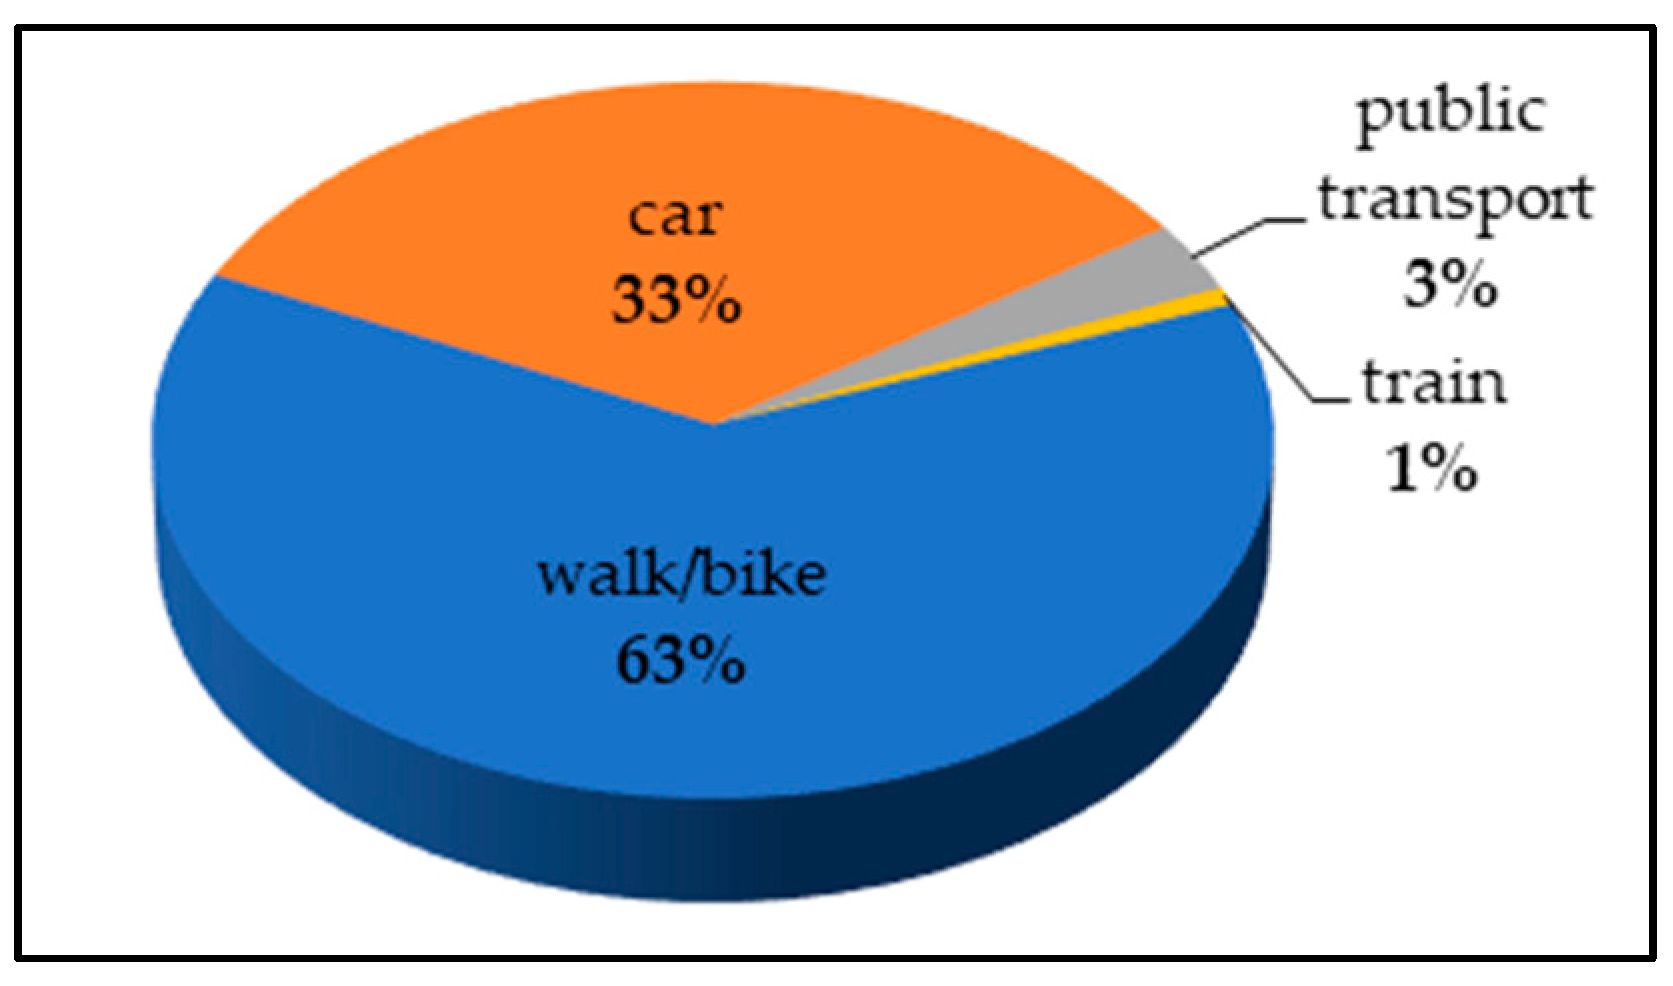
Figure 5 shows the distribution of access modes to the company shuttle stops. The pie chart shows that nearly two-thirds of the users reach the stop on foot, while almost all the rest use their private cars.
To cross-check the declared frequency of use, we asked for the collaboration of selected service users to monitor the average daily occupancy of each line, as well as the average number of users per stop. Field monitoring data were consistent with the answers provided in the survey.
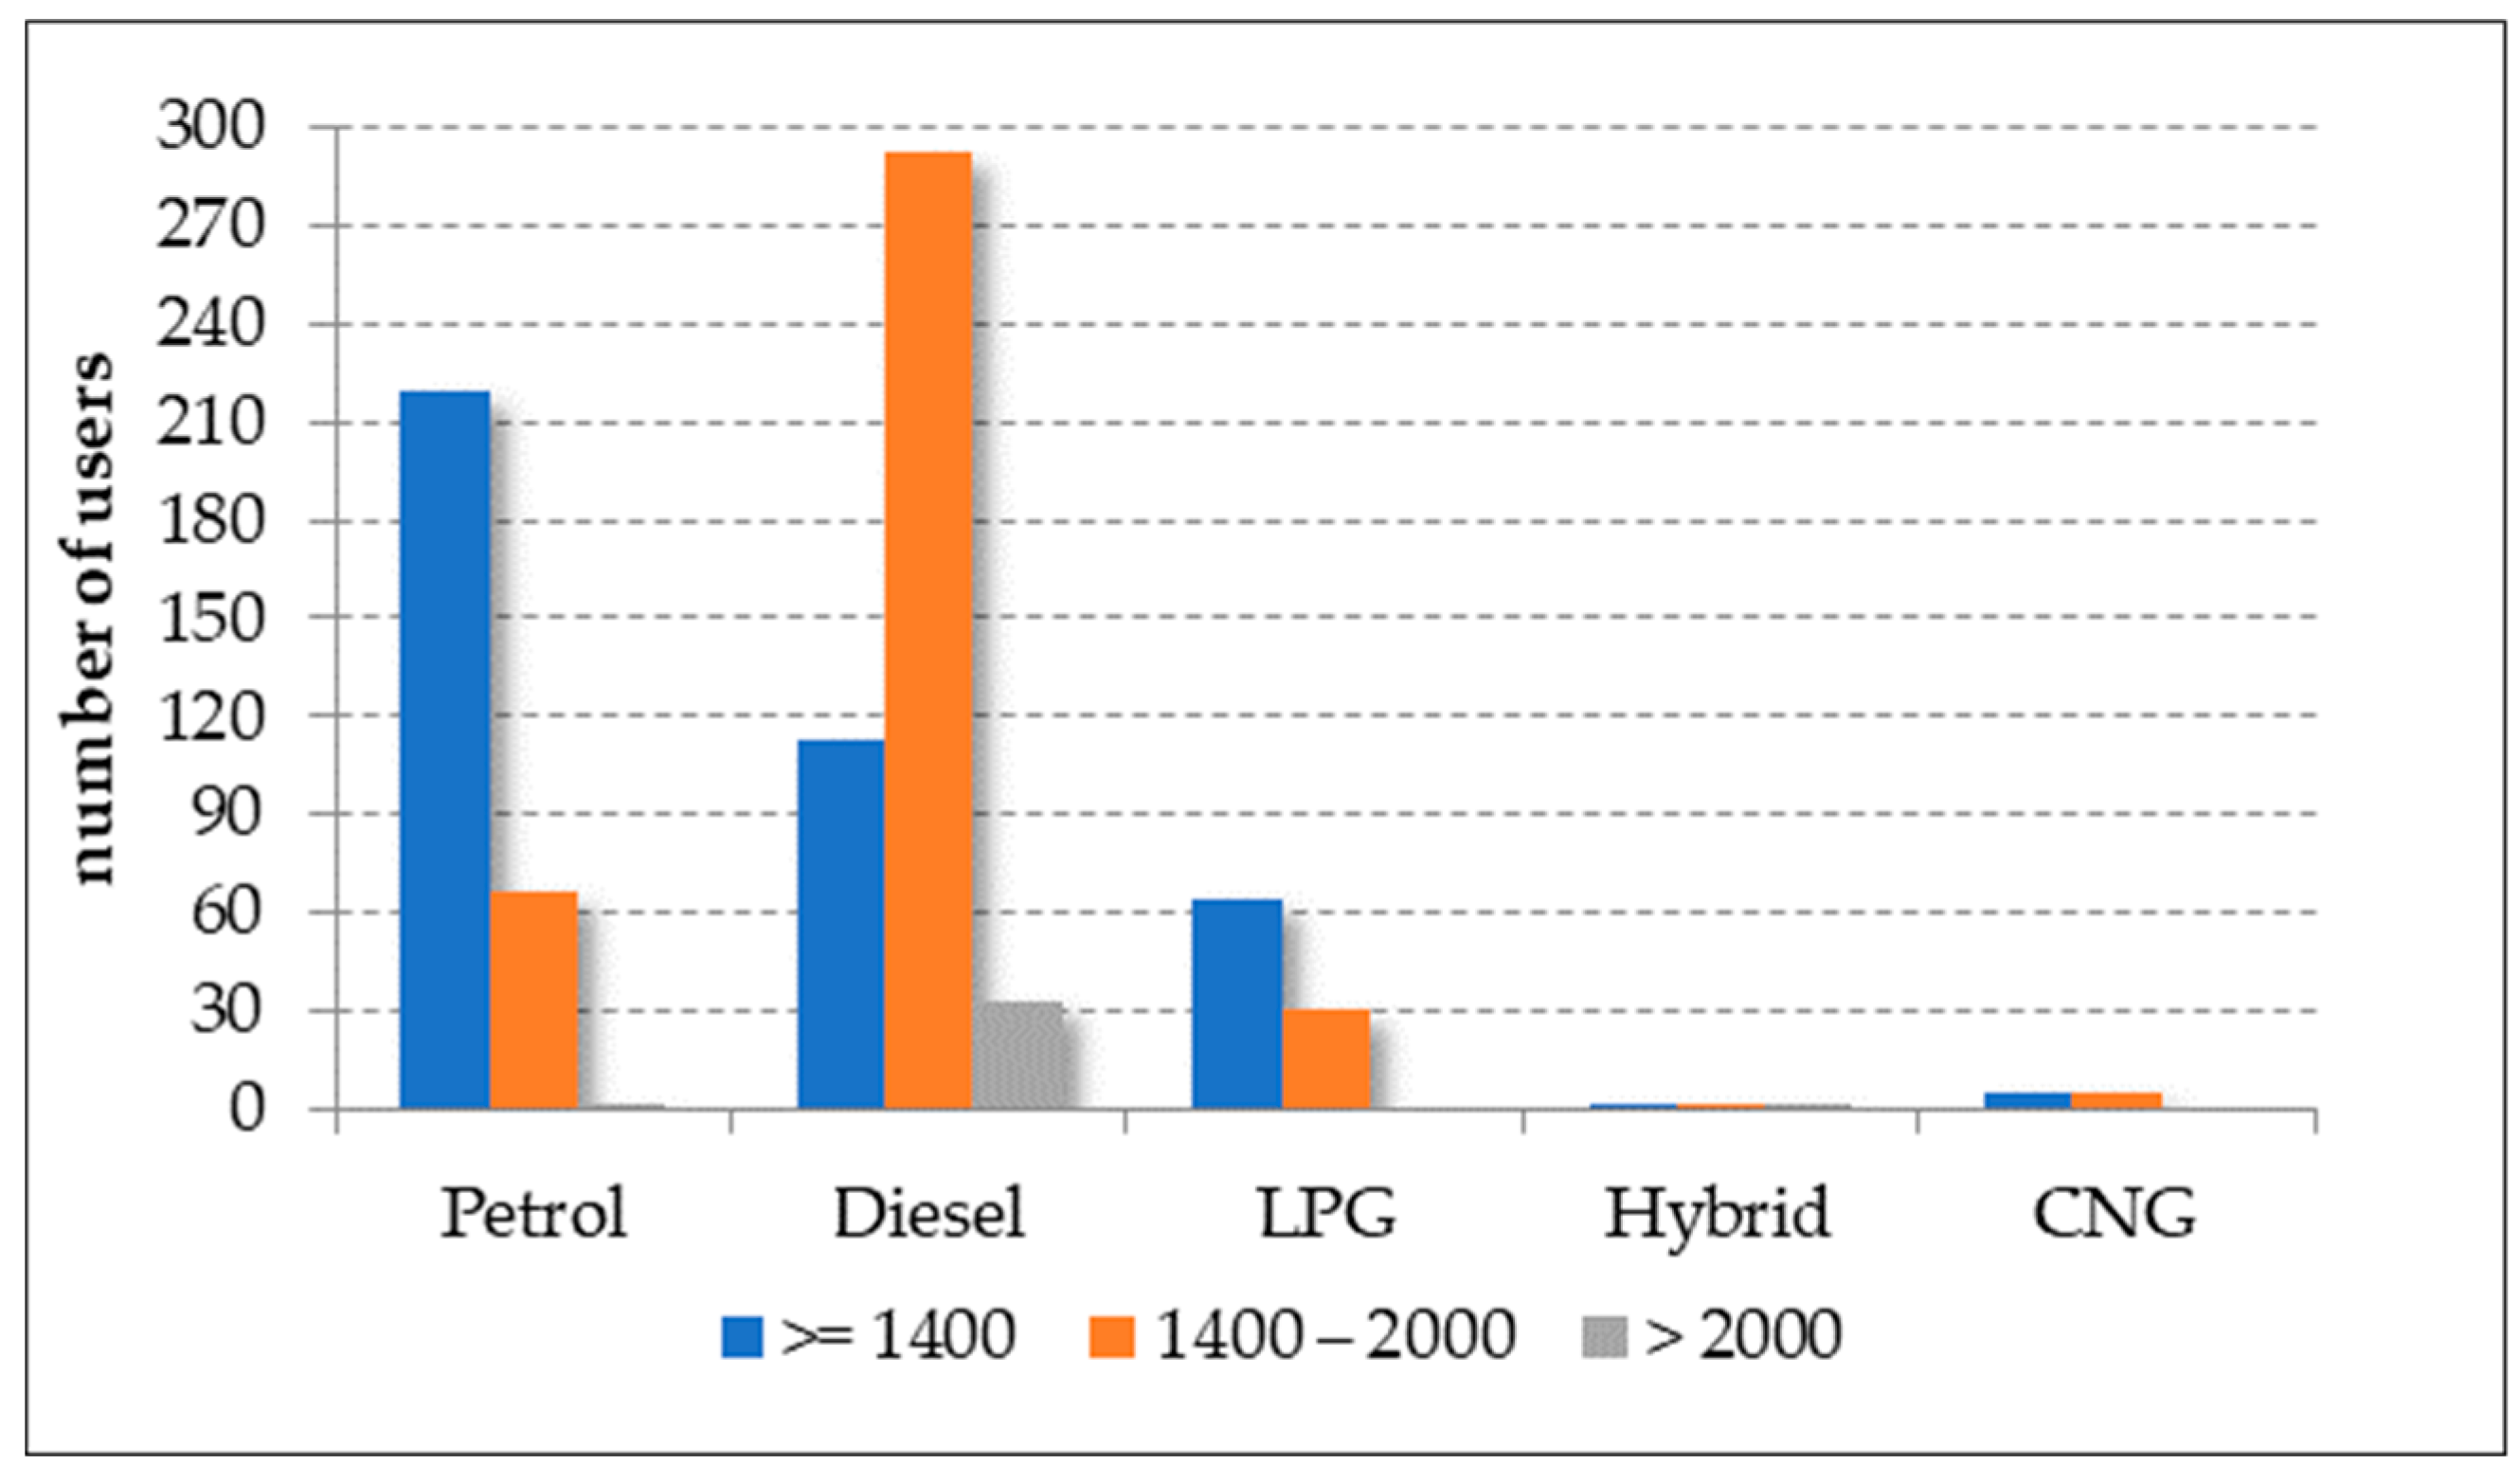
In total, 91% of the respondents own a car. This fleet mostly consists of new vehicles if compared to the average national and municipal one (
Figure 6). Indeed, data concerning vehicle characteristics show that the European emission standards are Euro IV and Euro V in 42% and 20% of the cases, respectively. Furthermore, the fleet mostly comprised diesel cars with engine sizes between 1400 and 2000 cc (35%), gasoline cars below 1400 cc (26%), and diesel cars below 1400 cc (14%).
We verified that the home-to-work distances reported in the questionnaire were often incorrect due to a tricky selection tool implemented in the online survey. For this reason, as anticipated in
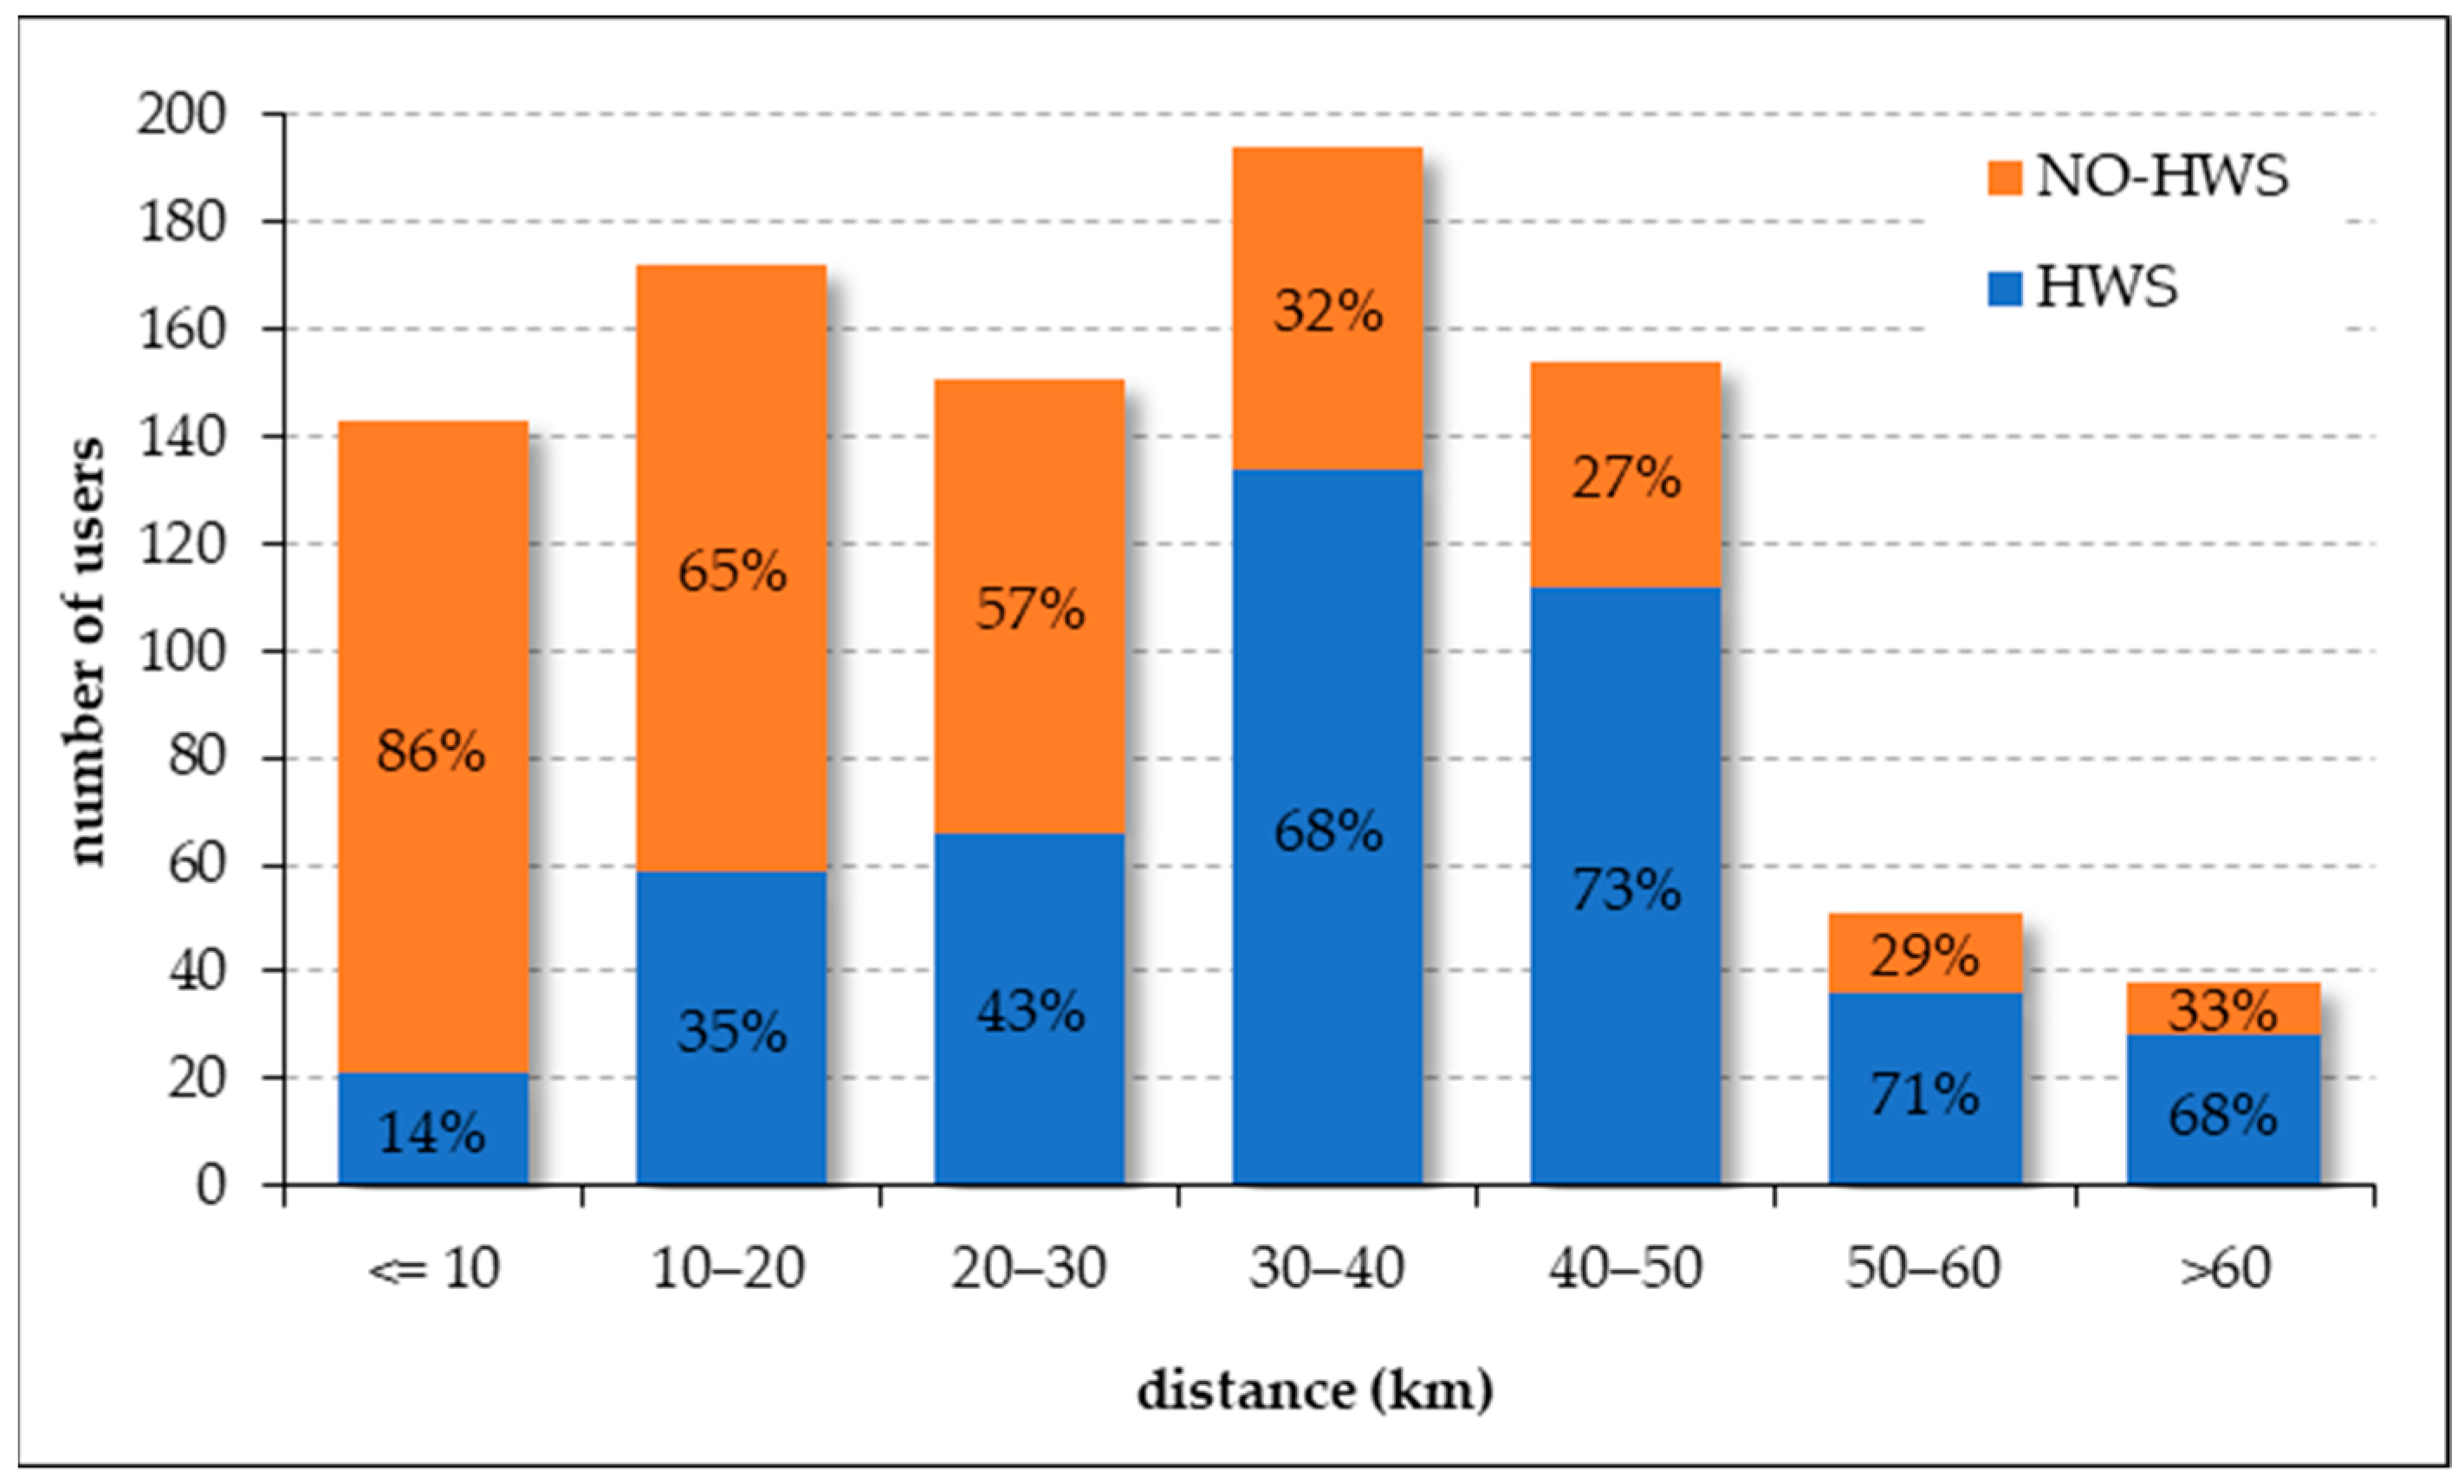
Section 2, it was necessary to reconstruct individual home-to-work paths. The related average traveled distance is 35 km (σ = 15 km) for service users. On the other hand, people not using the service usually travel shorter distances, on average 29 km (σ = 16 km). Note the high standard deviation values σ associated with the above travel distances.
Figure 7 reports the traveled distance classes divided for users and non-users of company shuttles. The figure clearly shows that the highest percentages of collective service usage are linked to longer distances.
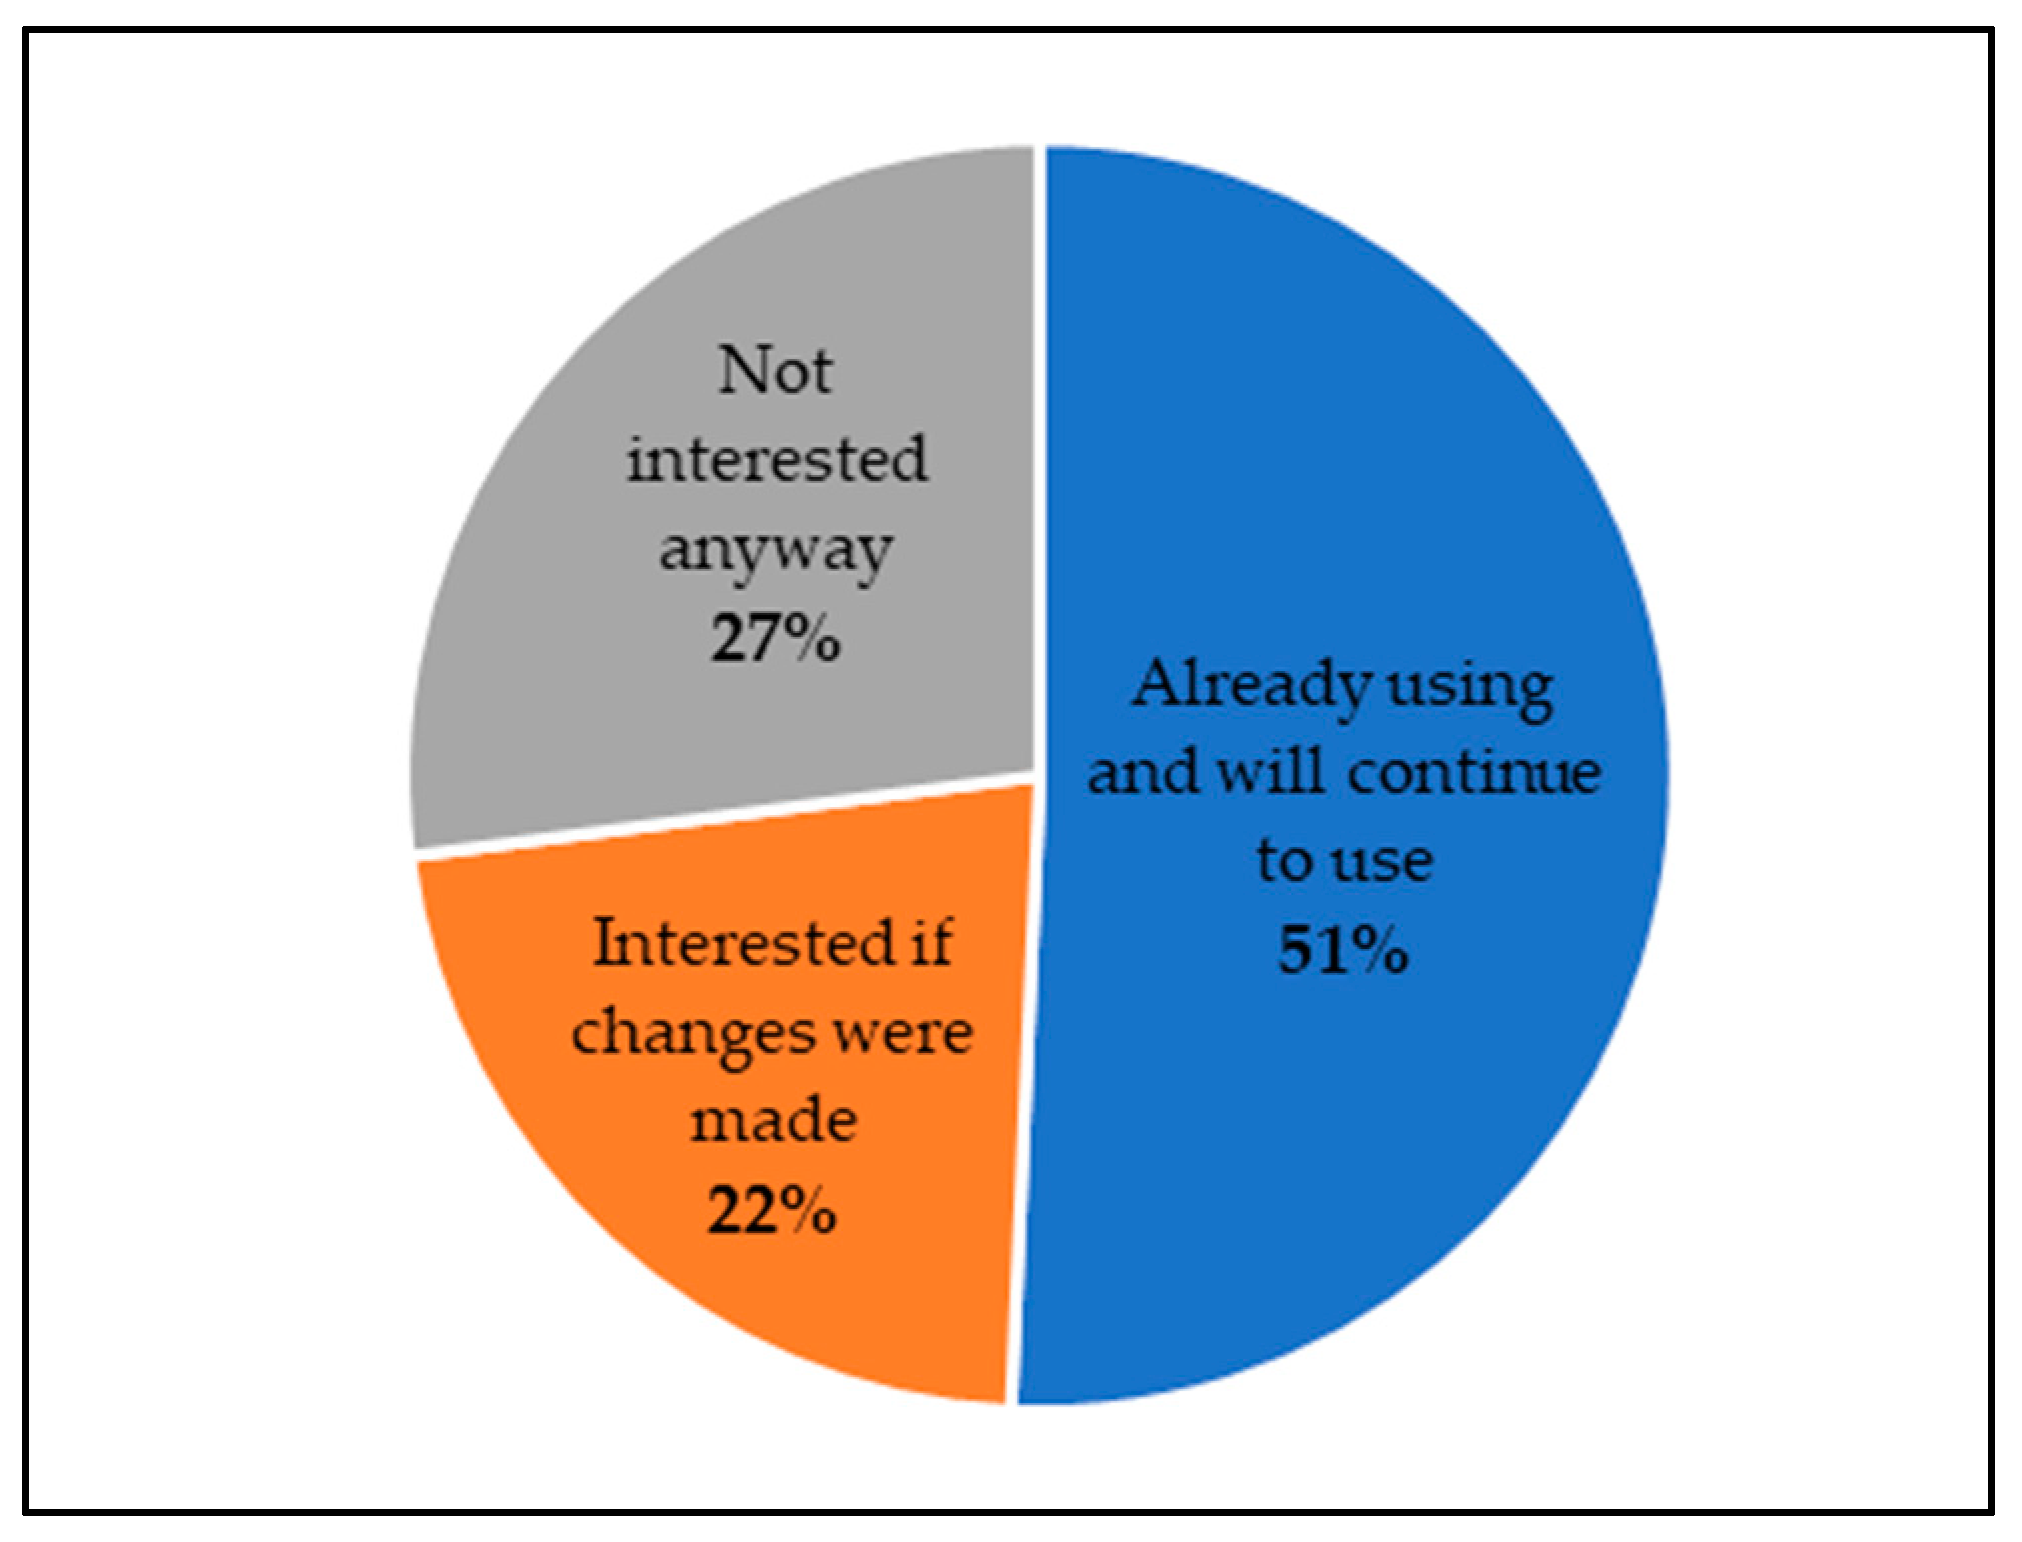
A total of 445 respondents do not use the company transport service. Of these, more than half are not interested in using it since most of them live in the surroundings of the workplace, and they can schedule home-to-work travels in a flexible manner with their privately owned vehicle (
Figure 8).
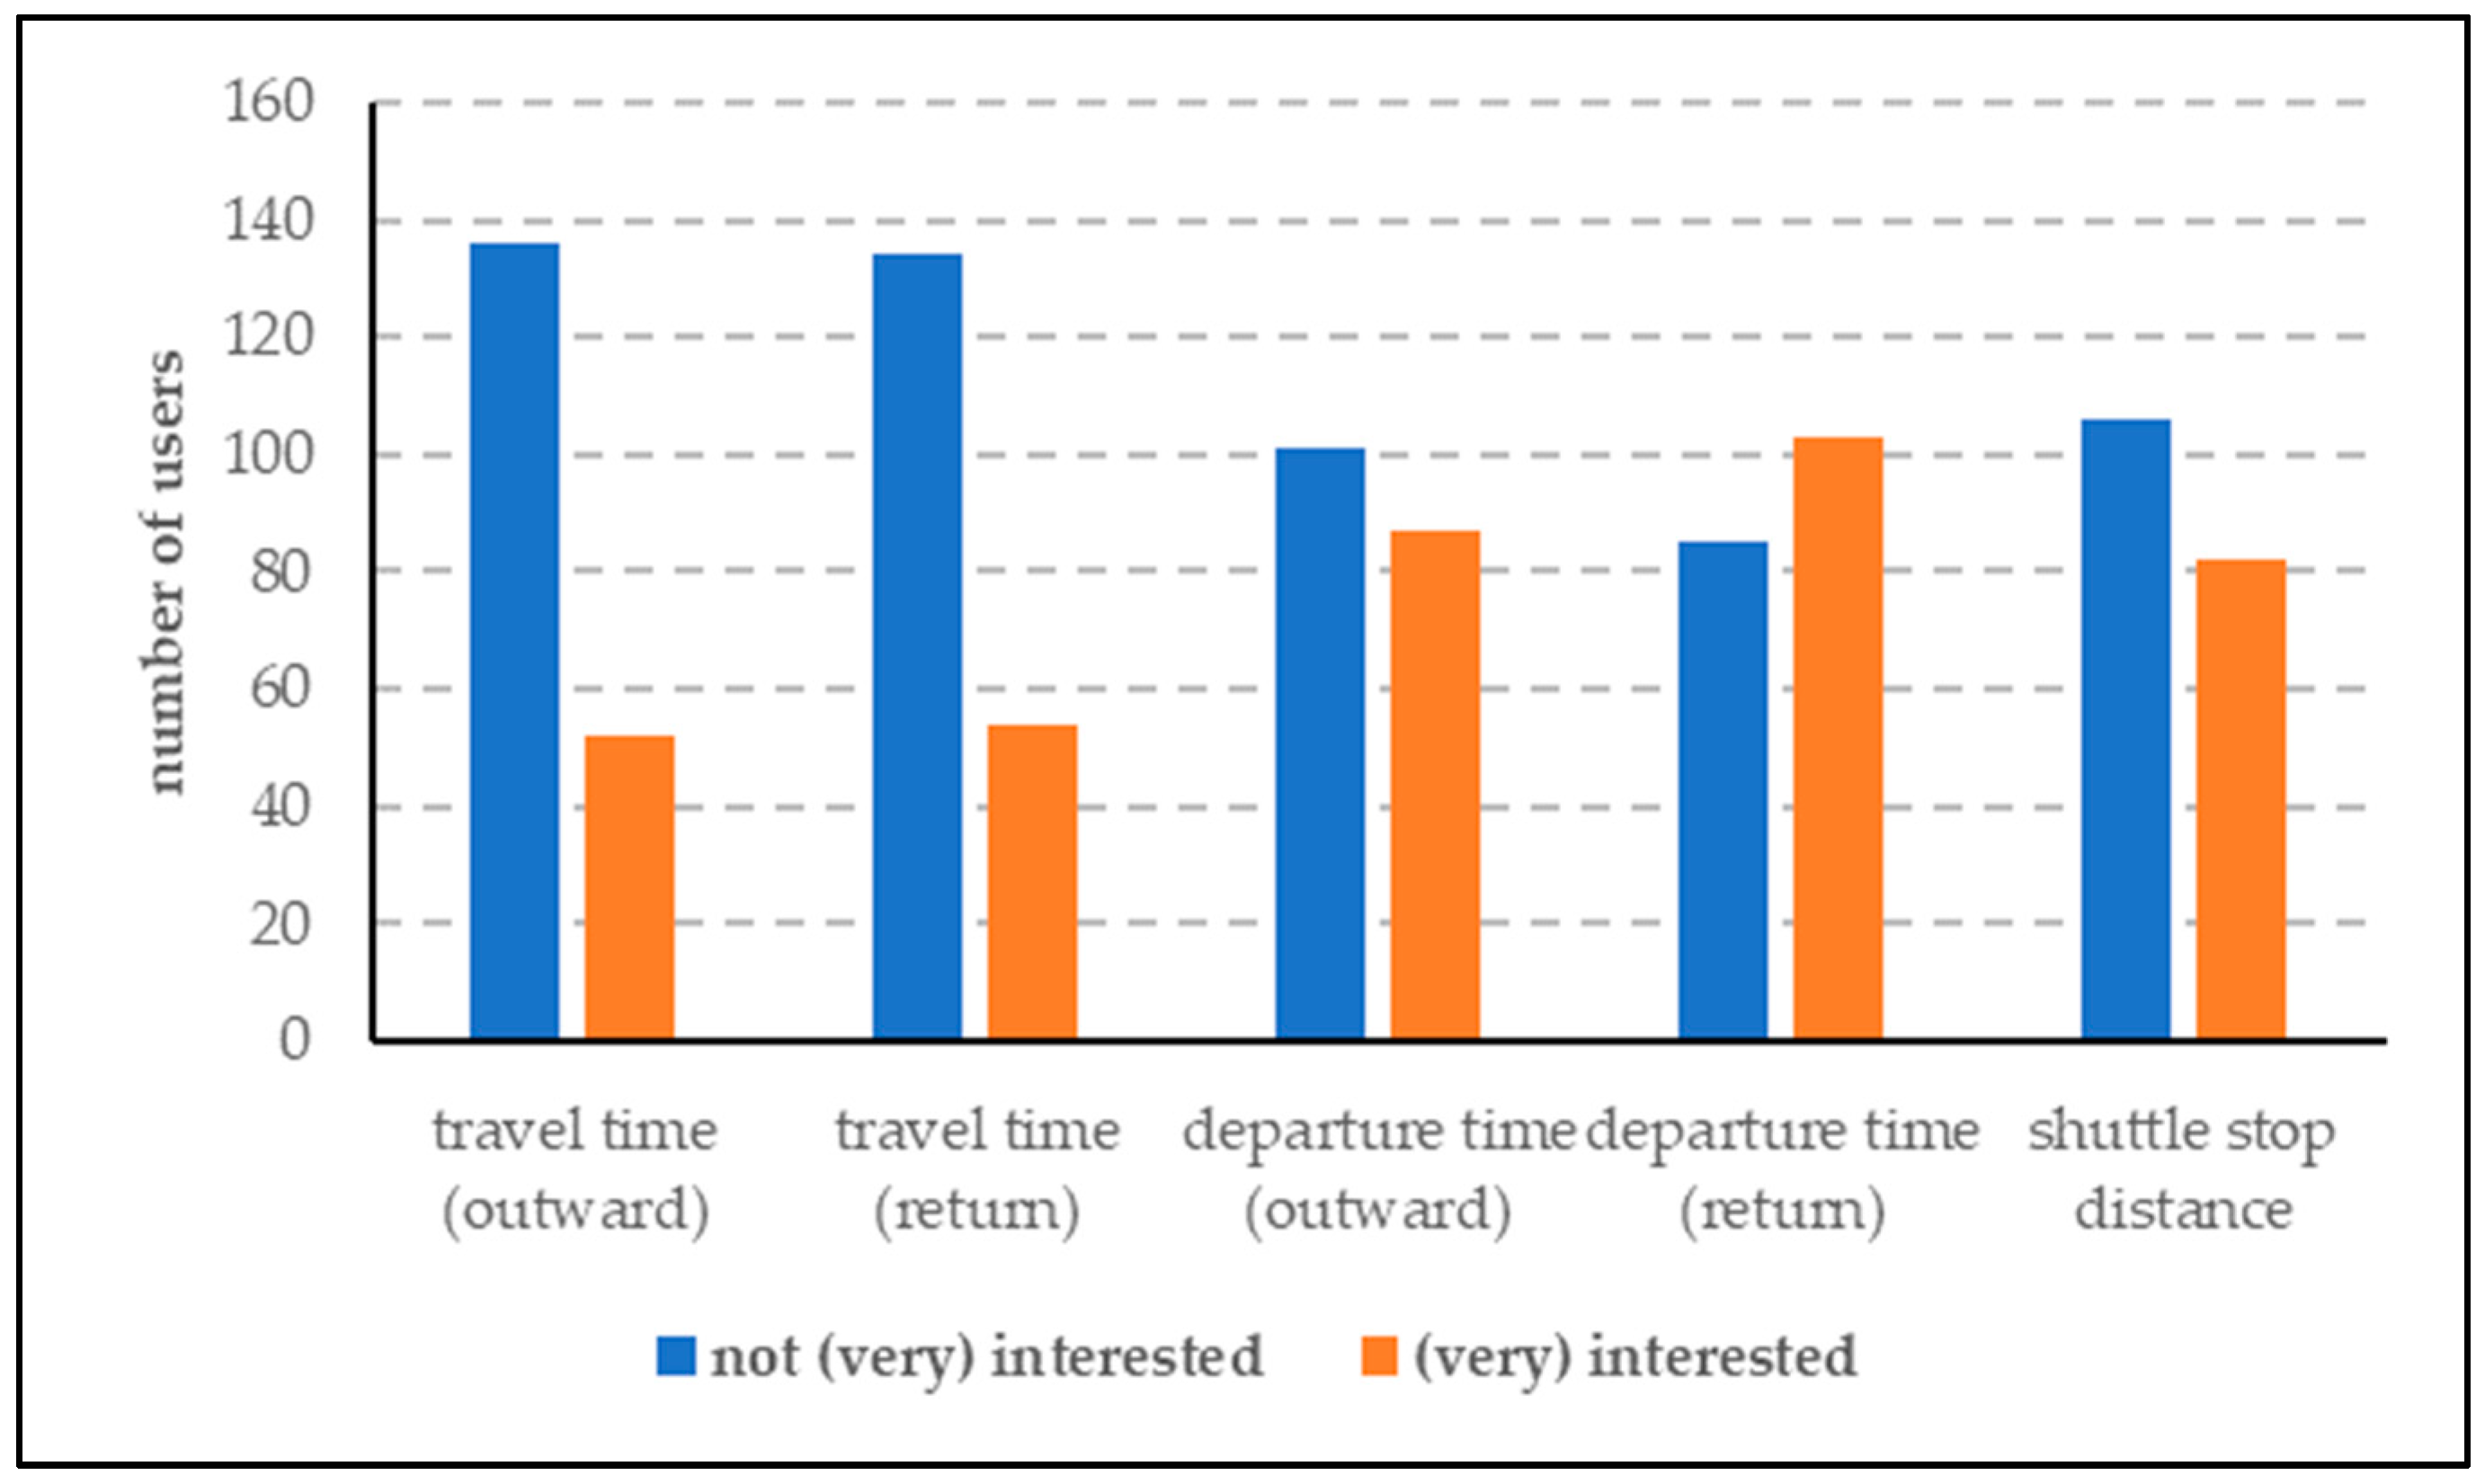
However, there are about 200 potential users who would be interested in using the service if some issues were settled, in particular: bus timetables, stop distances, and travel times (
Figure 9).
4.2. Energy Consumption and Environmental Impacts
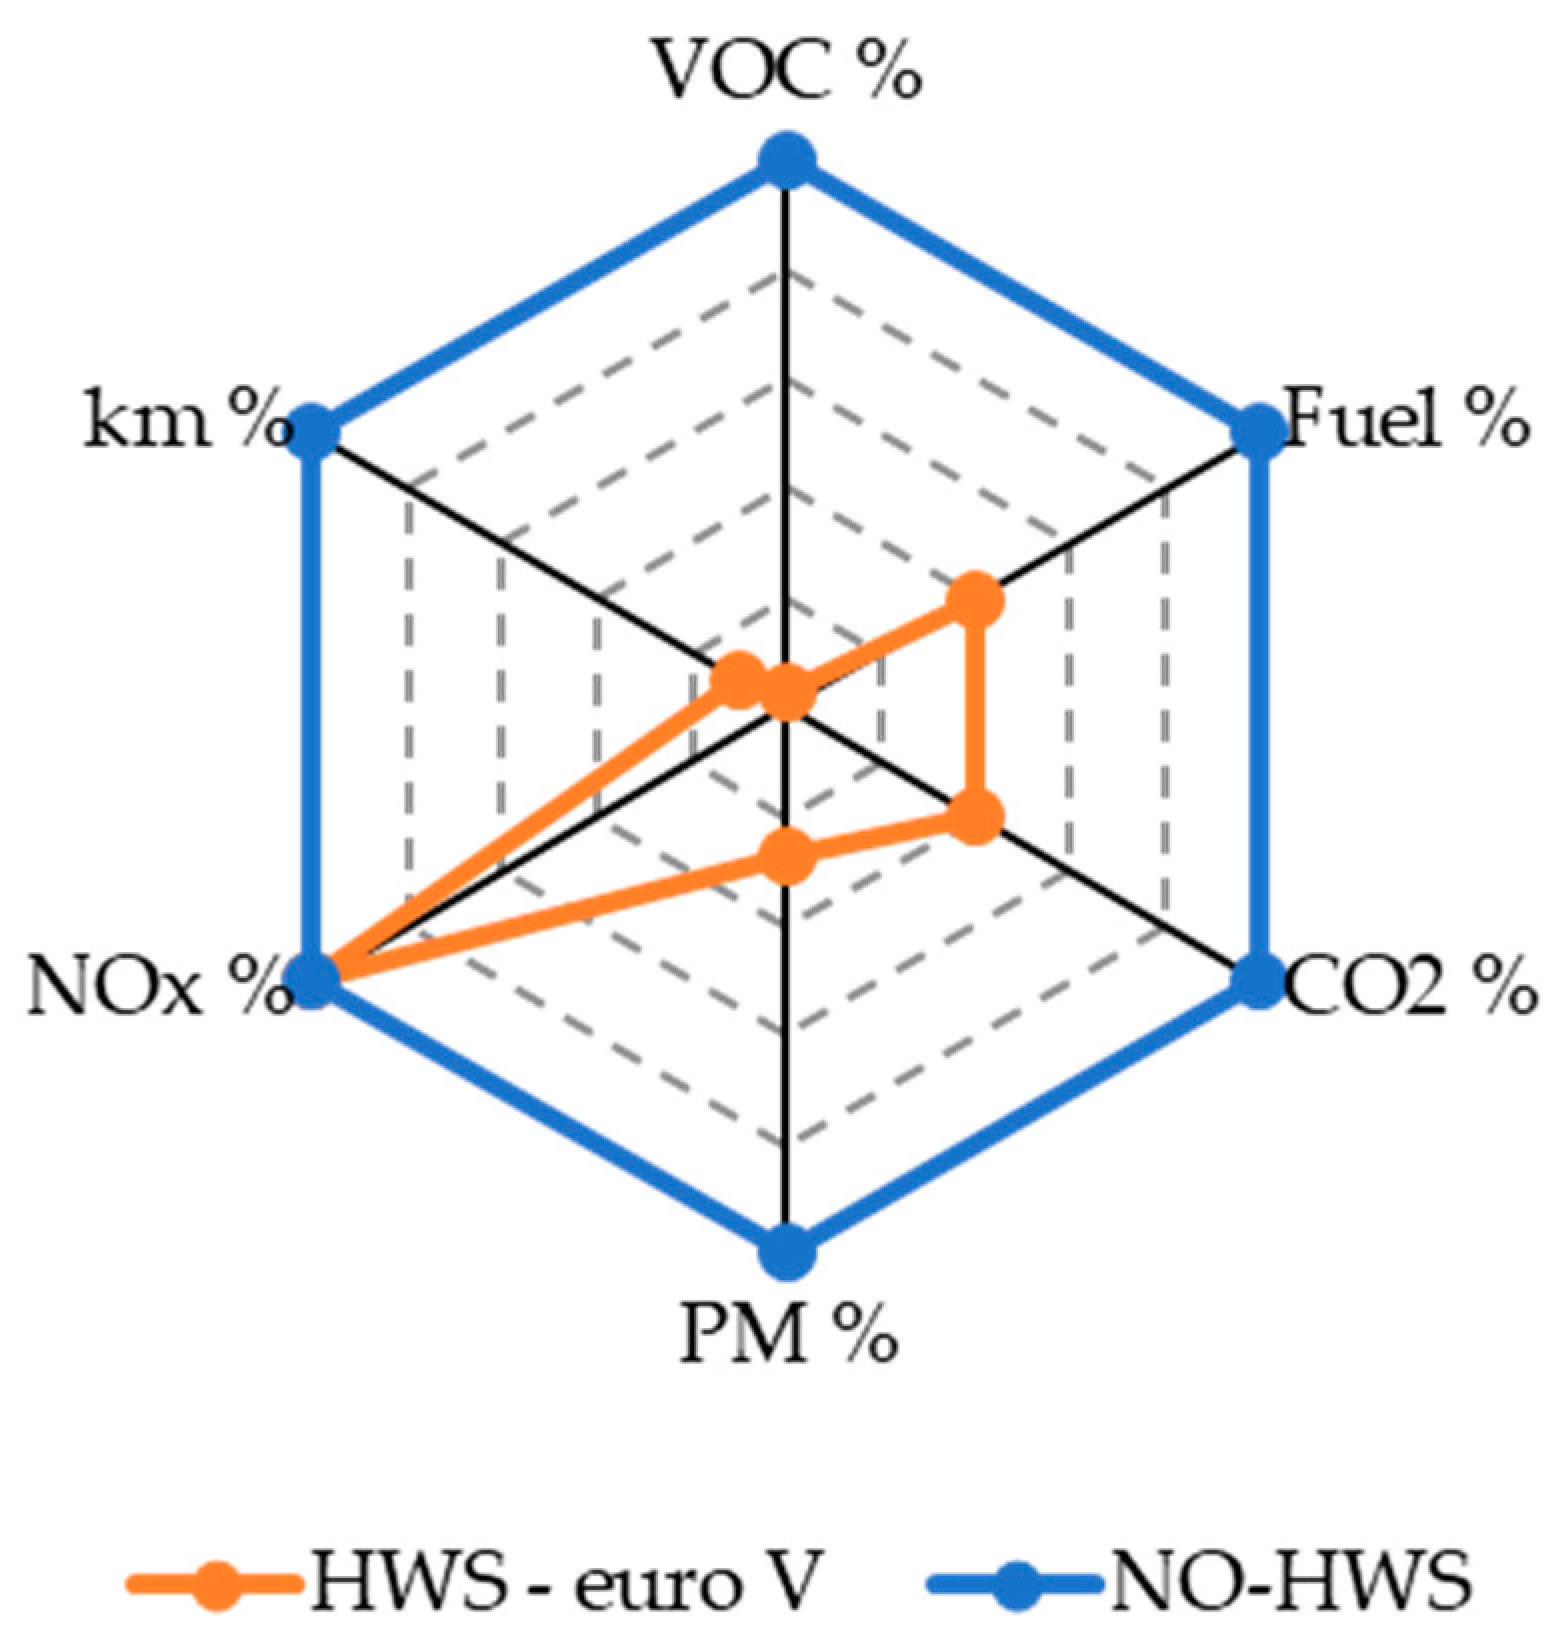
The energy consumption and pollutants–CO
2 emission comparison of the scenarios with and without home-to-work service shows benefits for all impacts considered, except for NO
X emissions (
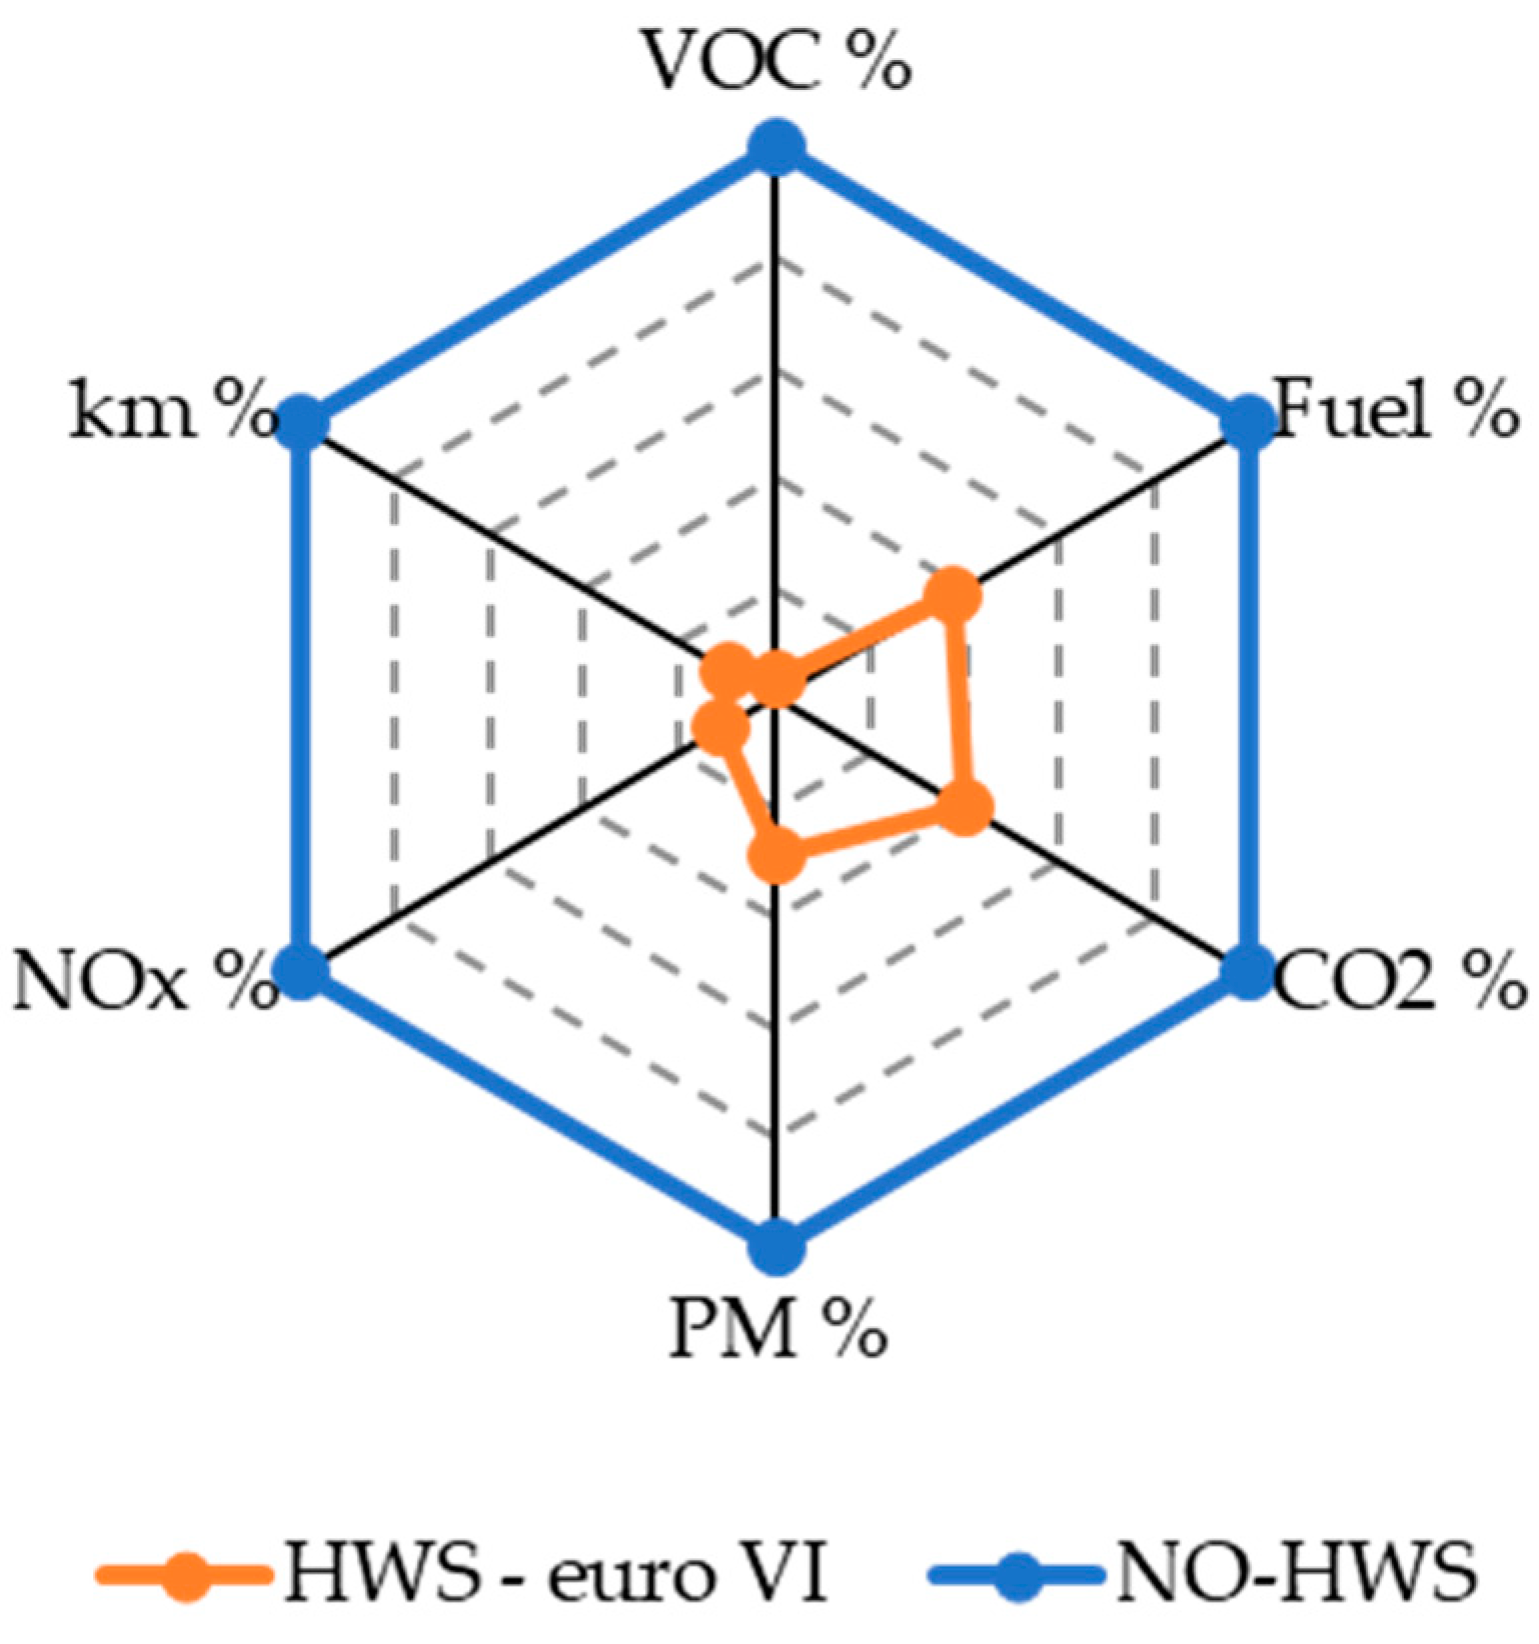
Figure 10). The greatest reduction is related to VOC emissions (−97%), which are related mostly to gasoline cars. The mileage decreases in cars (−90%) are not proportional to PM2.5 emissions (−72%) and consumption (−61%) reductions because the shuttles are diesel coaches with bigger engines. Their emission factors of nitrogen oxides represent the most problematic issue: they are much higher than those of employees’ cars, so the emissions are high despite the km being much lower than those of cars. For the new shuttles operating for the HWS nowadays, the results would be very positive even for NO
X emissions (
Figure 11).
4.3. Cost–Benefit Analysis
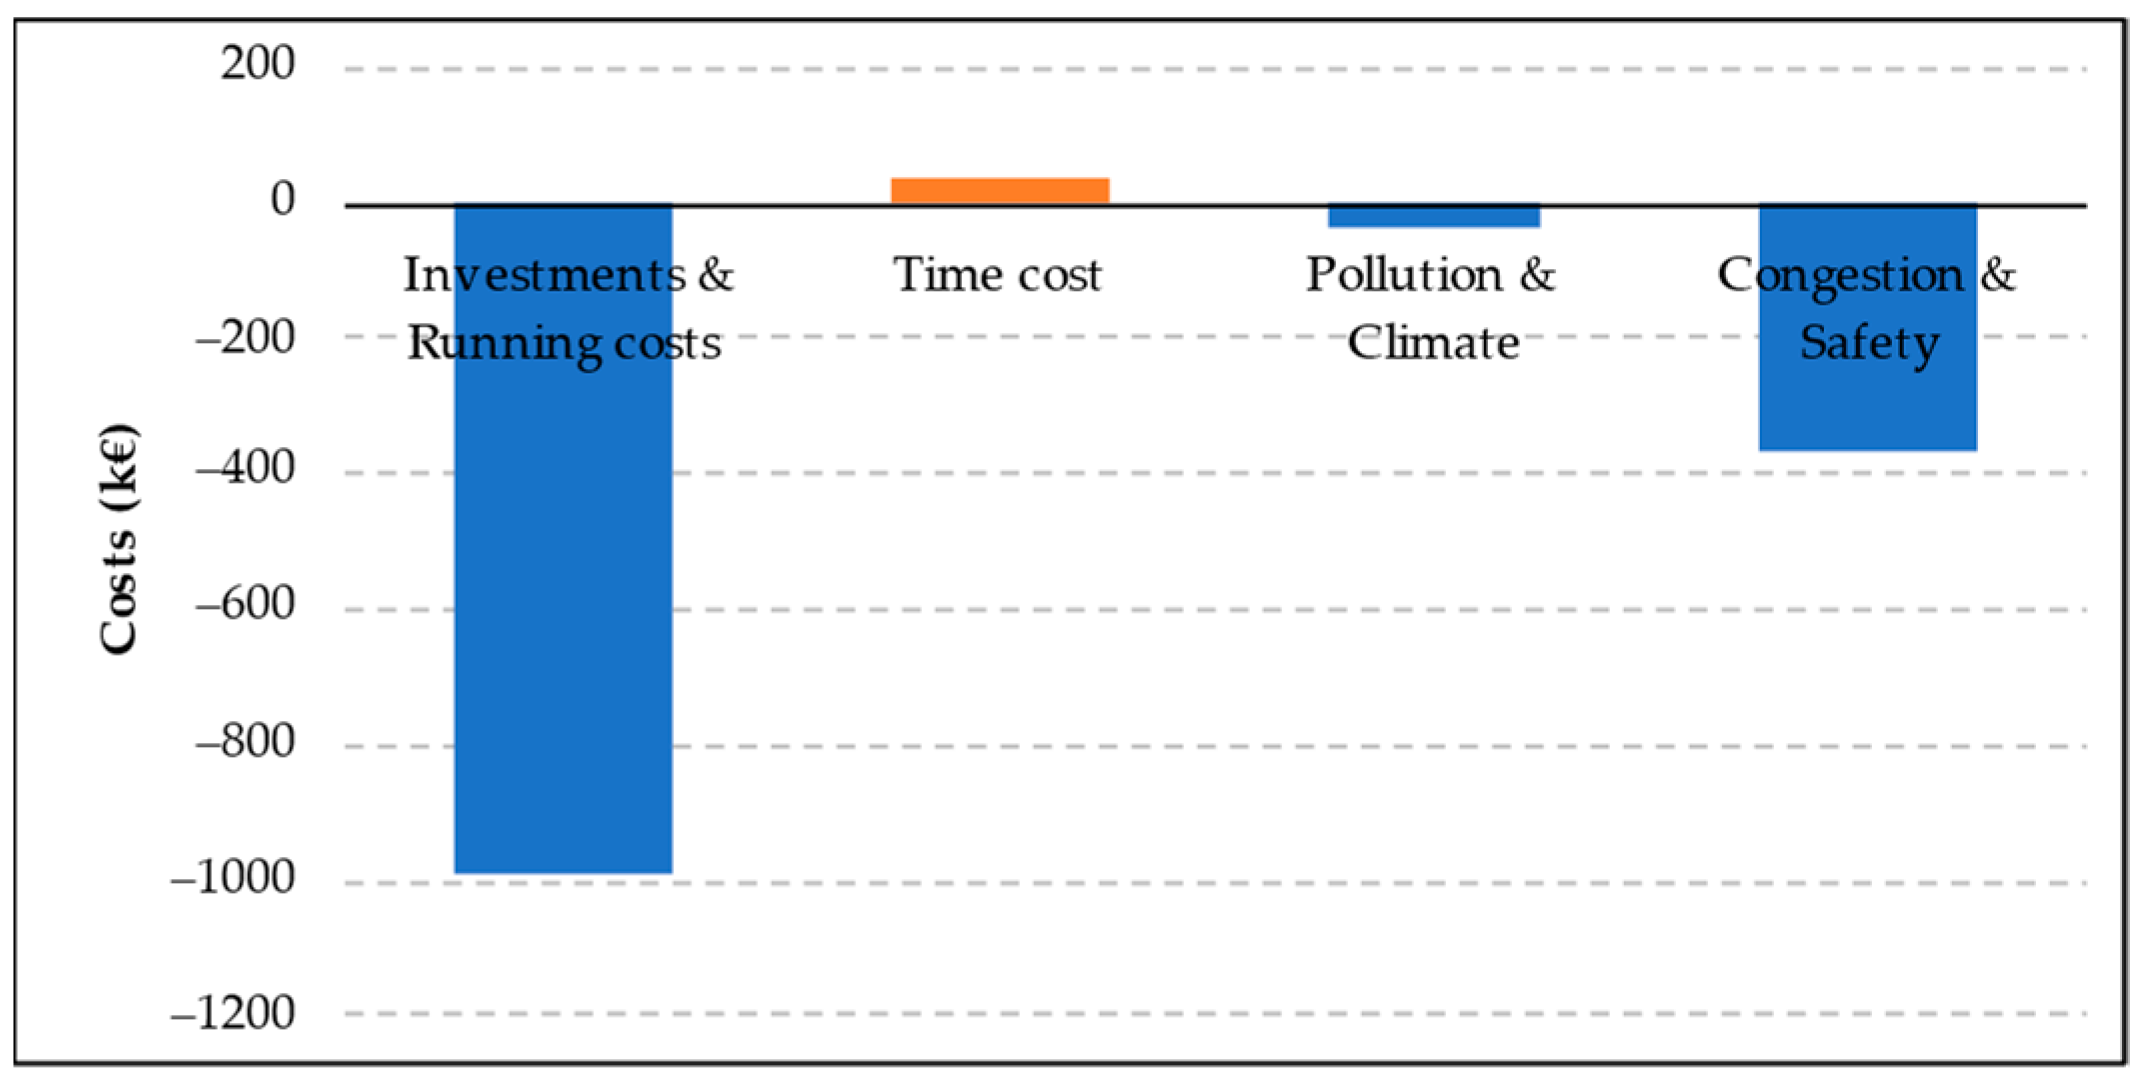
The economic analysis reveals that the HWS scenario offers benefits to both users and the community, such as lower operating costs, harmful emissions, congestion, and accidents. Although there is a slight increase in travel time costs, the estimated economic benefit is significant (
Figure 12): it amounts to approximately EUR 1.35 million per year. This includes:
EUR −992 k for investment and running costs;
EUR +38 k for travel time costs;
EUR −36 k for external costs of pollution and climate change;
EUR −365 k for external costs of congestion and safety.
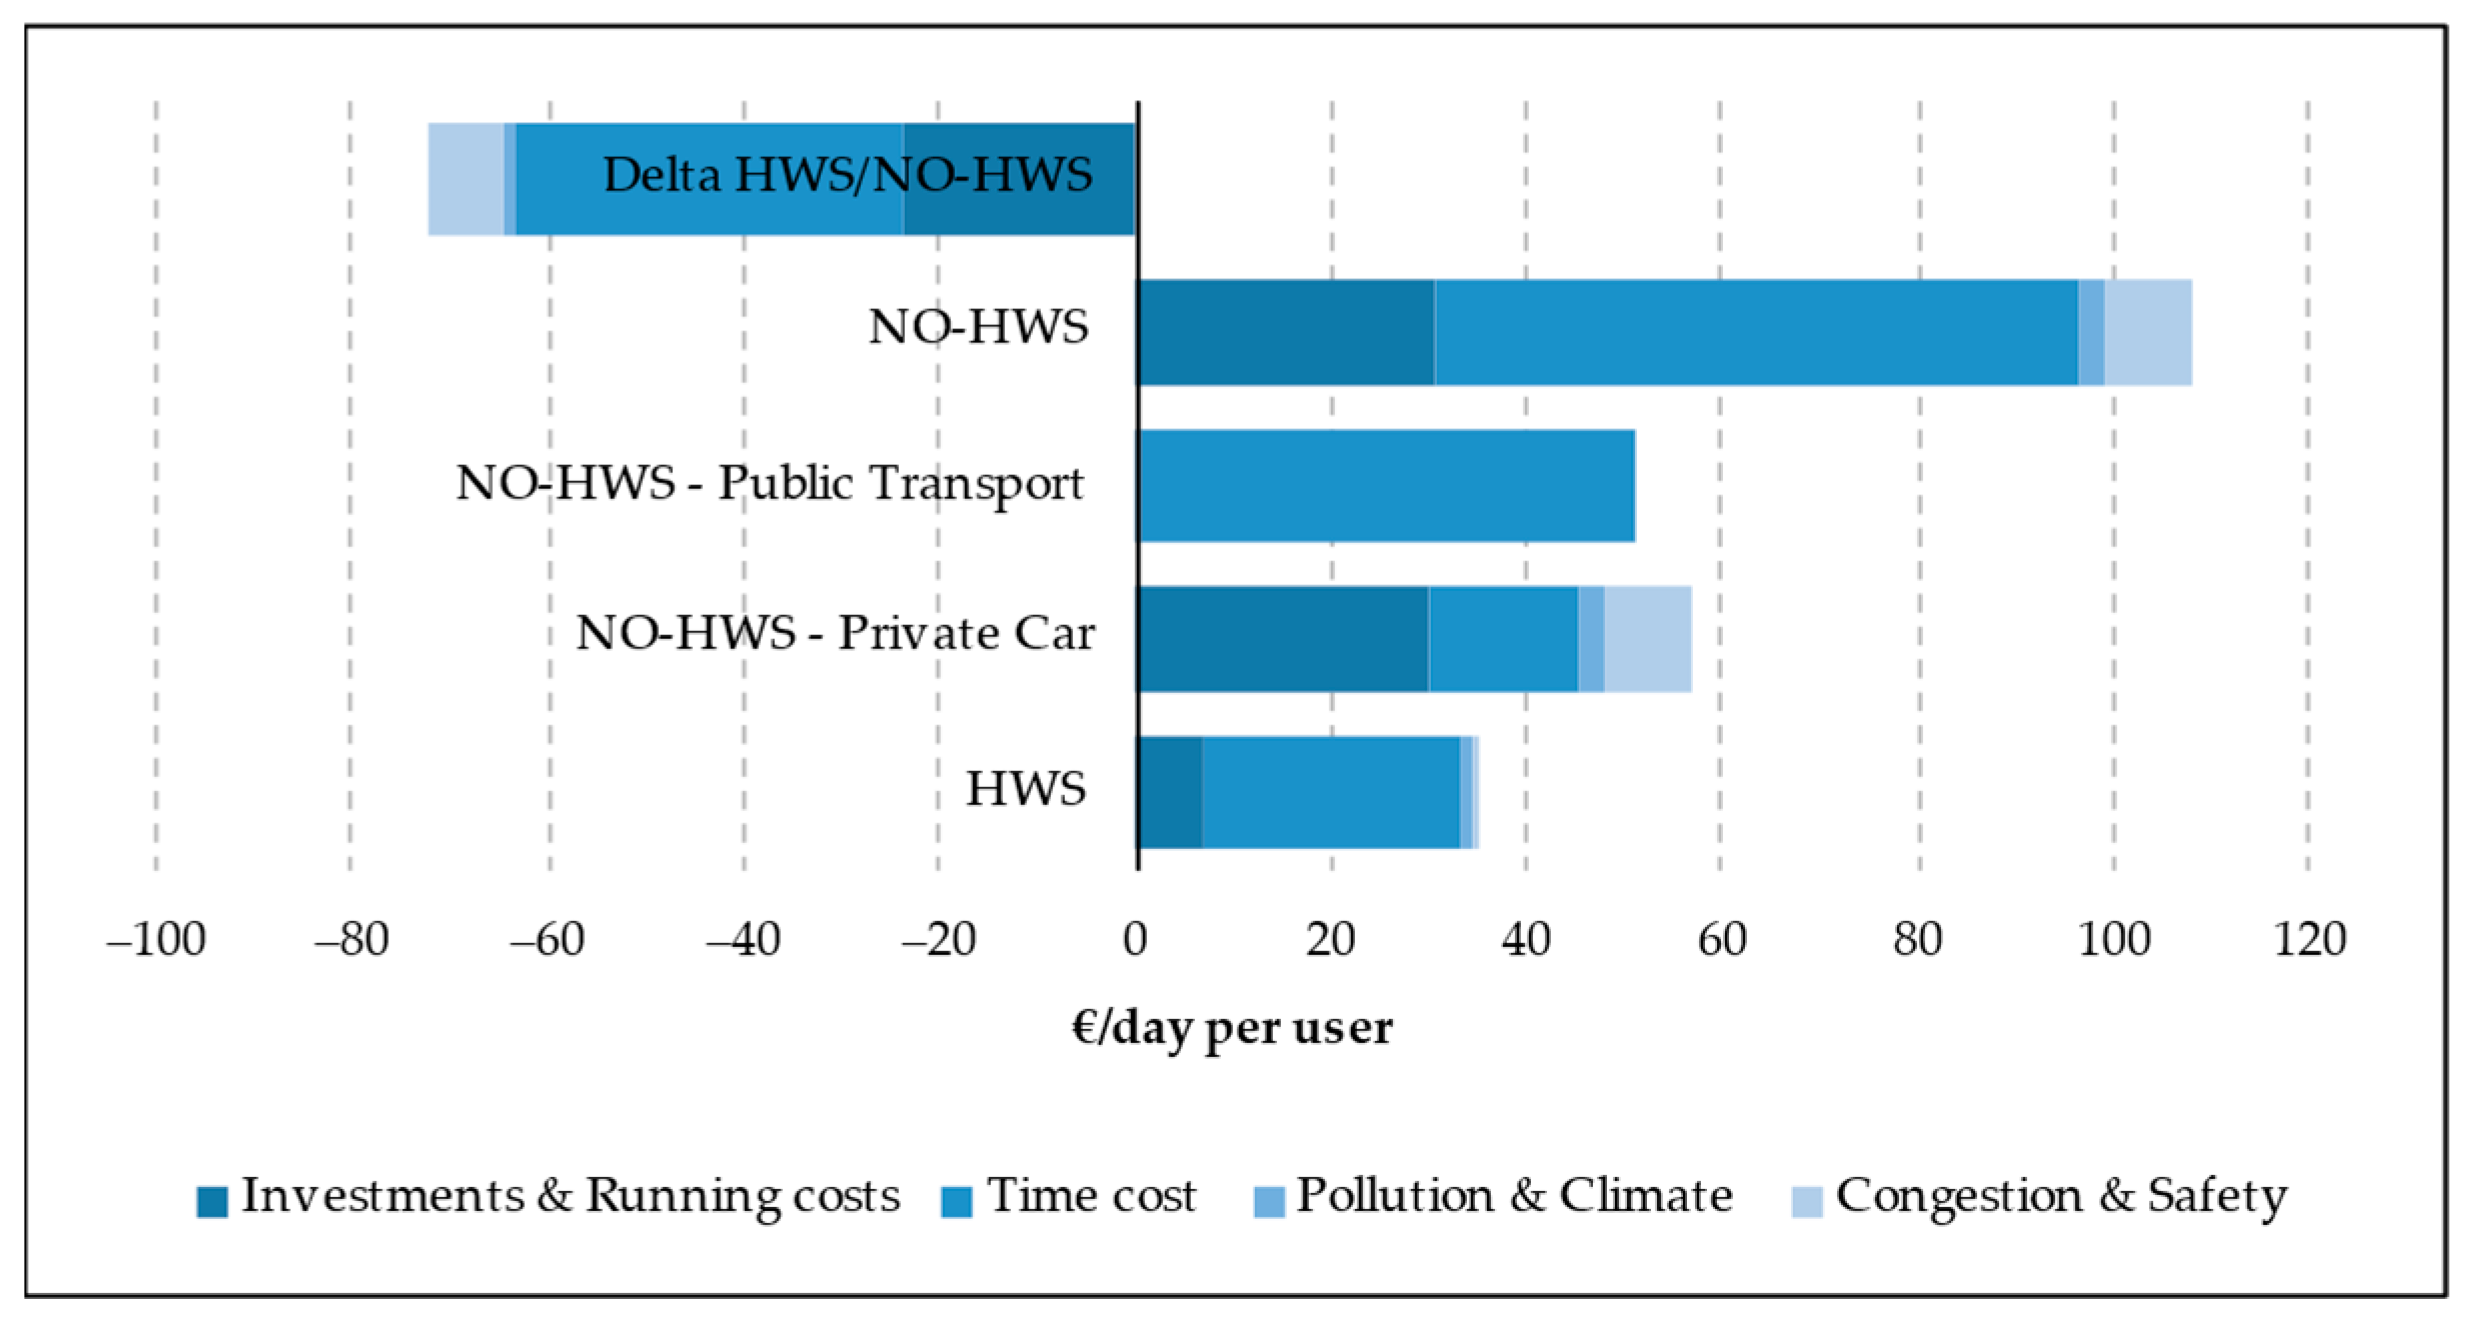
Figure 13 shows the daily expenses per user by mode of transport (shuttles, cars, and public transport). The social cost of an average working day at the ENEA “Casaccia” Research Centre is around 35 EUR/day per person for HWS users, 57 EUR/day per person for private car users, and 51 EUR/day per person for public transport users, considering external costs as invariant. The HWS scenario prevents a social cost increase of about 72 EUR/day compared to the NO-HWS scenario.
In the NO-HWS scenario, public transport users mostly bear the cost of travel time with only a residual amount for the use of the service. On the contrary, private car users bear relevant investment and running costs; moreover, they are responsible for most of the external costs, particularly congestion and safety, which represent over 80% of the overall external costs in this scenario. Pollution emissions have a lower impact, especially due to NOX emissions. External costs of Public Transport have been neglected, as they are invariant between the two scenarios.
The HWS scenario saves on running costs, congestion, safety, and overall travel time, though mean travel time is about 50% higher than car users. In this scenario, overall external costs are very low, subdivided into pollution and climate, and congestion and safety.
5. Conclusions
The present work lays the foundations for the design of an integrated tool able to carry out both the ex ante identification of home-to-work travel optimization strategies and the ex post evaluation of the adopted measures by means of several performance indexes. The final aim is to support mobility management in assessing “soft” actions that might foster sustainable mobility behavior.
Conducting regular surveys is indeed crucial to understanding systematic mobility patterns and designing tailored solutions for home-to-work commuting. In addition, questionnaires can assist in assessing the quality of the transport services that have been implemented and identifying any shortcomings. This, in turn, allows the exploration of possible enhancements that may stimulate a wider uptake of the adopted solutions.
Specifically, when examining the ENEA “Casaccia” case study, it was discovered that a significant number of individuals would use the company’s shuttle service if the routes were optimized and the stop locations were reorganized. Apart from these possible enhancements, the results obtained for the current offer show that the collective transport service ensures more efficient and less polluting home-to-work mobility. The estimated decrease of more than 3 million km per year by private cars reduces 330 tons of CO2 emissions and about one-half metric tons of VOC emissions. Furthermore, this study also highlighted how the service is able to stimulate a socialization context with positive working implications. Finally, the HWS allows monetary savings of around EUR 72 per day, of which 12.5% are external costs saved by reducing car travel, given as invariant the public transport service. As for the internal costs, in the NO-HWS scenario, the public transport users pay a high cost for their travel time, while a large share of the cost is due to investment and running costs for private car users.
For these reasons, the home-to-work travel plan represents a worthwhile solution for managing the mobility demand for a given territorial/organizational context and contributing to reducing dependence on private cars.
The employees benefit from economic savings, psychophysical stress reduction, lower risk of accidents, and increased socialization among themselves. The company would directly benefit from cost savings for parking management and would facilitate access to the center for external personnel. Indirect advantages would come from an improvement in the institution’s image and from an increase in the productivity of the employees, thanks to a reduction in absenteeism and a greater sense of belonging. Furthermore, the relations between the company and the inhabitants of the area could improve. The community would benefit from the reduction in externalities related to air pollution and climate change, the number of accidents, and the level of road congestion.
The main limitation of this study deals with the relevance of the analyzed Italian case study, which focuses exclusively on a single collective shuttle service. Including additional services such as carpooling, ridesharing, and community transport, as well as considering the implementation of flexible work arrangements, will require significant efforts, particularly through survey updates. However, the methodologies used to characterize mobility patterns for different transport modes, as well as those employed for energy–environmental and cost–benefit analysis, are highly comprehensive. Additionally, a significant amount of information collected from the questionnaire would prove valuable in assessing alternative services. Therefore, the present approach appears robust and flexible, as it has the potential to be scaled up for other corporate service analyses.
Another limitation pertains to the absence of optimization of the route and the timetable of the service, as well as the need for better integration with local public transport and services offered by neighboring companies. Addressing these aspects would enhance the current framework, transforming it into a wide-ranging tool for both ex ante and ex post analysis of company transport services.
As future research lines, the current analysis will be updated and expanded to encompass the present configuration of collective company transport, as well as the emerging trends in transportation behaviors during the post-pandemic period.


 ,
, 


