Article

These Boots Are Made for Walking: A Qualitative Study on the Perceived Barriers to Pedestrian Mobility in Madrid

by
M. Eugenia López-Lambas
1,
Andrea Alonso
2,*,
Alba Ramírez-Saiz
2,* and
Andrés Pereira
2
1
Transport-Civil Engineering Department, Universidad Politécnica de Madrid, 28040 Madrid, Spain
2
Urban and Regional Planning-Architecture Department, Universidad Politécnica de Madrid, 28040 Madrid, Spain
*
Authors to whom correspondence should be addressed.
Future Transp. 2023, 3(1), 111-132; https://doi.org/10.3390/futuretransp3010008
Submission received: 5 December 2022 / Revised: 5 January 2023 / Accepted: 10 January 2023 / Published: 16 January 2023

Abstract

:
As an active mode of transportation, walking has proven to be an effective strategy to tackle environmental problems while improving health. The current paper highlights the main factors that either encourage or deter pedestrians in their daily trips by analyzing the arisen discussions in three different Focus Groups (FGs), which were later synthesized into factors ranking according to their positive or negative outcomes. The results help identify these factors and show how a variety of target groups (seniors, young adults, middle-aged adults, divided by male and female perspective) perceive the city in different ways: younger adults prioritize accessibility and quality of the infrastructure, females highlighted the insecurity suffered during nighttime trips, and older adults emphasized the relevance of street maintenance. Finally, the benefits of walking on physical and mental health are viewed positively amongst all target groups, considering walking as a means to help people reduce stress.

1. Introduction

Pedestrians play a vital role in the metropolis from the social, health, or urban mobility points of view. Walking represents the oldest means of transport, and the most universal and sustainable way to access the city, which reverts to the dwellers’ perception of the city [1]. In other words, walking promotes a cordial relationship between individuals and the urban environment by participating in cultural and commercial street activities, appreciating architectural beauty, or interacting with other pedestrians [2].
Despite all the advantages of walking, the acceptance of the Modern Urbanism Movement has fed a debate about the private car monopolizing public space since the Athens Charter was signed in 1930. The increase in the use of private vehicles over the 20th century has allowed the development of sprawling cities and reduced the importance of proximity relationships [3,4]. The excesses in motorized transport contribute to 70% of environmental pollution and 40% of greenhouse gas emissions in European cities [5] and are estimated to cause more than 400,000 deaths annually [5,6].
Furthermore, the dependence on motorized transportation has facilitated a sedentary lifestyle [7,8]. Nowadays, more than 30% of all adults are estimated to engage in insufficient physical activity, which is directly associated with an increase in mortality due to cardiovascular diseases, type 2 diabetes, or cancer [9]. Promoting active modes of transportation improves not only the physical but also the mental health of citizens [10], as well as reducing emissions and congestion in cities [11,12]. Therefore, active modes of transport (walking and cycling) are necessary to improve air quality and encourage combined and more sustainable mobility in cities [5].
The need for radical re-thinking, together with pressing socio-economic issues, has prompted modern cities to adopt urban planning mechanisms to ensure that a better quality of life is granted [13]. Different urban renewal projects have emerged in recent years to bring pedestrians back to the centre of the public space design, specifically by reducing the use of private vehicles in daily mobility [6]. Due to the COVID-19 pandemic, the concept of a “15-min City”, which derives from the city of proximity concept, spread widely, positioning travel time as the central indicator for urban planning [13,14,15]. Slow City or Cittàslow is another philosophy that combines time and urbanism that emerged at the beginning of the 21st century in Italy. Many authors recommend slowing down the daily rhythm of everyday mobility and establishing an alternative to the domination of mechanized traffic in urban spaces [16,17]. Some initiatives, such as the pedestrianization of urban centres or certain historical relevance areas, and the restriction of private vehicles, are gaining relevance, focusing attention on the pedestrian in urban design [17].

2. Research Project and Objectives

The present study aimed to analyse the main factors that may improve pedestrian transportation and the impact that they may have on people’s willingness to change their mobility habits. In fact, this paper is part of a larger research project called DESPACIO, within the framework of the I + D+i RETOS Research Programme (Ministerio de Ciencia, Industria y Competencia, 2017), which looks for better strategies towards promoting walkability by analysing different cases of study, such as Madrid, from varied approaches, such as face-to-face discussions which is the one presented in the present paper. Therefore, this paper conveys only a part of the results of a more extensive project, which sets a basis for further analysis and surveys.
In this context, this paper aims to:
  • Identify the main factors that encourage or deter pedestrians from using the street as a transportation infrastructure
  • Analyze how different factors can influence walking choices and routes in the built environment
  • Prioritize and organize the factors according to their importance and types of pedestrians
To address these objectives, three Focus Group (FG) discussions were conducted. The primary aim of this research is to assess different factors which stemmed from a previous literature review, according to perceptions expressed in the FGs. These were explored according to age and gender criteria under the hypothesis that they might determine these perceptions.
Previous contemporary studies have focused on using virtual scenarios or internet data to address mobility difficulties [18,19,20]. However, they have shown that these innovative approaches may still face technical and methodological issues that need to be solved in future processes [18], focus on traffic environments [19] and not consider the different atmospheres of a city, and can disconnect people from their real contexts and problems. Some others have adopted a country comparative [21] or addressed whole countries to study their pedestrian behaviours [22,23]. Parallelly, the FG methodology was found useful to address individual urban issues, such as what makes a level crossing unsafe [24] or vulnerable groups’ points of view on pedestrian accessibility [25,26]. The latter offer an end-user perspective on the urban scene that could be of extreme value to understanding what hinders or promotes walkability.
Thus, this paper will focus on actively listening to pedestrians’ preferences by implementing the FG methodology in a smaller scenario such as Madrid to transform the qualitative data of users into a quantitative chart to rank the different factors gathered from the studied literature references.

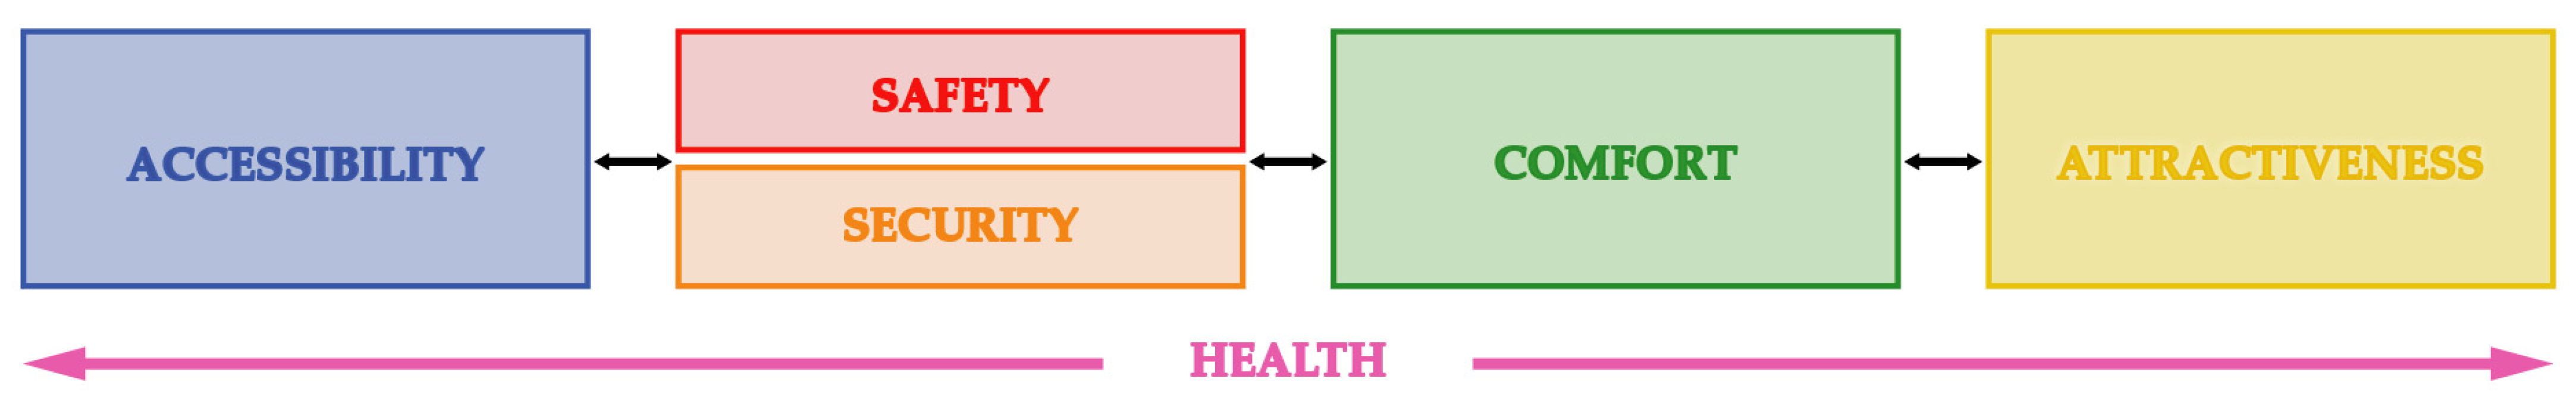
3. Literature Context for the Study

The urban environment plays a key role in pedestrian mobility, and multiple factors may foster or hinder walkability and pedestrians’ willingness towards it. For example, sharing the streets with other pedestrians, prioritizing this means over others, and streets’ conditions favour access to everyday, local needs [1]. Several researchers have examined the walkability of the built environment by adopting different concepts and approaches. Adkins et al. [27] highlighted the importance of the attractiveness of streets, while Gori et al. [28] suggested connectivity as the main feature for the urban scene to be more attractive for pedestrians.
Most authors have classified the conditions for achieving pedestrian environments under four main blocks: accessibility, safety/security, comfort, and attractiveness [29,30,31,32]. When pedestrians’ needs associated with either of these blocks are covered, it is possible to achieve better pedestrian quality. This reality highlights the need for a specific analysis of these elemental conditions to identify other factors influencing pedestrians at an individual level (e.g., cultural, socioeconomic, geographic, age, gender, etc.) [15,31,33]. Some authors have considered more complex dimensions, such as space syntax and the different scales of the built environment or streets [34].
The current study focuses on the four categories or blocks mentioned above representing the basis. In addition to these four blocks, an additional Health block was considered a key factor of discussion since people’s living area highly influence their well-being, as many authors have proved [35]. The aspects that may hamper a good quality of life can be the consequence of all four previously mentioned blocks; thus, health has been considered transversally throughout the analysis as a fifth block, together with the base four suggested by the literature.
This five blocks diagram is the most optimal for the FG’s planning and development so the general public can understand the content using a holistic and simplified figure (Figure 1).
In the following subsections, there is a more extensive definition of each of the five blocks. This analysis set the theoretical framework for the FG analysis and discussion. These have triggered a list of factors that may promote or hinder walkability, so this paper will overcome previous studies by providing a comprehensive inside into each category.

3.1. Accessibility

Accessibility is the structuring condition, especially the physical one. It refers to the existence of a pedestrian infrastructure. It represents key aspects of pedestrian mobility, from the pavement continuity to the materials, including obstacles that prevent people from walking [29,31,36]. Most of these also condition inclusive mobility for people of different abilities because pedestrian transportation is the most inclusive of all the means of transport provided streets present proper design and maintenance [37,38,39].
Other perspectives on accessibility also include the possibility of a connection between different parts of the city, even by using public transport [40,41], which would improve pedestrian walkability by reducing the need to use private vehicles.

3.2. Safety/Security

The second condition to analyze is the sense of reliability conveyed by both the urban configuration and the infrastructure available to the pedestrian as an individual. Talavera-García and Soria Lara [29] mentioned three approaches to examine pedestrian mobility: the pedestrian as a mode of transport, the pedestrian as the environment, and a combination of both.
Numerous researchers focused on road safety, including the friction between different modes of transport [29,42,43,44]. The fear of being attacked in the public space can likewise affect physical integrity [45,46,47].
Notably, some factors served as both security and comfort issues in different studies. For example, Alfonzo [30] considered traffic calming measures as a comfort factor, but Talavera-García and Soria-Lara [29] included these measures as part of security.
This safety and security feeling is also altered by the gender perspective, as women tend to detect more threats than men due to historical discrimination and current urban practices [48].

3.3. Comfort

Comfort may be the most complex aspect to quantify because of the diversity of nuances involved in this concept (e.g., physical or psychological) [49,50]. Furthermore, it includes different variables that may fluctuate because of particular personal preferences, ranging from meteorological aspects to street furniture, ornamental elements or vegetation [51,52].
To address this issue, the FG focused on the factors that generate stress regarding walkability, so as to find about this category from the counterpart.

3.4. Attractiveness

Attractiveness refers to the landscapes along the pedestrian routes. The 3Ds model (design, diversity, density) originally proposed by Cervero and Kockelman [53] has scaled up since then to other factors such as scale, image deterioration, or sense of belonging or familiarity [54,55]. Accordingly, dense streets with various types of land use are essential for pedestrian-space design and fostering pedestrian mobility [56]. Shops and stores create attractive atmospheres, ensuring citizens’ participation in the economic and cultural scene [29].

3.5. Health

As stated in the introduction of this paper, many studies consider pollution and aggressive environments the cause of multiple physical and mental diseases. Numerous urban design studies have proven the connection and the effects that the city has on the health of its inhabitants [26] and made special emphasis on specific conditions for the different age groups, such as loneliness for the senior population [44], mental health problems in the youngsters [45] and the cardiovascular diseases of middle-aged adults for low physical activity [43]. A moderate activity of just 150 min per week is enough to tackle several of the most predominant causes of death in the European Union countries. At the same time, as with any other physical activity, stress is decreased by releasing endorphins and other neurotransmitters [46].
Active mobility can have both direct and indirect health-improving effects: it can reduce the risk of developing cardiovascular diseases and car dependency, which translates into better air street quality [47]. Also, by reducing car speed or applying slow-city techniques, it would be possible to mitigate the sensation of feeling rushed or the stress that the city may exercise over the citizens [16,48].

3.6. Resulting Factors According to the Different Content Blocks
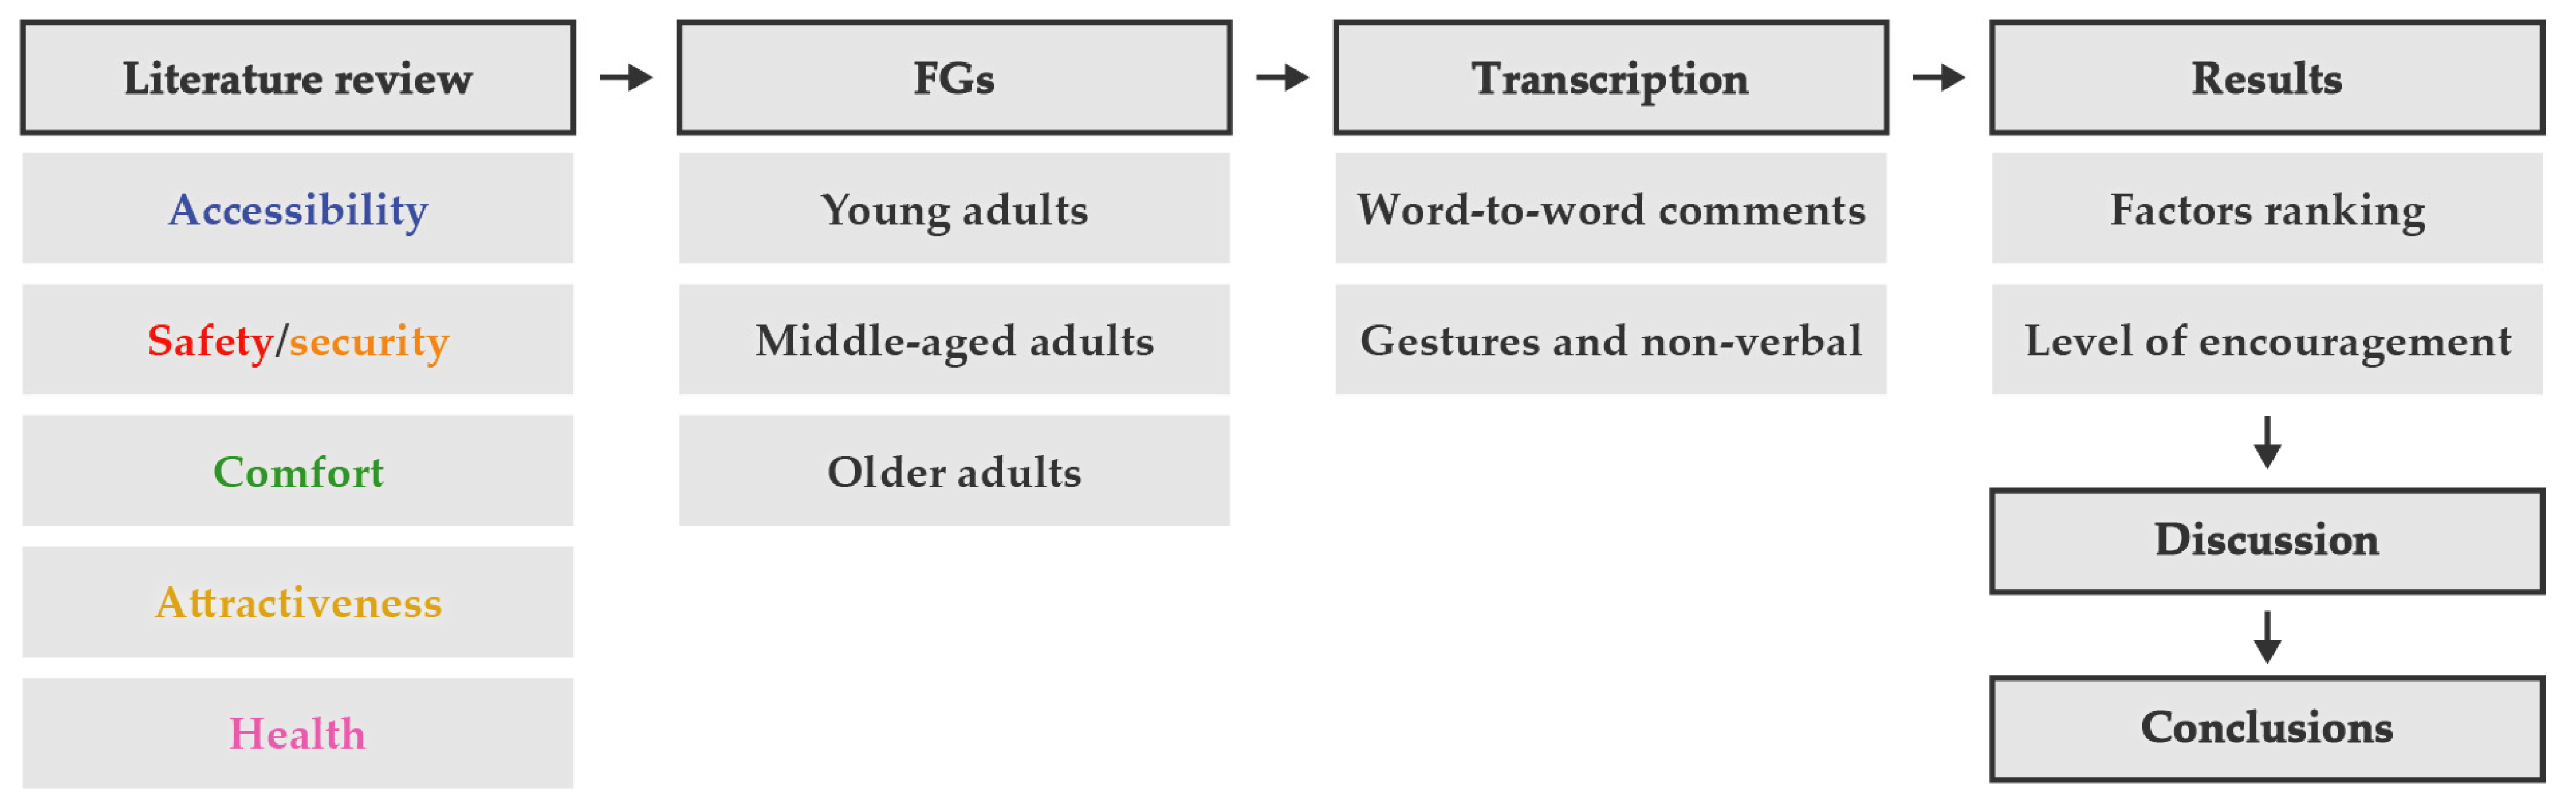
The following table (Table 1) condenses all the factors extracted from the literature analysis and it would be used for the Focus Group comments’ analysis.

4. Methodology

Focus Group (FG) is a method widely employed in sociological research to understand perceptions, ideas, and opinions of a certain population on a plan, policy, or trend [49]. In the FGs, a reduced number of participants interact around a topic of discussion, whose ultimate conclusions lead to specific qualitative data. Free discussion among the attendants is key to achieving remarkable outcomes, being this the main difference with group interviews.
This methodology may present some demerits since the analysis of the compiled conclusions from an FG is complex as it does not represent statistical data nor fits every line of research [50]. However, the FG method is relevant to the goal of the current paper, which is to understand the perceptions and feelings of the population in a specific context. Thus, FG is the optimal tool for the objective of the present analysis: understanding the different factors that affect walkability and pedestrians’ priorities.
To grant the most appropriate way to develop the FGs, we followed some recommendations provided by Kitzinger [50] and Krueger & Casey [49] and adapted them to the specific case of this study (Table 2):
In this paper, three FG were carried out in March 2019 to gather data from multiple backgrounds, organizing three gatherings that represented different age-related target groups while maintaining gender parity:
  • Young adults (18 to 34 years old), held in the Civil Engineering Faculty at the Universidad Politécnica de Madrid (UPM). Made up of six people, three of them being women.
  • Middle-aged adults (35 to 64 years old), held in the Civil Engineering Faculty at the Universidad Politécnica de Madrid (UPM). Made up of seven people, four of them being women.
  • Older adults—retired (over 65 years old), held in a Social Community Center from Madrid. Made up of seven people, five of them being women.
Additionally, two people with restricted mobility (with visual disability) and two parents with young children participated in order to grant the inclusion of different needs, in addition to varied working profiles, among the participants. Although these externalities were not assessed during the analysis, they delivered more fruitful conclusions from the FG sessions.
These people were recruited from different backgrounds and through varied channels to increase the variety of represented collectives: people with disability associations from Madrid, university students and personnel, social networking sites and direct communication with former collaborators in previous projects.
A total of three people conducted the sessions:
  • Two moderators to grant full participation of all the attendees. They were in charge of introducing the different blocks of discussion, with no fixed questions to keep the dialogue as natural as possible. They allowed free debate on the most relevant factors according to the participants. No distinction was made to the aim of the pedestrian trip, as every destination could provide valuable inputs on the topic, showing different needs for different purposes.
  • One reporter to note down all the reactions that did not reflect on audio.
The subsequent transcriptions and classifications were supervised by the moderators and reporters to provide as much objectivity as possible. All participants were informed of their anonymity being assured, about the purpose of the research, how their data would be used, and lack of risks associated with the project.
After conducting the FG discussions, a subsequent classification of the comments according to age and gender was made following the selected factors and blocks (Figure 1 and Table 1). This classification also examined the extent to which these factors encourage (positive), discourage (negative), or do not affect (neutral) pedestrians according to age and gender. The reporter collected non-verbal signs such as nodding or shaking of the head for a thorough analysis. Consequently, contributions will be analysed including the following information:
  • Transcripted comment
  • Block (from Table 1)
  • Factor (from Table 1)
  • Gender: male or female
  • Age group: 18–34, 35–64 or ≥65
  • Type (of comment): positive, negative or neutral
Thus, the expected results of the present analysis are twofold:
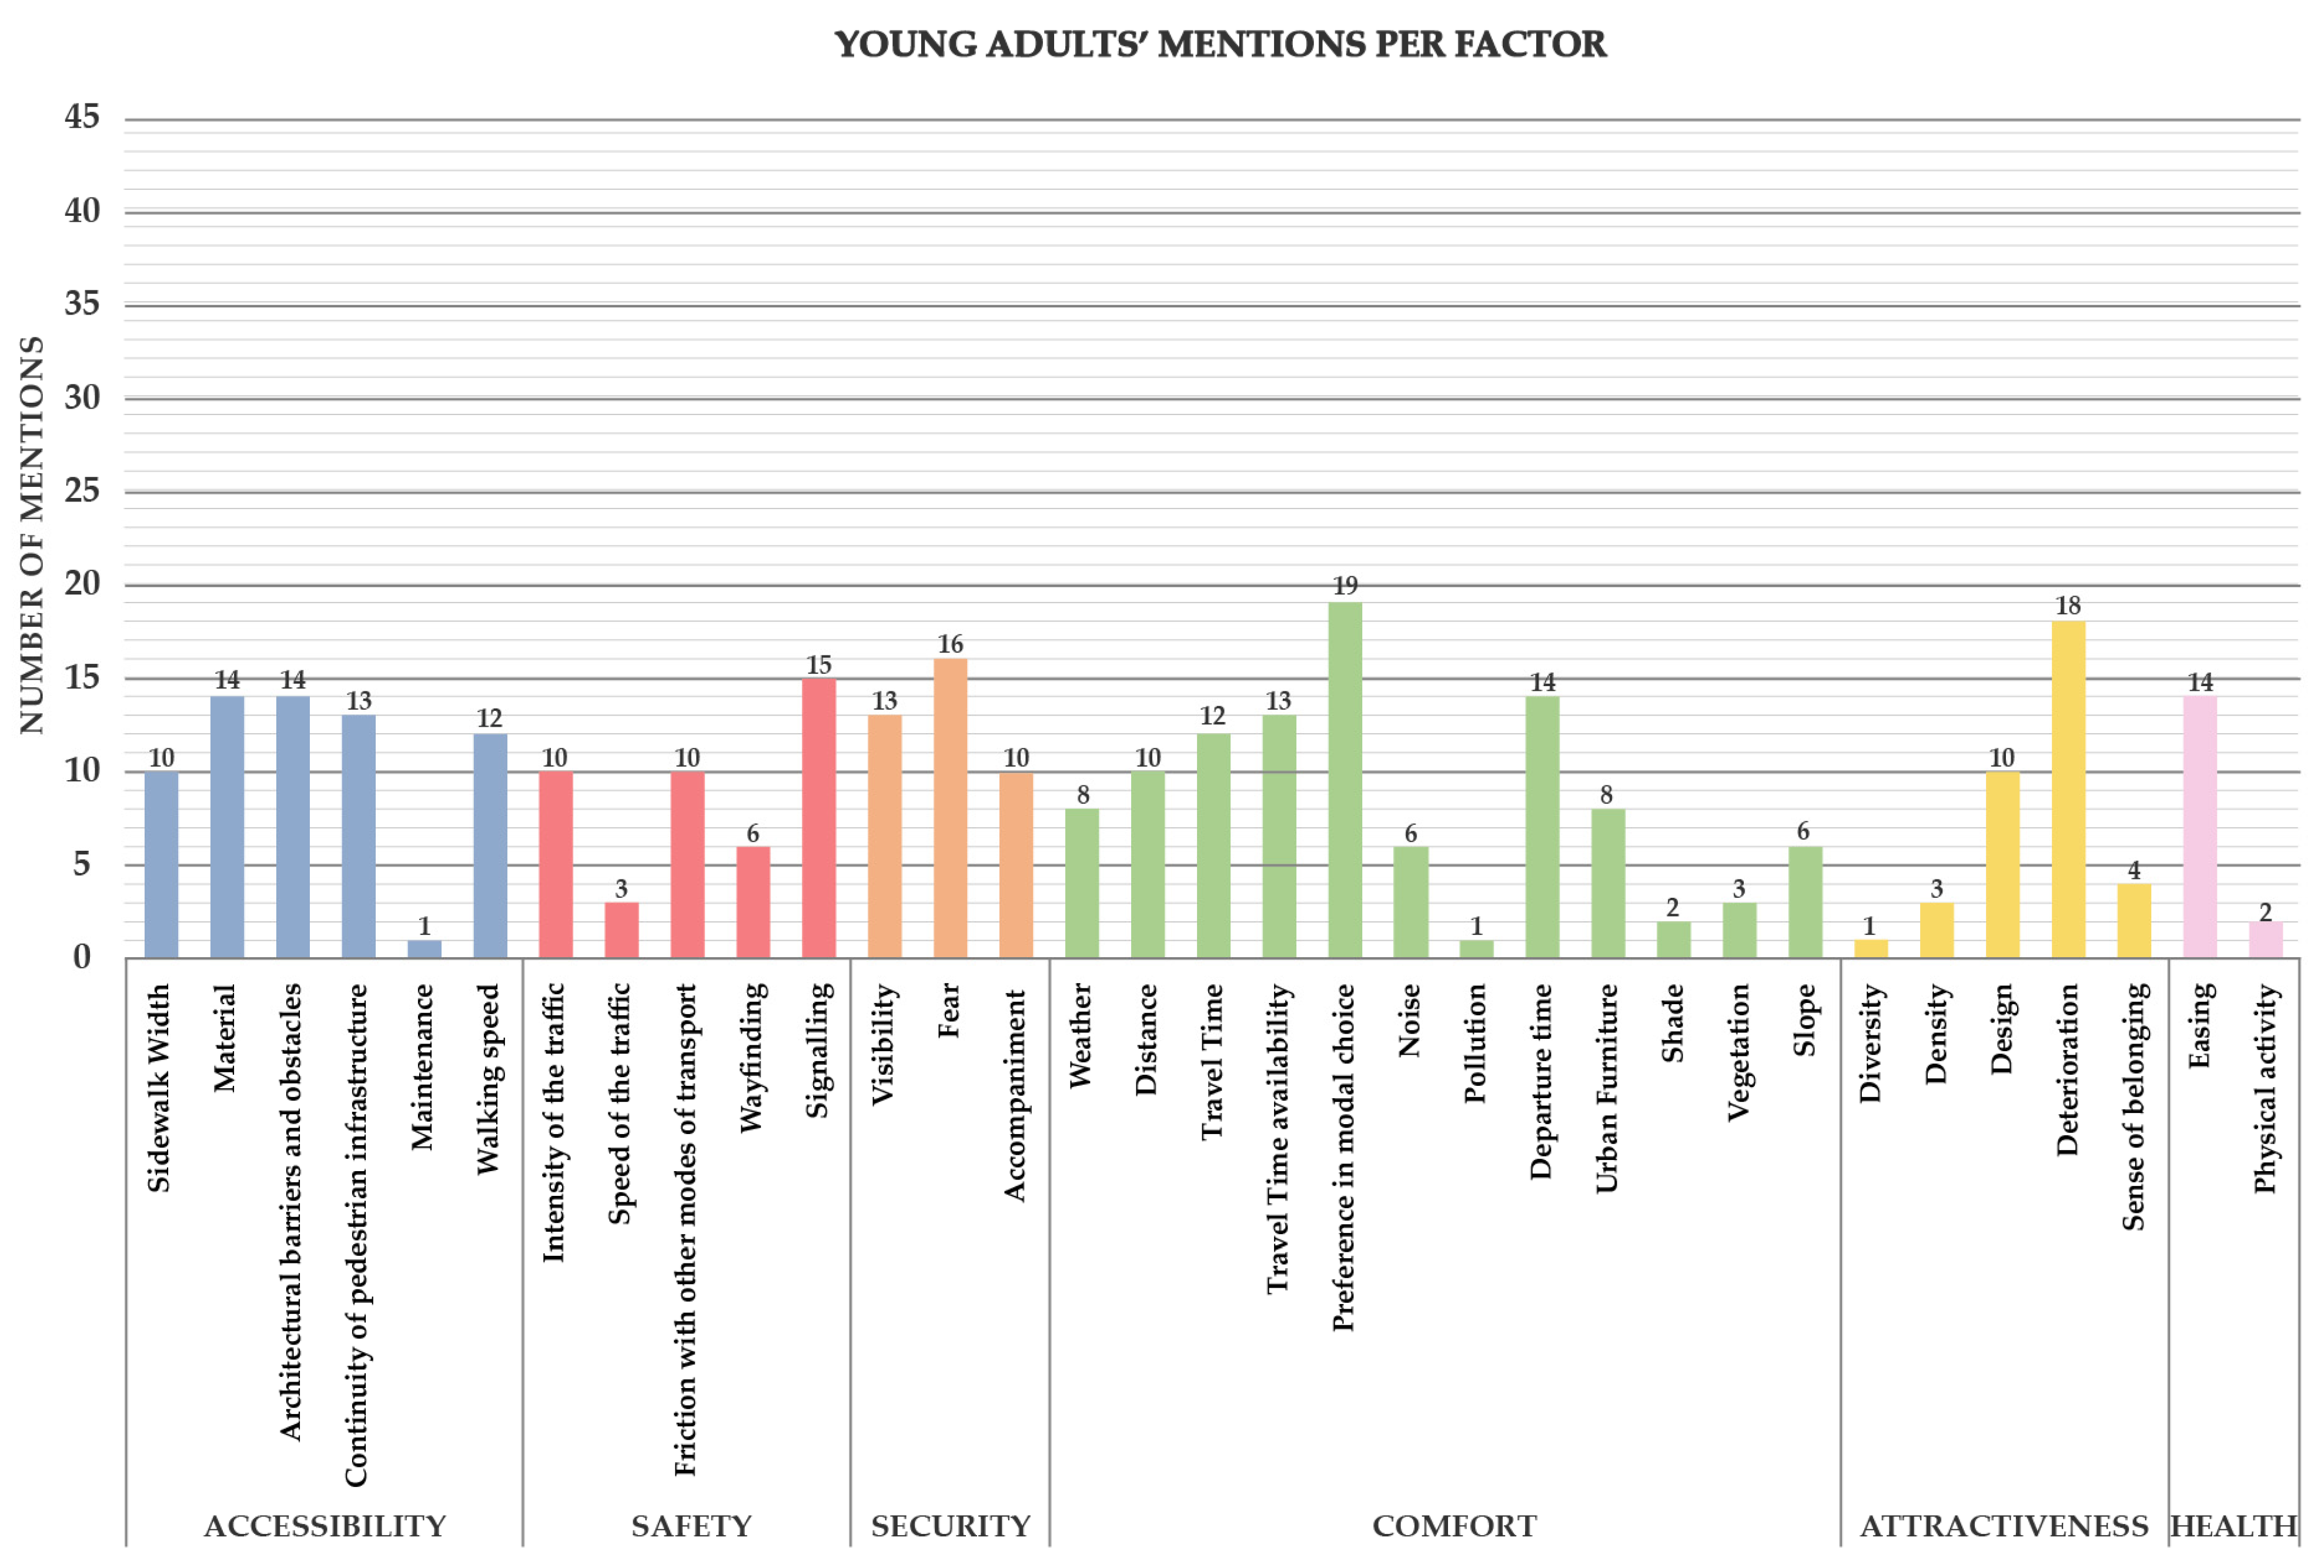
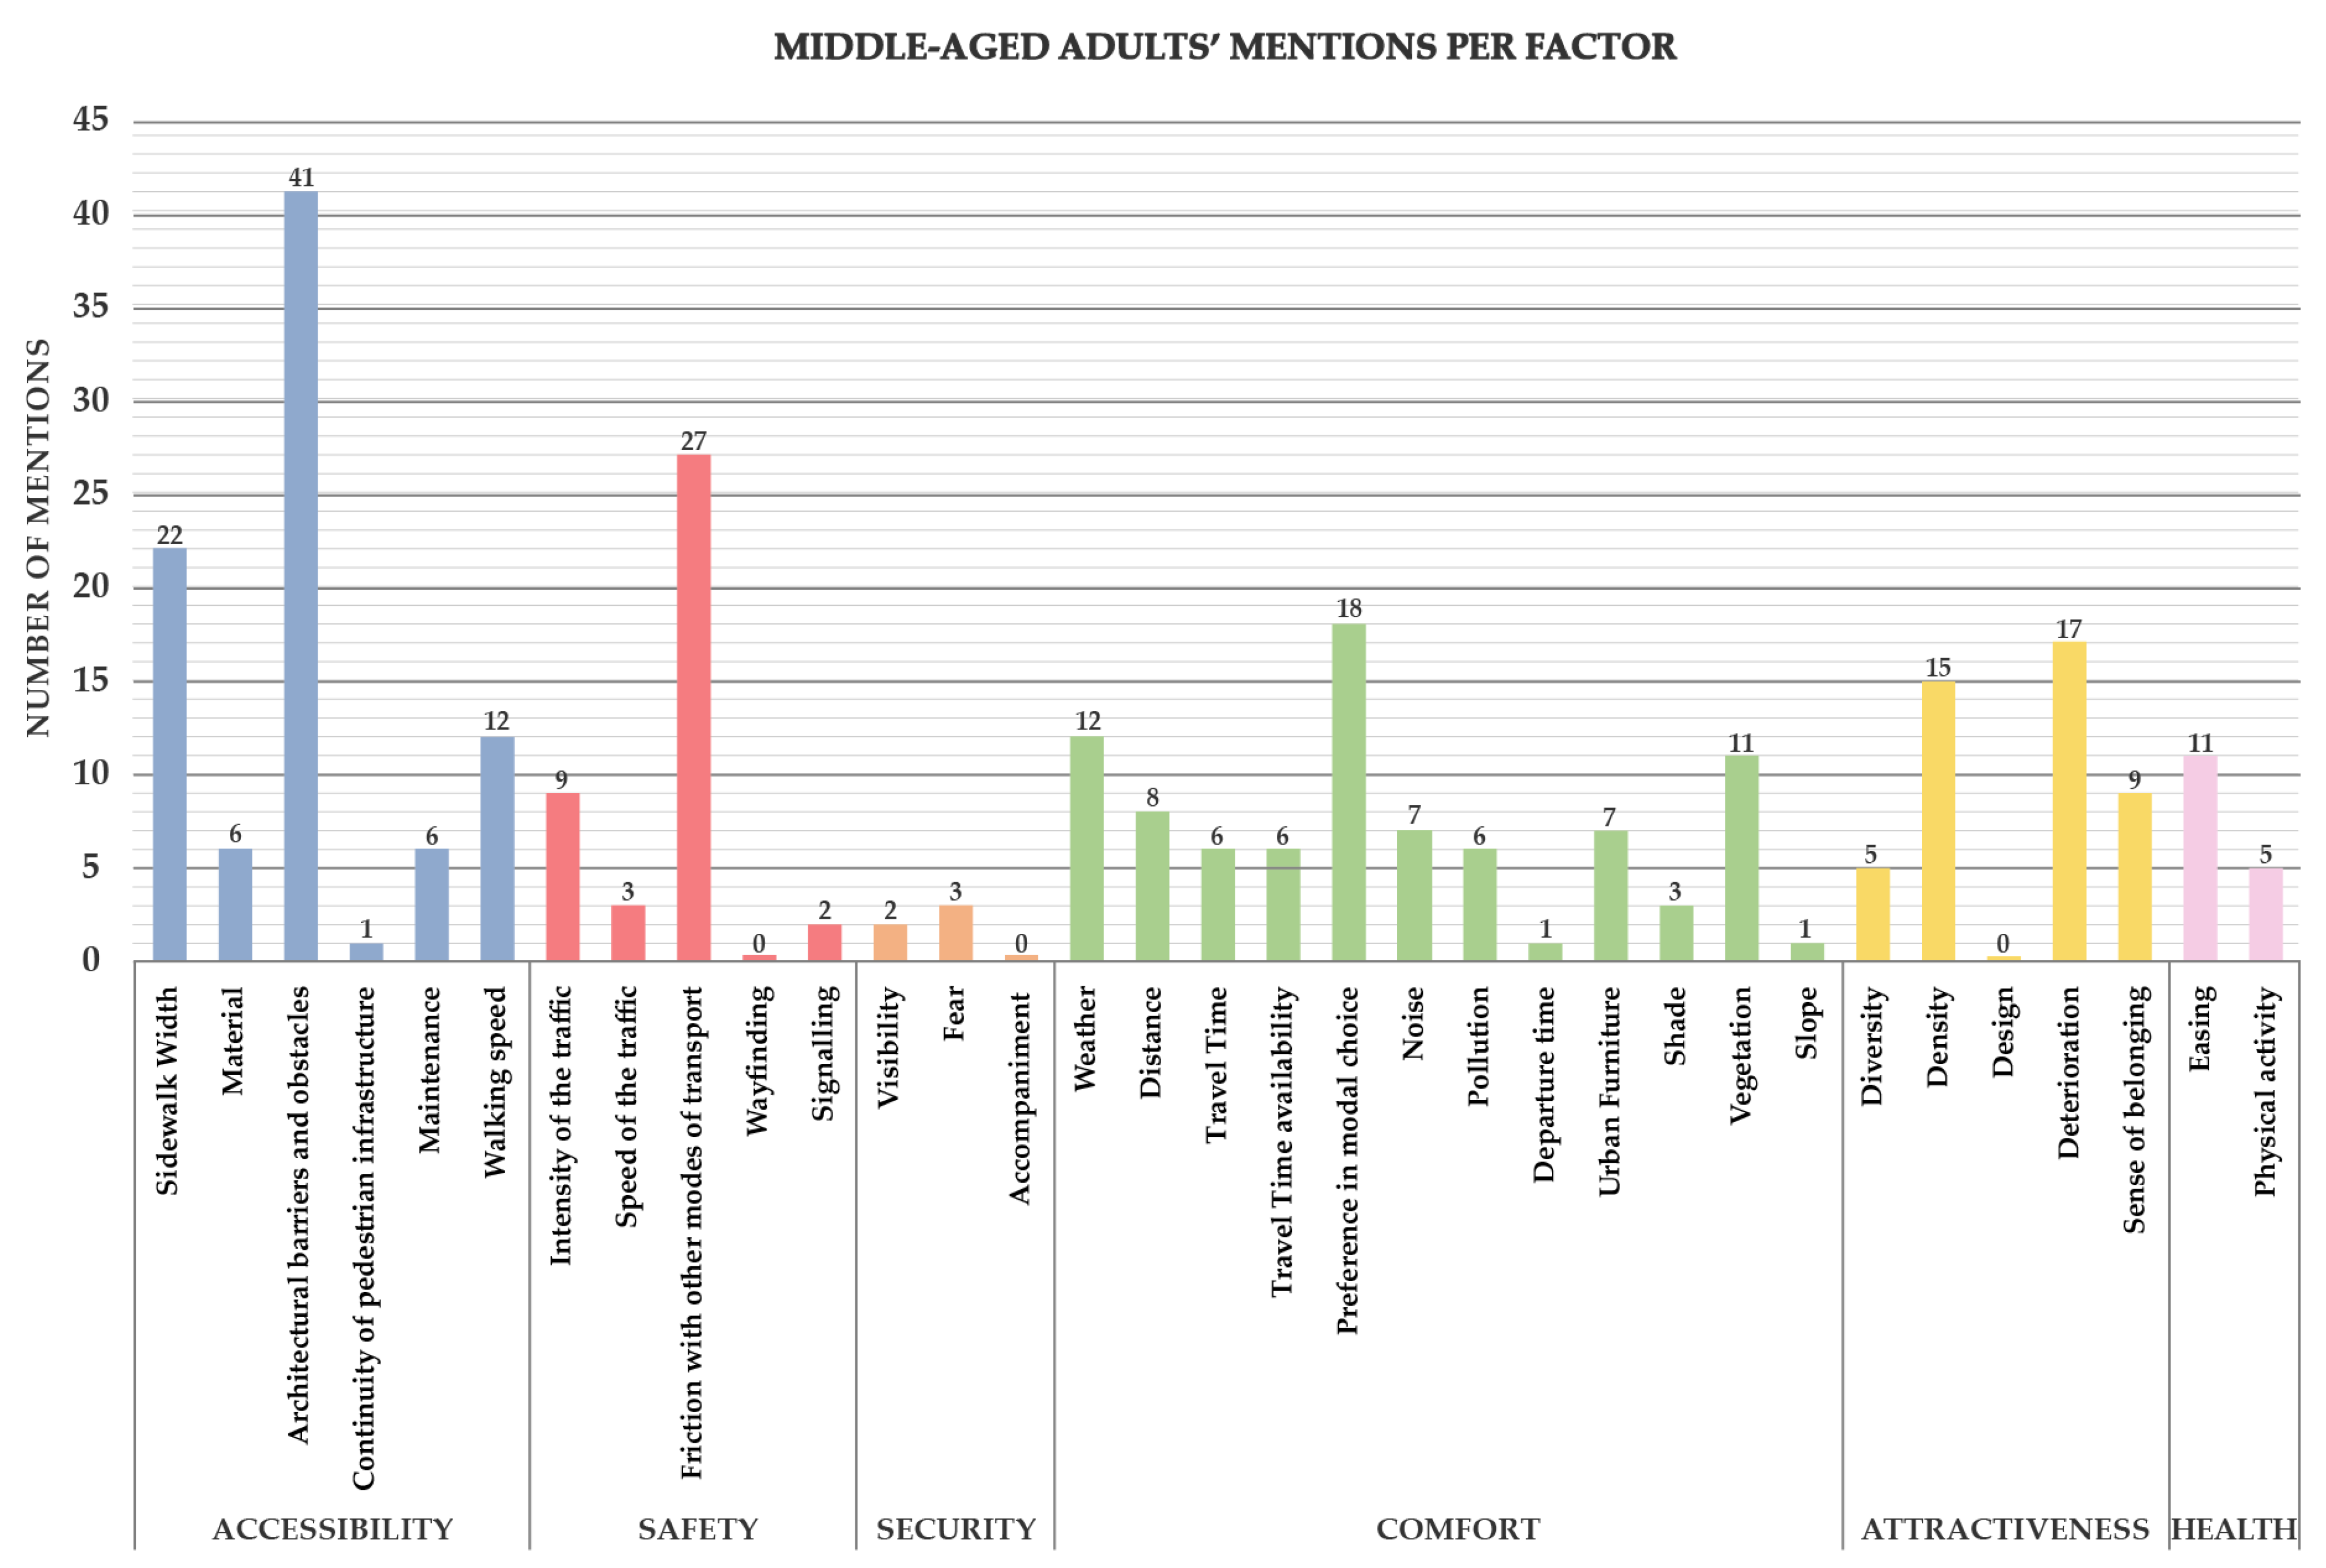
  • Factors ranking: Ranking on the relevance of the different factors for pedestrians, measured by the number of mentions each of them received.
  • Level of encouragement: Identification of the factors that hinder and foster walkability.
Therefore, the sequence followed in the present study is as follows (Figure 2):

5. Results

A total of 858 comments resulted from the three FGs (301 from young adults, 282 from middle-aged adults, and 275 from older adults). Some of the most relevant statements have been reported in the discussion section.
These comments translated into a ranking on the different factors that intervene in walkability and the role in encouraging or discouraging, and the part that each block plays in fostering pedestrian transportation.

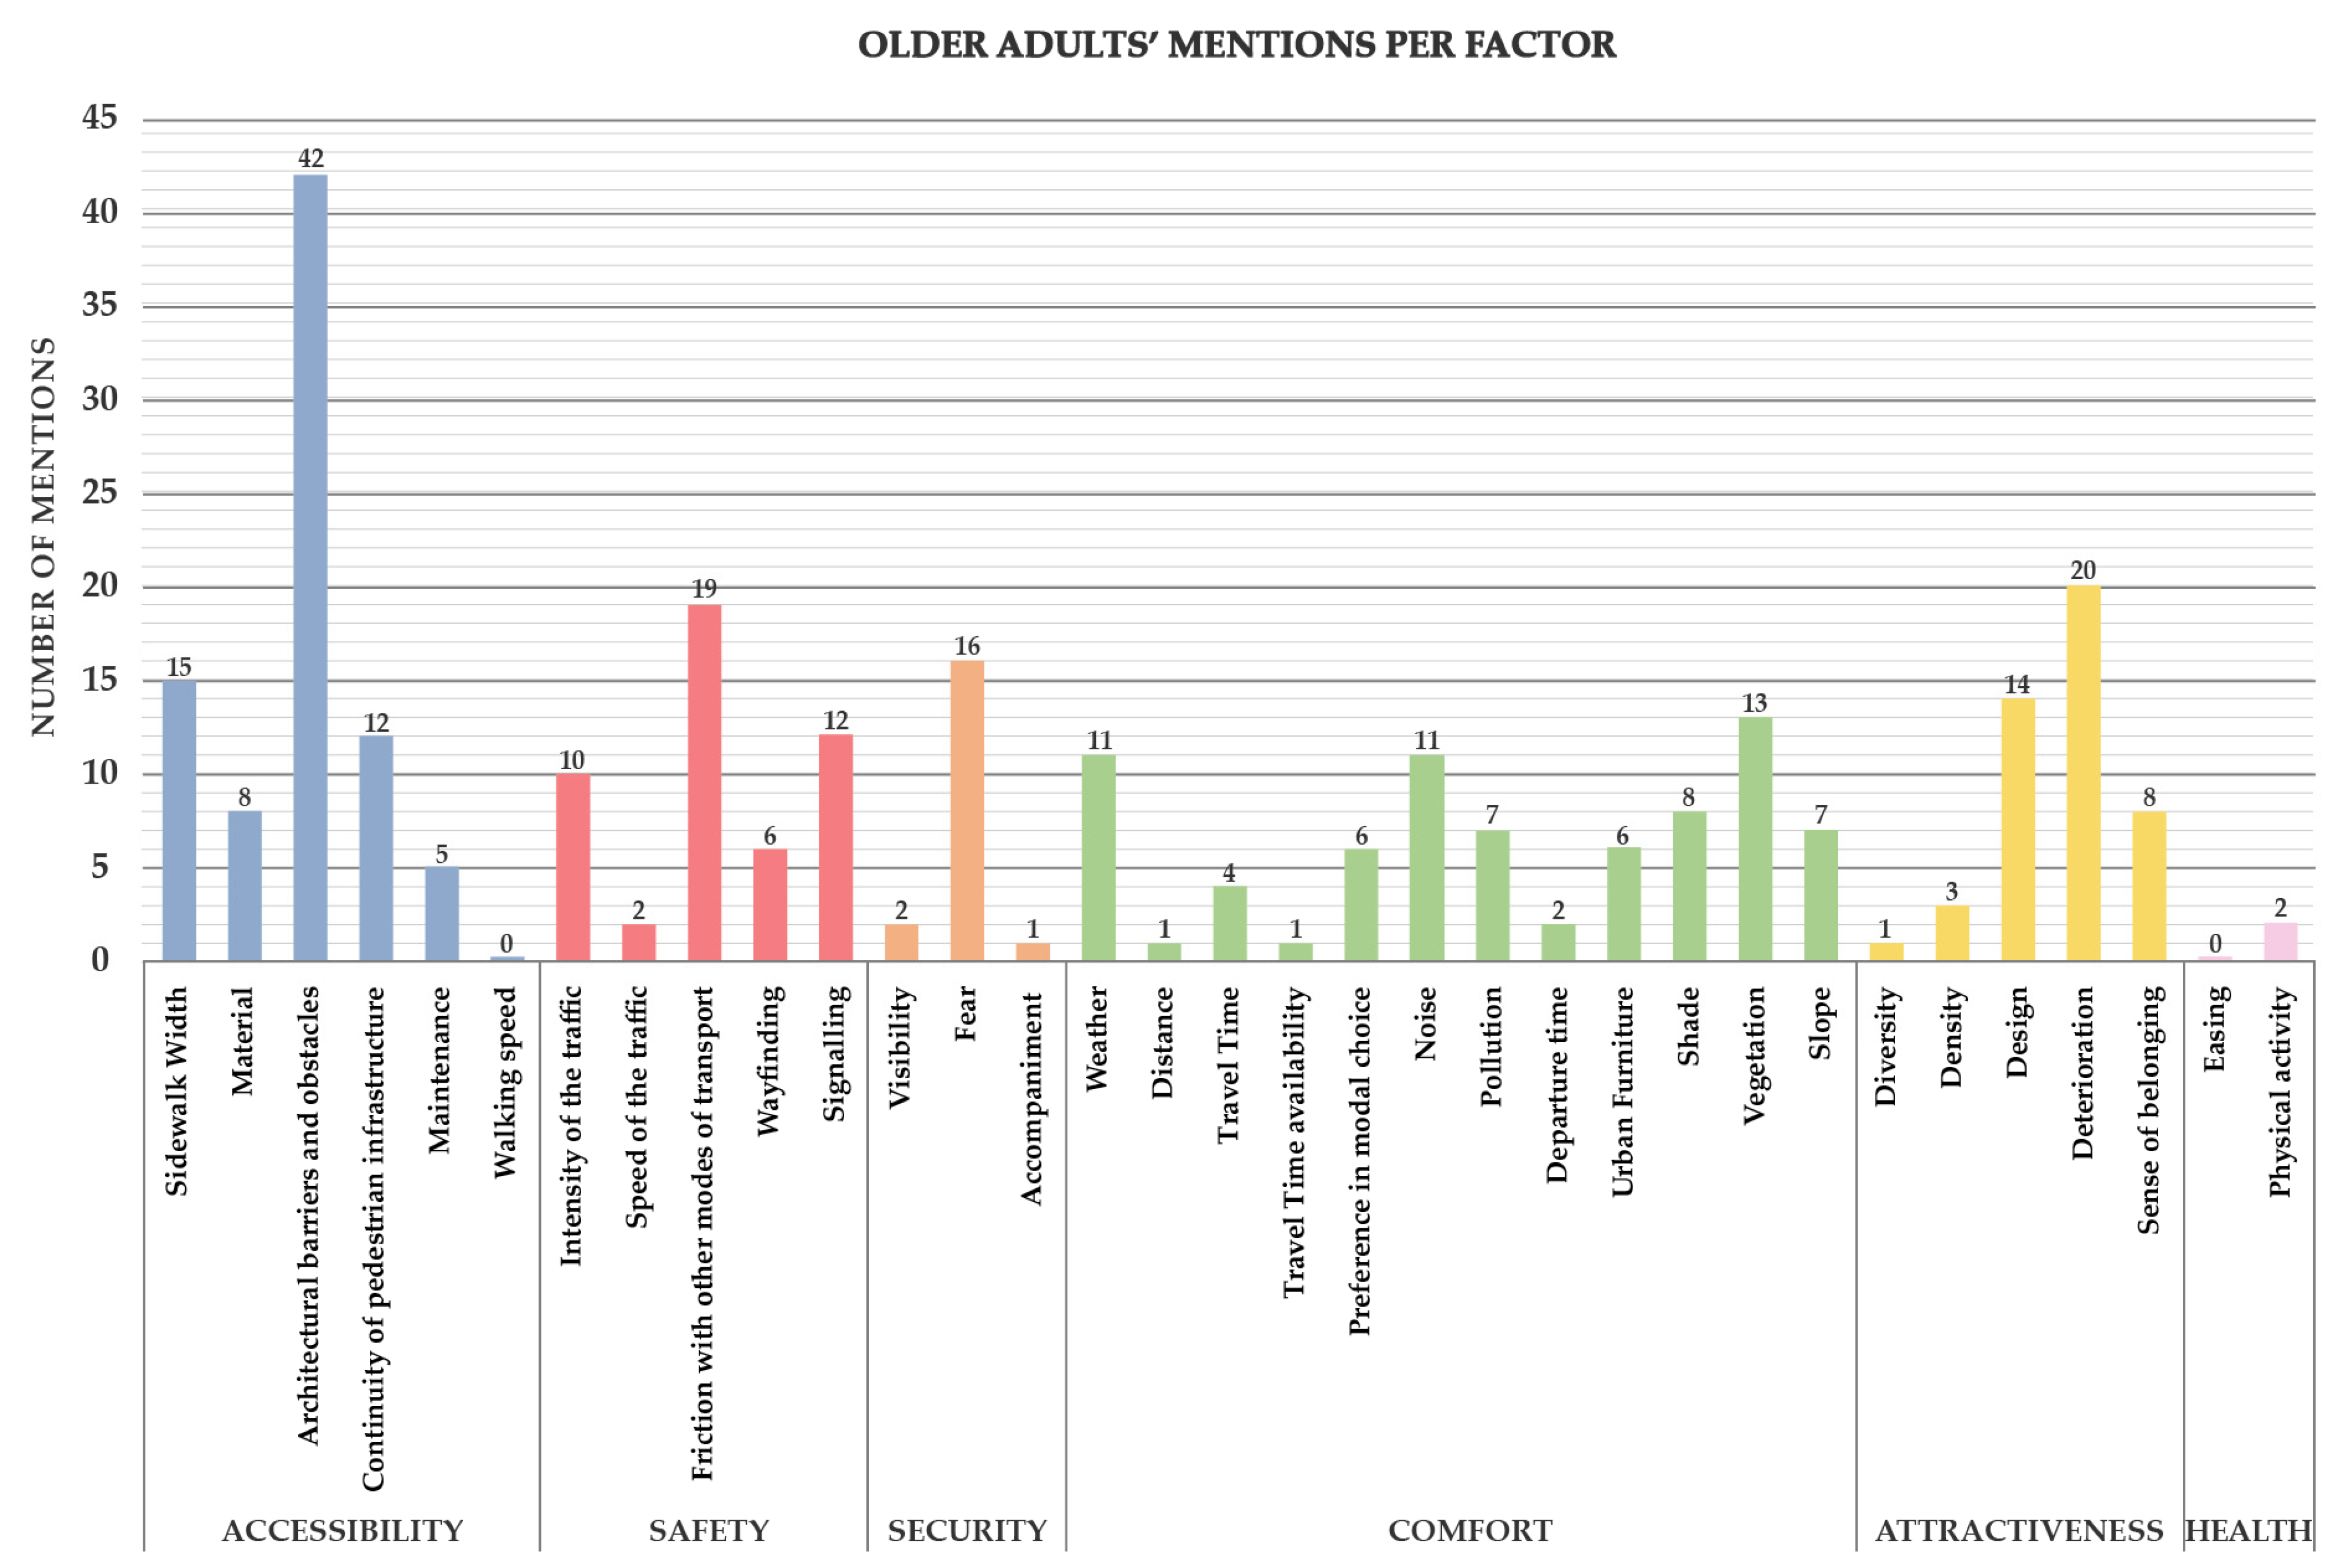
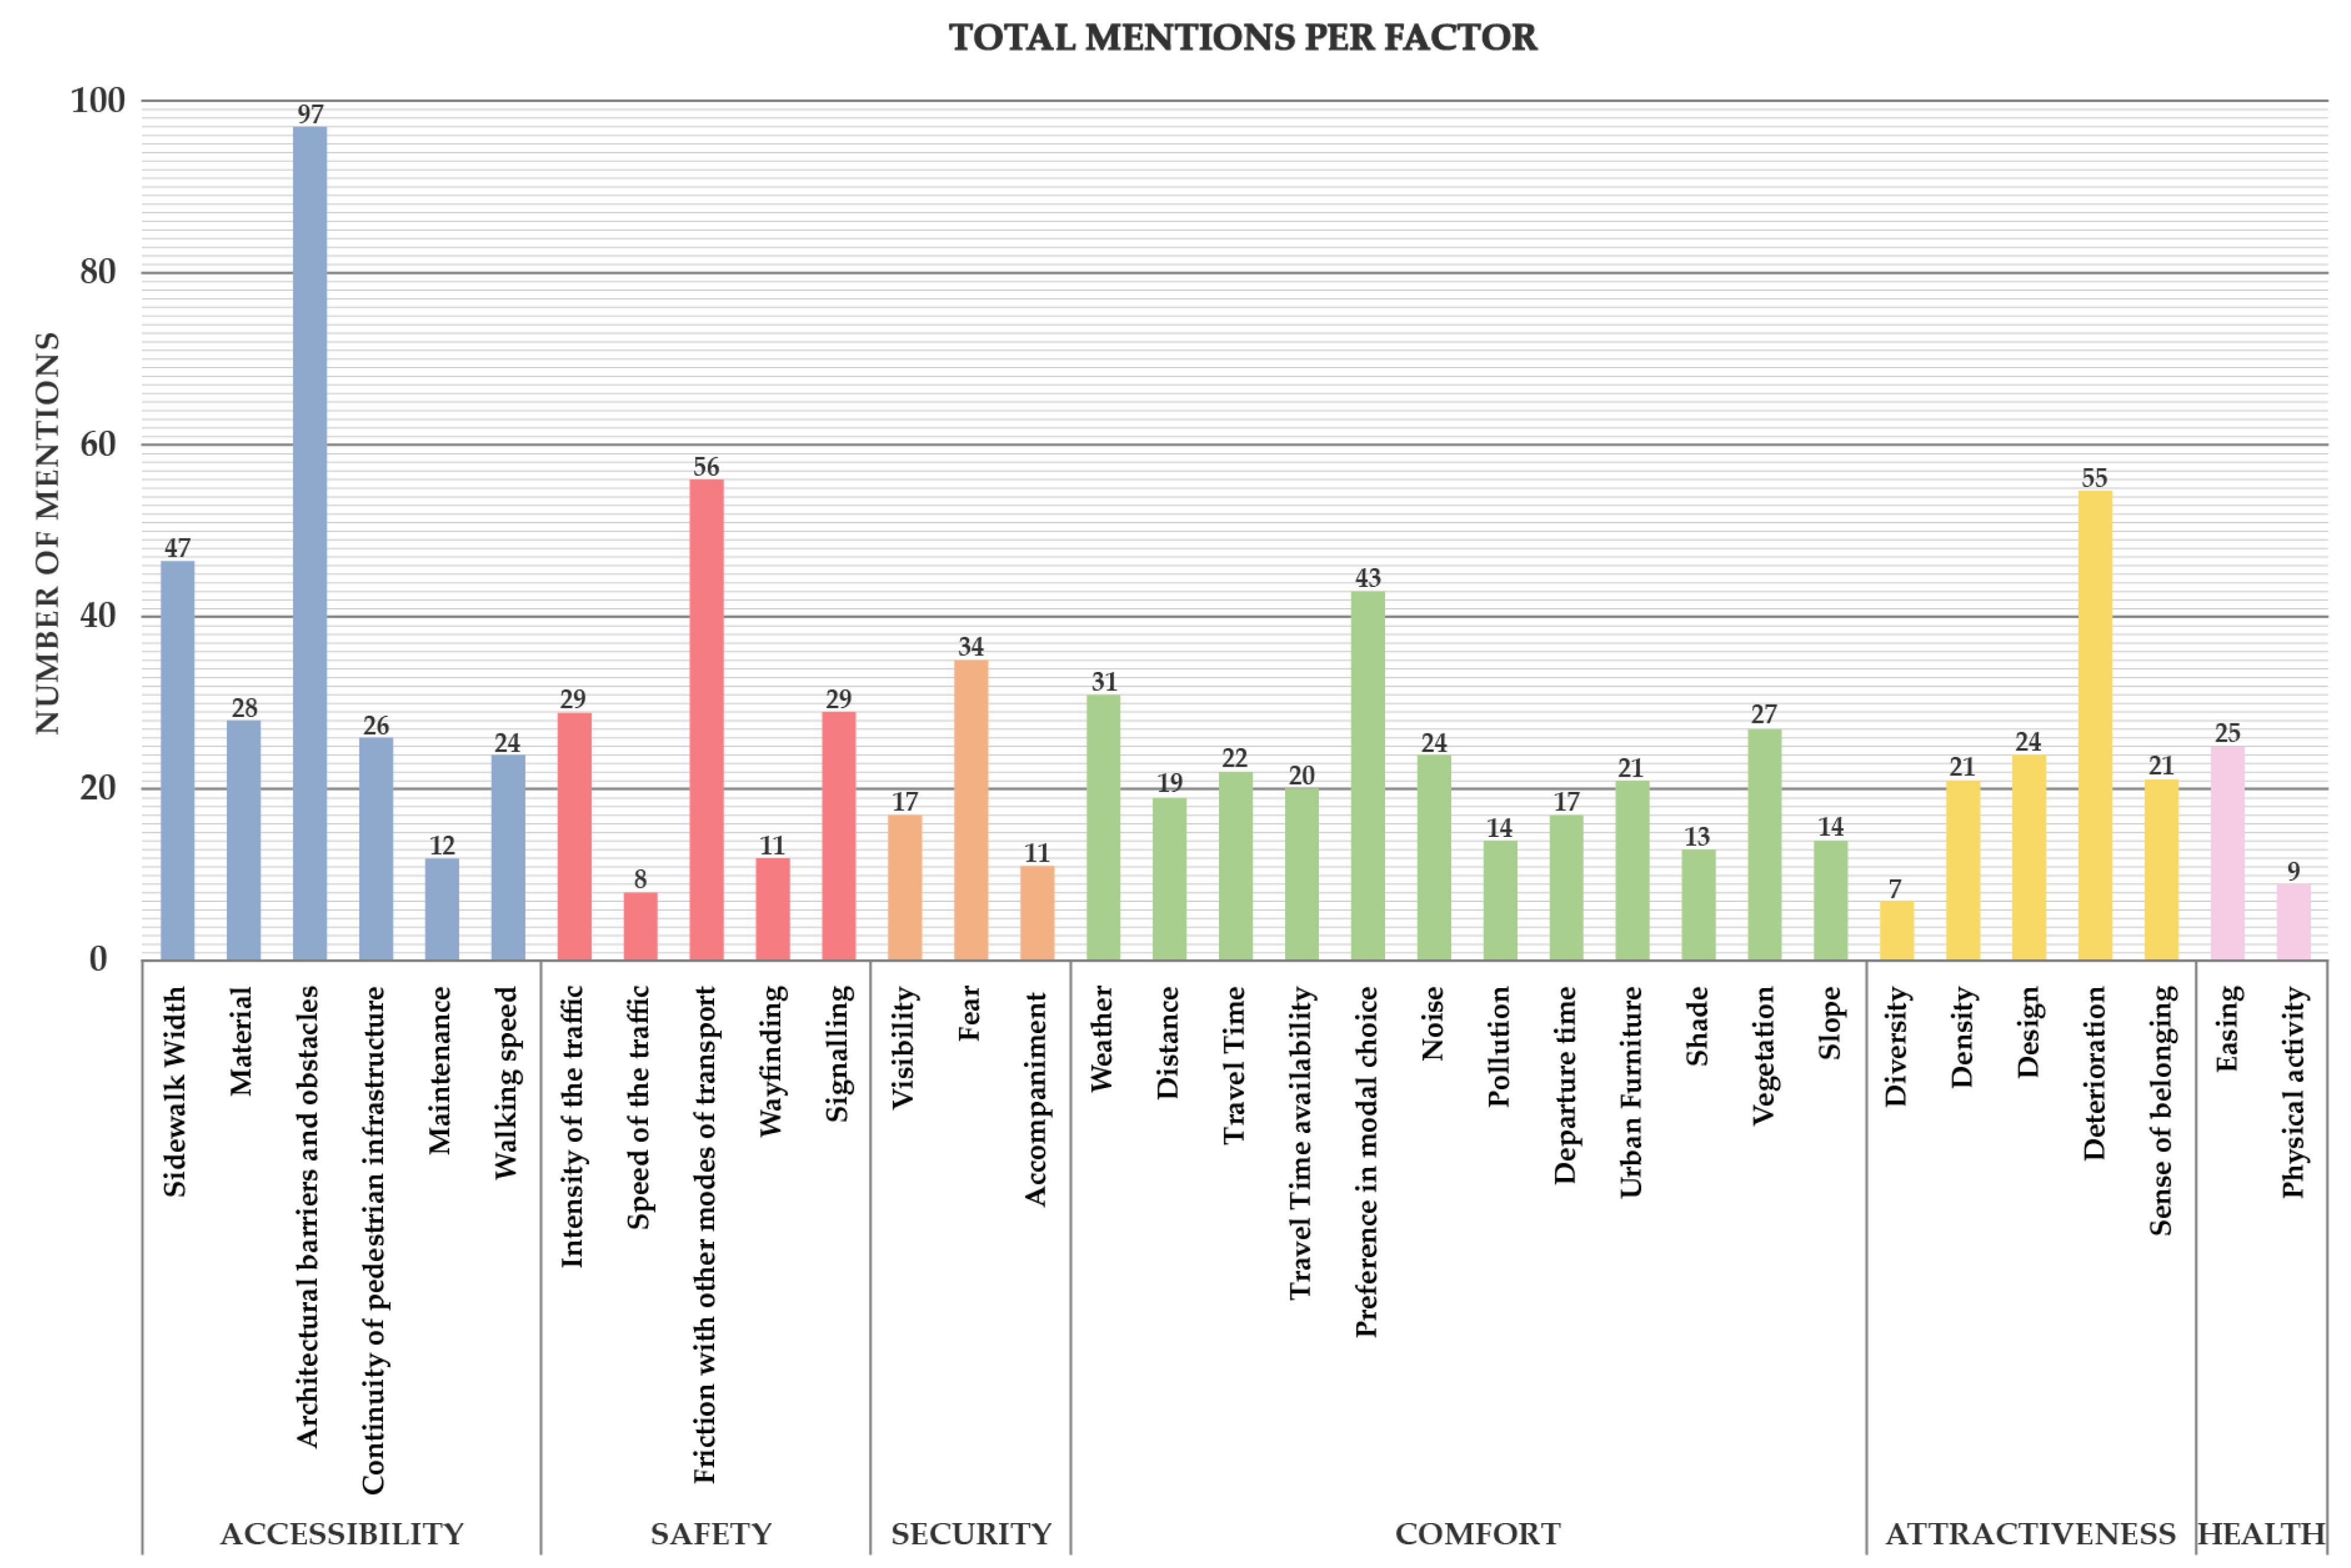
5.1. Factors Ranking

By elaborating on different classifications according to the age group, it was possible to rank the pedestrians’ priorities at different stages in life. The most remarkable finding in this line was that young adults (Figure 3) show more balanced results than middle-aged (Figure 4) and older adults (Figure 5), who present more variations amongst the different blocks.
Additionally, different age groups displayed differing priorities. While middle-aged and older adults mentioned Accessibility the most, Comfort and Attractiveness seemed slightly more relevant for younger adults. It is also worth to mention that Health factors were more relevant for younger people than for the older. Although seniors tend to present a more elevated number of health issues that could be lessened with a more adequate urban environment, the debate spotlighted that being healthy is one of the priorities of current generations.
The resulting numbers (Figure 6) position accessibility as the block with the highest number of mentions, including “architectural barriers” as the most mentioned factor.
After classifying all the different comments according to the selected factors, they were ranked by its relevance. As a result, Table 3 shows the list of factors extracted from a previous literature review ordered according to the number of comments they received in the FG sessions.
An importance factor % Imp (calculated by obtaining the percentage of mentions per factor out of all the comments) was also incorporated in this graphic to display a quantitative justification for the ranking.

5.2. Level of Encouragement and Discouragement

For each factor, it was analysed if people saw it as an element that commonly fosters or hinders their walkability according to their experience in the urban scene. This part of the study also considered the gender perspective, as the previous literature review suggested different practical conceptions on the same theoretical issues.
For each factor, a percentage of the number of positive (Table 4) and negative mentions (Table 5) by gender and age group was obtained, so as to see the different perceptions that each gender and age group have towards the public space and factors affecting their walkability behaviours. For this analysis, neutral comments were not considered as they provided no insights on promoting or hindering walkability.
As for the positive ones, average percentages place Shade as the most fostering element. However, individual data per gender and age reveals that the variations amongst the different groups are significant. As has been displayed in bold, there was no consensus in terms of age or gender. There only coincidence seems to be departure time when considering walking transportation for women of more than 65 and middle-aged men.
Regarding the negative ones, average percentages show that Maintenance is the factor that hinders walkability the most. Nevertheless, and unlike what happened with the positive comments, here young adults of both genders agree that lack of maintenance is the most threatening element in the urban environment. Other age groups, on the contrary, chose other factors that did not even make it to the top five of most hindering elements. This is the case of older women who found Physical activity and Travel Time Availability as the most determining conditions to stop them from travelling on foot.

6. Discussion

6.1. Accessibility

The block of Accessibility received 27% of the total number of observations, being the second most discussed block. Furthermore, out of all the factors, accessibility included three of the ten most mentioned factors: architectural barriers and obstacles (11.3% considered it the most important), pavement width (fourth place, 5.5% of all observations), and the material used for the infrastructure (ninth place, 3.3% of all observations) (Table 3). Nevertheless, the importance varied significantly depending on the type of pedestrian. Older adults focused on the architectural barriers, mainly stairs or poorly executed recesses, for a variety of reasons that restrict their free movements, such as mobility problems or the use of canes or shopping carts [51]. They also worried about pedestrian infrastructure maintenance, mainly loose or detached cobblestones, which might make them fall or stumble. They highlighted using bituminous materials and heavier cobblestones as a possible solution.
One woman from the older-adult FG commented on a personal situation regarding loose tiles:
“Next to the San Francisco bus stop […], there are four detached tiles that used to be of heavy stone and none could lift or move them […] Now, people run to catch the bus and then…bump! (referring to people falling).”.
(76-year-old female)
For the middle-aged FG, obstacles are the primary problem in their pedestrian routes (Figure 4, 41 mentions), pointing at the outdoor cafés as the main irritants to walkability fluency, and the seniors agreed on that point. Terraces reduce the pavement width, sometimes preventing pedestrians from participating in the economic activity of the neighbourhood and not allowing synergies among the local retailers. Tables and chairs, together with the associated noise were a lesser evil in the summertime, but now the new closed terraces are opened every season, thanks to the gas stoves and the permanent shade provided by the tent, becoming a permanent obstacle.
“Terraces mean business for the local government, but they are annoying for pedestrians since they consume a lot of space”.
(50-year-old male)
The main differences are found among young people, who do not place accessibility above the other aspects (Figure 3). Quality of the infrastructure, materials, and obstacles are considered neutral as pedestrians, since saving time seems to be their main motivation. Their main concerns of accessibility revolve around the material and the architectural barriers (14 mentions each), which they closely related to each other and to travel time [52].

6.2. Safety

Safety shows the struggle between pedestrians and others means of transport to achieve a fairer distribution of public space. This translate into the safety aspect being the most conditioning and hindering one concerning walkability. In fact, all five factors considered in the analysis are included in the first 12 positions of the discouraging factors ranking (Table 5).
This study showed that traffic intensity becomes the most hindering factor of the safety section for all types of pedestrians (44.4%), mostly among young women (70.0%). Although a majority of comments on this issue were made by women (on average, 62% of the total), many men pointed at the noise as the main conditioning factor in their route choice derived from the intensity of traffic. Surprisingly, a close relationship was found during the discussion between accidents, traffic intensity, and speed limits, matching what the literature affirmed [40,53]. On most occasions, participants highlighted an association between the number of cars and comfort factors regarding traffic, such as noise and pollution related to sensory safety, while ignoring physical safety.
Friction with other modes of transport is the second major factor that prevents pedestrians from feeling safe (Table 5, 44.2%). People over 35 years old focused on claiming the sidewalk space that has been lost to motorcycles and the so-called new individual mobility means of transport (i.e., bicycles, skates, scooters, etc.). They also complained about the user’s lack of awareness and the excessive supply of these devices compared to the low demand. The young adults group agreed on their willingness to take back the space the private car uses nowadays in order to widen the distance and provide protective barriers between pedestrians and cars.
“We do not realize that people with disabilities or carrying a shopping cart do not move as easily as other people: they (motorbikes parked on pavements) are an obstacle, no matter how much space there is on the sidewalk”
(44-year-old male)
The importance of signalling both for young and older people is very important when prioritizing walkability (Table 4, 14.7%). In both cases, a serious concern about traffic light times was observed, both waiting times and crossing the street. The latter much resulted critical for people over 65, mainly women. Older adults showed a deeper sense of discriminatory treatment towards cars and the driving speeds, which creates a barrier effect for pedestrians:
“I cross the street using this traffic light every day and I can walk at a normal speed, but the traffic light does not last AT ALL.”.
(74-year-old female)
Finally, regarding signalling compliance, young women tend to look for and respect it throughout their pedestrian routes, whereas men decide to respect it or not depending on their travel time availability or the complexity of the crossroad.

6.3. Security

The feeling of insecurity in the public space is more significant in pedestrian mobility, mainly among women at nighttime. In fact, an average of 50.0% (Table 5) of the women raised this issue with a very negative connotation. Fear arose primarily in over 65 (100%) and under 35 women (50.0%). Even if positive conditions are granted, such as proper visibility, improved lighting, or being accompanied in unfamiliar places, some of the participants were reluctant to undertake a night trip when other means of private or shared transport are available (e.g., Uber, Cabify, etc.). This showed that women face several security constraints to accessing public space, turning the streets into a hostile environment [45]. However, men also expressed the feeling of insecurity while walking at night, but they did not consider it a constraint. This finding highlights not only a matter of gender inequality but also emphasized an important difference in the physical integrity perception according to gender [54]:
“Indeed, gender matters. After a certain hour at night, I never walk and I use a door-to-door transport. I always do it”
(25-year-old female)
Older adults highlight the fear of attack or being mugged, especially at night, forcing them to change or limit their routes, even avoiding leaving their house after sunset as a precautionary measure.

6.4. Comfort

Comfort was cited as the most valued aspect by the FG participants, placing Shade (44.4%), Departure Time (35.7%) and Vegetation (30.2%) as the three most mentioned encouraging factors (Table 4). Thus, comfort can be considered the most important incentive to walk. Nevertheless, Comfort has little representation in the top 10 more commented factors (Table 3), being Preference in Modal Choice and Weather conditions the only ones within the first positions.
In fact, there was a long discussion on the preferred mode of transport (Table 3, 5.0%). Walking arose as the means mostly chosen by females in terms of gender, and young adults among the different age groups. While the middle-aged group considered the private vehicle an alternative (both car and motorcycle), participants from the young and senior groups did not mention it as a possible means due to economic and ability reasons.
The lack of time, normally worded as “rush” in the FG, was often the highlighted reason for not walking in urban environments. Compulsory commuting, along with the travelling time (Table 5, 23.6%) and distance (Table 5, 24.6%), placed walking as the second option for urban transportation. On the contrary, when there is sufficient time, walking becomes more relevant, turning distance and travel time into secondary conditionings mainly amongst the youngest adults:
“In the morning, on my way to work, I take the shortest route, and when I come back home, I prefer a wider street, which looks livelier and buildings look nicer”
(25-year-old female)
Weather conditions were the second most commented factor of comfortability on average (Table 3, 3.6%). Since the FG discussions occurred at the end of the spring and early summer of 2019, heat and lack of shadow became the most influential aspect in the urban environment, even affecting the modal choice:
“Weather conditions affect me the most: if the weather (referring to high temperatures or heavy rain) is bad, I use public transport; but if the weather is fine, I walk”.
(44-year-old female)
Some studies mentioned this issue [55,56], with rain as the main weather conditioning since these studies were conducted in humid climate areas. Thus, it can be concluded that the time and place of the FG also affect the factors’ importance.
In the definition of pedestrian routes, vegetation is also a major incentive (Table 4, 30.2%) [52]. Vegetation providing shadow highly influences the route choice, mostly among female walkers:
“In the summer, I change my daily route depending on the shade […] if there is no shadow, I walk around the block to avoid going down some streets”
(25-year-old female)

6.5. Attractiveness

Attractiveness is the last factor in the proposed chain for pedestrian quality analysis by literature. It accounted for a total of 15% of the comments–firstly Deterioration (Table 3, 6.4%), followed by Design (2.8%), Sense of Belonging (2.5%), and Density (2.5%).
Participants highlighted a deep discomfort at the lack of functionality in furniture and public space design. To sum up, functionality was given greater importance than beauty in a design. This view was expressed in comments as the one below:
“We place the value on having benches, fountains…, but their design does not match the needs, they are useless”
(44-year-old male)
Similarly, and closely related to design, pedestrians underlined the need to consider the lifespan and the investment to avoid degradation in the original design. Degradation was considered a demotivator and was linked to vandalism, dirt, and lack of public awareness [57].
Another relevant factor is the Sense of Belonging and familiarity with the urban environment and how these influence pedestrians’ routes. People are aware of the different attitudes towards familiar spaces in contrast with unknown areas. The concept of neighbourhood has been repeatedly discussed, mainly in the middle-aged FG, in terms of proximity and comfortability, as well as the sense of knowing how and where to go and being able to participate in public-life activities. At the same time, prejudices around certain areas, linked to criminality, affect their willingness to walk as a foreigner:
“If I am going to take a walk, I do it. If I go shopping, do errands, etc., I always do them in the neighbourhood while avoiding the main streets for their excessive noise. […] I do not like walking in the city centre of Madrid”
(44-year-old male)
Finally, the density of economic activities is also a notable factor [58], mainly in the middle-aged group. However, it is not always an incentive to define pedestrian routes. The excessive gathering of certain commercial activities leads to the opposite effect on some occasions, mainly among people aged 35–64 years. People also tend to avoid gentrified areas because of the uncontrolled proliferation of certain uses [59].

6.6. Health

Health was included in addition to the suggested categories suggested by the literature. Factors represented a total of 4% of the total comments in the FG discussions, showing their low importance amongst people of different ages. Notably, in all of the sessions, a brief introduction was needed without unnaturally leaving the discussion aside. All participants recognized the benefits of walking to reduce their daily stress. “Escape from reality” or “easing” is the main factor for health, with 73,5% (Figure 6, 25 out of 34 comments on health) and 2.9% of the total comments (Table 3).
It was observed that participants did not consider physical activity as a moderate sportive activity but as a question of mental health and helping them through the day concerns. Although walking is considered to have important physical benefits, most of the comments emanated from young females who supported modern technology and gadgets as positive reinforcement and additional motivation to walk.
“When I look at my mobile phone and it says that you have accomplished your daily objective, I am happy. It is a positive reinforcement”.
(25-year-old female)
On the contrary, senior women adults saw walking as a hindering aspect of pedestrian transportation in terms of physical activity (Table 5, 100%). Fitness level, body sorrow and slowness translated into fewer journeys on foot when longer ones were needed.

7. Limitations and Future Recommendations

The research faced some limitations that were managed successfully:
  • Reduced sample groups: the fact that each FG presented a reduced number of attendants eased the discussion process. Although the sample was not too big, different target groups were present, and they had plenty of time to express their comments and thoughts on the questions. Had it been other way, people would only have shared limited insights, which would have drawn biased conclusions only based on the predominant speakers.
  • While allowing free debate in FGs, it is common to miss some gestures or non-verbal comments to express their perception of the suggested topic. Thus, the reporter played a crucial role in this regard and actively transcribed these messages and ideas to be included in the word-to-word transcription.

8. Conclusions

Each transport mode has different effects on human health, in both positive and negative ways [60]. For example, air and noise pollution from motorized traffic may lead to health problems, such as stroke, diabetes, and lung cancer [61,62,63], while active modes positively affect mental and physical wellbeing [8]. Thus, strategies towards promoting walkability turn critical in order to address current problems and contribute to a healthier urban environment.
This paper shows the results of several Focus Groups held in Madrid (Spain) to define and assess the key factors conditioning pedestrians in the urban environment in the framework of the DESPACIO project. The methodology has proven that selected context-based indicators to be effective, as well as its hierarchization based on the percentage of comments made by the participants, whose results are shown in Table 3. It was also discussed along with an encouraging-factor ranking (Table 4) and a discouragement factors ranking (Table 5), the latter two including the gender perspective.
Each FG focused on completely different issues without approaching a real comparison among measures. The results showed that health has become a new incentive to encourage citizens to walk in urban environments as shown in the literature review [47,51]. Nevertheless, pedestrians considered emotional and mental health benefits above physical health, not paying much attention to walking as physical activity of moderate intensity. Thus, it is evident that “walking for transport” or “destination walking” should involve mental escape and the enjoyment of the activity itself beyond the pure “strolling walking”, establishing the need to develop a mixed approach.
At the same time, FG has proven to be a fundamental tool in order to examine trends and social changes. Therefore, it can consolidate as a tool to re-evaluate and re-adapt the methodology for potential new realities in pedestrian mobility, such as the inclusion of new technologies as pedestrian mobility allies as shown in this paper. Further steps need to be taken in this concern as the FGs were carried out months before the COVID-19 pandemic, so possible changes and new trends could be assessed in forthcoming research.
Current new-technology trends also played a role in evaluating the factors promoting walkability. Apps and access to new information on both the mental and physical benefits of moderate exercise are driving new generations in terms of walkability.
Finally, it is suggested to introduce the age and gender perspective in the analysis of pedestrian mobility and urban planning in future research projects focusing on pedestrian behaviour analysis. The comparison between genders offered valuable insight into the different factors affecting each of them, regardless of their journey purposes. Conditionings varied amongst ages and genders and are also meant to be consequently introduced in planning proposals to create more accessible, safe, attractive, comfortable and healthy urban environments.

Author Contributions

Conceptualization, M.E.L.-L. and A.A.; Data curation, A.R.-S. and A.P.; Formal analysis, A.A. and A.P.; Funding acquisition, M.E.L.-L.; Investigation, A.A.; Methodology, A.A.; Project administration, M.E.L.-L.; Supervision, M.E.L.-L. and A.A.; Writing—original draft, A.P.; Writing—review & editing, A.R.-S. All authors have read and agreed to the published version of the manuscript.

Funding

This research was funded by the Spanish Ministry of Economy, Industry and Competitiveness (TRA2017-88058-R).

Institutional Review Board Statement

Not applicable.

Acknowledgments

This paper was produced under the framework of the following project: “DESPACIO” (TRA2017-88058-R) funded by the Spanish Ministry of Economy, Industry and Competitiveness in the “Programa Estatal de I + D + i Orientada a los Retos de la Sociedad”.

Conflicts of Interest

The authors declare no conflict of interest.

References

  1. Valenzuela-Montes, L.M.; Talavera-García, R. Entornos de movilidad peatonal: Una revisión de enfoques, factores y condicionantes. Eure 2015, 41, 5–27. [Google Scholar] [CrossRef] [Green Version]
  2. Jacobs, A.B. Great Streets. Access Mag. 1993, 1, 23–27. [Google Scholar]
  3. Brown, J.R.; Morris, E.A.; Taylor, B.D. Planning for Cars in Cities: Planners, Engineers, and Freeways in the 20th Century. J. Am. Plan. Assoc. 2009, 75, 161–177. [Google Scholar] [CrossRef]
  4. Newman, P.; Kenworthy, J. Sustainability and Cities: Overcoming Automobile Dependence; Island Press: Washington, DC, USA, 1999. [Google Scholar]
  5. Khomenko, S.; Cirach, M.; Pereira-Barboza, E.; Mueller, N.; Barrera-Gómez, J.; Rojas-Rueda, D.; de Hoogh, K.; Hoek, G.; Nieuwenhuijsen, M. Premature mortality due to air pollution in European cities: A health impact assessment. Lancet Planet. Health 2021, 5, e121–e134. [Google Scholar] [CrossRef] [PubMed]
  6. European Environment Agency. Air Quality in Europe—2019 Report. October 2019. Available online: https://www.eea.europa.eu/publications/air-quality-in-europe-2019 (accessed on 2 November 2022).
  7. Cambra, P. Pedestrian Accessibility and Attractiveness Indicators for Walkability Assessment; Dissertação para a Obtenção do Grau de Mestre em Urbanismo e Ordenamento do Território, Técnico Lisboa, Universidade de Lisboa: Lisboa, Portugal, 2012; Available online: https://fenix.tecnico.ulisboa.pt/downloadFile/395144992898/Dissertacao.pdf (accessed on 2 November 2022).
  8. González-Gross, M.; Meléndez, A. Sedentarism, active lifestyle and sport: Impact on health and obesity prevention. Nutr. Hosp. 2013, 28 (Suppl. S5), 89–98. [Google Scholar] [CrossRef] [PubMed]
  9. Hallal, P.C.; Andersen, L.B.; Bull, F.C.; Guthold, R.; Haskell, W.; Ekelund, U.; Alkandari, J.R.; Bauman, A.E.; Blair, S.N.; Brownson, R.C.; et al. Global physical activity levels: Surveillance progress, pitfalls, and prospects. Lancet 2012, 380, 247–257. [Google Scholar] [CrossRef]
  10. Bornioli, A.; Parkhurst, G.; Morgan, P.L. Psychological Wellbeing Benefits of Simulated Exposure to Five Urban Settings: An Experimental Study From the Pedestrian’s Perspective. J. Transp. Health 2018, 9, 105–116. [Google Scholar] [CrossRef]
  11. Helbich, M. Children’s school commuting in the Netherlands: Does it matter how urban form is incorporated in mode choice models? Int. J. Sustain. Transp. 2017, 11, 507–517. [Google Scholar] [CrossRef] [Green Version]
  12. Lin, L. Leisure-time physical activity, objective urban neighborhood built environment, and overweight and obesity of Chinese school-age children. J. Transp. Health 2018, 10, 322–333. [Google Scholar] [CrossRef]
  13. Moreno, C.; Allam, Z.; Chabaud, D.; Gall, C.; Pratlong, F. Introducing the “15-Minute City”: Sustainability, Resilience and Place Identity in Future Post-Pandemic Cities. Smart Cities 2021, 4, 93–111. [Google Scholar] [CrossRef]
  14. Da Silva, D.C.; King, D.A.; Lemar, S. Accessibility in Practice: 20-Minute City as a Sustainability Planning Goal. Sustainability 2020, 12, 129. [Google Scholar] [CrossRef]
  15. Weng, M.; Ding, N.; Li, J.; Jin, X.F.; Xiao, H.; He, Z.M.; Su, S.L. The 15-min walkable neighborhoods: Measurement, social inequalities and implications for building healthy communities in urban China. J. Transp. Health 2019, 13, 259–273. [Google Scholar] [CrossRef]
  16. Dogrusoy, I.T.; Dalgakiran, A. An alternative approach in sustainable planning: Slow urbanism. Archnet-IJAR 2011, 5, 127. [Google Scholar] [CrossRef]
  17. Mezoued, A.M.; Letesson, Q.; Kaufmann, V. Making the slow metropolis by designing walkability: A methodology for the evaluation of public space design and prioritizing pedestrian mobility. Urban Res. Pr. 2021, 15, 584–603. [Google Scholar] [CrossRef]
  18. Adkins, A.; Dill, J.; Luhr, G.; Neal, M. Unpacking Walkability: Testing the Influence of Urban Design Features on Perceptions of Walking Environment Attractiveness. J. Urban Des. 2012, 17, 499–510. [Google Scholar] [CrossRef]
  19. Gori, S.; Nigro, M.; Petrelli, M. Walkability Indicators for Pedestrian-Friendly Design. Transp. Res. Rec. J. Transp. Res. Board 2014, 2464, 38–45. [Google Scholar] [CrossRef]
  20. Talavera-Garcia, R.; Soria-Lara, J.A. Q-PLOS, developing an alternative walking index. A method based on urban design quality. Cities 2015, 45, 7–17. [Google Scholar] [CrossRef]
  21. Alfonzo, M.A. To Walk or Not to Walk? The Hierarchy of Walking Needs. Environ. Behav. 2005, 37, 808–836. [Google Scholar] [CrossRef]
  22. Pozueta, J.; Daudén, F.J.L. Porto Schettino, and Centro de Estudios y Experimentación de Obras Públicas. In La Ciudad Paseable: Recomendaciones para la Consideración de los Peatones en el Planeamiento, el Diseño Urbano y la Arquitectura; Centro de Estudios y Experimentación de Obras Públicas: Madrid, Spain, 2009. [Google Scholar]
  23. Ortega, E.; Martín, B.; De Isidro, Á.; Cuevas-Wizner, R. Street walking quality of the ‘Centro’ district, Madrid. J. Maps 2020, 16, 184–194. [Google Scholar] [CrossRef]
  24. Mikiki, F.; Oikonomou, A.; Katartzi, E. Sustainable Mobility Issues of Physically Active University Students: The Case of Serres, Greece. Futur. Transp. 2021, 1, 777–793. [Google Scholar] [CrossRef]
  25. Baran, P.K.; Rodríguez, D.A.; Khattak, A.J. Space Syntax and Walking in a New Urbanist and Suburban Neighbourhoods. J. Urban Des. 2008, 13, 5–28. [Google Scholar] [CrossRef]
  26. Jackson, R.J.; Kochtitzky, C.S. Creating a Healthy Environment: The Impact of the Built Environment on Public Health. 2001. Available online: http://www.sprawlwatch.org/health.pdf (accessed on 7 November 2022).
  27. Greenwald, M.J.; Boarnet, M.G. Built Environment as Determinant of Walking Behavior: Analyzing Nonwork Pedestrian Travel in Portland, Oregon. Transp. Res. Rec. J. Transp. Res. Board 2001, 1780, 33–41. [Google Scholar] [CrossRef] [Green Version]
  28. Britain, D. Inclusive Mobility: A Guide to Best Practice on Access to Pedestrian and Transport Infrastructure; Social Research in Transport (SORT) Clearinghouse: London, UK, 2002. [Google Scholar]
  29. Gallez, C.; Motte-Baumvol, B. Inclusive Mobility or Inclusive Accessibility? A European Perspective. Cuad. Eur. Deusto 2017, 56, 79–104. [Google Scholar] [CrossRef] [Green Version]
  30. Bertolini, L.; le Clercq, F.; Kapoen, L. Sustainable accessibility: A conceptual framework to integrate transport and land use plan-making. Two test-applications in the Netherlands and a reflection on the way forward. Transp. Policy 2005, 12, 207–220. [Google Scholar] [CrossRef]
  31. Rossetti, S.; Tiboni, M.; Vetturi, D.; Zazzi, M.; Caselli, B. Measuring Pedestrian Accessibility to Public Transport in Urban Areas: A GIS-based Discretisation Approach. Eur. Transp. Trasp. Eur. 2020, 76. Available online: http://www.istiee.unict.it/sites/default/files/files/1_2_ET_14.pdf (accessed on 9 January 2023).
  32. Sanz Alduán, A. Calmar el Tráfico: Pasos para una Nueva Cultura de la Movilidad Urbana; Ministerio de Fomento: Madrid, Spain, 2013; Available online: https://cpage.mpr.gob.es/producto/calmar-el-trafico-2/ (accessed on 2 November 2022).
  33. Kim, S.; Park, S.; Lee, J.S. Meso- or micro-scale? Environmental factors influencing pedestrian satisfaction. Transp. Res. Part D Transp. Environ. 2014, 30, 10–20. [Google Scholar] [CrossRef]
  34. Pikora, T.J.; Giles-Corti, B.; Knuiman, M.W.; Bull, F.C.; Jamrozik, K.; Donovan, R.J. Neighborhood Environmental Factors Correlated with Walking Near Home. Med. Sci. Sports Exerc. 2006, 38, 708–714. [Google Scholar] [CrossRef]
  35. Perkins, D.D.; Meeks, J.W.; Taylor, R.B. The physical environment of street blocks and resident perceptions of crime and disorder: Implications for theory and measurement. J. Environ. Psychol. 1992, 12, 21–34. [Google Scholar] [CrossRef]
  36. de Zárate, M.R.; Estivill, J.; Eizagirre, N. La configuración y las consecuencias del miedo en el espacio público desde la perspectiva de género. REIS Rev. Española Investig. Sociológicas 2019, 89–106. [Google Scholar] [CrossRef]
  37. Escalante, S.O. El lado nocturno de la vida cotidiana: Un análisis feminista de la planificación urbana nocturna. Ágora 2017, 4, 55–78. [Google Scholar] [CrossRef]
  38. Sarkar, S. Qualitative Evaluation of Comfort Needs in Urban Walkways in Major Activity Centers. Transp. Q. 2003, 57, 39–59. Available online: https://trid.trb.org/view/682669 (accessed on 2 November 2022).
  39. Clark, A.; Scott, D.M.; Yiannakoulias, N. Examining the relationship between active travel, weather, and the built environment: A multilevel approach using a GPS-enhanced dataset. Transportation 2014, 41, 325–338. [Google Scholar] [CrossRef] [Green Version]
  40. Kelly, C.; Tight, M.; Hodgson, F.; Page, M. A comparison of three methods for assessing the walkability of the pedestrian environment. J. Transp. Geogr. 2011, 19, 1500–1508. [Google Scholar] [CrossRef]
  41. Cervero, R.; Kockelman, K. Travel demand and the 3Ds: Density, diversity, and design. Transp. Res. Part D Transp. Environ. 1997, 2, 199–219. [Google Scholar] [CrossRef]
  42. Ewing, R.; Handy, S. Measuring the Unmeasurable: Urban Design Qualities Related to Walkability. J. Urban Des. 2009, 14, 65–84. [Google Scholar] [CrossRef]
  43. Badland, H.; Schofield, G. Transport, urban design, and physical activity: An evidence-based update. Transp. Res. Part D Transp. Environ. 2005, 10, 177–196. [Google Scholar] [CrossRef]
  44. Domènech-Abella, J.; Mundó, J.; Leonardi, M.; Chatterji, S.; Tobiasz-Adamczyk, B.; Koskinen, S.; Ayuso-Mateos, J.L.; Haro, J.M.; Olaya, B. Loneliness and depression among older European adults: The role of perceived neighborhood built environment. Health Place 2020, 62, 102280. [Google Scholar] [CrossRef]
  45. Buttazzoni, A.; Dean, J.; Minaker, L. Urban design and adolescent mental health: A qualitative examination of adolescent emotional responses to pedestrian- and transit-oriented design and cognitive architecture concepts. Health Place 2022, 76, 102825. [Google Scholar] [CrossRef]
  46. Granados, S.H.B.; Cuéllar, Á.M.U. Influencia del deporte y la actividad física en el estado de salud físico y mental: Una revisión bibliográfica. In Katharsis; Revista de Ciencias Sociales: Envigado, Colombia, 2018; Volume 25, pp. 141–160. [Google Scholar]
  47. Pineo, H. Towards healthy urbanism: Inclusive, equitable and sustainable (THRIVES)—An urban design and planning framework from theory to praxis. Cities Health 2020, 6, 974–992. [Google Scholar] [CrossRef]
  48. Katzman, E.R.; Kinsella, E.A.; Polzer, J. ‘Everything is down to the minute’: Clock time, crip time and the relational work of self-managing attendant services. Disabil. Soc. 2020, 35, 517–541. [Google Scholar] [CrossRef]
  49. Krueger, R.A.; Casey, M.A. Focus Groups: A Practical Guide for Applied Research, 5th ed.; SAGE Publications, Inc.: Thousand Oaks, CA, USA, 2014. [Google Scholar]
  50. Kitzinger, J. The methodology of Focus Groups: The importance of interaction between research participants. Sociol. Health Illn. 1994, 16, 103–121. [Google Scholar] [CrossRef]
  51. Higueras, E.; Román, E.; Fariña, J. Guidelines for Healthier Public Spaces for the Elderly Population: Recommendations in the Spanish Context. In Handbook of Quality of Life and Sustainability; Martinez, J., Mikkelsen, C.A., Phillips, R., Eds.; Springer International Publishing: Cham, Switzerland, 2021; pp. 35–51. [Google Scholar] [CrossRef]
  52. Middleton, J. ‘Stepping in Time’: Walking, Time, and Space in the City. Environ. Plan. A Econ. Space 2009, 41, 1943–1961. [Google Scholar] [CrossRef]
  53. De Pauw, E.; Daniels, S.; Thierie, M.; Brijs, T. Safety effects of reducing the speed limit from 90 km/h to 70 km/h. Accid. Anal. Prev. 2013, 62, 426–431. [Google Scholar] [CrossRef] [Green Version]
  54. Ferrer, S.; Ruiz, T.; Mars, L. A qualitative study on the role of the built environment for short walking trips. Transp. Res. Part F Traffic Psychol. Behav. 2015, 33, 141–160. [Google Scholar] [CrossRef]
  55. Nathan, A.; Wood, L.; Giles-Corti, B. Environmental Factors Associated With Active Living in Retirement Village Residents: Findings From an Exploratory Qualitative Enquiry. Res. Aging 2013, 35, 459–480. [Google Scholar] [CrossRef] [Green Version]
  56. Cao, Z.; Zhu, C.; Zhou, Y.; Wang, Y.; Chen, M.; Ju, Y.; Zhao, X. Risk factors related balance disorder for patients with dizziness/vertigo. BMC Neurol. 2021, 21, 186. [Google Scholar] [CrossRef] [PubMed]
  57. Craig, C.L.; Brownson, R.C.; Cragg, E.S.; Dunn, A.L. Exploring the effect of the environment on physical activity: A study examining walking to work. Am. J. Prev. Med. 2002, 23, 36–43. [Google Scholar] [CrossRef] [PubMed]
  58. Handy, S.L.; Clifton, K.J. Local shopping as a strategy for reducing automobile travel. Transportation 2001, 28, 317–346. [Google Scholar] [CrossRef]
  59. Lamíquiz Daudén, F.J. Implicaciones de la Accesibilidad Configuracional en la Movilidad Peatonal. El caso de Madrid = The Implications of Configurational Accessibility in Pedestrian Mobility. The Case of Madrid. Ph.D. Thesis, Escuela Técnica Superior de rquitectura de la Universidad Politécnica de Madrid, Madrid, Spain, 2011. Available online: https://oa.upm.es/15031/ (accessed on 2 November 2022).
  60. Mueller, N.; Rojas-Rueda, D.; Basagaña, X.; Cirach, M.; Cole-Hunter, T.; Dadvand, P.; Donaire-Gonzalez, D.; Foraster, M.; Gascon, M.; Martínez, D.; et al. Urban and Transport Planning Related Exposures and Mortality: A Health Impact Assessment for Cities. Environ. Health Perspect. 2017, 125, 89–96. [Google Scholar] [CrossRef]
  61. Yin, P.; Brauer, M.; Cohen, A.J.; Wang, H.; Li, J.; Burnett, R.T.; Stanaway, J.D.; Causey, K.; Larson, S.; Godwin, W.; et al. The effect of air pollution on deaths, disease burden, and life expectancy across China and its provinces, 1990–2017: An analysis for the Global Burden of Disease Study 2017. Lancet Planet. Health 2020, 4, e386–e398. [Google Scholar] [CrossRef] [PubMed]
  62. Haines, A.; Dora, C. How the low carbon economy can improve health. BMJ 2012, 344, e1018. [Google Scholar] [CrossRef] [PubMed] [Green Version]
  63. Gössling, S. Why cities need to take road space from cars—And how this could be done. J. Urban Des. 2020, 25, 443–448. [Google Scholar] [CrossRef]
Figure 1. Diagram of pedestrian mobility’s conditioning blocks and aspects.
Futuretransp 03 00008 g001
Figure 2. Methodology step by step.
Futuretransp 03 00008 g002
Figure 3. Number of mentions of comments for each factor in all in the young adults’ FG.
Futuretransp 03 00008 g003
Figure 4. Number of mentions of comments for each factor in all in the middle-aged adults’ FG.
Futuretransp 03 00008 g004
Figure 5. Number of mentions of comments for each factor in the older adults’ FG.
Futuretransp 03 00008 g005
Figure 6. Number of mentions of comments for each factor in all the FG.
Futuretransp 03 00008 g006
Table 1. Factors extracted from the literature review and to be used in the after-FG analysis.
ACCESSIBILITYPavement WidthTotal width for pedestrian infrastructure
MaterialThe material used on the pavement, as well as comments on the materials: paving, tile, or conglomerate
Architectural barriers and obstaclesElement, fixed or semi-fixed, permanent or semi-permanent, which reduces the effective pavement width
Continuity of the pedestrian infrastructureProblems to continue the pedestrian route due to the absence of infrastructure or the inadequate resolution of intersections
MaintenancePreserve the quality of the infrastructure compared to the original
Walking SpeedPedestrian speed during the journey, being limited or reduced by infrastructure and/or the presence of crowds
SAFETYTraffic intensityNumber of vehicles running on a certain section of a street
Traffic speedSpeed of vehicles running on a certain section of street
Friction with other Modes of TransportConflicts between pedestrians and other modes of transport (collective or individual), due to the invasion of the pavement
WayfindingIntuitive understanding of the urban environment
SignallingAny indication, both vertical and horizontal, related to road safety in public spaces
SECURITYVisibilityEase of pedestrians to see and be seen in a certain public space
FearIndividual perception of the likelihood of accidents, both because of the infrastructure (falling) and by other individuals (physical assault)
AccompanimentThe social act or the creation of social relationships while walking
COMFORTWeatherSet of atmospheric conditions
DistanceThe total length of the pedestrian journey
Travel TimeThe time needed to complete the pedestrian journey
Travel Time AvailabilityHaving enough time or not requiring being at a certain time and place
Preference in Modal ChoiceIndividual preference to walk versus other modes of transportation
NoiseAtmospheric quality loss related to increased decibels
ContaminationAtmospheric quality loss related to increased particulates and toxic substances in the air
Departure TimeVariations in the itinerary caused by the start time of the journey
Urban FurnitureSet of objects and pieces of equipment installed in the public space (benches, fountains, etc.)
ShadePublic space without the incidence of the sun’s rays due to the presence of vegetation, buildings, or other elements
VegetationSet of plants distributed in the urban space
SlopeThe inclination of infrastructure or public space by topography
ATTRACTIVENESSDiversityVariety of land uses and commercial activities
DensityThe concentration of commercial activities
DesignImage and representativeness of space
DeteriorationVariation of original design due to vandalism or dirtiness
Sense of BelongingThe FG participant considers that it is part of the space, enjoying spaces and activities in the environment
HEALTHEasingSpend time walking to improve individuals’ mental wellbeing
Physical ActivityThe performance of physical exercise motivates the FG participant to walk in urban spaces
Table 2. Recommendations on FG methodology extracted from literature and adaptations made to the current study.
Kitzinger [50] and Krueger & Casey [49] RecommendationsAdaptations to the Present Case Study
It is advisable to create groups of 6 to 10 people that can represent different target groups.Groups between 6 and 7 people were created.
The figures of the moderator and reporter are advised to guide and live-transcribe the sessions accordingly.In each group, two moderators and one reporter guided the session to maintain a neutral position as far as possible.
The first step would be to raise the topic question and lead the participants to discuss freely the issues they consider more important. Moderators may arise some points that are not being considered or intervene if the discussion is going in a different direction than the set one.The moderators only intervene to raise unexplored topics, and also presented examples to facilitate the debate.
Sessions need to be recorded to transcribe word by word the conclusions of the FG. Full transcriptions were provided thanks to an audio recording. Once transcribed, live transcriptions of gestures and non-verbal communication were added.
The total length of the session ought to be 1 h and be dynamic.Every session was 1 h long and was guided by the moderators, to keep the conversation active throughout the session.
Table 3. Factors prioritization according to the percentage of comments, and data per age group. AC = Accessibility, SA = Safety, SE = Security, CO = Comfort, AT = Attractiveness, HE = Health.
AspFactor% ImpNo. Mentions% Imp per Age Group
18–3435–64≥65
ACArchitectural barriers and obstacles11.3%974.7%14.5%15.3%
SAFriction with other Modes of Transport6.5%563.3%9.6%6.9%
ATDeterioration6.4%556.0%6.0%7.3%
ACPavement width5.5%473.3%7.8%5.5%
COPreference in Modal Choice5.0%436.3%6.4%2.2%
SEFear4.1%355.3%1.1%5.8%
COWeather3.6%312.7%4.3%4.0%
SATraffic intensity3.4%293.3%3.2%3.6%
SASignaling3.4%295.0%0.7%4.4%
ACMaterial3.3%284.7%2.1%2.9%
COVegetation3.2%271.0%3.9%4.7%
ACContinuity of pedestrian infrastructure3.0%264.3%0.4%4.4%
HEEasing2.9%254.7%3.9%0.0%
ACWalking Speed2.8%244.0%4.3%0.0%
CONoise2.8%242.0%2.5%4.0%
ATDesign2.8%243.3%0.0%5.1%
COTravel Time2.6%224.0%2.1%1.5%
COUrban Furniture2.5%212.7%2.5%2.2%
ATSense of Belonging2.5%211.0%5.3%1.1%
ATDensity2.5%211.3%3.2%2.9%
COTravel Time Availability2.3%204.3%2.1%0.4%
CODistance2.2%193.3%2.8%0.4%
SEVisibility2.0%174.3%0.7%0.7%
CODeparture Time1.9%174.7%0.4%0.7%
COContamination1.6%140.3%2.1%2.5%
COSlope1.6%142.0%0.4%2.5%
COShade1.5%130.7%1.1%2.9%
ACMaintenance1.4%120.3%2.1%1.8%
SAWayfinding1.4%122.0%0.0%2.2%
SEAccompaniment1.3%113.3%0.0%0.4%
HEPhysical Activity1.1%90.7%1.8%0.7%
SATraffic speed0.9%81.0%1.1%0.7%
ATDiversity0.8%70.3%1.8%0.4%
Table 4. Positive comments per factor and encouragement ranking. AC = Accessibility, SA = Safety, SE = Security, CO = Comfort, AT = Attractiveness, HE = Health.
AspFactor% Average% Positive Comments from Women% Positive Comments from Men
18–3435–64≥6518–3435–64≥65
COShade44.4%50.0%33.3%75.0%50.0%33.3%25.0%
CODeparture Time35.7%14.3%0.0%100.0%0.0%100.0%0.0%
COVegetation30.2%66.7%27.3%53.8%0.0%18.2%15.4%
HEPhysical Activity30.0%100.0%40.0%0.0%0.0%40.0%0.0%
HEEasing29.8%50.0%63.6%0.0%28.6%36.4%0.0%
SEAccompaniment28.3%60.0%0.0%100.0%10.0%0.0%0.0%
COPreference in Modal Choice26.4%15.8%50.0%16.7%36.8%22.2%16.7%
ACSidewalk Width25.2%20.0%27.3%33.3%30.0%27.3%13.3%
ATDiversity23.3%100.0%40.0%0.0%0.0%0.0%0.0%
ATDeterioration22.7%44.4%11.8%20.0%22.2%17.6%20.0%
SEVisibility21.2%23.1%0.0%0.0%53.8%0.0%50.0%
COUrban Furniture21.0%25.0%14.3%33.3%25.0%28.6%0.0%
ATDensity18.9%0.0%13.3%0.0%100.0%0.0%0.0%
CODistance18.8%0.0%12.5%0.0%0.0%0.0%100.0%
ACMaterial18.0%14.3%33.3%12.5%14.3%33.3%0.0%
COContamination16.7%0.0%0.0%71.4%0.0%0.0%28.6%
ATSense of Belonging16.4%75.0%0.0%12.5%0.0%11.1%0.0%
CONoise14.9%0.0%0.0%54.5%16.7%0.0%18.2%
SASignalling14.7%26.7%0.0%41.7%20.0%0.0%0.0%
ACContinuity of the pedestrian infrastructure13.2%38.5%0.0%33.3%7.7%0.0%0.0%
COWeather12.0%0.0%8.3%45.5%0.0%0.0%18.2%
ACArchitectural barriers and obstacles6.0%0.0%9.8%9.5%0.0%9.8%7.1%
SAFriction with other Modes of Transport5.7%0.0%0.0%10.5%0.0%18.5%5.3%
SAWayfinding5.6%33.3%0.0%0.0%0.0%0.0%0.0%
COTravel Time5.6%0.0%33.3%0.0%0.0%0.0%0.0%
COTravel Time Availability3.8%0.0%0.0%0.0%23.1%0.0%0.0%
SATraffic intensity3.5%0.0%0.0%0.0%10.0%11.1%0.0%
ATDesign1.2%0.0%0.0%7.1%0.0%0.0%0.0%
SEFear1.0%0.0%0.0%0.0%0.0%0.0%6.3%
ACMaintenance0.0%0.0%0.0%0.0%0.0%0.0%0.0%
ACWalking Speed0.0%0.0%0.0%0.0%0.0%0.0%0.0%
SATraffic speed0.0%0.0%0.0%0.0%0.0%0.0%0.0%
COSlope0.0%0.0%0.0%0.0%0.0%0.0%0.0%
Table 5. Negative comments per factor and discouragement ranking. AC = Accessibility, SA = Safety, SE = Security, CO = Comfort, AT = Attractiveness, HE = Health.
AspFactor% Average% Negative Comments from Women% Negative Comments from Men
18–3435–64≥6518–3435–64≥65
ACMaintenance66.7%100.0%33.3%60.0%100.0%66.7%40.0%
SEFear46.9%56.3%33.3%68.8%43.8%66.7%12.5%
SATraffic intensity44.4%70.0%55.6%60.0%30.0%11.1%40.0%
SAFriction with other Modes of Transport44.2%60.0%33.3%52.6%50.0%48.1%21.1%
SATraffic speed38.9%33.3%33.3%50.0%33.3%33.3%50.0%
SAWayfinding36.1%50.0%0.0%50.0%50.0%0.0%66.7%
ACArchitectural barriers and obstacles34.0%28.6%31.7%57.1%21.4%43.9%21.4%
COSlope33.7%16.7%100.0%42.9%0.0%0.0%42.9%
ACContinuity of the pedestrian infrastructure32.9%15.4%100.0%25.0%15.4%0.0%41.7%
ACMaterial32.0%42.9%16.7%75.0%28.6%16.7%12.5%
SEVisibility31.4%23.1%50.0%50.0%15.4%50.0%0.0%
SASignaling29.7%13.3%0.0%41.7%6.7%100.0%16.7%
COWeather29.7%62.5%16.7%36.4%37.5%25.0%0.0%
ACWalking Speed29.2%50.0%25.0%0.0%33.3%66.7%0.0%
ATDensity27.8%0.0%20.0%66.7%0.0%46.7%33.3%
ATDiversity26.7%0.0%20.0%100.0%0.0%40.0%0.0%
CODistance24.6%40.0%62.5%0.0%20.0%25.0%0.0%
COPreference in Modal Choice24.5%36.8%5.6%66.7%15.8%22.2%0.0%
COTravel Time23.6%16.7%16.7%25.0%25.0%33.3%25.0%
ATDeterioration20.9%11.1%17.6%20.0%11.1%35.3%30.0%
ATDesign20.5%20.0%0.0%64.3%10.0%0.0%28.6%
ATSense of Belonging20.1%0.0%11.1%62.5%0.0%22.2%25.0%
HEPhysical Activity20.0%0.0%20.0%100.0%0.0%0.0%0.0%
COTravel Time Availability17.9%7.7%0.0%100.0%0.0%0.0%0.0%
COUrban Furniture17.9%0.0%42.9%16.7%0.0%14.3%33.3%
CONoise16.8%16.7%14.3%27.3%0.0%42.9%0.0%
ACSidewalk Width16.8%10.0%13.6%53.3%10.0%13.6%0.0%
COVegetation12.7%0.0%27.3%15.4%0.0%18.2%15.4%
COContamination11.1%0.0%50.0%0.0%0.0%16.7%0.0%
SEAccompaniment5.0%20.0%0.0%0.0%10.0%0.0%0.0%
CODeparture Time4.8%21.4%0.0%0.0%7.1%0.0%0.0%
HEEasing3.6%7.1%0.0%0.0%14.3%0.0%0.0%
COShade0.0%0.0%0.0%0.0%0.0%0.0%0.0%
Disclaimer/Publisher’s Note: The statements, opinions and data contained in all publications are solely those of the individual author(s) and contributor(s) and not of MDPI and/or the editor(s). MDPI and/or the editor(s) disclaim responsibility for any injury to people or property resulting from any ideas, methods, instructions or products referred to in the content.

