Review

Technical and Business Aspects of Battery Electric Trucks—A Systematic Review

1
Sustainable Mobility Management, EUREF Campus, Technische Universität Berlin, 10623 Berlin, Germany
2
Mobility Research Cluster, Department of Work, Technology and Participation, Technische Universität Berlin, 10587 Berlin, Germany
*
Author to whom correspondence should be addressed.
Future Transp. 2022, 2(2), 382-401; https://doi.org/10.3390/futuretransp2020021
Submission received: 5 February 2022 / Revised: 5 April 2022 / Accepted: 13 April 2022 / Published: 22 April 2022

Abstract

:
Heavy-duty trucks (HDTs) are responsible for considerable fuel consumption and greenhouse gas emissions (GHG) in the road transportation sector due to their heavier weight, and significantly more miles travelled in comparison with other vehicles. Regarding the climate change mitigation policies, HDTs need to become zero-emission vehicles. One of the technological solutions in this sector is the battery electric truck (BET). This paper includes a systematic review on relevant studies in the field of BETs, including the following: (1) the technical, stakeholder, and customer aspects in terms of charging solutions to give a comprehensive insight into their technological advantages and disadvantages; (2) the total cost of ownership (TCO) for BETs and diesel trucks; and (3) a CO2 life cycle assessment (LCA) from different technologies. Moreover, the result is formulated in the form of SWOT analysis to describe the strengths, weaknesses, opportunities, and threats of different charging technologies. Moreover, the different calculation methods of the total cost of ownership for the heavy-duty battery trucks and diesel trucks are compared. In addition, the CO2 LCA is analyzed, and the different estimation methods of the CO2 released in the environment are compared, which includes the CO2 emissions during mobility operations and during the different manufacturing processes.

1. Introduction

Electric vehicles (EVs) have been developing over the past three decades and are seen as a substitute for internal combustion engines (ICEs). EVs have vastly improved in every aspect, such as reduced cost, gross vehicle weight, engine efficiency, and performance for consumers. Opportunities for electrification are foreseeable in the coming decades, despite modes where emissions are tough to abate in HDTs, aviation, and the shipping sectors. The GHG emissions from freight trucks in the EU contribute to around 20% of road emissions [1]. A vehicle with a gross vehicle weight (GVWR) higher than 26,000 lbs is generally termed as an HDV [2]. Expeditious growth in demand for HDVs and their GHG emissions have created the incentive to develop alternative drivetrain options for many research institutions and original equipment manufacturers (OEMs). Despite enhancement in the efficiency standards for vehicles, various governments across the globe are planning to come up with some strategies to reduce fuel consumption and emissions.
The transport sector is a dominant and growing contributor to GHGs emissions worldwide. Despite their relatively small portion on roads, HDVs are responsible for a vast percentage of transport sector fuel consumption and GHG emissions due to their heavier weight and more significant miles travelled in comparison with other vehicles [3]. The transport sector in Europe is currently responsible for almost a quarter of total GHG emissions, with road transport representing 17.8% of total emissions [4].
The European Emission Trading System (EU-ETS) legislative framework was amended for phase 4 in 2018 to achieve the EU’s 2030 emissions reduction target (of 40% relative to the level in 1990), as well as their commitment to the Paris Agreement [5]. Europe requires new policies and strategies to electrify all HDVs and decarbonize the freight sector to comply with the EU’s Green Deal commitments [6]. Trucks with 200–300 km of range can cover most urban and regional deliveries. In the EU, almost half (47%) of road freight distances are trips of less than 300 km, corresponding to 90% of transport operations [7].
For the adoption of EVs, the range anxiety and time of charging remain prominent issues. However, analysts predict that the demand for BETs is to exponentially rise in the near future as the price of EVs will continue to decline, with increases in driving range and government initiatives placing stringent rules on diesel vehicles. The success of the BETs in the market depends on different aspects, including the technical, business, customer, environmental, and stakeholder aspects. This paper reviews and compiles relevant studies to acknowledge a broader spectrum of the different aspects of BETs. Moreover, this paper focuses on the two main dominant charging methods for BETs, which are fast charging and battery swapping. The advantages and disadvantages of charging methods are compared to give an insight into the market and adaptability of these two charging methods. In terms of technical aspects, the paper studies the charging and swapping time, the performance of the battery, and battery specifications.
The research purposes were formulated through five key questions, as follows:
  • Q1: What are the technical aspects of heavy-duty battery vehicles?
  • Q2: What are the customer and stakeholder aspects of heavy-duty battery vehicles?
  • Q3: What is the total cost of operation of heavy-duty battery trucks?
  • Q4: What is the CO2 life cycle assessment of heavy-duty battery vehicles?
  • Q5: What is the SWOT analysis for fast charging and battery swapping methods?

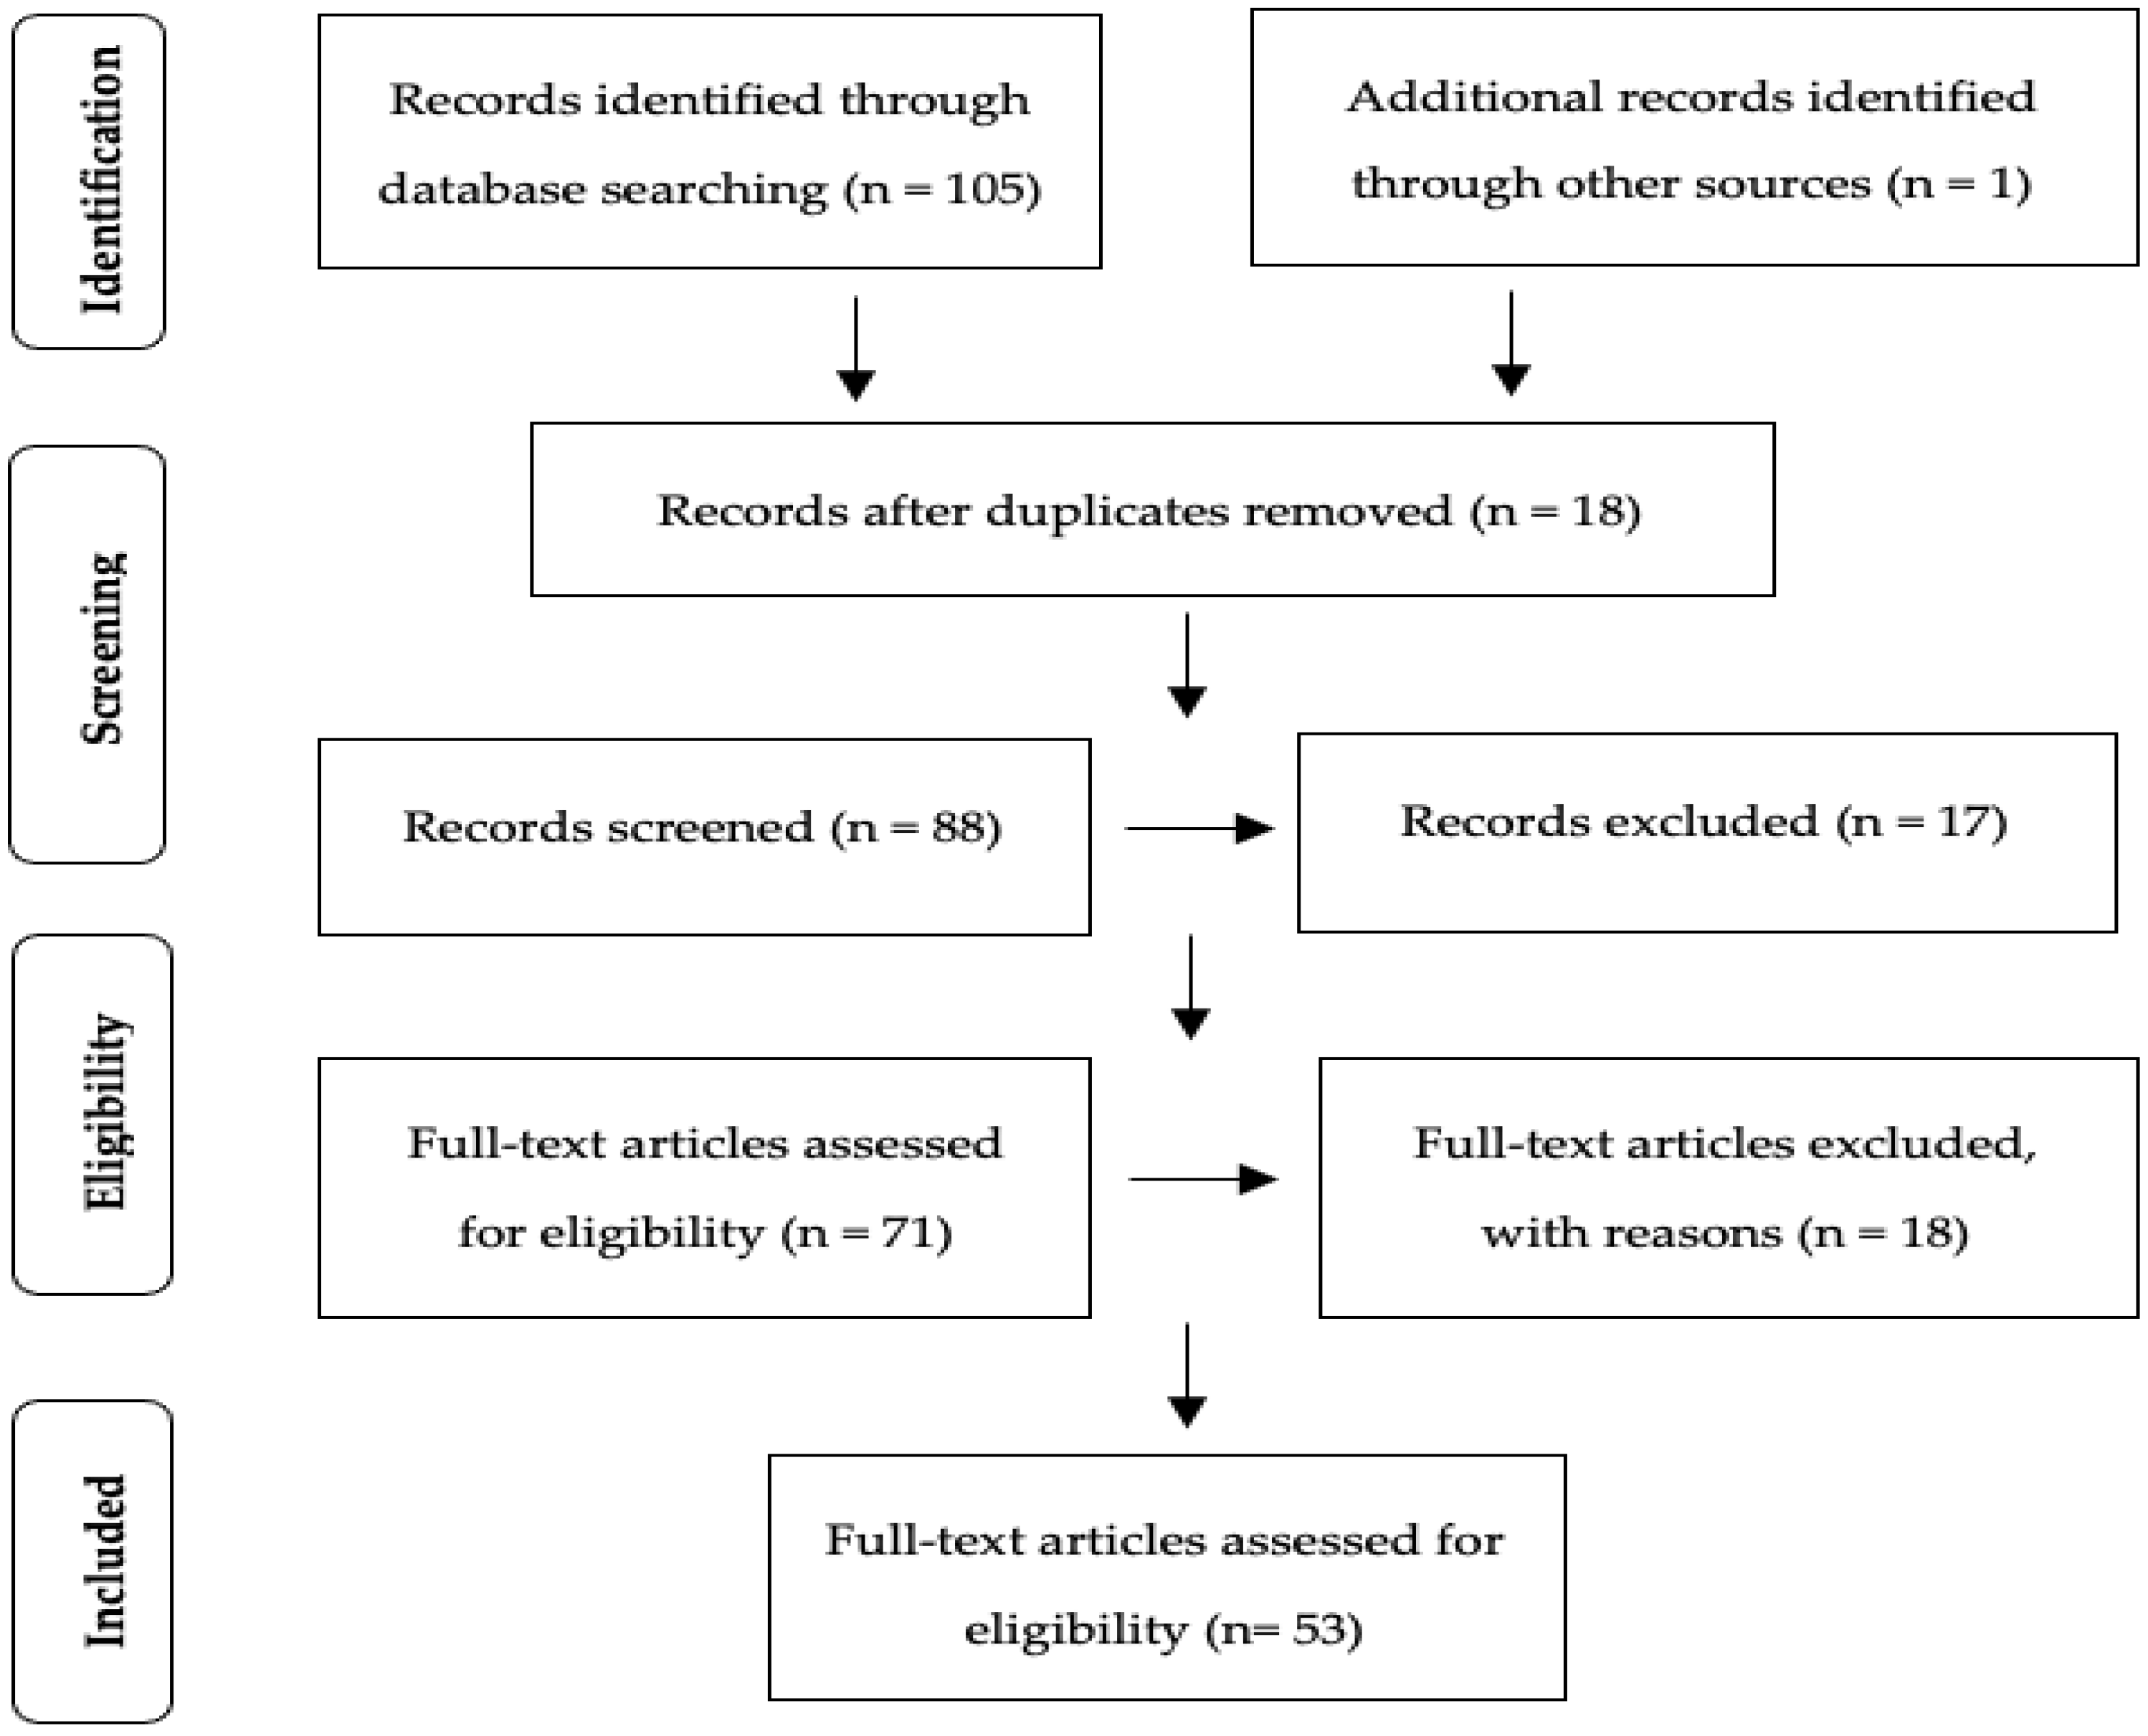
2. Materials and Methods

Materials for this study were accumulated from different sources, such as online newspapers and articles, predominately from research papers on Google Scholar, Scopus, Web of Science, and Research Gate.
Figure 1 illustrates the Prisma Flow Chart—demonstrating the whole process from identification to inclusion and exclusion of papers, including qualitative and quantitative synthesis of the literature review to generate a systematic review.

2.1. Criteria in Inclusion/Exclusion for the Selection of Studies

We found many fascinating facts and figures during the research, illustrated in this paper. Online searches were conducted through search engines such as Scopus, Google Scholar, Web of Science, and Research Gate. We made a colossal selection from immense sources after assessing 106 articles and excluding 53 full-text articles based on their topic and material content. The materials are compiled for examination and positioned on the facts of their titles, abstract, introduction, and keywords. Full-text articles were screened for eligibility at the eligibility stage, and 55 studies were selected based on relevance and the paper’s primary focus. The criteria of the selection of sources are based on the paper topic, keywords such as electric trucks, battery-electric trucks, battery swapping, and fast-charging stations. Furthermore, the articles were reviewed to check the paper’s relevance to the review purposes in the field of electric trucks.

2.2. Selection and Analysis of Studies

At the included phase, 55 scientific articles, journal articles, conference proceedings, and reports were selected to be reviewed. The findings of the 55 studies are categorized into five sub-topics related to the research questions, as declared in the introduction section. The categories and their sub-topics are explained in detail in the subsequent sections.
An additional consideration is the geographical allocation of the data. Studies are gathered mainly from the USA, Europe, China, and India. Primarily, the data was collected for the heavy-duty trucks, but in some cases, we referred to the heavy-duty vehicle, including buses. To give an overview of the EV market and problem statement, we also gave an insight into EV cars.

3. Synthesis of the Review Results

The study is based on two charging methods for EVs: Plug-in charging and the battery swapping method. Cohesive research is developed and describes the difference between these two charging solutions for each aspect. For Business aspects, the focus is on the perception of OEMs and logistic companies, such as; fees for services such as charging and swapping batteries, parking requirements, mode of payment, and battery standardization. The customer aspects focus on the satisfaction and need for their use. Customers might be interested in the pricing of BEVs, the price for the service, time in battery swapping or changing, mileage of BEVs, battery ownership/life, availability of charging/swapping stations, and power upgradation at homes, parking availability. Finally, the impacts on the stakeholders play a vital role in assessing the adoption of heavy battery trucks, including obstacles such as; standardization, compatibility, pricing strategy, commercial viability, substantial upfront investments, and reliability of leased batteries. For TCO, we compared the difference between the diesel and BETs, and for LCA, we outened the difference between the diesel and other fuel technologies. Furthermore, SWOT analysis is constructed to give an in-depth knowledge of the advantages and disadvantages of Battery Charging and Swapping and diesel technologies.

3.1. Technical Aspects

The technical aspects include charging time, battery swapping time, battery range, battery life, battery types, and performance. The conditions for battery-electric trucks have drastically changed since 2010 when lithium-ion battery prices were $1100/kWh, and the battery prices have come down 89% to $137/kWh in 2020 [8]. In terms of battery range, many automakers allege long-haul trucking due to battery advancement [8,9].

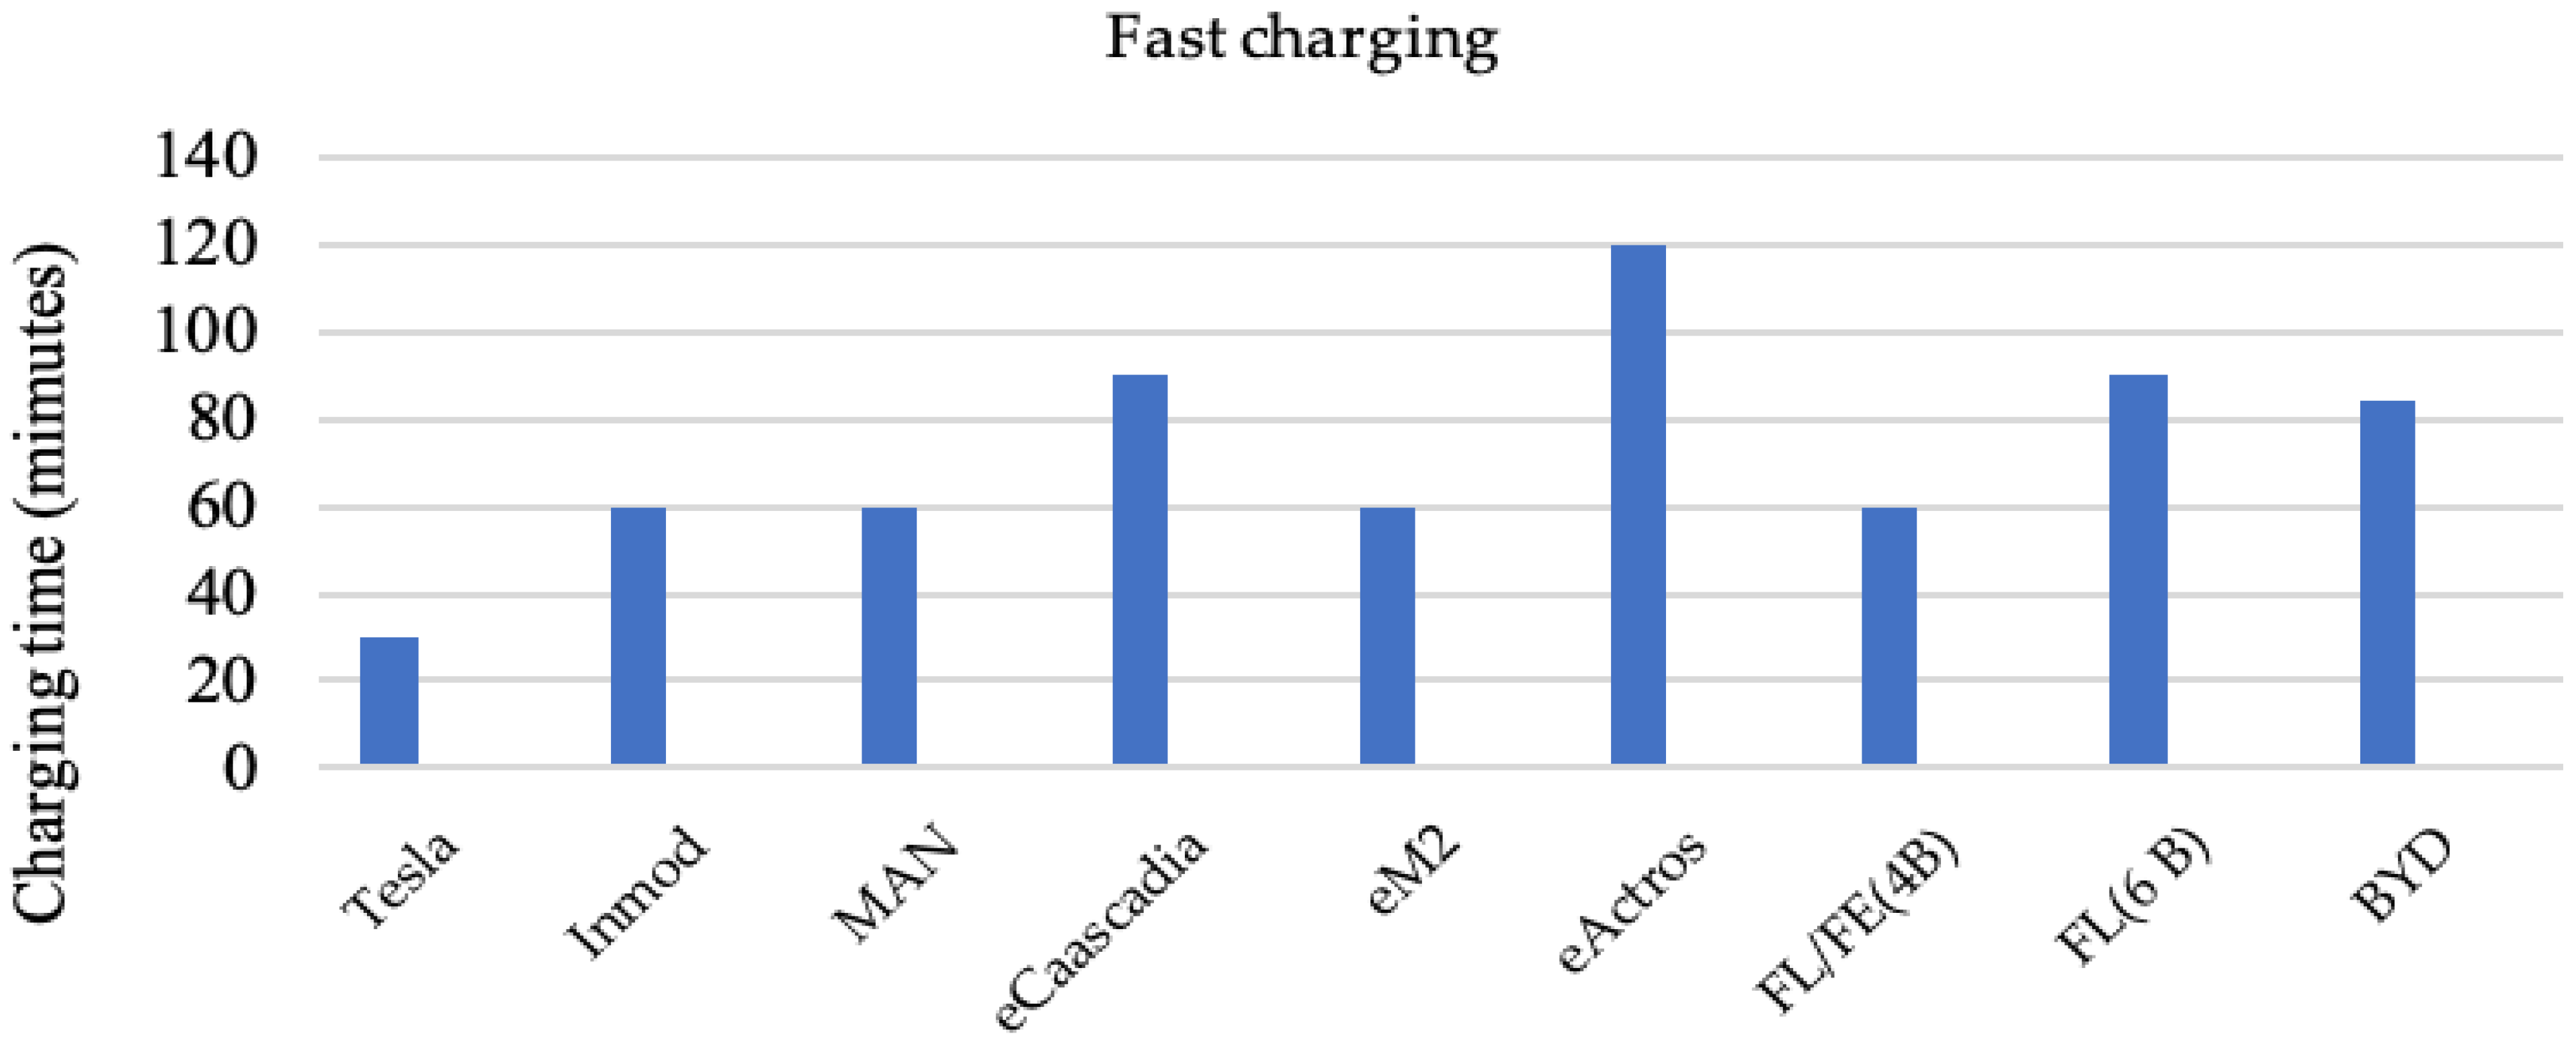
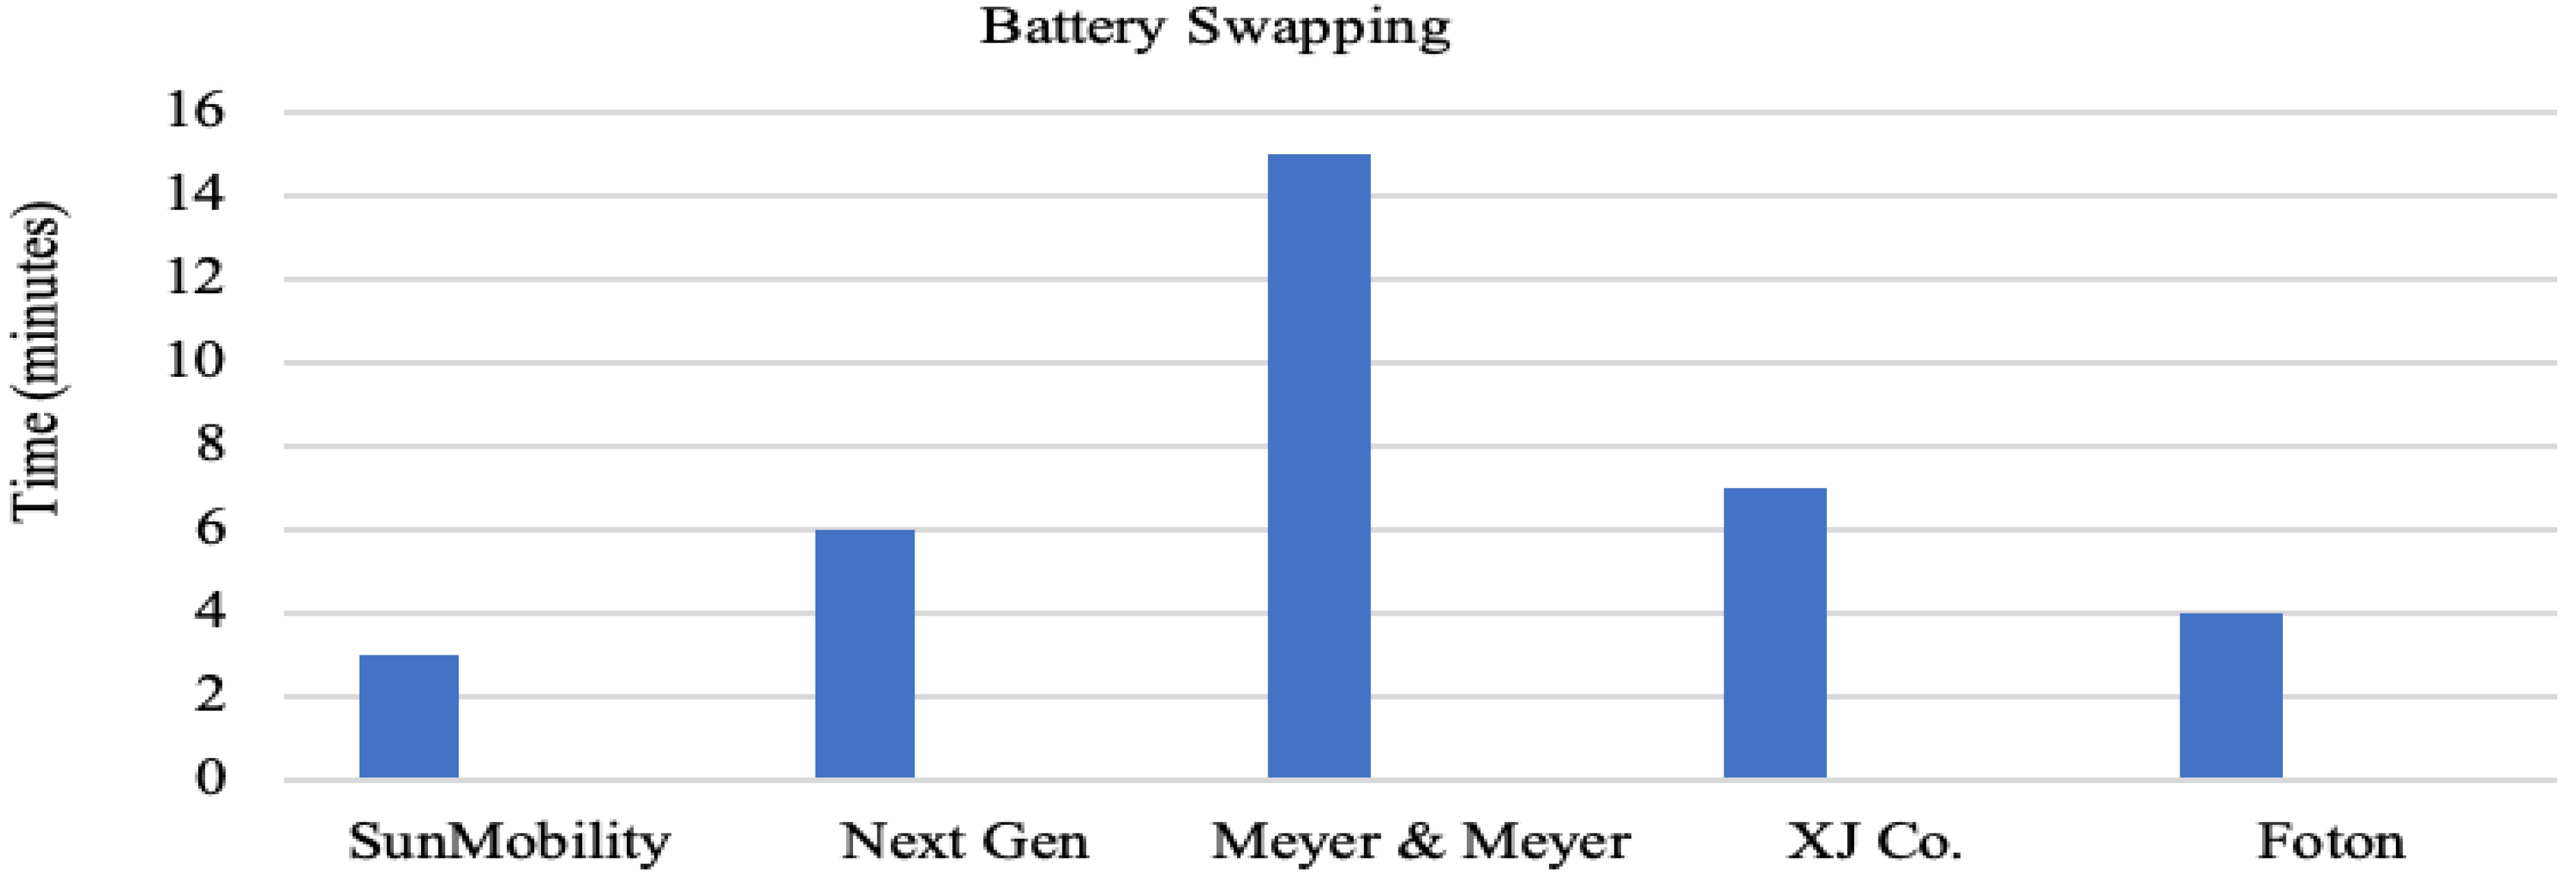
3.1.1. Battery Swapping and Charging Time

The need for the swapping method came into force for the following reasons; firstly, long haul trucks run on predefined routes with predefined time schedules so the goods will be on time and remain reliable and punctual to the customers. Secondly, trucks run continuously during service hours unless it is out of service. The characteristics have both positive and negative sides to electrification. Some companies have found the solution and come way forward to make more use of long-haul electric trucks and allow customers to buy. Here are some service providers; Foton launched its IBLUE truck, which takes 3–5 min to swap [9]. An Indian startup, Sun Mobility Smart bus swap time is 3 min [10]. The Chinese XJ Group Corporation takes 7 min for an e-bus battery to be swapped [11]. A Swedish Startup started battery replacement within 3 min [12], and Next-Gen Battery requires only 6 min of swap [12]. In Germany, a prominent fashion logistic company - Meyer and Meyer, uses two battery packs and takes 15 min in battery swapping.
Fast-Charging service providers; Tesla requires 30 min for a single charge [13]. MAN trucks use 150 kW DC chargers and take 60 min to charge [14]. An American truck manufacturer, Freightliner’s eCascadia (class 8) can charge 80% in 90 min [15]. Another Freightliner’s electric truck—eM2, has 315 kW of capacity and can drive with 80% charging in 60 min [16]. Germany’s automobile giant Mercedes Benz’s eActros has a capacity of 336–448 kWh, depending on the available charge. Fully charging takes between two and eleven hours (at 150 kW or 20 kW) and goes up to the 300–400 km range [17]. Volvo FL has a power output of 200–395 kWh with a range of 300 km and can be charged in 11 h with AC (22 kW) and in 2 h with DC (150 kW) [18]. Volvo FE has a power output of 200–395 kWh with a range of 200 km and can be charged in 11 h with AC (22 kW) and in 2 h with DC (150 kW) [19]. BYD heavy-duty vehicles take 1.4 h to charge the 350 kWh battery capacity with a 150 kW DC charger and 3.6 h with a 100 kW charger [20].

3.1.2. Performance of E-Vehicles

Czech manufacturer SOR supplied an 8-m-long vehicle with 22 seats, 35 standing places, and a range of 160 to 170 km, and can be extended up to 220 to 260 km. Its maximum speed is 80 km/h [21]. In 2014, an 18 t E-Force truck started operations for the supermarket chain group in Switzerland. In 2018 both MAN and Mercedes placed pilot e-trucks with customers. Volvo with the 16 FL Electric claimed a range of 300 km [18]. VDL partnered with MAN to develop a 37 t truck. However, the range is aimed at inner-city deliveries of around 100 km [14]. The Newton is available worldwide with three different payload capacities from 2800 to 7300 kg, ranging from 89 to 177 km, and a top speed of 80 kmph [22]. The Netherland-based company, Ebusco, makes E-buses for the public transport fleet and runs in many European countries, including Germany. The company claims the bus can carry 90–130 passengers with a mileage between 350 km and 500 km for second and third-generation buses, respectively [23]. In addition, the battery range of Meyer and Meyer logistics trucks is up to 300 km [24]. American truck company Nikola produces an E-truck-Tre with a 250–300 km range with up to 750 kWh battery capacity and 350 KW maximum charge power [25]. eActros has a range of 200 km with 11 Li-ion battery packs with a combined capacity of 240 kW and can be charged through CCS [26]. Tesla requires 1 MWh of electricity for a single charge and charge in 30 min [27] and accelerates from 0–60 mph in 20 s [28].

3.2. Customer and Stakeholder Aspects

The Policymakers are drawing a climbing portfolio of measures to dwindle climate impacts and GHG emissions from road freight. It includes actions, such as green freight programs, fuel-efficiency standards, and mandates such as vehicle efficiency standards or limits on exhaust pollutants [29]. In addition, the government plays an integral role in replicating and maintaining economic competitiveness while mollifying adverse effects associated with the freight sector, such as congestion and emissions. Moreover, they also perform a decisive role in the interests of transport, industry sectors, and other stakeholders and work to delineate the imperative legislation and guidelines for the zero-emission for long haul distances [30]. Customer aspects encompass each offering by a company, whether it is a product, service features, ease of use and service, or product liability. Customers would expect the same for each service, Battery swapping station, or fast charging solution. For battery-swapping stations, customers first have a mindset of service price for changing the used battery with a fully charged one, as it is based on the fixed charge or service fee or subscription-based model [31]. However, this process is fast as it takes a few minutes to replace the battery to reduce the waiting time. In addition, high-power chargers can minimize the wait time for charging but still, it is expensive for the customer [20]. However, for battery swapping technologies, the truck owner should not upgrade their charging point to high power voltage because the swapping stations charge the battery collectively with their own charging facilities for a considerable number of batteries at the industrial level [32].
Whereas for fast charging, customers need the charging other than home. EV users have to wait and pay for parking in public areas if not available as per demand. Since 2014, eRoaming has become highly dynamic. Roaming platforms allow different manufacturers to charge their vehicles at charging points run by other operators [32]. Around two-thirds of the population in Germany live in multiple-story apartments. Few house owners have their own parking spaces, some residents rent specific areas in the locality, and others use on-street parking [32].
The main obstacles to the battery swapping method are standardization, pricing strategy, commercial viability, upfront investments, and battery liability [32]. Installation of Battery Swapping Stations (BSS) should be near the city center, every major road, and the countryside that connects the suburbs to the city used by the commuters who travel every day. A BSS on busy streets works as a marketing tool for buying EVs so that people will go electric. A fixed fee for the swapping service should be designed to make EV’s owner pay the same amount regardless of the location. The bidirectional power flow is incorporated in BSSs for connection with the grid. Battery swapping stations are profitable for station owners when they have enough charged batteries to support their needs. Swapping demand; is the only critical factor that affects Battery Swapping Station’s income, including amount level and distribution characteristic. If too few vehicles adopt these compatible batteries, then the BSS becomes useless for the market as a whole. Likewise, the electricity price level is another main factor influencing BSS’s income. Furthermore, the lower the electricity price, the more profit for BSS. Additionally, Costs for facilities such as EV’s battery, battery charger, and the swapping robot are three main components of BSS. The availability of the same standard interchangeable batteries from different manufacturers is the only option for a battery swapping system.
While in fast charging cases, station operators are allowed to charge as per local regulations. For example, only regulated utilities can sell electricity per kWh in some jurisdictions. The most straightforward and inexpensive path is installing the necessary connection points for future fast chargers and planning for upgrades in the number and size of transformers. When the fixed fee is amortized over all the charging carried out in a month, daily users have a lower effective cost per kWh than users who do make much of their vehicles [33]. Electric trucks are predominantly charged at locations where trucks can be left for long periods, such as parking spaces, at home, or work, so they do not require space for infrastructure. Installing charging stations in customer parking spaces is a viable option for businesses. Operators should support publicly accessible charging points using smartphone apps or RFID cards [32]. Therefore, interim charging complements a widespread fast-charging network based at central locations. Additionally, fast charging also acts as an emergency charging network if drivers suddenly and unexpectedly need to charge their vehicles.

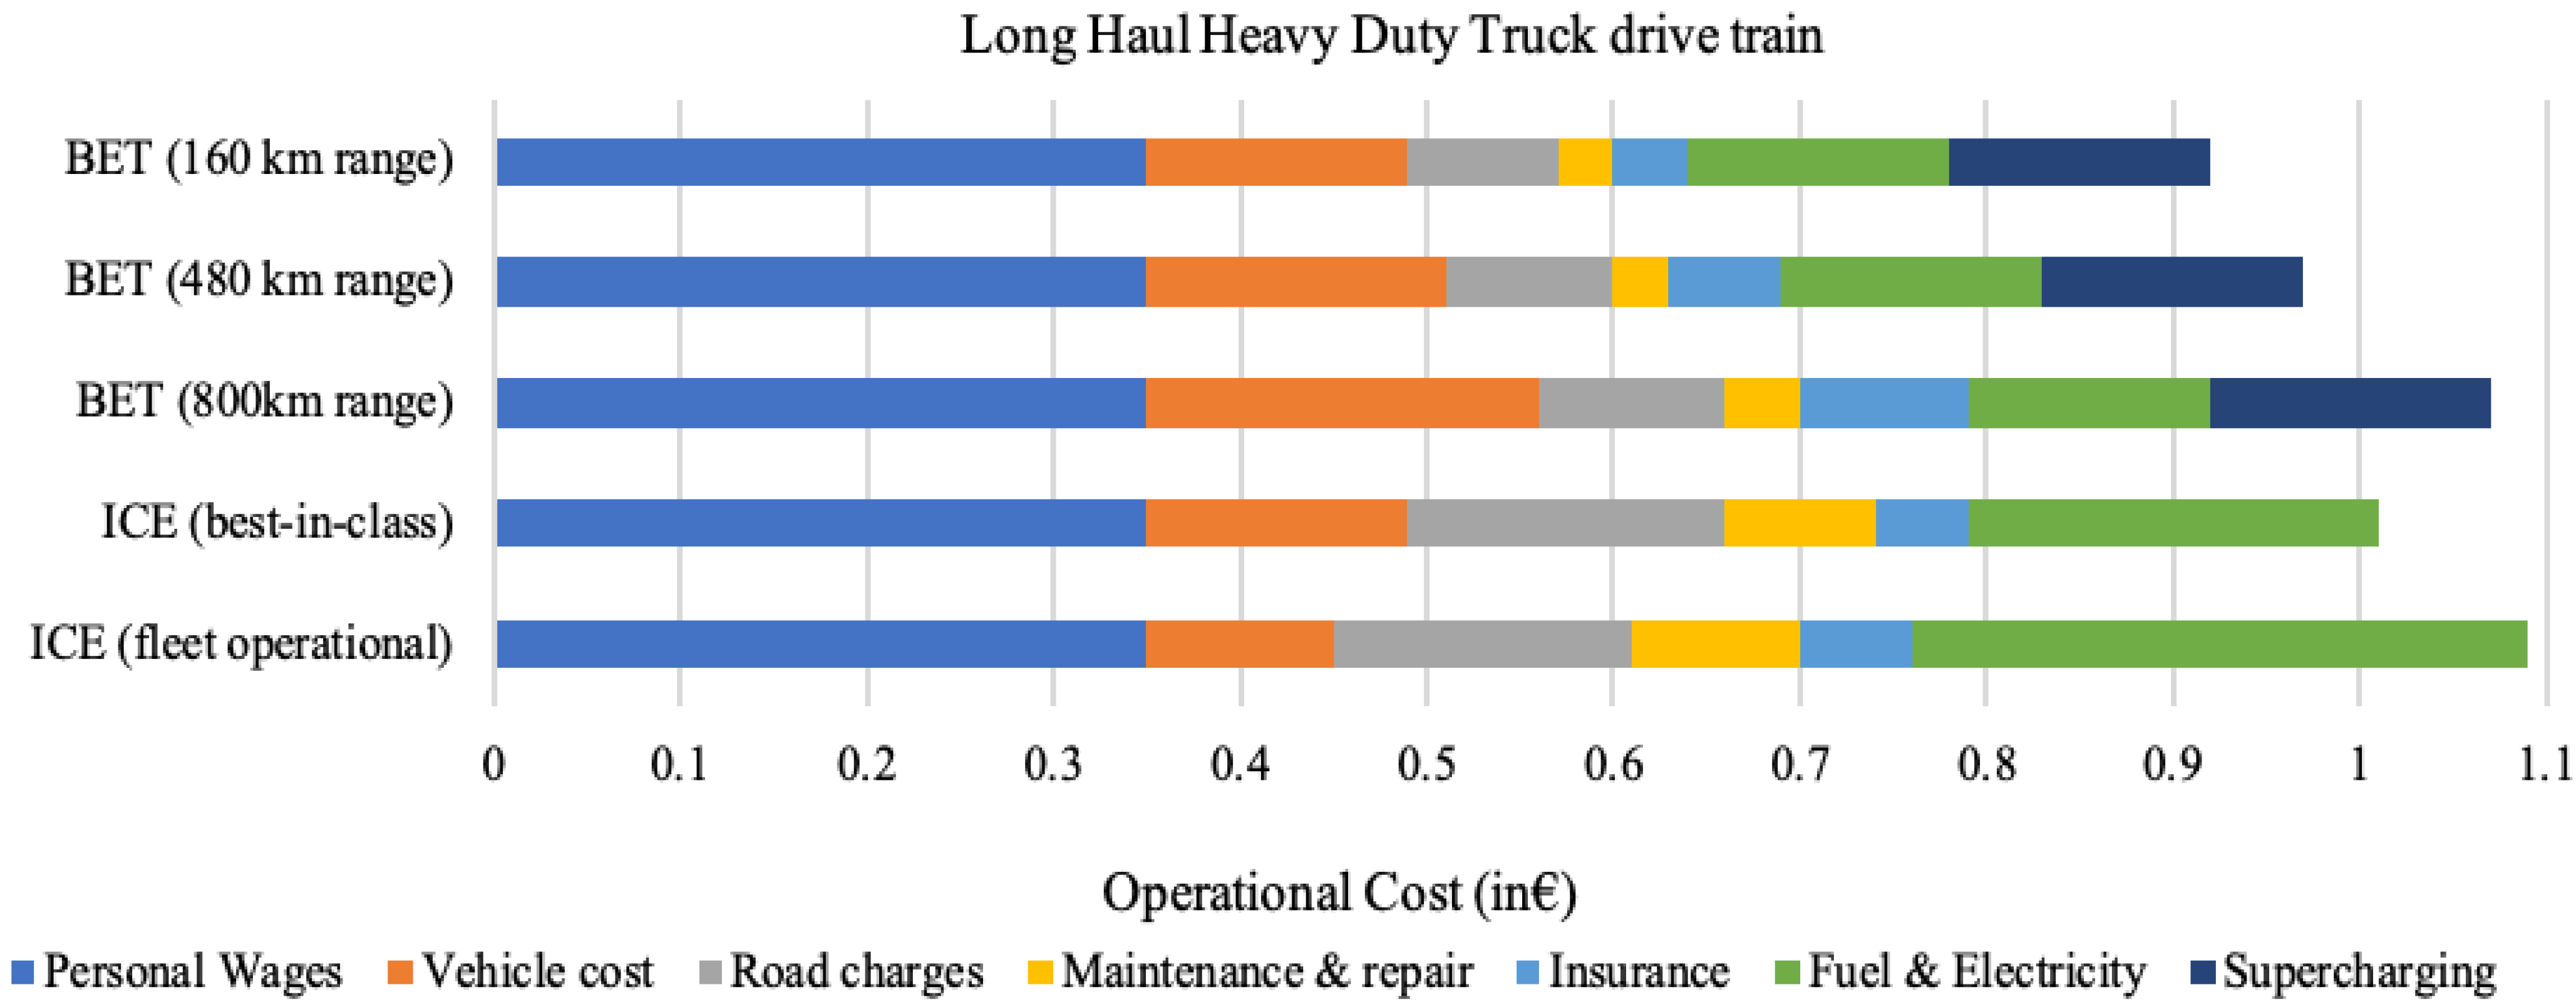
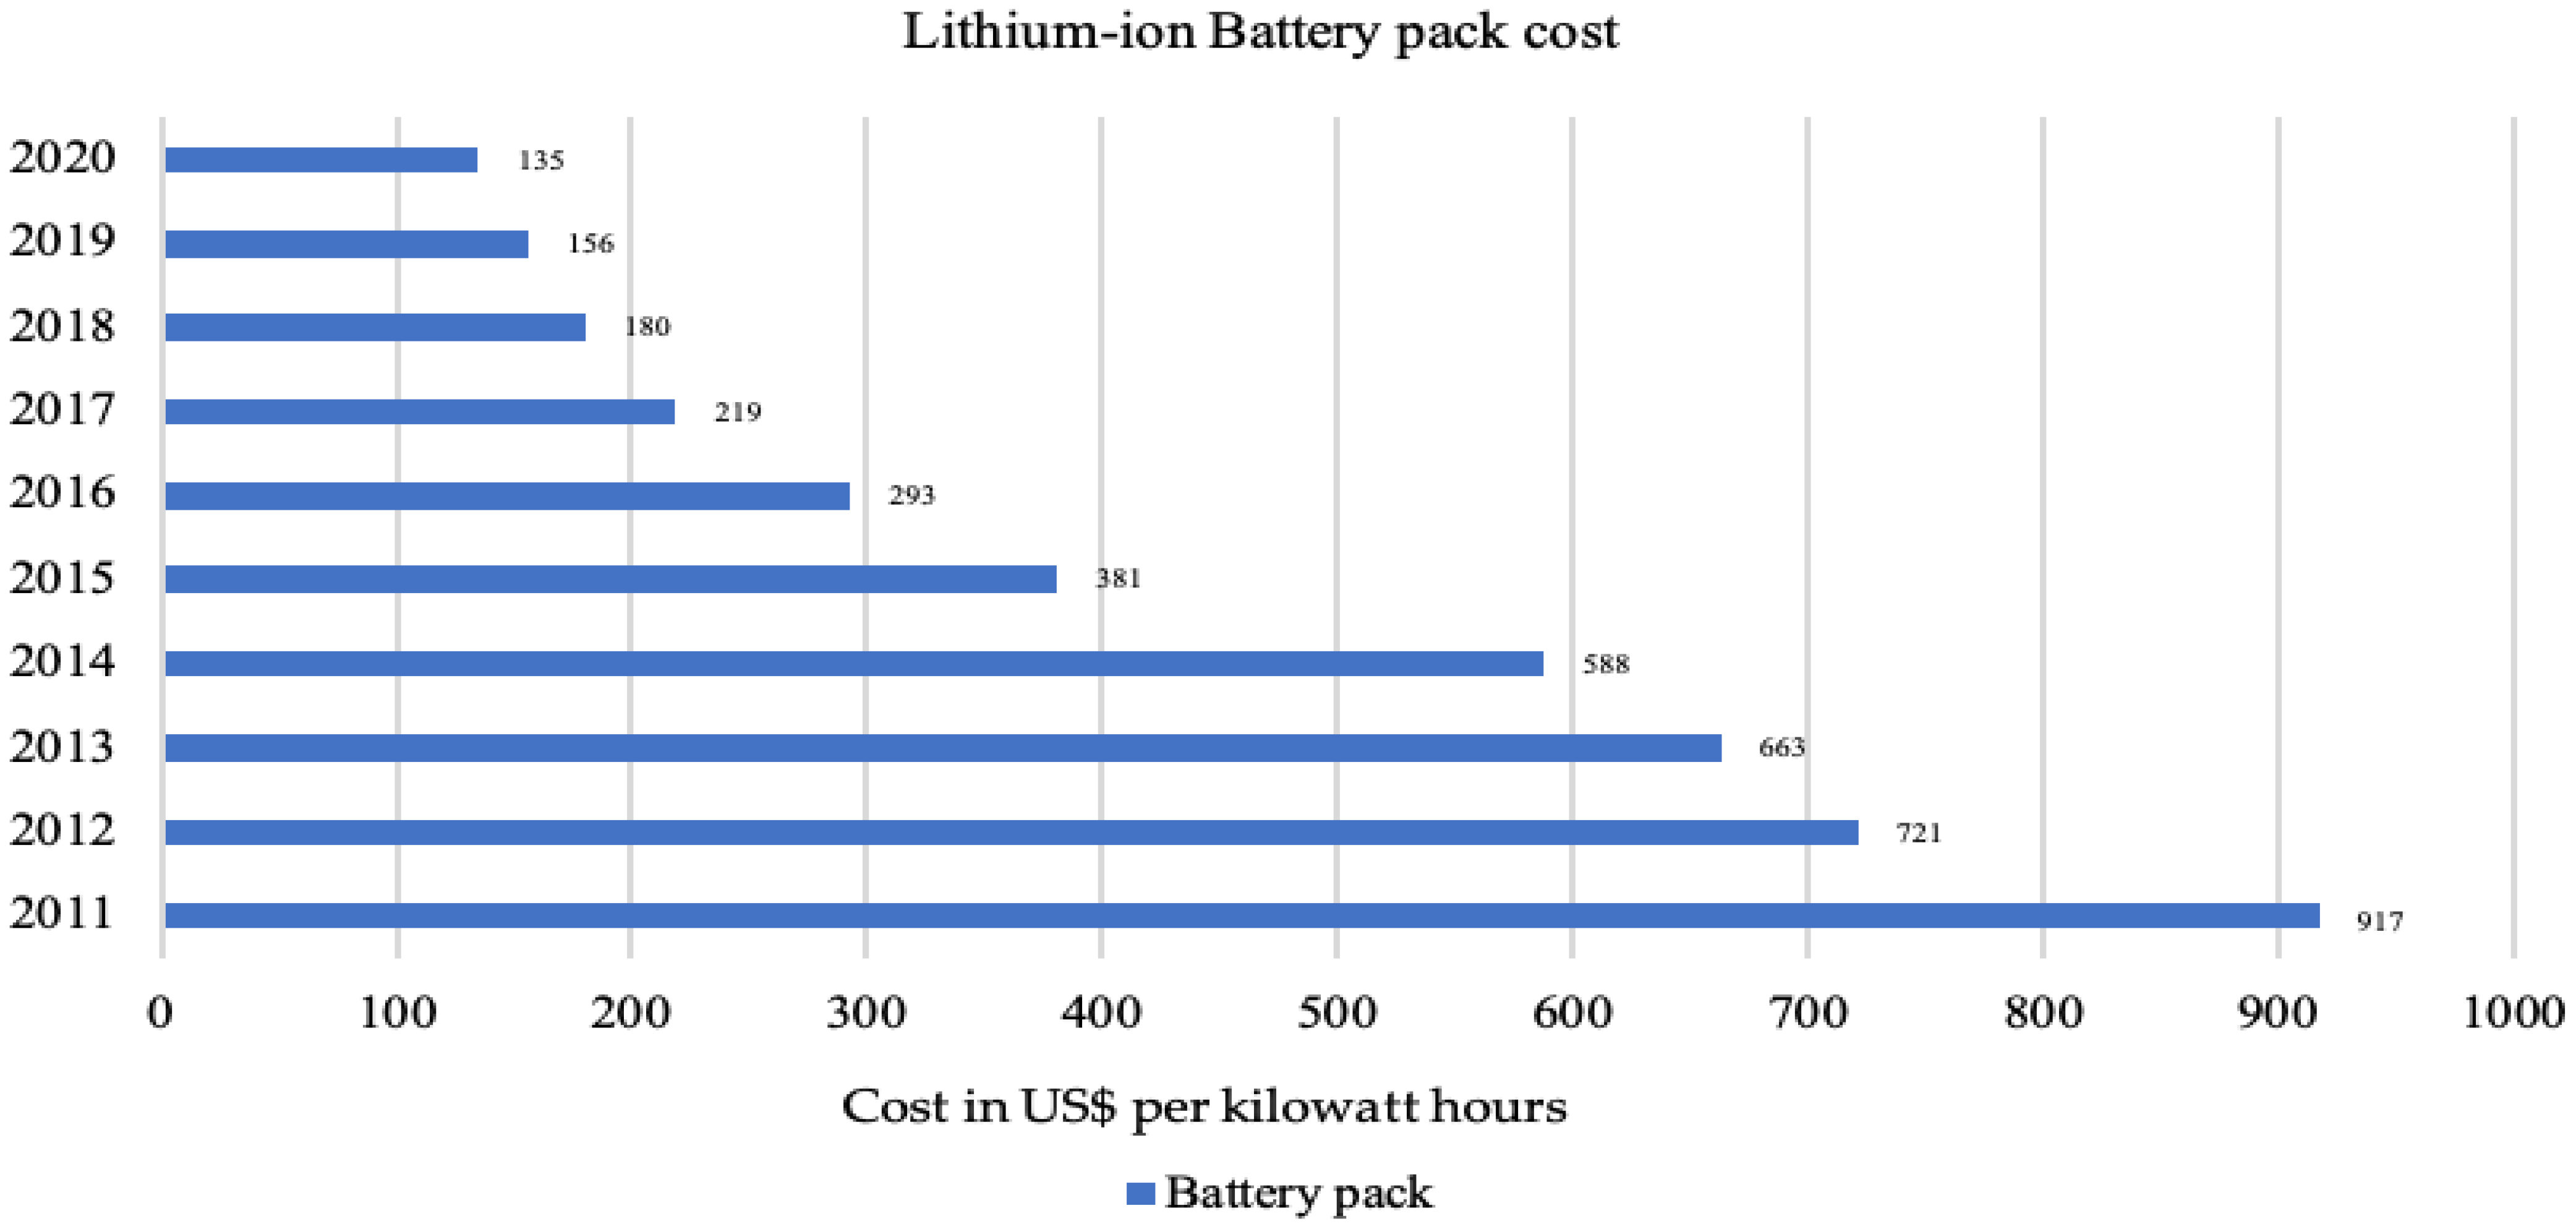
3.3. Total Cost of Ownership (TCO)

In this section, the different methods and approaches for TCO analysis of BETs are reviewed and compared with other technologies, including diesel, and fuel cells, to define a framework for the TCO calculation. The different scenarios are considered for the TCO components in the future within the next 5 and 10 years from 3 international studies and their formulas for calculating TCO:
1-
European Federation for Transport and Environment (T&E)
For a period of 5 years (1st ownership) = Cost of truck + Battery Cost + Maintenance cost + Wages of driver + Road charge + Electricity Consumed + Insurance
2-
International Council on Clean Transportation (ICCT)
Total Cost of Ownership (for 10 years) = Capital Cost + Maintenance cost + Fuel cost
3-
International Energy Analysis Department—Lawrence Berkeley National Laboratory (UCLA)
Cost of ownership = cost of operation + fuel cost + maintenance cost + capital cost
Fuel cost (e-truck) = charging equipment cost + electricity cost
Capital cost (e-truck) = cost of Battery and other components + unit capital cost (diesel truck) − the cost of diesel truck components
In this paper, we recalculated Battery Electric Truck TCO based on each study’s assumptions and compared the results with other technologies such as diesel and have been made to put together for a comprehensive and brief analysis. Each international research has made assumptions about the operational phase of BETs and ICEs such as driver wages, maintenance cost, fuel cost, and insurance cost. They have speculated the span of first ownership of 5 and 10 years by T&E and ICCT. The study of UCLA Berkeley says the operational period is 260 days a year. Likewise, only the T&E estimation included the personal wages or driver salary of €50,000 per year. At UCLA Berkeley, operating costs include driver wages, road charges, and insurance costs.
Additionally, BET cost and Internal Combustion Engine (ICE) cost also differ, while UCLA mentions the cost of the truck without a drive train. The assumptions and calculations from T&E, ICCT, and UCLA study for various variables are drafted into one frame, and below is the compiled framework of studies. Table 1 distinguishes all the above three studies based on operational cost, cost of truck (Diesel or BET), maintenance cost, fuel cost, insurance cost, and road charges.
The first TCO calculation method was the European Federation for Transport and Energy (T&E) study in May 2018. The various cost has been assumed for a simple understanding and calculations. The operational cost is divided into segments such as personal wage (driver’s salary), vehicle cost, road charges, maintenance and repair cost of the vehicle, insurance, cost of fuel, and supercharging fees.
Figure 2 represents varying costs related to TCO for Long haul Trucking in the EU for both ICEs and BETs. This price is a gross overestimate, ignoring the cost of the remainder of the truck and any profit margin. The truck’s price is a gross estimate, ignoring the cost of the truck’s resale, besides the price difference between the two models, assuming that the price difference is associated only with the battery size. The 800 Tesla truck has a range of 800 km and is priced at $US 180,000, but that is likely to exclude optional extras desirable for EU haulers. Assuming the final price of €170,000 and expecting that assembly takes place in Tesla’s Dutch-based plant, evading the EU’s 22% import tariff (Commission Implementing Regulation (EU) 2015/1754 of 6 October 2015, amending Annex I to Council Regulation (EEC) No 2658/87 on the tariff and statistical nomenclature and the Common Customs Tariff, OJ L 285, 30.10.2015). The study has deduced haulage of 150,000 km annually for the business case and correlated to the EU fleet average of around 110,000 km [34]. The maintenance cost calculated for ICE is €12,500 per year, and T&E estimated about one and half of ICE for the BET because of having a simpler drivetrain and less wear and tear on the braking system due to regenerative braking, and no presence of a gearbox. Importantly, it is assumed that there is no battery replacement in the initial five years. Insurance is driven by the impact assessment and is believed to be proportional to the upfront cost of the vehicle. The EU average industry rate is approximately €0.12/kWh, whereas Tesla’s superchargers are currently €0.24/kWh. Tesla is promising (US customers at least) a charge of €0.06/kWh for supercharging service. The EU average for the best-in-class semi is €0.18/km, and for BET, it would be €0.09/km [1].
Regarding the TCO calculation of T&E in 2018, the cost per km for BET best-in-class (160 km) is €0.93/km, whereas the cost involved in running a diesel truck (best-in-class) is €1.01/km. Therefore, it is concluded that BETs (160 km range) have less TCO than diesel trucks, even though the initial vehicle purchase cost is high. This calculation made some assumptions based on the market growth, government policies for the taxes, employee rights, the diesel, electricity rates, road and toll charges, and zero-emission freight strategies for cities and their infrastructure. The analysis was demonstrated with a simplified road load equation for an average ICE, a best-in-class diesel ICE, and three battery-electric trucks.
The next international study is on Transitioning to zero emissions for heavy-duty freight vehicles and was performed by The International Council on Clean Transportation (ICCT) in September 2017. This study was conducted for the International Zero-Emissions (ZEV) Alliance and was supported by its members. The cost investigation intends to illustrate the disparities in the cost of various trucks technologies over a specific course of time. The total cost of ownership analysis is over ten years of long haulage, including capital costs (truck price), maintenance costs, and fuel costs over the vehicle’s life period. The fuels and technologies weighed in the analysis are diesel, fuel cell (renewable), overhead catenary electric, and electric dynamic induction. All costs in the analysis are in U.S. dollars in the year 2015. The study is constrained to vehicle and fuel costs, and taxes, insurance, personal wages, and road charges are excluded.
The EU fleet has average annual haulage of around 110,000 km [35]. The costs are estimated per kilometer and are assumed to remain steady for vehicles manufactured between 2015 and 2030. The maintenance and repair costs are simulated at $0.12 per kilometer for diesel and $0.11 per kilometer for electric trucks [35]. As trucks become more efficient over time, the maintenance costs become a higher percentage of the total vehicle operating costs because of advancements in technology. The fuel price is based on the International Energy Agency (IEA) World Energy Outlook (WEO) 2015. Table 2 illustrate prices for each fuel technology.
The cost per km for diesel is $0.77/km, the cost incurred in fuel cell technology is $0.59/km, and the price at which electric overhead truck run is $0.55/km. The TCO calculation is not based on personal wages, operation costs, and insurance. The operational period for which the TCO is calculated is ten years. The conventional diesel vehicle costs increase over time but are relatively consistent in years compared to alternative fuel technologies. All the other technologies have a reduced price of ownership as years pass because their capital costs decreased from 2015 through 2030. The zero-emission vehicle technologies show that the highest cost reduction is in fuel cell technology. Excluding infrastructure costs, the two electric vehicle scenarios, induction, and overhead catenary, ultimately arrive at among the lowest total vehicle cost during the 2025–2030 timeframe. Compared with diesel vehicles in 2030, overhead catenary costs are 25–30% lower, and induction results in 15–25% lower prices. However, the cost gap between diesel and electric technology widens across the regions as diesel trucks become more advanced and expensive in compliance with future efficiency regulations.
Another study for TCO calculation was carried out by the International Energy Analysis Department—Lawrence Berkeley National Laboratory. Table 3 shows the assumptions for the cost of the different components. Total Cost of Ownership is fundamentally per-mile, equating to unit capital, maintenance, fuel, and general operating costs, as shown in Equation (1). The fuel cost of an electric truck comprises electricity cost, and the standard cost of the charging equipment is shown in Equation (2). By Computing the unit capital cost of an electric truck as the unit capital cost of a diesel truck plus the capital cost of the battery and electric power train minus the price of the diesel truck components such as; the power train and fuel tank.
The major component of the incremental capital cost of an electric truck is the battery cost. The UCLA study amortized total capital cost to estimate per-mile incremental capital cost, primarily driven by battery prices and the range of electric trucks. It accounted for the depreciation of the battery and ignored the vehicle’s devaluation. UCLA estimated electric truck fuel costs, charging a fee (Phadke et al., 2019), including electricity and fast charging infrastructure costs. The unit cost of the charging equipment is the minimum price per unit of energy delivered (kWh) that a charging service provider should charge consumers to break even on the investment in charging equipment and grid interconnection.
We recalculate the operational time for 5 and 7 years for diesel and BET separately. Diesel trucks cost €1.6/km for five years and €1.485/km for seven years. At the same time, BET costs around €0.63/km for five years and €0.73/km for seven years.

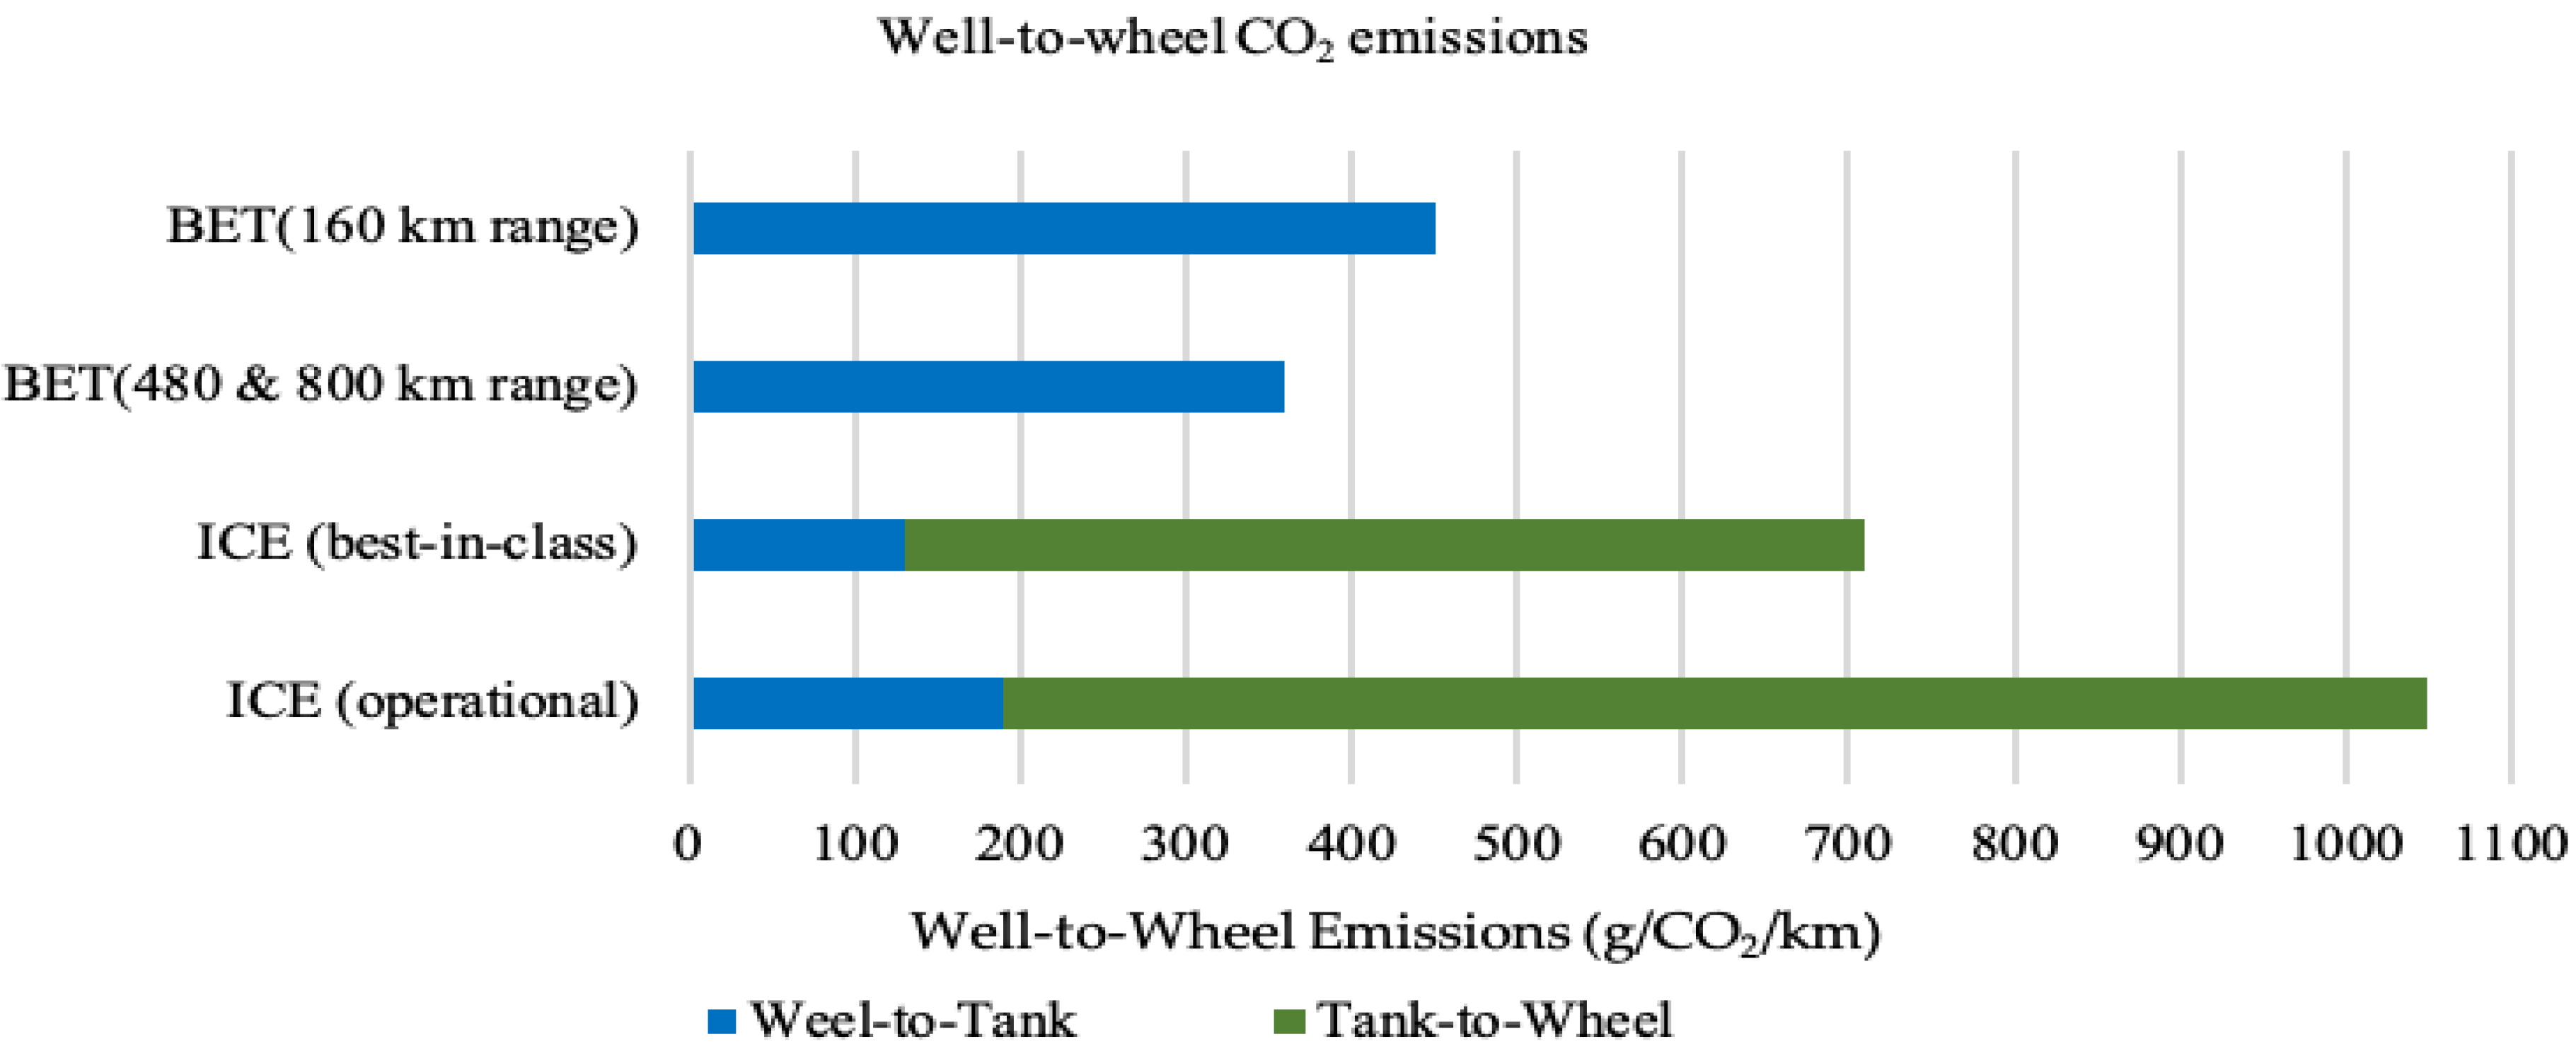
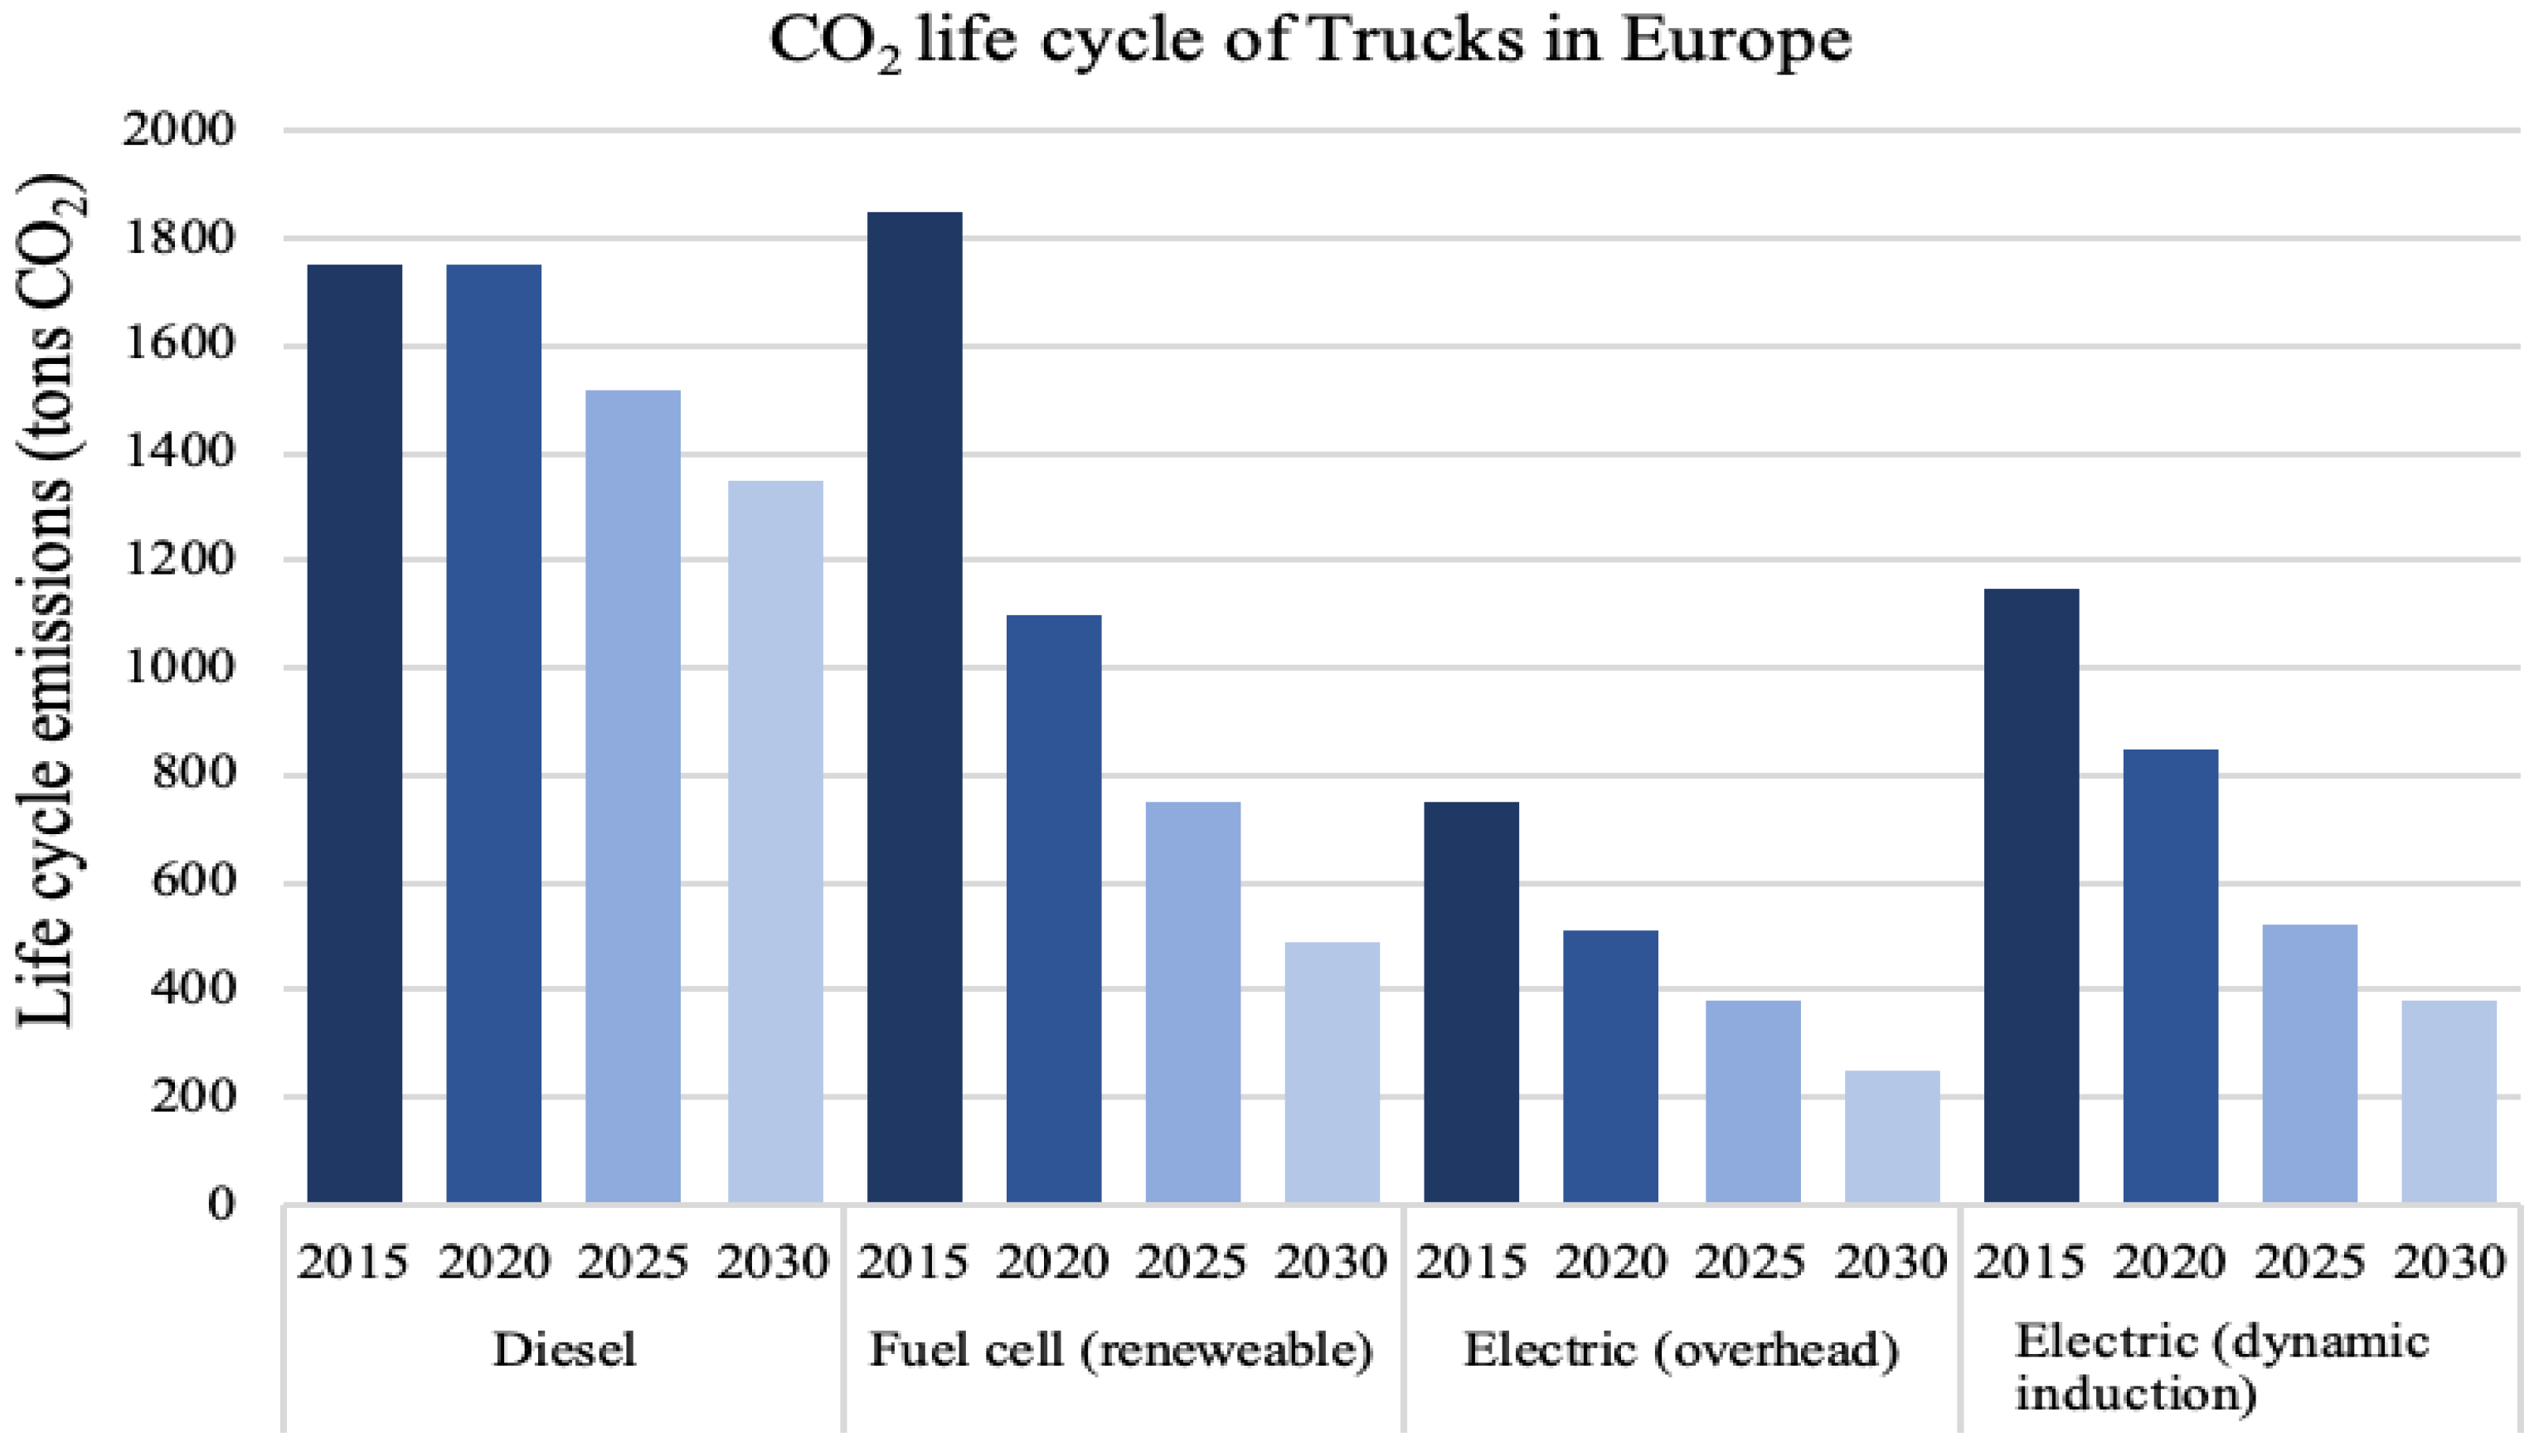
3.4. CO2 Life Cycle Assessment (LCA)

The CO2 life cycle is the number of carbon emissions emitted by a vehicle during its lifetime. The CO2 assessment calculated by T&E and ICCT is compared in this section. Each study has its own assessment methodology, specific guidelines, and terminology.
A truck’s complete LCA would account for the fuel or battery’s energy required (and associated emissions) and all manufactured components. Pollutants such as NOx, SOx, and PM for BETs are zero from a powertrain perspective. Wheel-to-wheel (WTW) is equal to Well-to-tank plus Tank-to-Wheel emissions.
The term Well-to-Tank (WTT) describes emissions from fuel supply from the energy source (petrol, diesel, electricity, natural gas). Tank-to-Wheel (TTW) refers to emissions from the energy chain of a vehicle from the point at which energy is absorbed (charging point; fuel pump) to discharge (being on the move) and use the fuel in the vehicle and emissions during driving [36]. In Figure 3, CO2 life cycle emissions accounted for two phases; WTT and TTW for battery-electric trucks and ICE trucks. Emissions produced by well-to-wheel are significantly lower than the tank-to-wheel in ICE. It is seen that both emissions are emitted by ICE vehicles, but production of CO2 is zero for Tank-to-wheel in the case of BETs since BETs do not have any tailpipe emissions.
Figure 4 shows that ICCT calculated the life cycle emissions in CO2 tons per kilometer for different technologies from 2015 to 2030. Compared with fuel cells, diesel vehicles emitted 5% fewer emissions in 2015. In 2020, fuel cell emissions dropped from 1850 tCO2 to 1100 tCO2, almost 40% of emissions compared to 2015. Its carbon intensity significantly decreases as hydrogen is produced mainly from fossil fuels through steam methane reformation to renewable energy sources. Diesel vehicles continued to release the same amount of CO2 even in 2020. In addition, the emissions produced by electric overhead catenary in 2020 saw a significant reduction compared to 2015 because of technological advancement. Due to the high efficiency of electric motors and to generate electricity from zero or low-carbon sources, BETs would have lower emissions in the running phase than similar internal combustion engine vehicles. In 2015 catenary electric vehicles had 32% lower lifetime CO2e emissions than conventional diesel vehicles in Europe, while fuel cell vehicles have 5% more emissions.
During 2015–2030 the diesel truck reduced 22–35% carbon intensity, the fuel cell technology resulted in a 73% reduction in carbon emissions, and the catenary and dynamic induction electric vehicle technology had a drop of 66–76% and 61–77%, respectively [36].
ICCT conducted another study in 2017 on the Fleet level impacts of zero-emissions truck penetration. The penetration of zero-emission technologies in heavy-duty vehicles in the European fleet from 2015 to 2050 estimates the CO2 emission impact. This model simulates advanced technologies being phased into the fleet from 2020 beginning as new vehicles increasingly replace the older ones and take over more significant fractions of freight through 2050.
The first is the base case scenario, which assumes the entire European truck fleet remains of ICE vehicles powered by diesel. The second scenario assumes the efficiency standards are implemented, heading towards advanced improvement in diesel efficiency to the baseline. The third scenario—the fuel cell intensive scenario, has initial fuel cell truck sales starting in 2020 and attaining 50% of the sales share in 2050. In the same period, the Overhead catenary electric truck sales begin in 2020 and reach 15% of the market share in 2050. The final scenario is the electric intensive scenario, which has electric sales starting in 2020 and hitting 50% of the sales share in 2050, whereas Fuel cells starting in 2020 and reaching 15% of the market share in 2050.
From Table 4, by introducing the scenarios to the current technology, we can see that after 2015, there were reductions in CO2 emissions. The first is the base case, where emissions are reduced because it was taken as a benchmark for other scenarios. In the base case, lifecycle emissions are estimated to increase approximately 38% during 2015–2050 from 281 to 386 million metric tons of CO2e. With the fuel efficiency, an 18% cut in emissions till 2030 and a 40% reduction from base case to 2050. In fuel cell incentive, sales starting in 2020 and reach up to reach 50% of the sales share in 2050, overhead catenary electric truck sales reach 15% of the sales, and emissions are estimated to peak around 2025 at 300 million metric tons of CO2e and decrease through 2050, resulting in a 63% reduction in emissions relative to the base case in 2050. Electric sales start in 2020 and go up to 50% of the sales in the electric efficiency scenario, and fuel cells 15% in 2050. As a result, emissions are expected to decrease by 70% relative to the base case in 2050.

3.5. SWOT Analysis of Battery Swapping Technology in Comparison with Fast Charging and Internal Combustion Engine

SWOT analysis is the strategic planning of any organization that measures liability and acceptance by analyzing its key strengths, weaknesses, opportunities, and threats. In the same view, we developed a model to evaluate the different aspects of battery swapping and fast charging solutions. Finally, we will construct some of the keynotes for SWOT and develop an evaluation. We will assess the technical feasibility, energy consumption data approach, and economic viability by comparing battery swapping and fast charging with ICE technologies. Table 5 shows the SWOT analysis chart.

3.5.1. Strength

Time Saving

The time taken by the swapping method in replacing the depleted battery with a fully charged one is much less than the charging of EVs with fast chargers. For heavy-duty vehicles, charging by fast chargers typically takes 0.5–1 h, while time by swapping takes only 3–15 min. Time varies due to different battery technology used by various manufacturers and connection power. Waiting time is excluded and not taken into account when calculating the time used in battery charging or battery swapping and generally depends on the number of vehicles, the number of batteries available for swapping, or the number of charging points at one place. From Section 3.1.1, Figure 5 and Figure 6 shows the time in the fast charging and battery swapping by different service providers.

Efficient Solution for Load Management

High peak loads disturb the electrical grids because they must be designed for the maximum expected power and slash power consumption (peak shaving) with BESS [37]. Peak shaving is similar to load leveling, and customers can save electricity demand by lowering peak demand and cutting operational costs during peak periods [38]. Fast charging causes a high load on power, which requires expensive grid connections and storage systems that can help cut costs for loading peaks. Fast charging causes immense power load peaks, which require costly grid connections, and storage systems can help cut costs for these power load peaks [39]. Fast charging stations can cause immense power load peaks during the rush time of charging vehicles, mainly when it is at the same time as high peak loads on grids. However, the battery swapping solution makes it possible to manage peak loads and charge a large number of the batteries during the off-peak hours. Therefore, it helps to cut costs related to the power load peaks.

Independency of Service Fee with Time

The battery swapping is based on the fixed charge or service fee or subscription-based model for replacing the charged battery in place of a discharged one from the vehicle [31]. Therefore, individual customers do not have to worry about increasing electricity prices based on time. However, the service provider of BSS can manage the cost of charging with smart technology and aggregate-charging solution during the off-peak hours. They have to pay a fixed amount whenever they need to change their EV battery. However, this fee is not set at every location because of changes in taxes and local electricity rates. Moreover, the customer has to consider charging their vehicle during peak hours due to the added surcharge rates in fast charging. In addition, the per kWh is more cost-effective for those users who highly use their EVs than those customers who rarely use their EVs. Below is the graph of the hike in electricity and gasoline prices in Germany over time.

Potentially No Upgradation of Regular Power Connection (Comparison with Fast Charging)

There is no need for upgradation of the power system for the swapping station. There will be a call for high load transformers for the fast chargers depending upon the charging point output. Since the houses are not designed for high voltage, raising the desired energy will cost significantly. In the swapping method, the charging of batteries does not need fast chargers to charge them. We can charge the batteries with slow chargers, which generally take 7–8 h.
In fast charging, 150 kW and more are emerging for BEVs, drafted for long-distance mobility. Suppose 150 kW and over outputs are made available, requiring a more prominent investment in hardware and grid connection, and new transformers connections will be needed in some instances [32]. High-power chargers can minimize wait time for charging at the household level but are a considerable expense to the customer. Moreover, high-power chargers might not be applicable in rental housing or places where the electricity supply cannot accommodate an increased power demand [40].

Less Customer Involvement (Comparison with Fast Charging)

The main facilities used in BSS are EV battery, battery charger, and the swapping robot [41]. For some older people and those who are less educated, it is difficult for them to plug in and plug out, enter vehicle data to start charging and pay the bill through RFID mode at charging points. In addition, BSS is free from all this. The customer has to go to the station, park their vehicle, and the machines do all work. The diagrams show a man plugging the charger into a vehicle and a robot swapping a battery.

3.5.2. Weakness

Cooling System (Comparison with Fast Charging)

Battery temperature is a deciding factor regarding a battery’s performance and life cycle. Air used as a heat transfer medium is very inefficient compared to liquid cooling, such as flow rate of cooling air, the inhomogeneous temperature distribution within batteries, vehicle cabin temperature, and safety issues generated by the emission of toxic gases from the batteries [42]. However, the cooling system is easy when the number of batteries at the swapping station is less. If the number of batteries is large, maintaining the room temperature will become difficult because the heat produced during charging also warms the surrounding environment and will automatically increase the temperature of the batteries.

High Potential to Provide Services in the Electric Grid with Batteries in Swapping Stations (Comparison with Fast Charging)

How much energy is transferred, and how much electricity is needed to charge the batteries for swap? Distinct charging modes can be implemented, depending upon the BSS size and the voltage level available at the distribution grid [42]. The average yearly electricity consumption of a household in the EU is 3.5 MWh. A single truck charge of 1 MWh would be equivalent to a third of the annual consumption of an average house, around 6% of an average home. The total electricity consumption to charge the long-haul BETs of the European fleet per truck is 1.44 kWh/km. If the number of trucks in the EU is assumed 4.5 million with average annaual mileage of 50,000 km/year, the required energy will be 324 TWh or over 10% of EU generation in 2015 (3000 TWh) [1]. To overcome this surge, we need a large amount of clean energy. Despite power from fossil fuels, we can benefit from being EVs if solar panels and wind turbines are installed to acquire the clean energy required to charge many batteries. Electricity production in Germany from clean energy in 2020 accounted for 56.2% (Renewable Energy is 44.9% and nuclear energy is 11.1%) of gross electricity production. However, the gross energy production decreased compared to the 2018 and 2019 levels [1].
The minimum power required at BSS from the grid supply is calculated by the assumption of zero power loss, which are from different factors such as the voltage, distance of the charge point from the grid, the conversion of AC to DC, heat-dissipating from batteries during charging. Power consumption by various manufacturers varies due to the power output at the charging facility and the battery’s capacity. So, the power required by an example of 100 batteries at BSS is:
Let’s take an example of MAN truck;
Capacity of Battery = 185 kWh
Power output from Charging point = 150 kW
Time = Capacity/Power = 185/150 = 1.2
Electricity required from grid = 185 × 1.2 × 100 = 22,200 kWh
So, to charge 100 batteries at same time, we need minimum power of 22,200 kWh.
For 24 h we can charge 2000 batteries.
Let’s take an another example of Tesla Semi Truck;
Power output from charging port = 1.6 MW = 1600 kW (Claim by Tesla)
Time = 30 min = 0.5 h
Capacity = 1600/0.5 = 3200 kWh (Approx.)
Electricity required from grid (100 batteries)= 3200 × 100 × 0.5 = 160,000 kW
This energy is required for the inventory of batteries at the industrial level. We need minimum power of 160,000 kWh to charge 100 batteries. In 24 hours, we can charge 4800 batteries.

Additional Logistics

The other case might be if the batteries’ charging facility is at a different location due to various reasons such as space and a grid system. Both BCSs and BSSs are connected to a logistics system consisting of a transportation network and considerable truck fleets. The trucks are responsible for transporting batteries among the BCSs and the BSSs. In the BSCS, EVs, BSSs and BCSs can be regarded as customers, retailers, and manufacturers [43].

Initial Investment (Comparison with Fast Charging)

The commencing investment in this method is high. Heavy machinery and infrastructure for battery swapping and battery management system are enormous. Manufacturers will seek the probability of customer appeal and accessibility to customers before investing their substantial money. Additionally, significant batteries are committed to making the Swapping technique successful and would cover all demands, including colossal capital, since the battery alone costs 25–30% of EV value.

3.5.3. Opportunities

Rise in EV Market (Comparison with ICE)

The rise of EVs gives a new business opportunity to set up both battery swapping stations and fast charging points. EV sales boosted by double-digit in 2019 in almost every European country. For example, EV sales in China in 2019 were around 1.2 million units (a 3% increase from 2018), whereas EV sales in the United States slammed by 12%, with only 320,000 units sold. At the same time, EV sales in Europe rose by 44% and reached 590,000 units. After the first quarter of 2020, EV sales showed a downturn from the previous quarter by 57% and 33% in China and the United States, respectively. Moreover, Europe’s EV market increased by 25%. The EV market of Germany and the Netherlands contributed nearly half (around 44%) of the total EV market growth in Europe. Both countries sold about 40,000 units more compared in 2018. the growth rate in 2018 was 55% and 144% for Germany and the Netherlands, respectively [44].

Subsidies by Government (Comparison with ICE)

Subsidy by the government acts as an opportunity since it will decrease EV costs. As EV trucks are in the evolving ages, they are a bit costly compared to diesel vehicles. So to engage the consumers, several governments are pushing them with different policies and giving subsidies directly to the manufacturers to put less burden on buyers during buying. China is giving 50,000 Yuan per vehicle. In March 2020, China announced that the subsidy scheme would remain until 2022 [45]. There are copious incentives for buying an EV in Germany such as free parking, reserved parking lot, bus lane use, and tax exemption. For the above purchase of 40,000 Euros, a total of 9000 Euros subsidy is granted by the federal government [46].

Environmental Concerns (Comparison with ICE)

Trucks account for less than 2% of the vehicles on the road but 22% of CO2 emissions from road transport [7]. Road transport represents 17.8% of total emissions arising from vehicles. Combined heavy-duty vehicles in Europe account for 5% of Europe’s GHG emissions, while they carry 75% of all land-based freight [47]. Transport accounts for 32% of total emissions. HDVs are responsible for approximately 25% of the CO2 emissions from road transportation. Due to growing freight demand and stagnating HDVs’ fuel efficiency, they will increase to 10% by 2030 [48]. Germany’s emissions reduction in 2019 was the country’s most significant annual decline since 1990. Compared to then, Germany has already reduced its emissions by 35.7% [49]. However, whether the primary electricity generation resource is renewable energy or fossil energy resources should be considered. Since if the electricity generation is mainly based on non-renewable, then BETs are indirect producers of significant CO2 emissions. In the same situation, e-micro mobilities such as scooters become new CO2 emission producers in cities [50].

Improvement in Technology (Comparison with ICE)

Advancement in EV technology gears up the sales globally and makes the cost cutting and economically feasible for EV buyers. As a result, BETs have become viable, zero-tailpipe emission alternatives to diesel-fuelled trucks in recent years. As a result, a growing number of models of EVs will hit the market, accompanied by technical specifications, such as range, air drag coefficient, and prices. These data enable comparison between diesel trucks on the roads and compare BETs and diesel trucks from the technical and economic viewpoint [1].

Adequate Trip Distance

Maree et al. found that 69% of truck trips in Germany were shorter than 350 km. In the EU, almost half (47%) of road freight kilometers are trips of less than 300 km and represent 90% of the transport operations. BETs manufacturers such as Volvo claimed a range of 300 km, and Meyer and Meyer logistics trucks range up to 300 km, extending up to 500 km. We can see that EV trucks can cover most of the trips without charging the battery with this range. Therefore, the advancement in battery truck technology made long trips with one charge feasible. So, it is an opportunity for the e-trucks market compared to ICE, which also promises market growth for both battery swapping and fast charging.

Decline in EV’s Price

Over the past decade, we have seen an upward trend in using EVs as commercial-duty vehicles. In addition, to make it successful, the different battery manufacturers, automotive companies, and research institutions are working together to enhance EVs’ technology to make it more feasible and cost-effective. According to the ‘price survey’ report of BloombergNEF, the average price per kilowatt-hour of a lithium-ion battery dipped to $137 (13%) from $157 in 2019. A decade ago, these batteries sold for more than $1100 per kilowatt-hour. The threshold for price parity with gasoline engines, according to BNEF, is around $100/kWh. In the report, BNEF analysts said they expect battery makers to hit $101/kWh in 2023 [51] (see Figure 7).

Installed on Designated Routes (Comparison with Fast Charging)

Most heavy-duty trucks or long-haul trucks carrying utilities ride on a designated or same route. Therefore, planning and developing infrastructure for battery swapping stations is not difficult since we already have a defined pathway to travel. Furthermore, for fast charging points, customers have to plan the duration of charging in their journey before the start and ensure that the route they plan to ride has an available charging station, and they should reserve and book it before. Therefore, the advanced travel information systems (ATIS) applied for trip planning and routing and have a high potential to change mobility behaviors [53] should also provide booking services special the fast charging stations for BETs.

Move Ownership to Station Operator

That relieves Capex and responsibility for batteries from logistics companies and could be very attractive to logistics companies that might not be willing to bother with this new technology.

Total Cost of Ownership

In the 2030 time frame, excluding infrastructure costs, overhead catenary electric heavy-duty vehicles would have a total cost of ownership of approximately 26% less than diesel vehicles. Likewise, hydrogen fuel-cell vehicles are estimated to have a 22% lower total cost of ownership than diesel vehicles [48].

3.5.4. Threats

Standardisation of EV Batteries

Standardization of batteries appears to be very unlikely and is primarily the competitive edge for EVs; the OEMs are closely aligned with their underlying proprietary battery technology. Furthermore, the battery pack is a core part of the EV’s strength, stability, and safety at design time, making it numerous difficulties for OEMs to share a similar battery architecture across the market. Hence there is no standard procedure or policies that bind the manufacturers to produce one battery that fits all EVs. Moreover, the machinery cannot be calibrated at the stations whenever it faces a change in the EV brand. Transport and energy stress the need for a single dynamic charging system standard set by EU authorities by 2023 [7].

Swapping Demand

The success of the battery swapping model is dependent on demand. Huge capital is involved in setting the model, so manufacturers, station owners, and stakeholders struggle to make the break-even point at the earliest. On the contrary, the demand is proportional to the EV sales in the region. Marketing plays a crucial role in accumulating the customers towards the station.

Space Availability

Space for construction of the swapping infrastructure is limited inside the city or city centers. The reason is space occupied by heavy machines, storage of many batteries, heavy trucks, or logistics trucks waiting in the queue. Moreover, if a car has very little charging and cannot drive until the swapping station, the vehicle needs to be charged somewhere in the city.

Competition with Fast Charging Solutions

The swapping method will face a one-to-one trade-off with charging batteries at charge points. Most customers might raise concerns about battery health, battery ownership, mileage, and safety issues associated with the replaced battery; these are keynotes where the swap solution might be left behind. In addition, the fast-charging network’s ongoing developing infrastructure is vast compared to the swapping network.

4. Conclusions

This paper highlights the different aspects of the heavy-duty electric trucks, including stakeholder aspects, the total cost of ownership (TCO), CO2 lifecycle assessment, and SWOT analysis on battery swapping and fast charging methods.
Regarding the customer and stakeholder analysis, the performance range of trucks per one charge and charging time are critical factors in the market adaptation. The performance range of the battery-electric trucks had significantly improved since 2010, when lithium-ion battery prices came down shapely, which made its application feasible for heavy-duty trucks.
The different methods and assumptions of the TCO calculation are reviewed and compared between battery-electric trucks and other technologies such as diesel. The TCO calculation depends on the market growth factors, government policies regarding the taxes and toll charges, employee rights, the diesel price, electricity price, and zero-emission freight strategies for cities and their infrastructure.
The CO2 lifecycle analysis of the electric trucks was reviewed and compared with diesel trucks. The CO2 lifecycle analysis includes WTT (well-to-tank) and TTW (tank-to-wheel). Although the TTW of BETs is zero, the CO2 produced in the WTT phase for BETs is greater than ICE trucks. Therefore, this finding emphasizes the necessity of reduction in the WTT phase, which includes GHG emissions released into the atmosphere from the production, processing, and distribution of electricity in the network for BETs. Moreover, the emissions in manufacturing batteries and all components are considerable and significant.
Moreover, a SWOT analysis was conducted to give an insight into the charging methods and compare the battery swapping technology and fast charging. Charging time is essential for adopting the e-truck, as waiting time can disrupt the supply chain operation. The time taken by the swapping method in replacing the depleted battery with a fully charged one is much less than the charging of EVs with fast chargers. Moreover, the standardization of the batteries is the biggest challenge for OEMs and service providers. There should be a consensus on battery production and vehicle manufacturing policies.

Author Contributions

Conceptualization, H.M. and S.B.; methodology, H.M. and S.B.; formal analysis, S.B. and H.M.; data curation, S.B.; writing—original draft preparation, S.B.; writing—review and editing, S.B. and H.M.; visualization, S.B. supervision, H.M. All authors have read and agreed to the published version of the manuscript.

Funding

This research received no external funding, and the APC was funded by Technical University of Berlin.

Institutional Review Board Statement

Not applicable.

Informed Consent Statement

Not applicable.

Data Availability Statement

Not applicable.

Acknowledgments

We acknowledge support by the German Research Foundation and the Open Access Publication Fund of Technical University of Berlin.

Conflicts of Interest

The authors declare no conflict of interest.

References

  1. Thomas, E.; Lucien, M.; Stef, C.; Samuel, K.; Carlos Calvo, A.; James, N. Analysis of long haul battery electric trucks in EU. In Proceedings of the 8th Commercial Vehicle Workshop, Graz, Austria, 17–18 May 2018; p. 15. [Google Scholar]
  2. U.S Department of Energy. Alternative Fuels Data Center: Maps and Data—Vehicle Weight Classes & Categories. Available online: https://afdc.energy.gov/data/ (accessed on 18 July 2021).
  3. Carlo, C.; Mahn Kien, T.; Youngwoo, L.; Shinghei, K.; Vincent, L.; Michael, F. A Review of Heavy-Duty Vehicle Powertrain Technologies: Diesel Engine Vehicles, Battery Electric Vehicles, and Hydrogen Fuel Cell Electric Vehicles. Clean Technol. 2021, 3, 474–489. [Google Scholar] [CrossRef]
  4. European Automobile Manufacturers Association. Reducing CO2 Emissions from Heavy-Duty Vehicles. p. 6. Available online: https://reducingco2together.eu/assets/pdf/trucks.pdf (accessed on 1 August 2021).
  5. European Commision. EU Emissions Trading System (EU ETS). Climate Action. 23 November 2016. Available online: https://ec.europa.eu/clima/policies/ets_en (accessed on 16 June 2021).
  6. Lucien, M. Transport & Environment. Roadmap for Electric Truck Charging. 19 February 2020. Available online: https://www.transportenvironment.org/publications/roadmap-electric-truck-charging (accessed on 17 June 2021).
  7. Lucien, M. Transport and Environment. Recharge EU Trucks—Time to Act. Available online: https://www.transportenvironment.org/sites/te/files/publications/2020_02_RechargeEU_trucks_paper.pdf (accessed on 17 June 2021).
  8. BloombergNEF. Battery Pack Prices Cited Below $100/kWh for the First Time in 2020, While Market Average Sits at $137/kWh. 16 December 2020. Available online: https://about.bnef.com/blog/battery-pack-prices-cited-below-100-kwh-for-the-first-time-in-2020-while-market-average-sits-at-137-kwh/ (accessed on 3 March 2022).
  9. Chinaspv. Foton IBLUE Trucks Take Only Three Minutes to Complete Battery Swapping. 19 August 2020. Available online: http://m.chinaspv.com/news/3701.html (accessed on 15 December 2021).
  10. Panday, A. To put electric mobility in fast lane, firms push for swappable batteries. Mint. 27 June 2019. Available online: https://www.livemint.com/auto-news/to-put-electric-mobility-in-fast-lane-firms-push-for-swappable-batteries-1561655633564.html (accessed on 16 June 2021).
  11. Phenix Contact. Battery Swapping for Electric Buses in Qingdao. Available online: https://www.phoenixcontact.com/assets/downloads_ed/local_gb/web_dwl_promotion/5733e.pdf (accessed on 16 June 2021).
  12. Diwan, P. Midium: Is Battery Swapping a Viable Option for Public Transportation EVs. Medium. Available online: https://pdiwan.medium.com/is-battery-swapping-a-viable-option-for-public-transportation-evs-adb4ced74ff2 (accessed on 16 June 2021).
  13. Qayyah, M. Business Insider: Electric Trucks Like the Tesla Semi are Pointless Both Economically and Ecologically According to a Vehicle-Tech Expert. Available online: https://www.businessinsider.com/this-expert-says-tesla-semi-is-economically-and-ecologically-pointless-2019-2 (accessed on 15 December 2021).
  14. MAN Germany. Fully Electric, Whisper-Quiet, and Highly Efficient: MAN eTGM. Available online: https://www.man.eu/de/en/truck/all-models/the-man-etgm/etgm.html (accessed on 16 June 2021).
  15. Freightliner Trucks. e-Cascadia—Specifications. Available online: https://freightliner.com/trucks/ecascadia/specifications/ (accessed on 16 June 2021).
  16. Freightliner Trucks. eM2—Specifications. Available online: https://freightliner.com/trucks/em2/specifications/ (accessed on 16 June 2021).
  17. Mercedes-Benz. eMobilität: The eActros and Its Services. Available online: https://www.mercedes-benz-trucks.com/content/mbo/markets/de_DE/emobility/world/our-offer/eactros-and-services.html (accessed on 10 December 2021).
  18. Volvo Trucks Global. Volvo FL Electric. Available online: https://www.volvotrucks.com/en-en/trucks/trucks/volvo-fl/volvo-fl-electric.html (accessed on 10 December 2021).
  19. Volvo Trucks Global. Volvo FE Electric. Available online: https://www.volvotrucks.com/en-en/trucks/trucks/volvo-fe/volvo-fe-electric.html (accessed on 10 December 2021).
  20. The International Council on Clean Transportation. BYD EV Sedema—BYD EV Vehicles. Available online: https://theicct.org/sites/default/files/BYD%20EV%20SEDEMA.pdf (accessed on 16 June 2021).
  21. Inmod. Inmod-Bus—Electric Mobility in the Countryside. 28 February 2015. Available online: https://web.archive.org/web/20150228104552/http:/www.inmod.de/de/technologie/inmod_bus (accessed on 15 December 2021).
  22. Smith Eectric Trucks. The Newton—Electric Truck. Available online: https://web.archive.org/web/20140517121955/http://www.smithelectric.com/wp-content/themes/barebones/pdfs/SmithNewtonUS_SpecSheet_2011.pdf (accessed on 14 June 2021).
  23. Ebusco. 101Media. Electric Buses. Available online: https://www.ebusco.com/electric-buses/ (accessed on 16 June 2021).
  24. Motionist. Swapping the Battery in Electric Vehicles Cuts Long Charging Times. 13 July 2020. Available online: https://motionist.com/en/quick-battery-swap-rather-than-long-charging-frustration/ (accessed on 16 June 2021).
  25. Nikola Motor Company. Nikola Tre—BEV. Available online: https://nikolamotor.com/tre-bev (accessed on 16 June 2021).
  26. Manthey, N. Daimler Reveals Electric Truck Eactros to Press. 21 February 2018. Available online: https://www.electrive.com/2018/02/21/daimler-reveals-electric-truck-eactros-press/ (accessed on 16 June 2021).
  27. Turpen, A. Teslarati, Tesla Semi Truck’s Battery Pack and Overall Weight Explored. 24 February 2018. Available online: https://www.teslarati.com/how-much-tesla-semi-truck-battery-pack-weigh/ (accessed on 10 December 2021).
  28. Tesla Trucks. Tesla Semi. Available online: https://www.tesla.com/semi (accessed on 13 December 2021).
  29. Meszler, D.; Delgado, O.; Yang, L. International Council on Clean Transportation. Heavy-Duty Vehicles. Available online: https://theicct.org/heavy-duty-vehicles (accessed on 18 July 2021).
  30. Global Green Freight. Climate and Clean Air Coalition—National. Available online: http://www.globalgreenfreight.org/stakeholders/government/national (accessed on 18 July 2021).
  31. Global EV Battery Swapping Market is Driven by Low Penetration of DC Fast Charging Station and Remunerative Prospects for Shared E-Mobility Services: P&S Intelligence. GlobeNewswire News Room. 19 March 2020. Available online: https://www.globenewswire.com/news-release/2020/03/19/2003424/0/en/Global-EV-Battery-Swapping-Market-is-Driven-by-Low-Penetration-of-DC-Fast-Charging-Station-and-Remunerative-Prospects-for-Shared-E-Mobility-Services-P-S-Intelligence.html (accessed on 16 June 2021).
  32. National Platform Electric Mobility. Charging Infrastructure for Electric Vehicles in Germany—Progress Report and Recommendations 2015. November 2015. Available online: https://leonardo-energy.pl/wp-content/uploads/2016/11/Technical-prediction_en_Document_3_Charging-Infrastructure-for-Electric-Vehicles.pdf (accessed on 17 June 2021).
  33. Nicholas, M.; Hall, D. Lessons Learned on Early Electric Vehicle Fast-Charging Deployments, The International Council on Clean Transportation. p. 54. Available online: https://theicct.org/publication/lessons-learned-on-early-electric-vehicle-fast-charging-deployments/ (accessed on 17 June 2021).
  34. Meszler, D. The International Council on Clean Transportation, European Heavy Duty Vehicles: Cost-Effectiveness of Fuel-efficiency Technologies for Long-Haul Tractor-Trailers in the 2025–2030 Timeframe. p. 82. Available online: https://theicct.org/sites/default/files/publications/ICCT_EU-HDV-tech-2025-30_20180116.pdf (accessed on 17 June 2021).
  35. Moultak, M.; Lutsey, N.; Hall, D. Transitioning to Zero-Emission Heavy-Duty Freight Vehicles. p. 59. Available online: https://theicct.org/publication/transitioning-to-zero-emission-heavy-duty-freight-vehicles/ (accessed on 11 March 2022).
  36. Volkswagen. T Is for Tank-to-Wheel (TTW). Available online: https://www.volkswagenag.com/en/group/the-a-to-z-of-e-mobility/t-is-for-tank-to-wheel.html (accessed on 1 August 2021).
  37. European Environment Agency. Overview of Electricity Production and Use in Europe. Available online: https://www.eea.europa.eu/data-and-maps/indicators/overview-of-the-electricity-production-2/assessment (accessed on 6 July 2021).
  38. Fraunhofer Energy Alliance. Peak Shaving with Battery Energy Storage Systems (BESS). Available online: https://www.energie.fraunhofer.de/en/events-trade-fairs/allianz-energy-storage_2019/peak-shaving-with-battery-energy-storage-systems-a8.html (accessed on 16 June 2021).
  39. Hitachi Energy. Grid Edge Solutions. Available online: https://www.hitachienergy.com/cn/zh_cn/offering/solutions/grid-edge-solutions (accessed on 10 December 2021).
  40. Tesvolt GmbH. Peak Shaving with Electric Vehicle Charging Stations. Available online: https://www.tesvolt.com/en/projects/peak-shaving-with-electric-vehicle-charging-stations.html (accessed on 16 June 2021).
  41. Sarker, M.; Pandžić, H.; Ortega-Vazquez, M. Electric vehicle battery swapping station: Business case and optimization model. In Proceedings of the 2013 International Conference on Connected Vehicles and Expo (ICCVE), Las Vegas, NV, USA, 2–6 December 2013; pp. 289–294. [Google Scholar] [CrossRef] [Green Version]
  42. Adegbohun, F.; Jouanne, A.; Lee, K. Autonomous Battery Swapping System and Methodologies of Electric Vehicles. Energies 2019, 12, 667. [Google Scholar] [CrossRef] [Green Version]
  43. Liu, X.; Zhao, T.; Yao, S.; Soh, C.B.; Wang, P. Distributed Operation Management of Battery Swapping-Charging Systems. IEEE Trans. Smart Grid 2019, 10, 5320–5333. [Google Scholar] [CrossRef]
  44. Schaufuss, P.; Schenk, S.; Hertzke, P. McKinsey & Company, McKinsey Electric Vehicle Index: EV Market Trends & Sales. 17 July 2020. Available online: https://www.mckinsey.com/industries/automotive-and-assembly/our-insights/mckinsey-electric-vehicle-index-europe-cushions-a-global-plunge-in-ev-sales (accessed on 10 December 2021).
  45. Transport Oversize, Germany. Available online: http://www.transportoversize.eu/en/do_i_need_a_transport_permit/germany/ (accessed on 16 June 2021).
  46. Randall, C. Electrive. Germany Doubles EV Subsidies, No More Diesel Support. 4 June 2020. Available online: https://www.electrive.com/2020/06/04/germany-doubles-ev-subsidies-no-more-diesel-support/ (accessed on 17 June 2021).
  47. Website of the Federal Government. Effectively Reducing CO2 Emissions. 22 September 2020. Available online: https://www.bundesregierung.de/breg-en/issues/climate-action/effectively-reducing-co2-1795850 (accessed on 17 June 2021).
  48. Rodriguez, F.; Delgado, O. International Council on Clean Transportation, CO2 Emissions and Fuel Consumption Standards for Heavy-Duty Vehicles in the European Union. May 2018, p. 15. Available online: https://theicct.org/publication/co2-emissions-and-fuel-consumption-standards-for-heavy-duty-vehicles-in-the-european-union/ (accessed on 17 June 2021).
  49. Gonzalez, J. Deutsche Welle, Climate Change: Germany Cuts Carbon Emissions by 6.3% in 2019. 16 March 2020. Available online: https://www.dw.com/en/climate-change-germany-cuts-carbon-emissions-by-63-in-2019/a-52791753 (accessed on 17 June 2021).
  50. Şengül, B.; Mostofi, H. Impacts of E-Micromobility on the Sustainability of Urban Transportation—A Systematic Review. Appl. Sci. 2021, 11, 5851. [Google Scholar] [CrossRef]
  51. Bloomberg, Batteries for Electric Cars Speed Toward a Tipping Point. Available online: https://www.bloomberg.com/news/articles/2020-12-16/electric-cars-are-about-to-be-as-cheap-as-gas-powered-models (accessed on 17 June 2021).
  52. Statista. Worldwide—Lithiumion Battery Pack Costs. Available online: https://www.statista.com/statistics/883118/global-lithium-ion-battery-pack-costs/ (accessed on 11 December 2021).
  53. Mostofi, H. The Association between ICT-Based Mobility Services and Sustainable Mobility Behaviors of New Yorkers. Energies 2021, 14, 3064. [Google Scholar] [CrossRef]
Figure 1. Systematic Review Scheme.
Futuretransp 02 00021 g001
Figure 2. Total cost of ownership (5 years) analysis of diesel ICE long haul trucks and BET.
Futuretransp 02 00021 g002
Figure 3. Well-to-wheel CO2 emissions of diesel and battery long-haul electric trucks [1].
Futuretransp 02 00021 g003
Figure 4. Lifecycle CO2 emissions over vehicle lifetime by vehicle technology type [35].
Futuretransp 02 00021 g004
Figure 5. Fast-Charging time by different service providers (in minutes).
Futuretransp 02 00021 g005
Figure 6. Battery Swapping time by different service providers (in minutes).
Futuretransp 02 00021 g006
Figure 7. Lithium-ion battery pack costs globally between 2011 and 2020 ($U.S. per kWh) [52].
Futuretransp 02 00021 g007
Table 1. The assumption made by T&E on different fuel technologies for TCO calculation.
DescriptionRatesUnitNote
Wage€50,000€/yearThe personnel wages for the driver
Tesla Truck cost€170,000Assuming the price is €170,000 at today’s exchange rate and assembly in Tesla’s Dutch-based plant, avoiding the EU’s 22% import tariff 1.
Battery cost€150€/kWh
BYD truck cost€110,000No information about the BYD, €110,000 has been assumed.
Maintenance cost Maintenance and repair costs equate to €12,500 per year for the ICE and half of that for the BET because of the simpler drivetrain, less wear and tear on the brakes
Diesel€12,500€/year
BET€6250€/year
Avg. annual haulage150,000km
EU average Electricity price€0.12ct/kWhWhen assessing costs, consider both the EU industry average and supercharging option. The cost of electricity will make or break the cost competitiveness of BETs in the EU.
Supercharging rates€0.06ct/kWhTesla promising (US customers at least)
Road charges The infrastructure access cost—road charging (Eurovignette legislation)
Diesel€0.18€/Km
BET€0.09€/Km
1 Commission Implementing Regulation (EU) 2015/1754 of 6 October 2015, amending Annex I to Council Regulation (EEC) No 2658/87 on the tariff and statistical nomenclature and the Common Customs Tariff, OJ L 285, 30.10.2015.
Table 2. The assumption made by ICCT on different fuel technologies for TCO calculation.
DescriptionRatesUnitNote
Capital Cost Truck price
Diesel300,000$
Fuel cell (renewable)375,000$
Electric (overhead)300,000$
Maintenance Cost
Diesel0.12$/kmThe maintenance and repair costs are assumed to be $0.12 per km for diesel by ICCT.
Fuel cell (renewable)75,000$
Electric (overhead)75,000$Catenary wires are estimated to cost between $0.8 million and $3.8 million per KM, with annual operation and maintenance costs of 1–2.5% of the initial capital cost of the catenary and energy infrastructure.
Fuel Cost
Diesel400,000$
Fuel cell (renewable)200,000$
Electric (overhead)230,000$
Table 3. The assumption made by UCLA on different fuel technologies for TCO calculation.
DescriptionRatesUnitNote
Battery pack cost (in 2020)$135/kWh$/kWh2030 Price $60
Cost of Truck $85,000$Without Battery and Drivetrain
Electricity price$0.13/kWh$/kWhDerived from Phadke et al., 2019
Charging rates$0.03/kWh$/kWhDerived from Phadke et al., 2019
Diesel price$3.30/gallon$/gallonResult of VDM; validated by industry numbers
Maintenance cost$12,000–30,000/year$/yearFor Diesel
Maintenance cost$6500/year$/yearEstimated based on Cannon (2016) (For Electric)
BET’s Fuel efficiency of 2.1kWh/mile
Fuel efficiency of diesel truck5.9miles/gallon(Alternative Fuels Data Center, 2020)
General operation cost$0.76/mile or 1.22 km$/kmSuch as driver wages, insurance, tire replacements, permits, and tolls are identical for diesel and EVs and ignore the difference in end-of-life value.
Traveling time, a year260DaysAssuming an average daily driving distance of 300 miles for a 375-mile range truck and 400-miles for a 500-mile range truck to achieve an average daily depth of discharge of battery of 80% and 260 days of driving for any truck.
Table 4. GHG emissions from EU trucks for baseline, fuel cell vehicle intensive, and electric vehicle intensive scenarios for 2050, with associated changes in emissions [35].
ScenarioEmissions by Year (Million-Ton CO2e)Change in Emissions
2005201520502015 to 2030From 2050 Base Case
Base Case275280386
Increased efficiency275280230−18%40%
Fuel cell incentive275280145−48%63%
Electric efficiency275280115−59%−70%
Table 5. SWOT analysis.
S
Strength
W
Weakness
O
Opportunities
T
Threats
  • Time-saving
  • Efficient solution for Load Management
  • Independency of service fee with time
  • Potentially no upgradation of regular power connection
  • Less customer involvement
  • Cooling System
  • High potential to provide services in the electric grid with batteries in swapping stations
  • Additional logistics
  • Initial investment
  • Rise in EVs market
  • Subsidies by government
  • Environmental concerns
  • Improvement in technology
  • Adequate trip distance
  • Decline in EV’s price
  • Installed on designated routes
  • Move ownership to the station operator
  • Total cost of Ownership
  • Standardisation of Batteries
  • Swapping demand
  • Space availability
  • High competition with fast charging solutions
Publisher’s Note: MDPI stays neutral with regard to jurisdictional claims in published maps and institutional affiliations.

