
Key Elements of Mobility Apps for Improving Urban Travel Patterns: A Literature Review


Abstract
:1. Introduction
2. Methodology
2.1. Databases and Exclusion/Inclusion Criteria
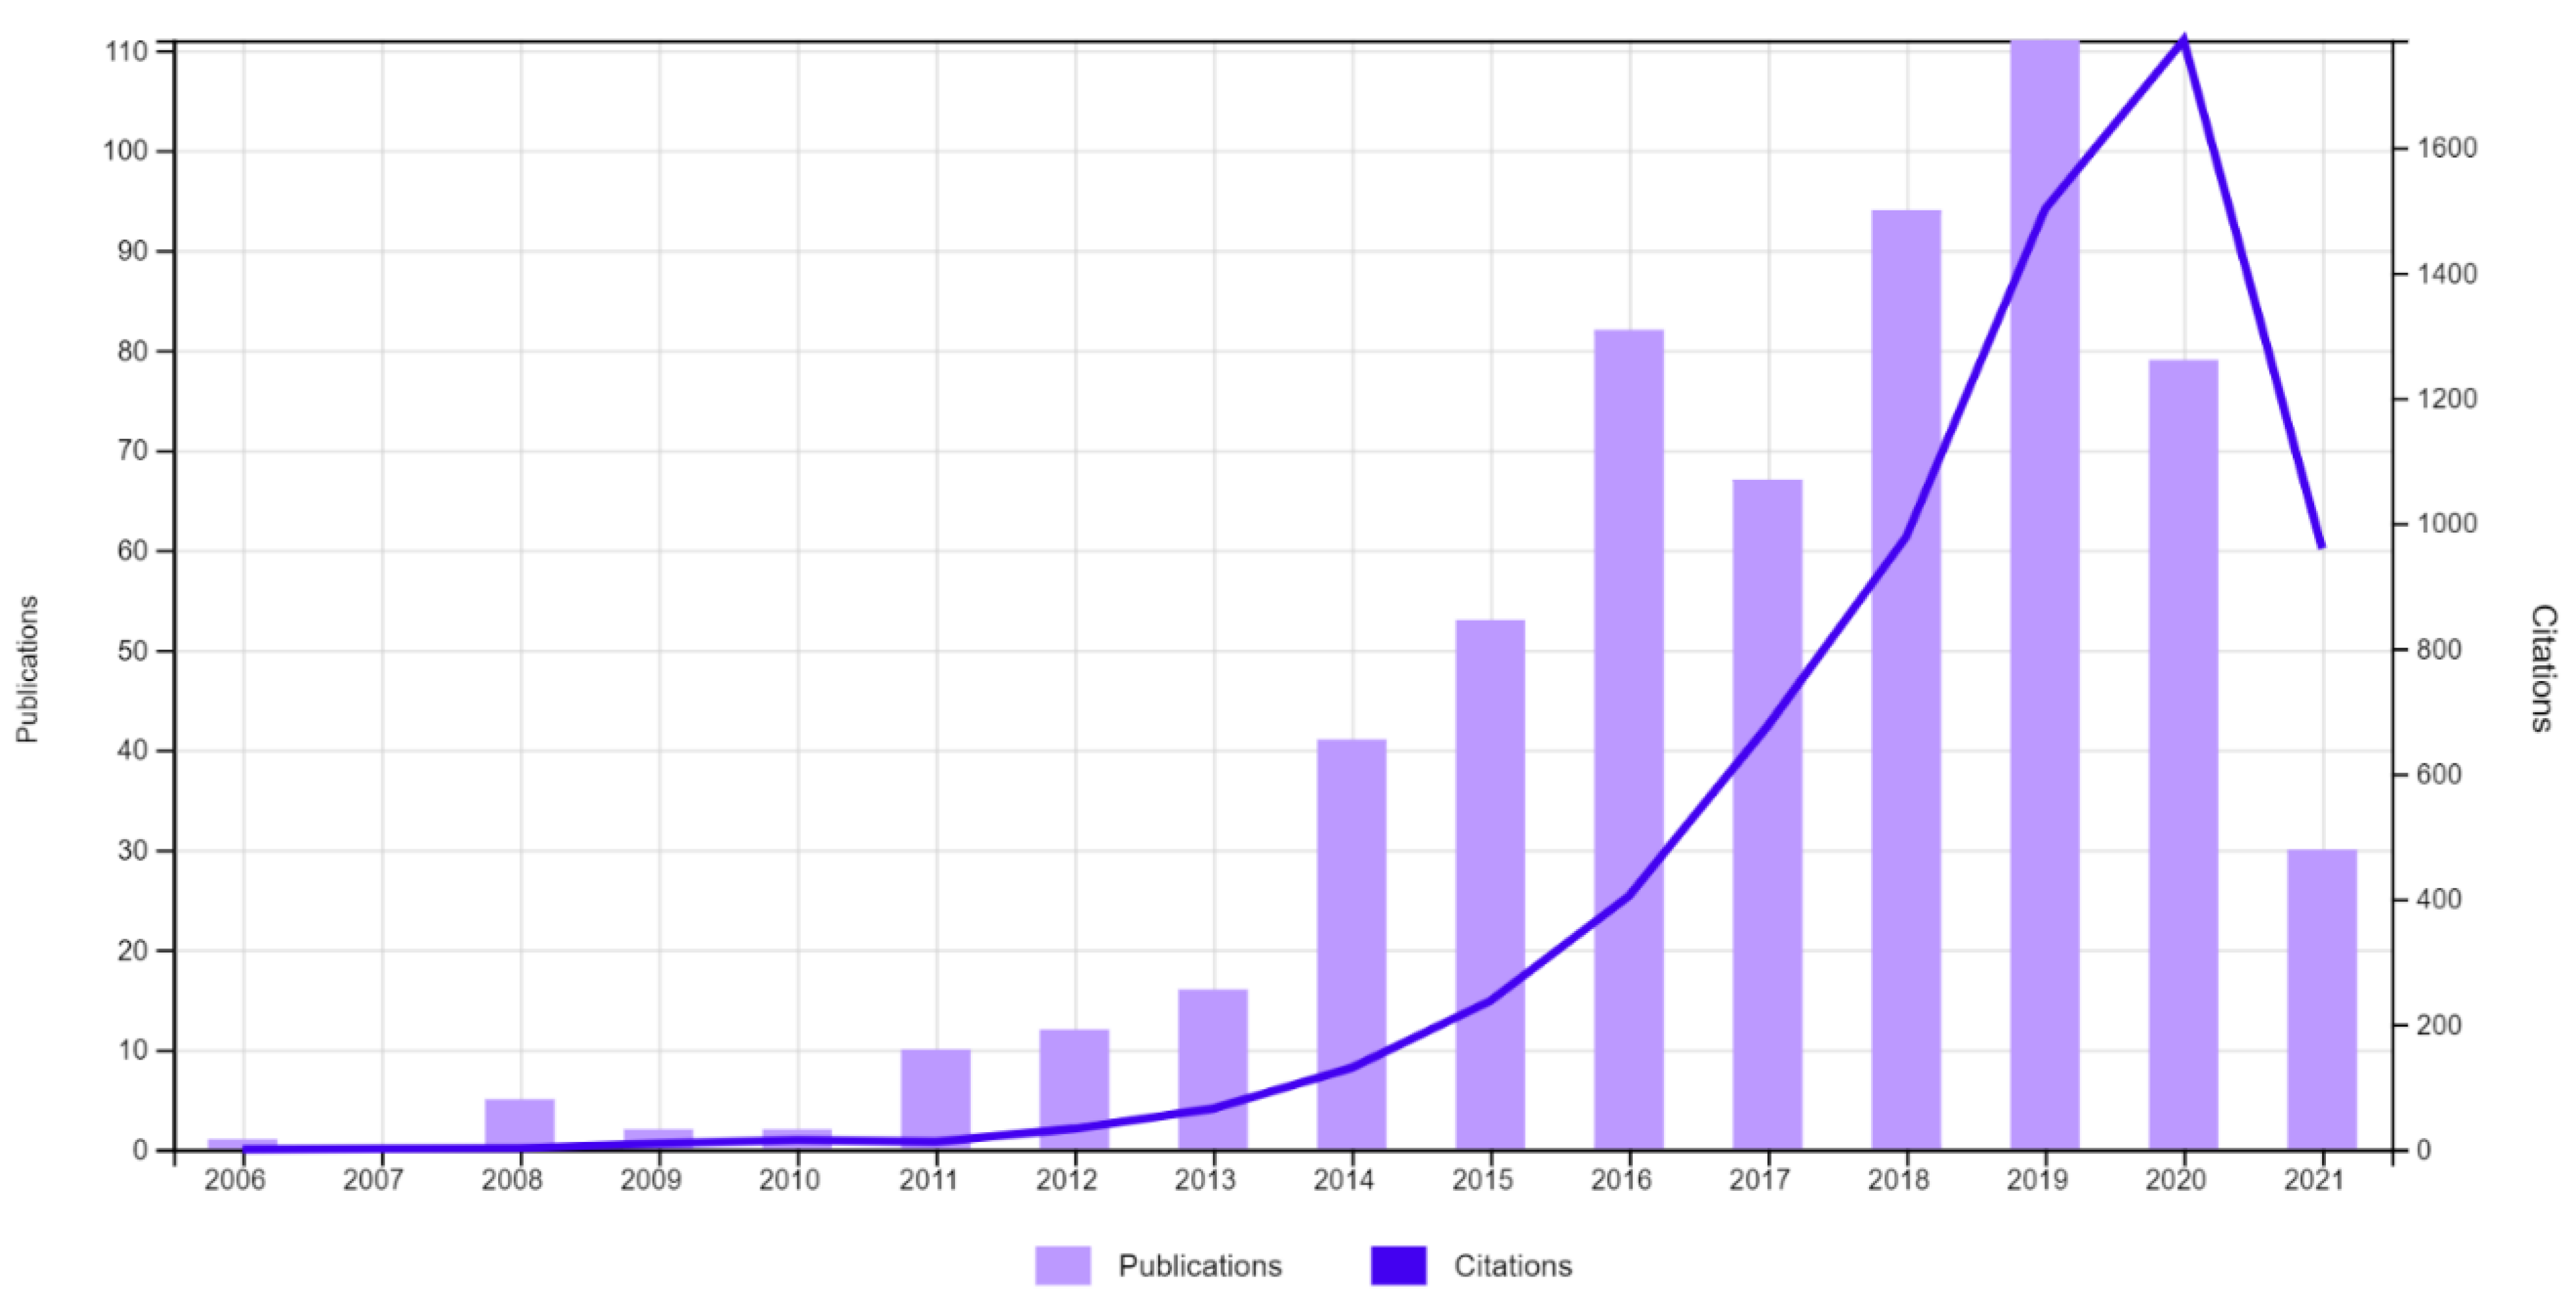
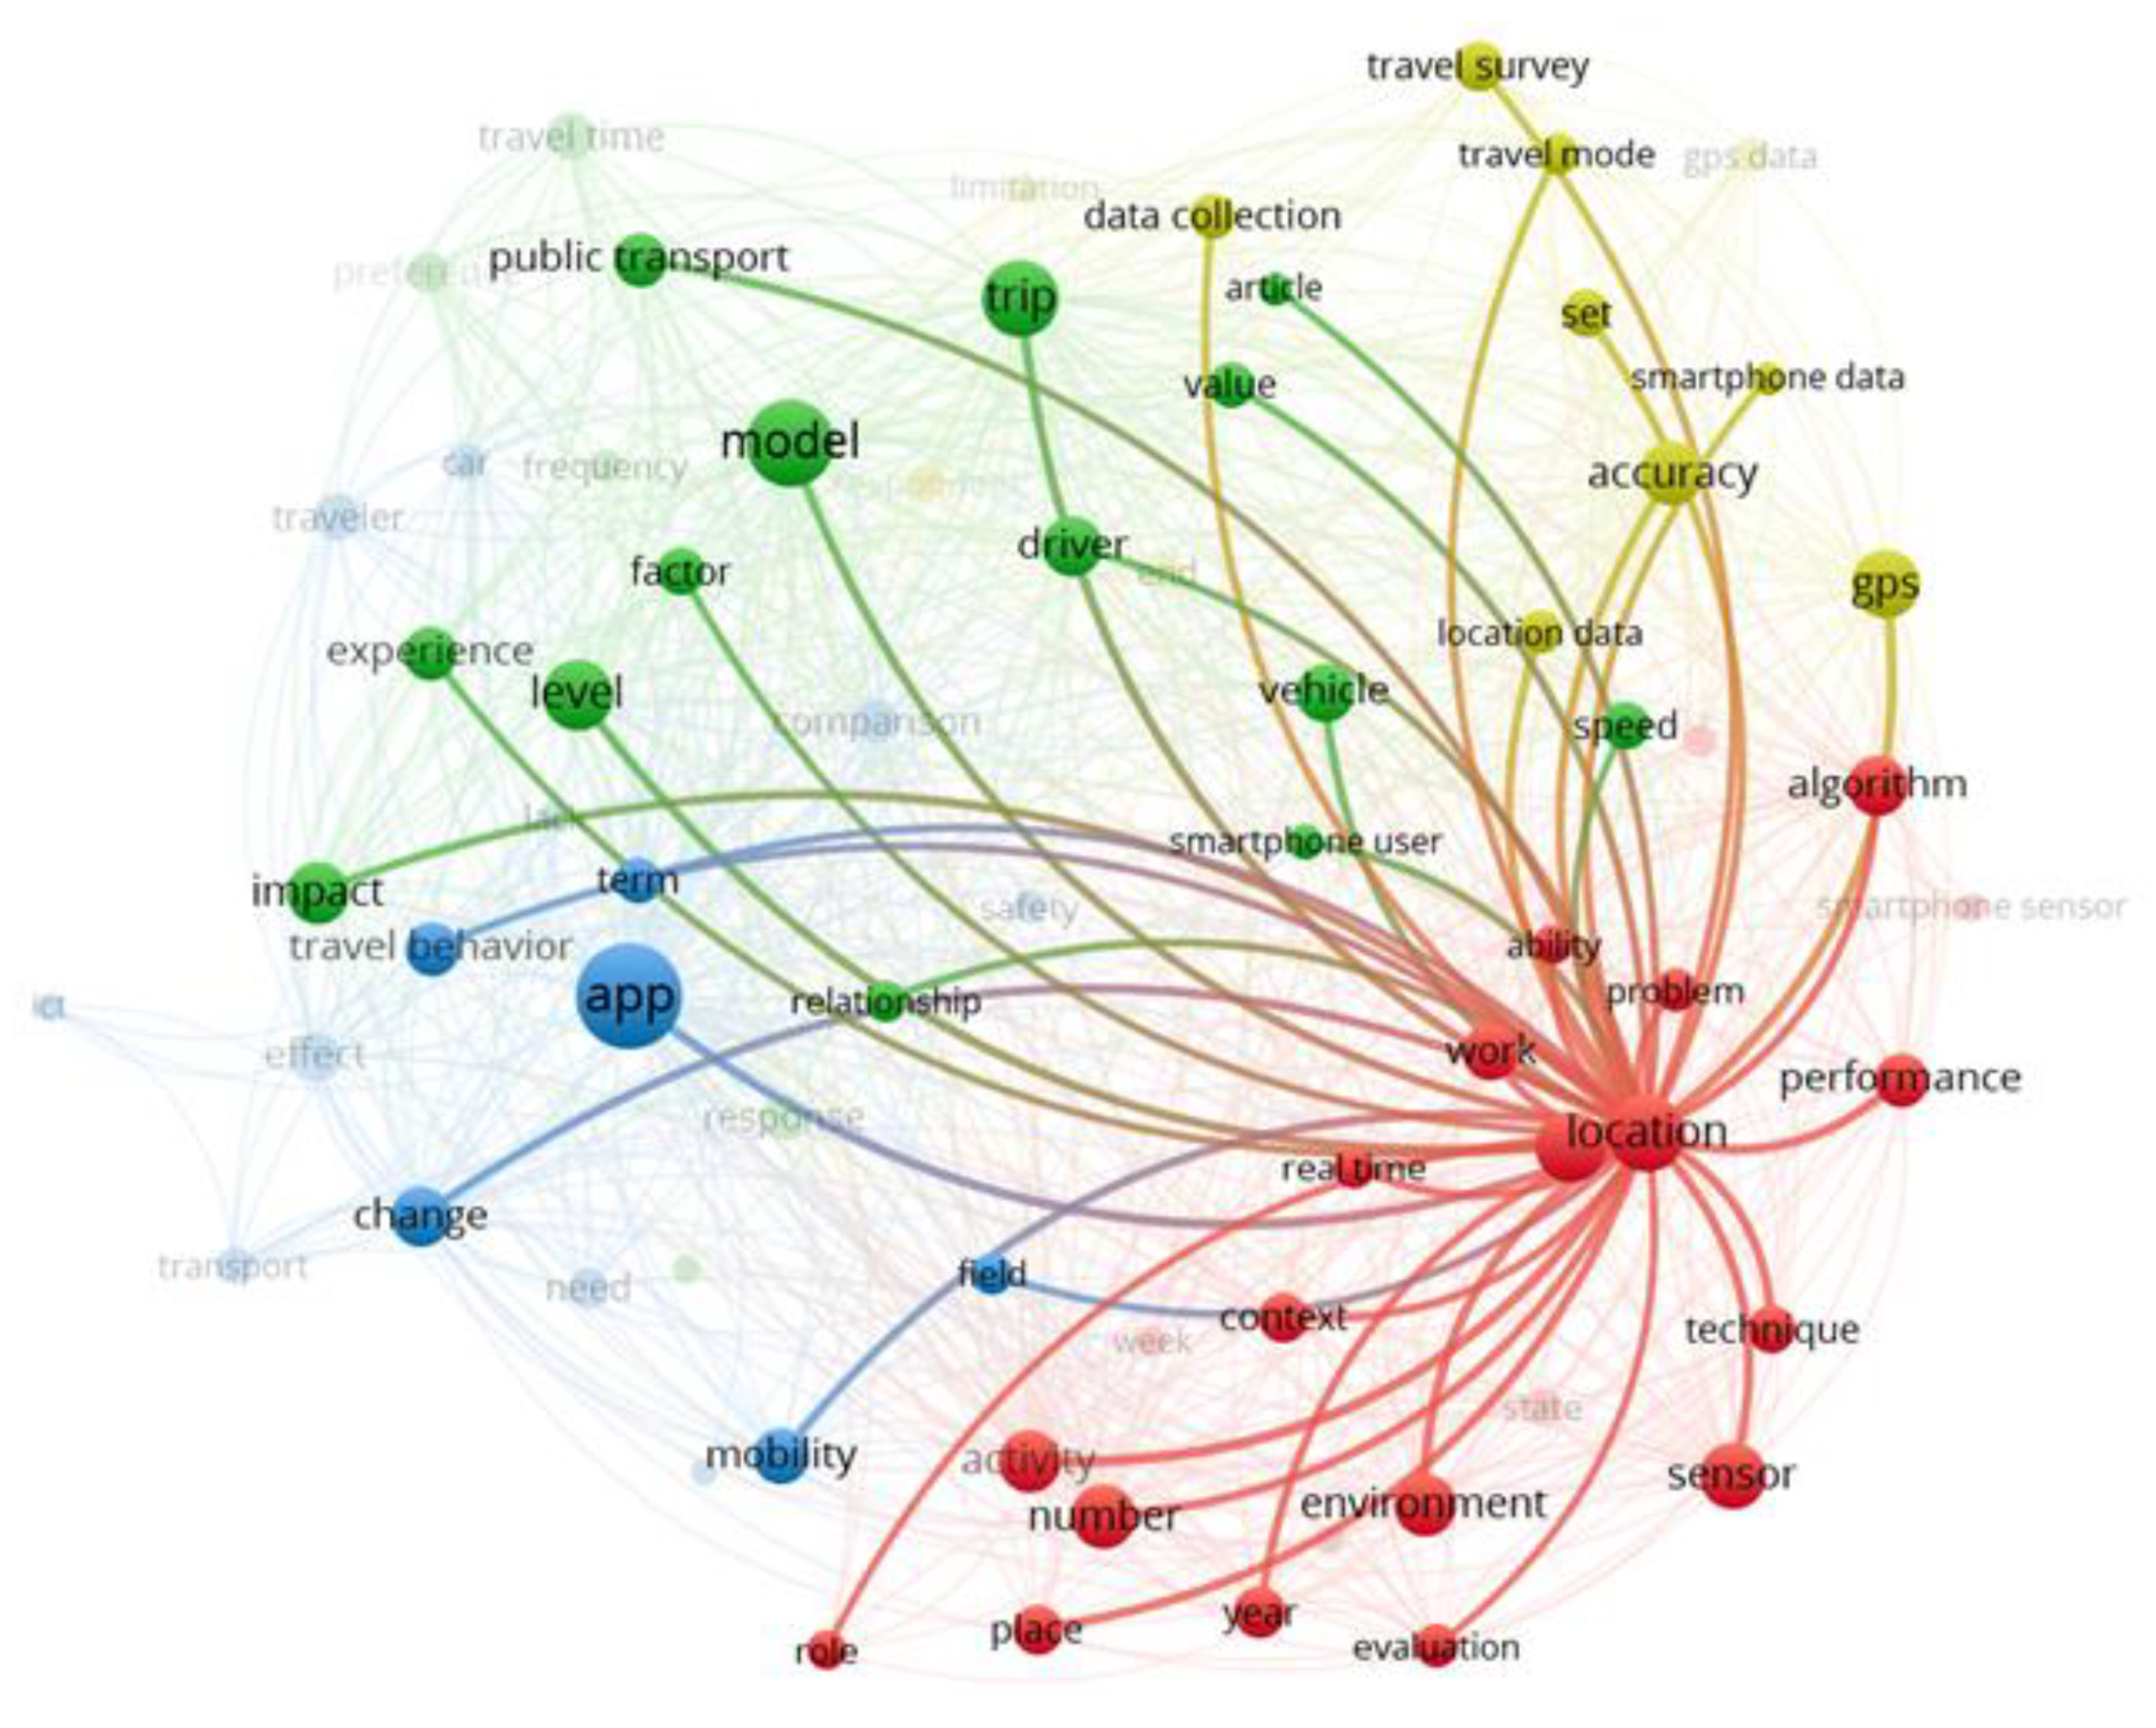
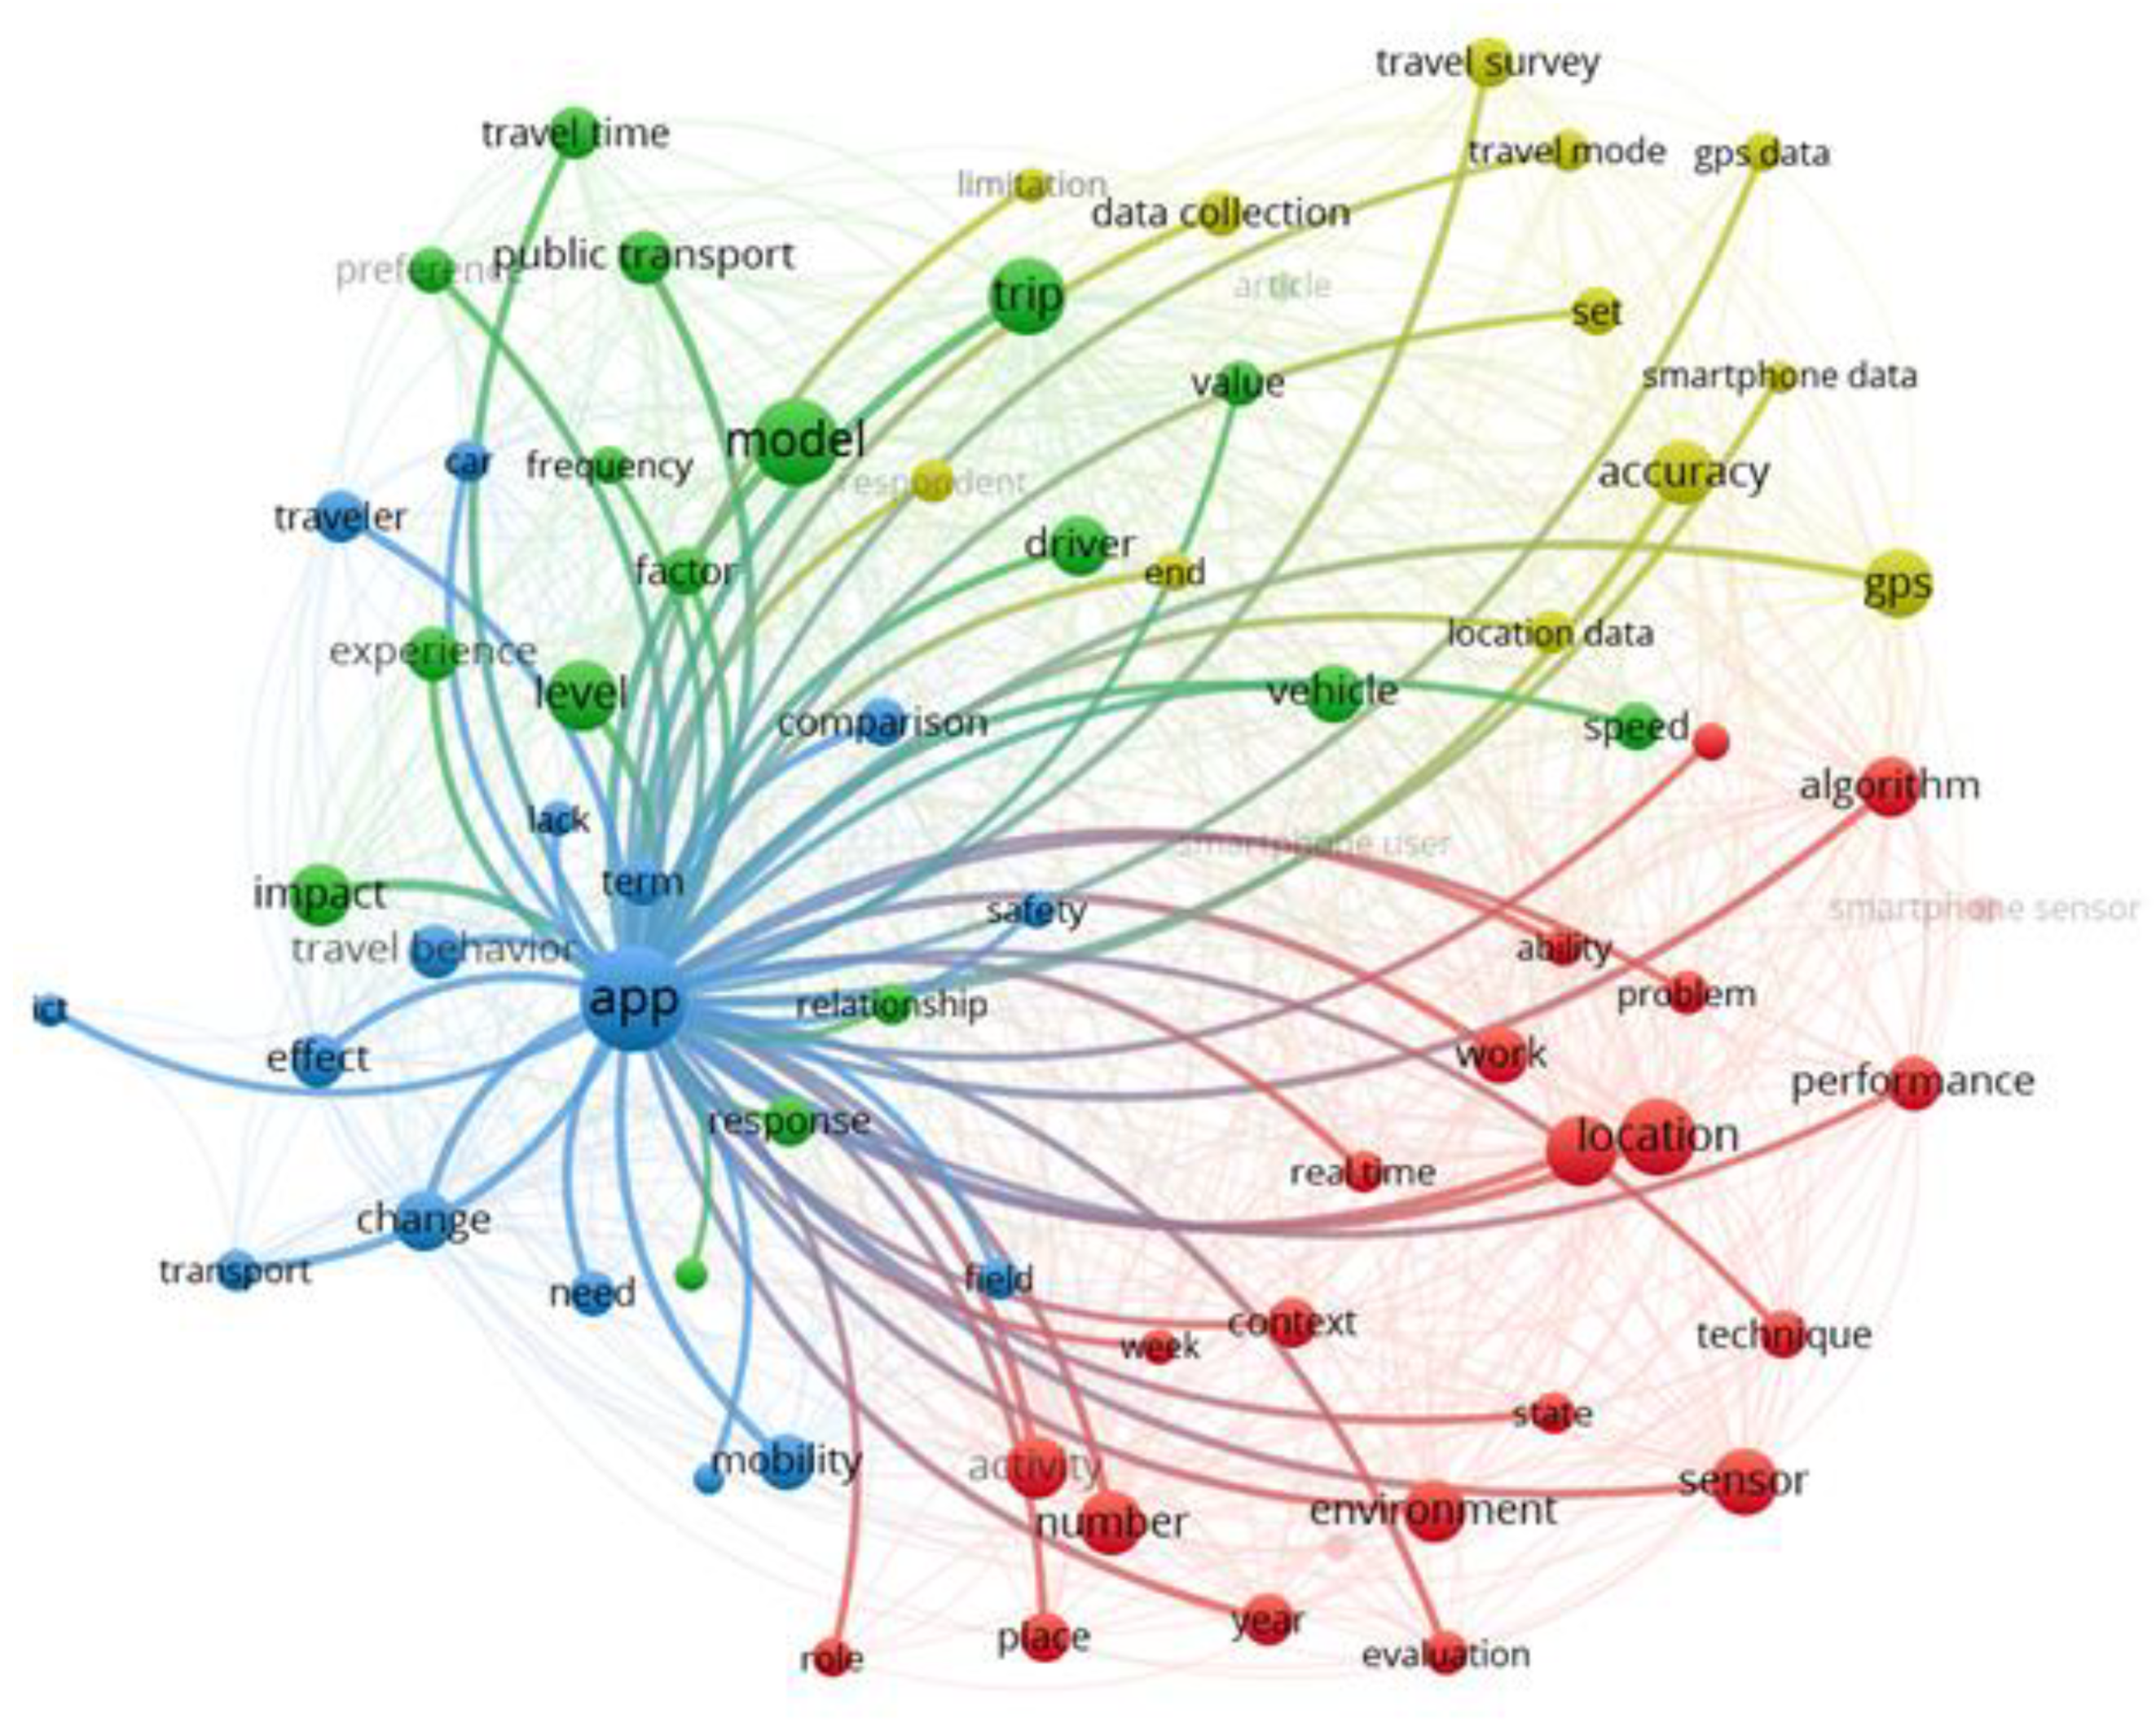
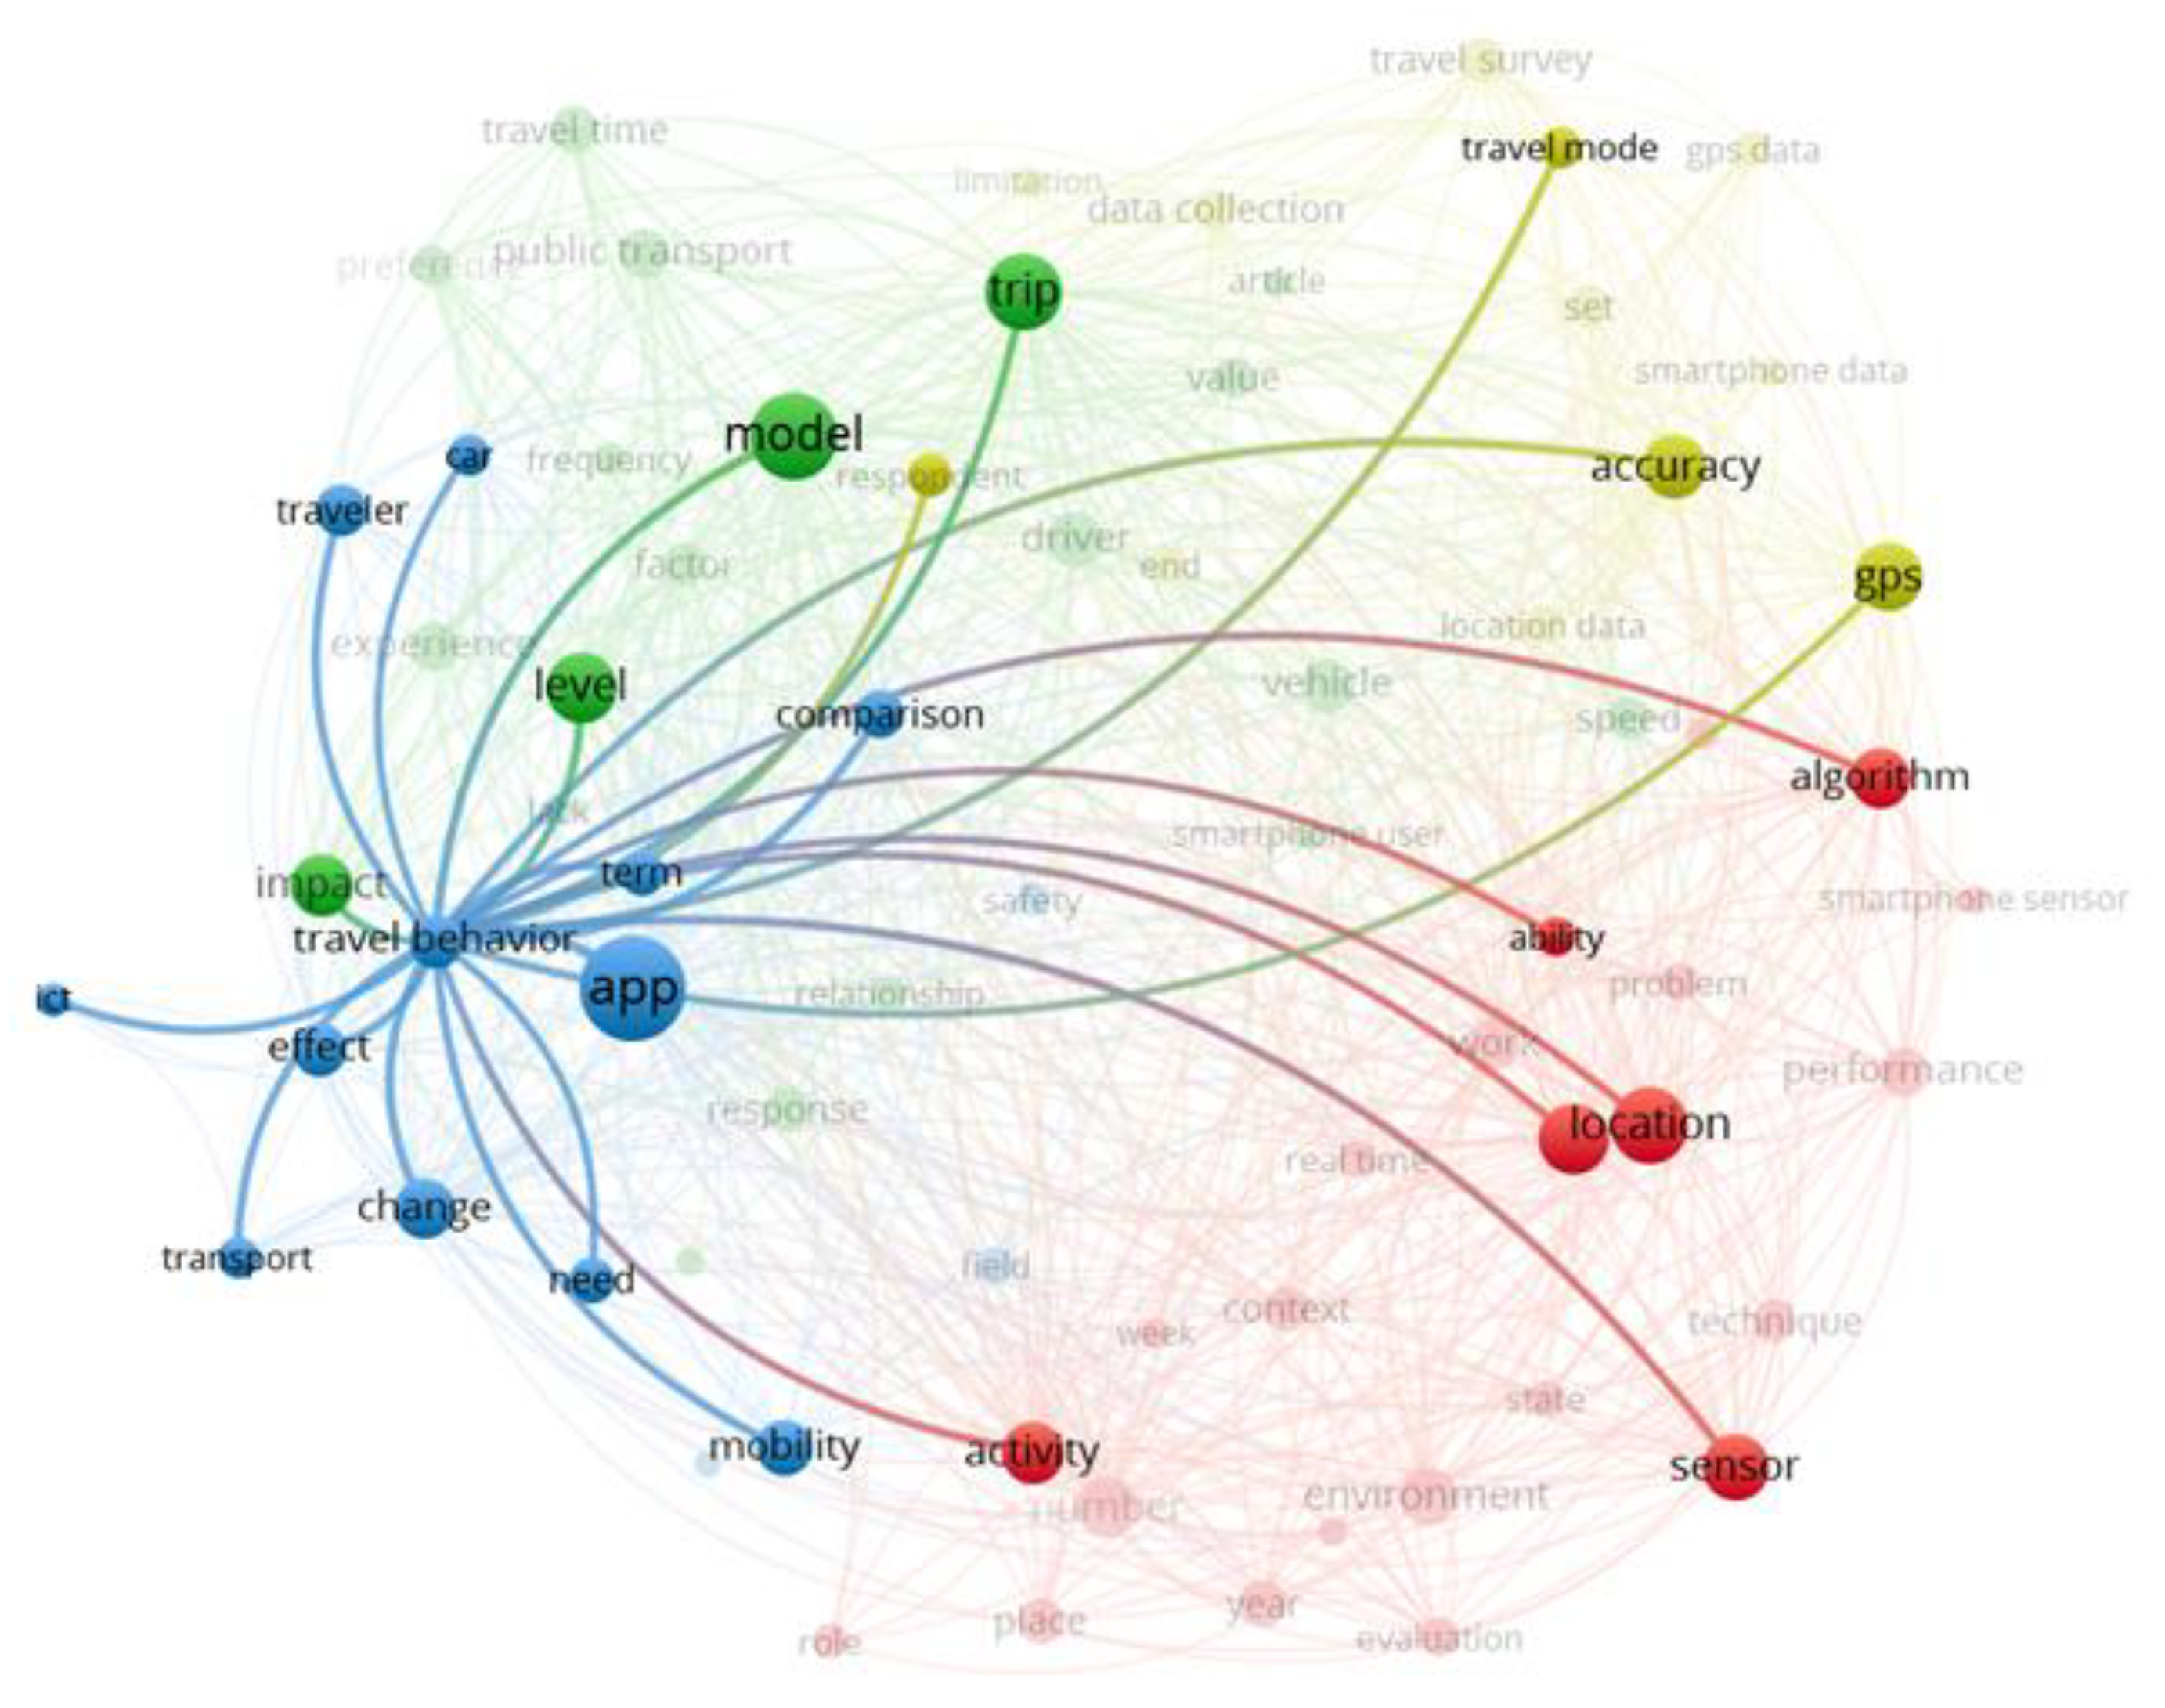
2.2. Bibliographic Analysis
2.3. Selected Studies
3. Findings from the Literature Review
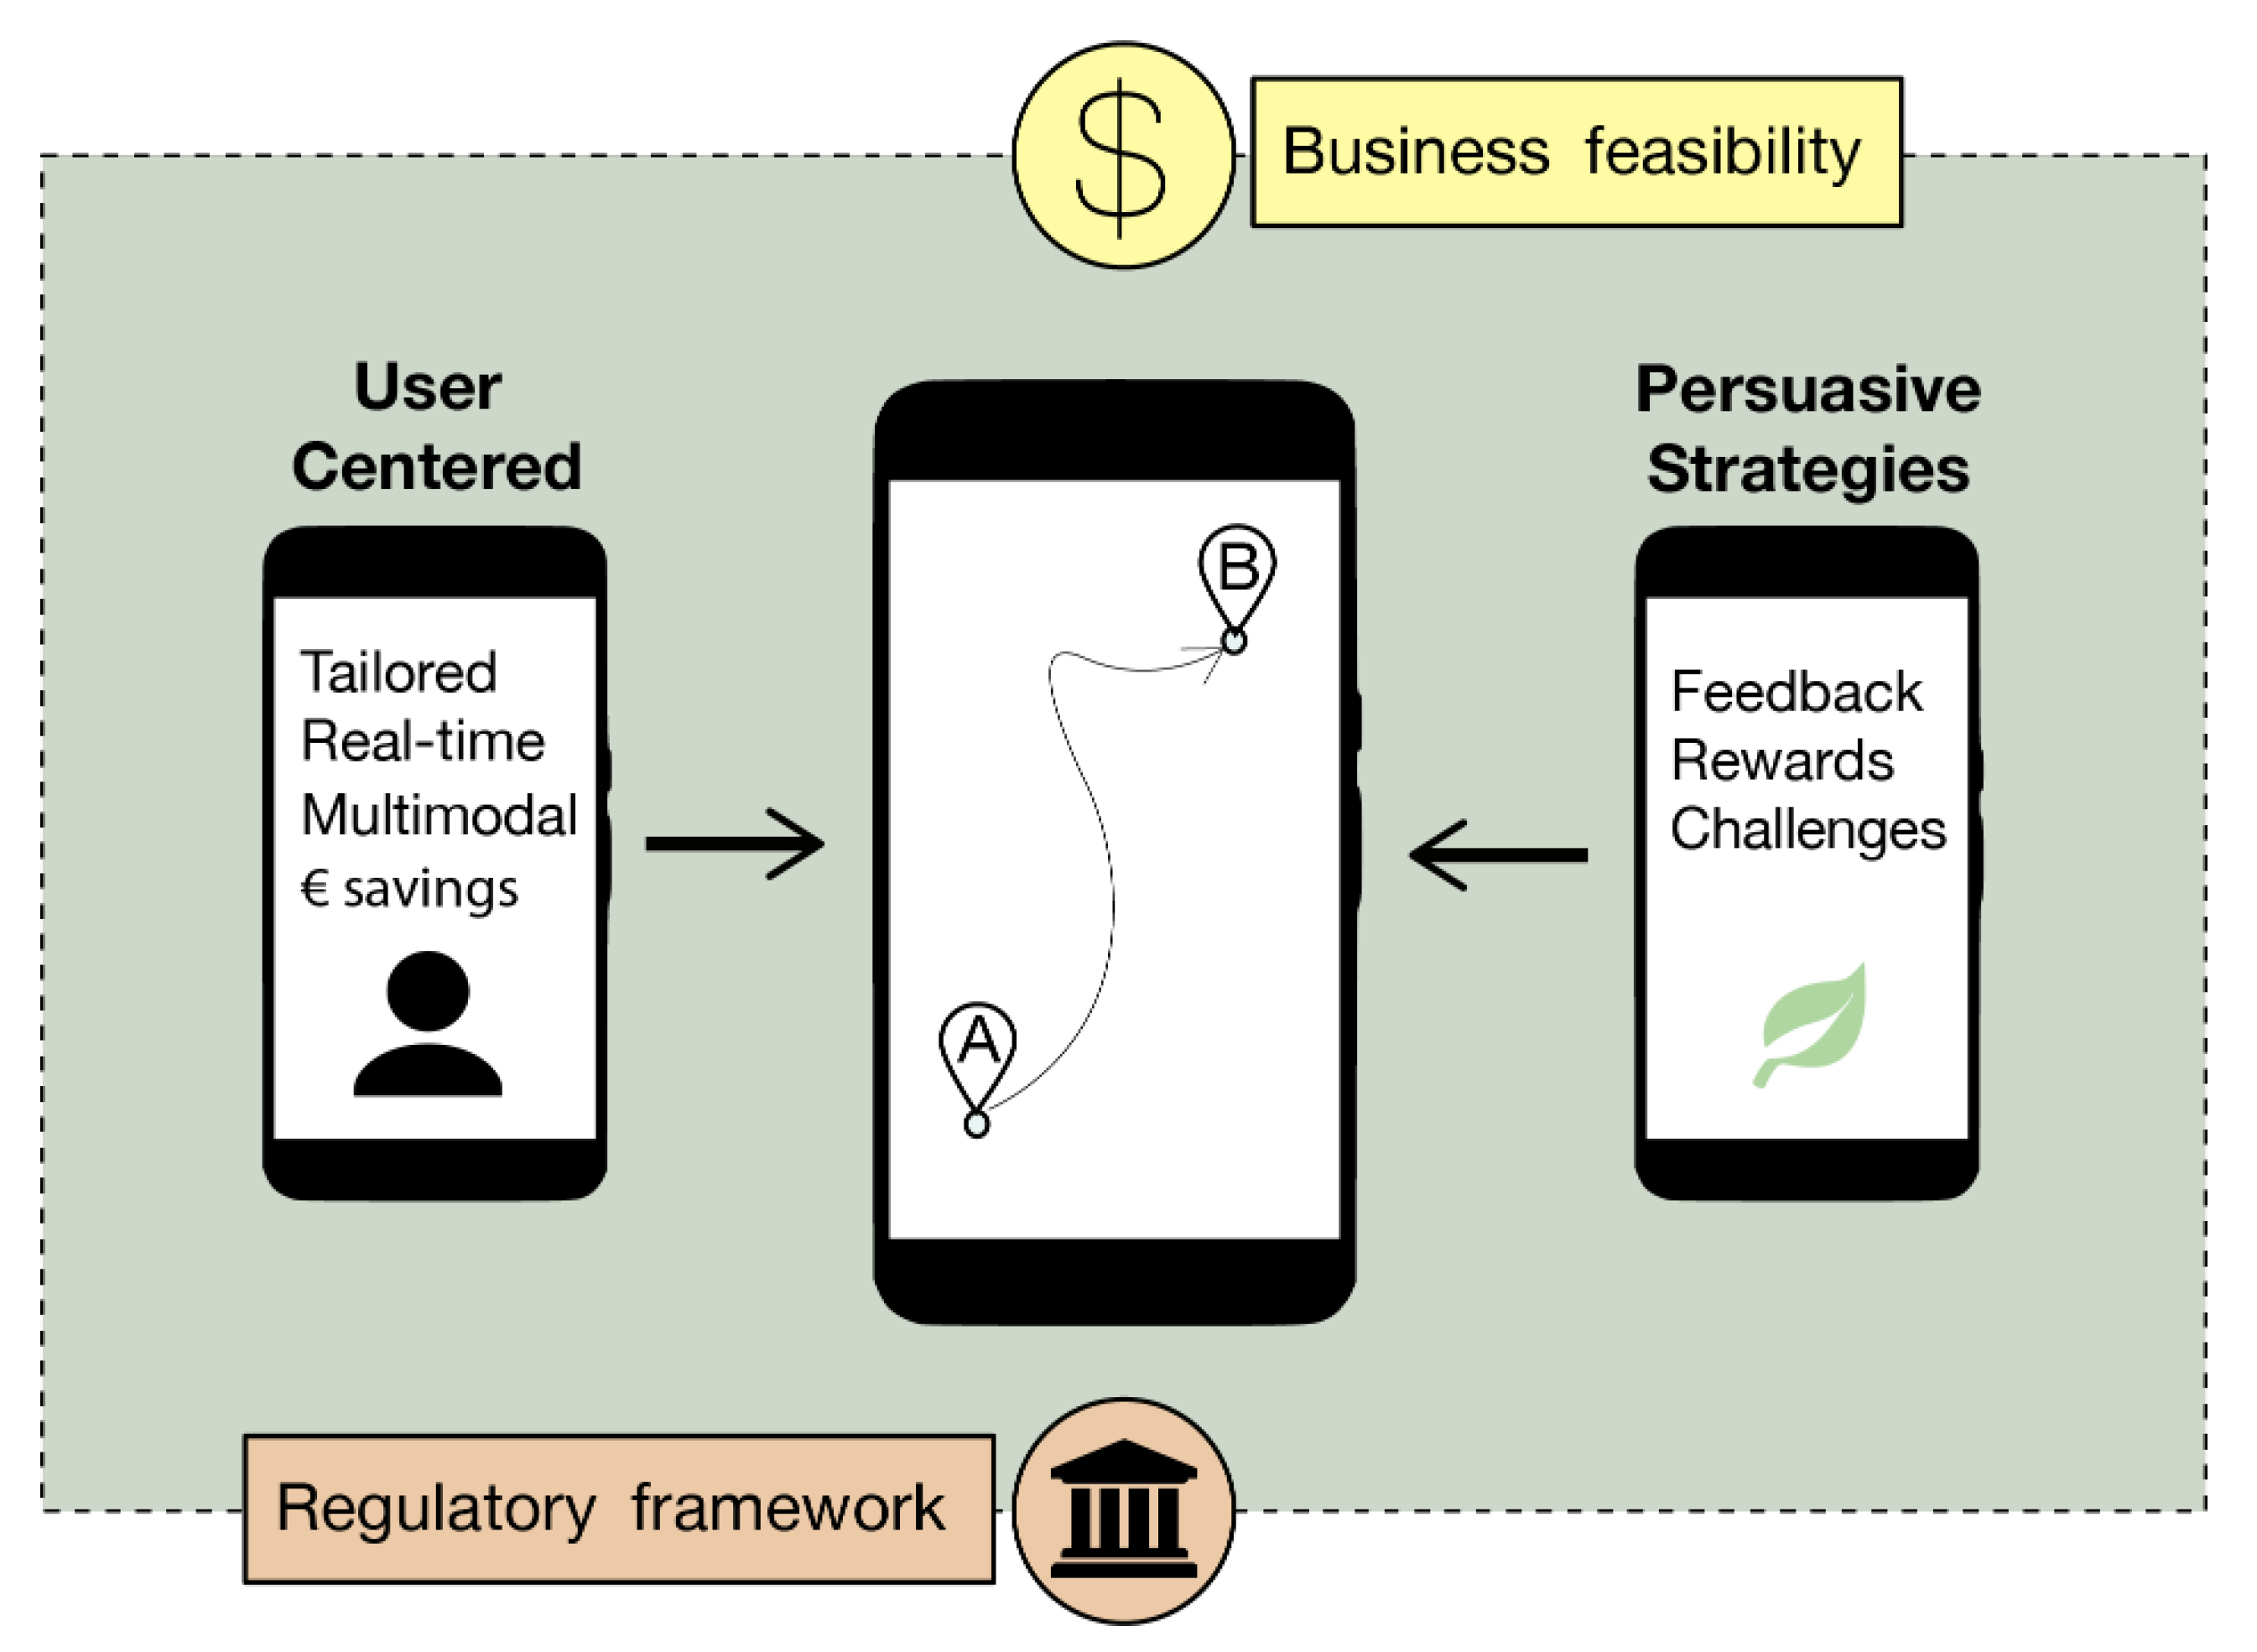
3.1. User-Centered Mobility Apps
- Sociodemographics
- Real-time information
- Registration-planning-booking-payment method
- Customization
- Assistance
- Platform/community network
Impact Assessment of User-Centered Mobility Apps
- By subject: six are related to MaaS experiences, while the other three are ride-hailing or car-sharing experiences.
- By type of study: surveys exploring real experiences, pilot studies, and two MaaS experiences recently implemented in Taiwan: UMAJI and MenGo.
- Notes on the MaaS schemes in Table 1.
- Changes in travel behavior
3.2. Mobility Apps Fostering Sustainable Mobility
Impact Assessment of Mobility Apps That Foster Sustainable Travel Behavior
- Website/app format
- Type of tracking
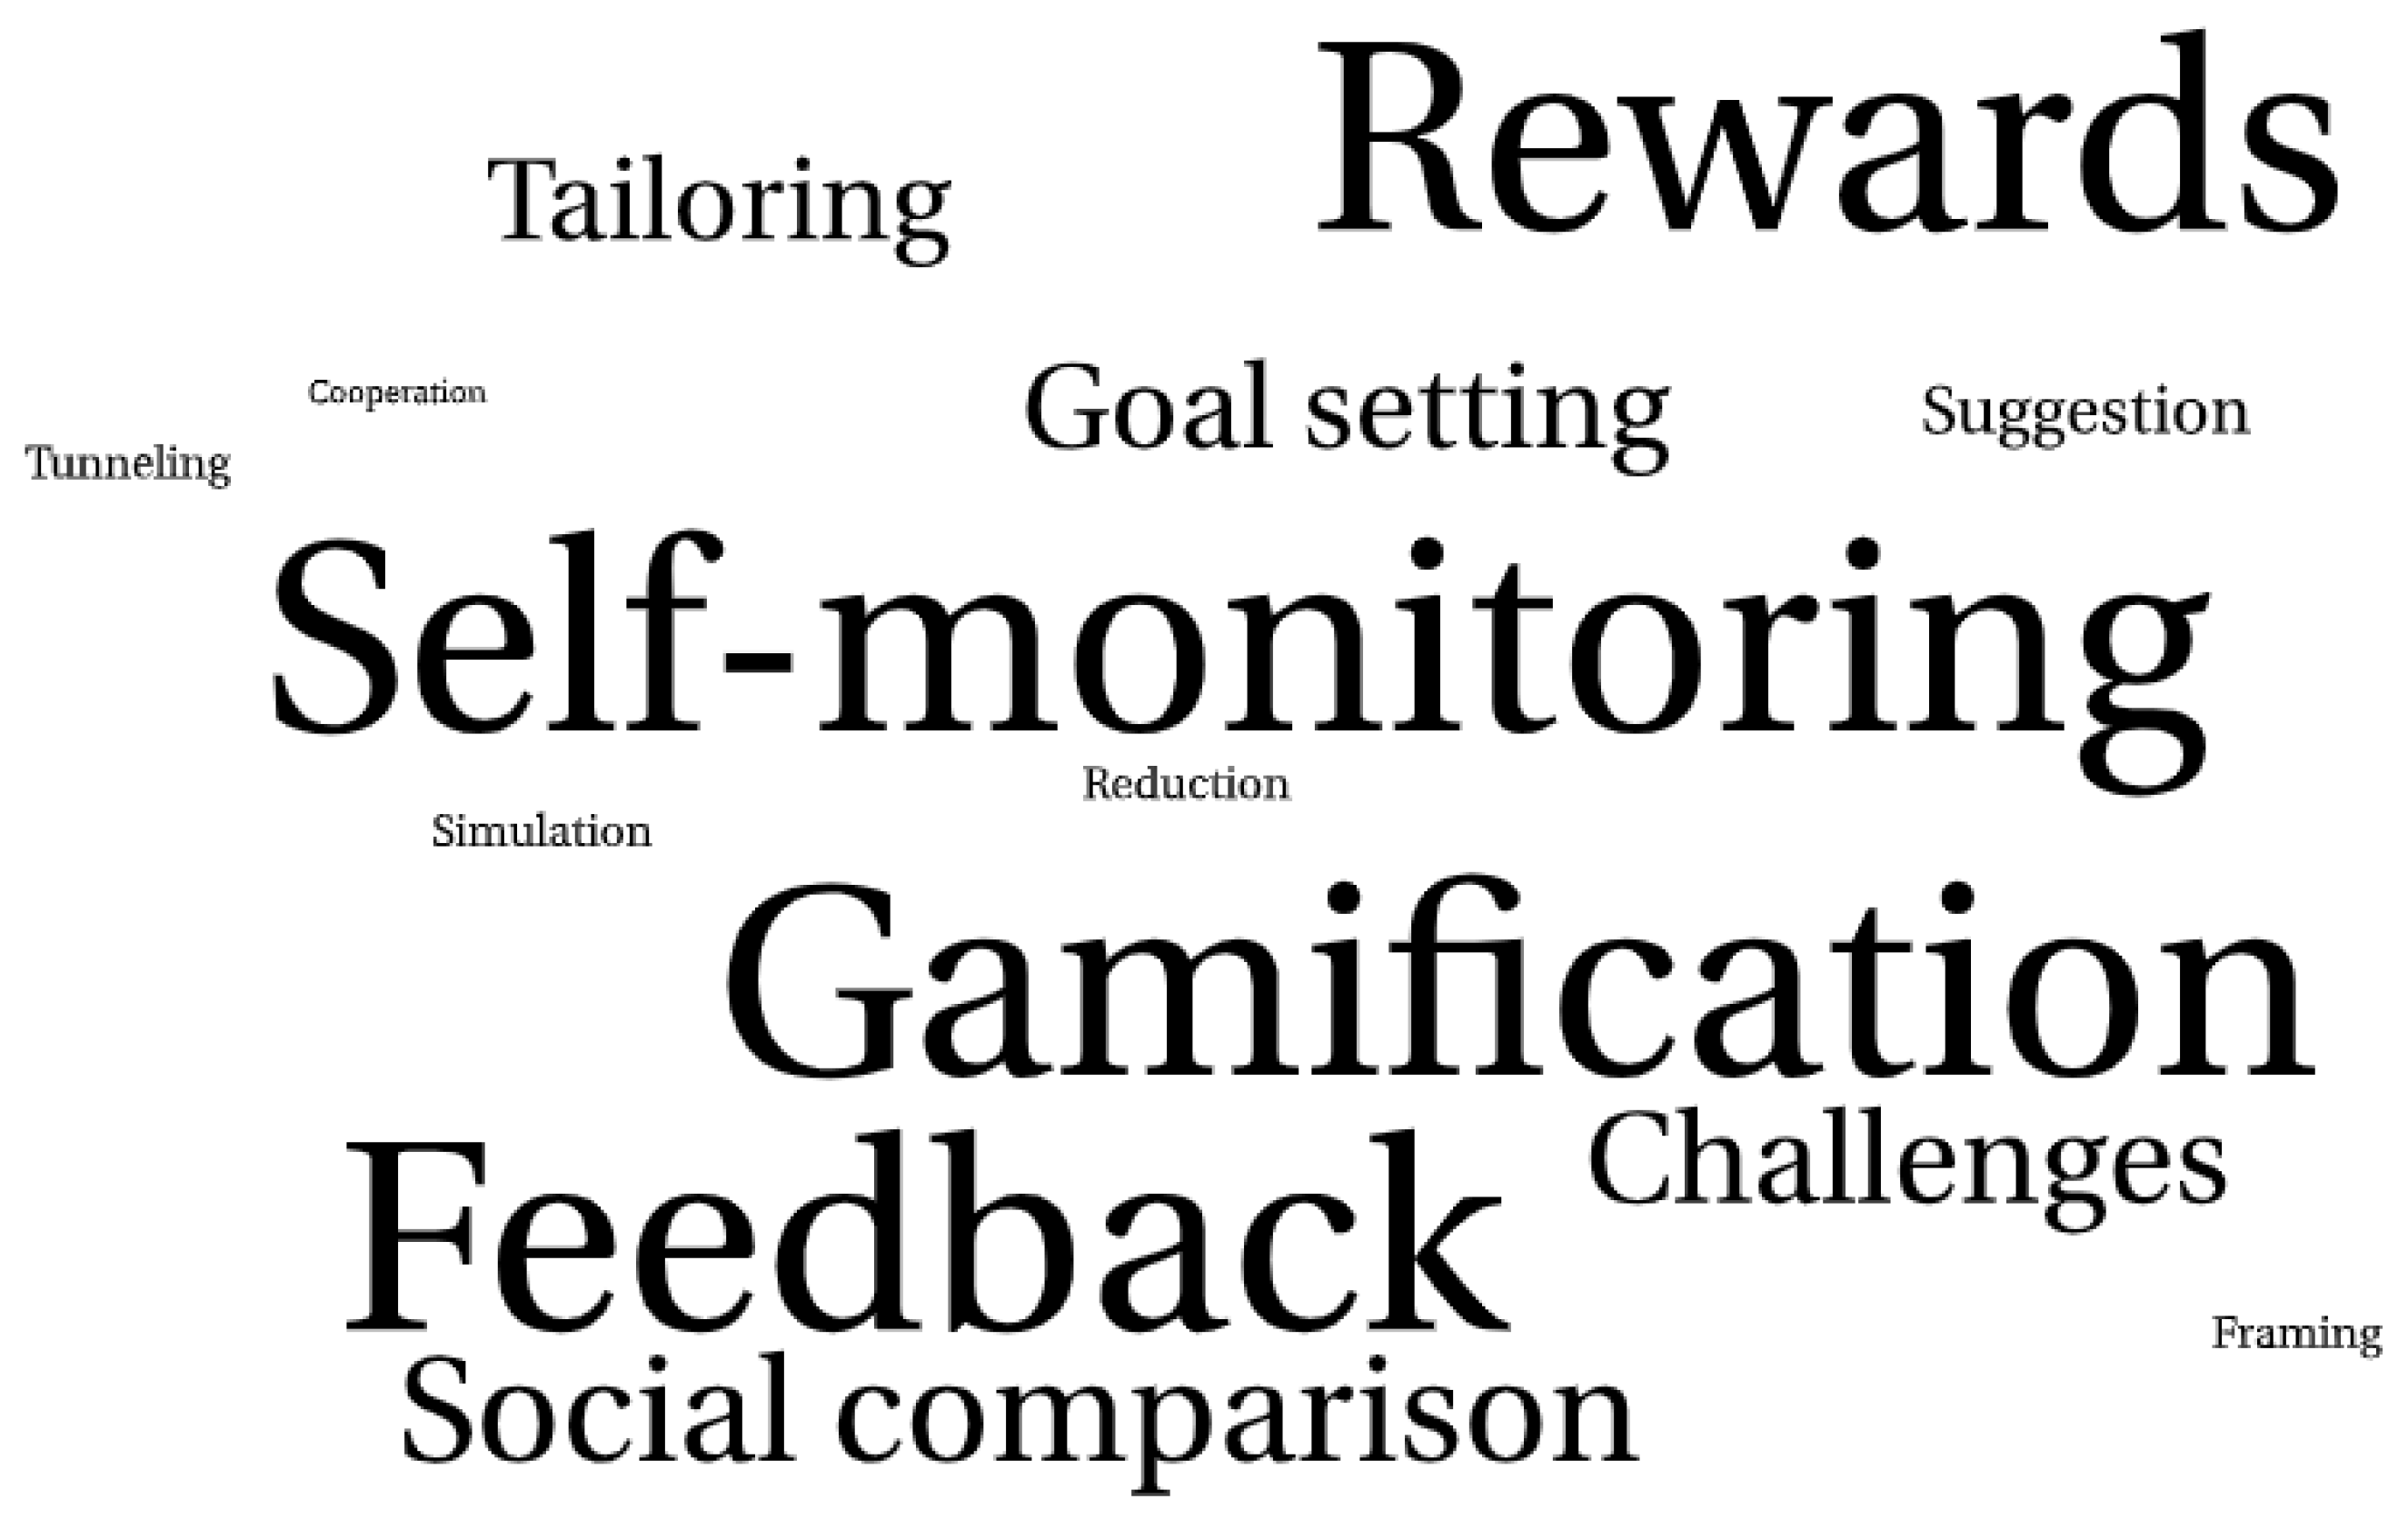
- Persuasive strategies
- Travel behavior impacts
- Attrition/App churn
4. Discussion
5. Conclusions
- Analysis of user-centered apps for mobility services
- Changes in mobility behavior reported in pilot case studies with persuasive mobility apps:
Funding
Institutional Review Board Statement
Informed Consent Statement
Data Availability Statement
Conflicts of Interest
Appendix A

| Ref. | Authors (Year) | App | Method | Location |
|---|---|---|---|---|
| [17] | Sochor et al. (2015) | UbiGo | Pilot [n = 195, 6 months] | Gothenburg (Sweden) |
| [48] | Bopp et al. (2016) | Active Lions | Survey [n = 999] | Pennsylvania (USA) |
| [29] | Xu et al. (2016) | — | Survey [n = 2043] | Switzerland |
| [9] | Karlsson et al. (2017) | Smile | Pilot [n = 200, 1 year] | Vienna (Austria) |
| [18] | Gan & Ye (2018) | — | Survey [n = 181] | Shanghai (China) |
| [28] | Mulley et al. (2018) | — | 5 In-depth interviews | Sidney (Australia) |
| [27] | Sarker et al. (2019) | — | Survey [n = 1369] | Copenhagen (Denmark) and Innsbruck (Austria) |
| [31] | Dastjerdi et al. (2019) | — | Survey [n = 828] | Copenhagen (Denmark) |
| [33] | Chang et al. (2019) | UMAJI | Operational | Taipei (Taiwan) |
| MenGo | Operational | Kaohsiung (Taiwan) | ||
| [13] | Alemi et al. (2019) | — | Survey [n = 1975] | California (USA) |
| [25] | Romero et al. (2020) | HARMONY | Pilot [n = 17, 1 week] | Madrid (Spain) |
| [19] | Tang et al. (2020) | DIDI | Survey [n = 9762] | China (10 main cities) |
| [12] | Caiati et al. (2020) | — | Survey [n = 1078] | Amsterdam and Eindhoven (The Netherlands) |
| [16] | Storme et al. (2020) | Touring | Pilot [n = 90, 2.5 months] | Ghent (Belgium) |
| [20] | X. Zhao et al. (2020) | — | Pilot [n = 400, 6 months] | Exclusive for a big company, 15,000 employees (Sweden) |
| [8] | López- Carreiro et al. (2020) | — | Focus groups | Madrid (Spain) |
| [49] | Schikofsky et al. (2020) | — | Survey [n = 1067] | Germany |
| [50] | Vij et al. (2020) | — | Survey [n = 3985] | Melbourne, Canberra, Sydney (Australia) |
| [7] | Hensher et al. (2021) | Tripi | Pilot [n = 92, 4 months] | Sydney (Australia) |
| [21] | Li et al. (2021) | Metropia | Operational [n = 380] | Austin (USA) |
| [51] | Sun & Wandelt (2021) | Baidu | Operational | China |
| [15] | Haustein (2021) | DriveNow | Operational. Survey [n = 1496, 2.5 years] | Copenhagen (Denmark) |
Appendix B
| Ref. | Authors (Year) | App or Web (Year) | Duration (Weeks) | Participants |
|---|---|---|---|---|
| [52] | Broll et al. (2012) | TRIPZOOM (2003) | App design | |
| [53] | Reitberger et al. (2007) | PerCues (2007) | App design and survey | |
| [54] | Froehlich et al. (2009) | UbiGreen (2009) | 3 | 14 |
| [55] | Takayama et al. (2009) | Ecoisland (2009) | 4 | 20 |
| [56] | Harries et al. (2013) | bActive (2011) | 7 | 518 |
| [57] | Jylhä et al. (2013) | Matkahupi (2013) | 4 | 12 |
| [2] | Jariyasunant et al. (2012) | QT (2012) | 3 | 135 |
| [58] | Gabrielli and Maimone (2013) | SUPERHUB (2013) | 4 | 8 |
| [59] | Bothos et al. (2014) | Peacox (2013) 1 | 8 | 24 |
| [60] | Meloni et al. (2014) | IPET (2014) | 2 | 15 |
| [61] | Baird (2014) | Moves (2014) | 3 | 35 |
| [36] | Buningh et al. (2016) | From5To4 (2014–2016) | 12–16 | 900 |
| [45] | Di Dio et al. (2018) | TrafficO2 (2014) | 4 | 77 |
| [62] | Wunsch et al. (2016) | Frequent Biking Challenge (2014) | 2.5 | 29 |
| [63] | Kazhamiakin et al. (2015) | Viaggia Roveretgoto (2015) | 5 | 40 |
| [64] | Shankari et al. (2015) | E-Mission (2015) | 4 | 67 |
| [65] | Schrammel et al. (2015) | Peacox (2015)1 | 8 | 37 |
| [37] | Semanjski et al. (2016) | Routecoach (2015) | 24 | 3400 |
| [62] | Wunsch et al. (2016) | Bike to Work (2015) | 4 | 498 |
| [38] | Bowden and Hellen (2018) | BetterPoints (2015) | 24 | 667 |
| [66] | Meurer et al. (2016) | N.A. (2016) | 4 | 7 |
| [67] | Ebermann and Brauer (2016) | N.A. (2016) | 3 | 248 |
| [39] | Kelpin et al. (2016) | STREETLIFE (2016) | 12 | 64 |
| [68] | Cheng and Lee (2015) | BikeTogether (N.A.) | 1 | 10 |
| [69] | Piras et al. (2018) | IPET (2016) | 2 | 28 |
| [70] | Huang et al. (2018) | SMART (2016) | 8 | 70 |
| [40] | Cellina et al. (2019) | GoEco! (2016–2017) | 48 | 52 |
| [71] | Khoshkangini et al. (2017) | N.A. (2017) | 9 | 110 |
| [72] | Brazil et al. (2017) | Peacox (2014) 1 | 7 | 21 |
| [73] | Park et al. (2017) | Ecotrips (2017) | 1 | 11 |
| [41] | Cellina et al. (2021) | Bellidea (2017–2018) | 13 | 207 |
| [74] | Wu et al. (2018) | GreenCommute (2018) | 1 | 11 |
| [6] | Anagnostopoulou et al. (2018) | Optimum (2018) | 6 | 27 |
| [75] | Campos-Sánchez et al. (2019) | Ciclogreen (2019) | 4 | 560 |
| [76] | Ahmed et al. 2020) | SPARROWS (N.A.) | 4 | 52 |
References
- Shaheen, S.; Cohen, A.; Martin, E. Smartphone App Evolution and Early Understanding from a Multimodal App User Survey. In Disrupting Mobility; Springer: Cham, Swizerland, 2017; pp. 149–164. [Google Scholar] [CrossRef] [Green Version]
- Jariyasunant, J.; Carrel, A.; Ekambaram, V.; Gaker, D.; Segupta, R.; Walker, J.L. The Quantified Traveler: Changing Transport Behavior with Personalized Travel Data Feedback; University of California Transportation Center: Berkeley, CA, USA, 2012. [Google Scholar]
- Di Teulada, B.S.; Meloni, I. Individual Persuasive Eco-travel Technology, a mobile persuasive application for implementing voluntary travel behaviour change programmes. IET Intell. Transp. Syst. 2016, 10, 237–243. [Google Scholar] [CrossRef]
- Anagnostopoulou, E.; Bothos, E.; Magoutas, B.; Schrammel, J.; Mentzas, G. Persuasive Technologies for Sustainable Urban Mobility. 2016. Available online: http://arxiv.org/abs/1604.05957 (accessed on 2 July 2021).
- Sunio, V.; Schmöcker, J.D. Can we promote sustainable travel behavior through mobile apps? Evaluation and review of evidence. Int. J. Sustain. Transp. 2017, 11, 553–566. [Google Scholar] [CrossRef]
- Anagnostopoulou, E.; Bothos, E.; Magoutas, B.; Schrammel, J.; Mentzas, G. Persuasive technologies for sustainable mobility: State of the art and emerging trends. Sustainability 2018, 10, 2128. [Google Scholar] [CrossRef] [Green Version]
- Hensher, D.A.; Ho, C.Q.; Reck, D.J. Mobility as a service and private car use: Evidence from the Sydney MaaS trial. Transp. Res. Part A Policy Pract. 2021, 145, 17–33. [Google Scholar] [CrossRef]
- Lopez-Carreiro, I.; Monzon, A.; Lopez, E.; Lopez-Lambas, M.E. Urban mobility in the digital era: An exploration of travellers’ expectations of MaaS mobile-technologies. Technol. Soc. 2020, 63, 101392. [Google Scholar] [CrossRef]
- Karlsson, M.; Sochor, J.; Aapaoja, A.; Eckhardt, J.; König, D. Deliverable 4: Impact Assessment. MAASiFiE Project Funded by CEDR. 2017. Volume 35, Issue 4. Available online: https://doi.org/10.1177/0193841x9401800105 (accessed on 8 July 2021).
- Van Eck, N.J.; Waltman, L. Software survey: VOSviewer, a computer program for bibliometric mapping. Scientometrics 2010, 84, 523–538. [Google Scholar] [CrossRef] [Green Version]
- Van Eck, N.J.; Waltman, L. {VOSviewer} Manual. Univeristeit Leiden. 2013. Available online: http://www.vosviewer.com/documentation/Manual_VOSviewer_1.6.1.pdf (accessed on 12 June 2021).
- Caiati, V.; Rasouli, S.; Timmermans, H. Bundling, pricing schemes and extra features preferences for mobility as a service: Sequential portfolio choice experiment. Transp. Res. Part A Policy Pract. 2020, 131, 123–148. [Google Scholar] [CrossRef]
- Alemi, F.; Circella, G.; Mokhtarian, P.; Handy, S. What drives the use of ridehailing in California? Ordered probit models of the usage frequency of Uber and Lyft. Transp. Res. Part C Emerg. Technol. 2019, 102, 233–248. [Google Scholar] [CrossRef]
- Kenyon, S.; Lyons, G. The value of integrated multimodal traveller information and its potential contribution to modal change. Transp. Res. Part F Traffic Psychol. Behav. 2003, 6, 1–21. [Google Scholar] [CrossRef] [Green Version]
- Haustein, S. What role does free-floating car sharing play for changes in car ownership? Evidence from longitudinal survey data and population segments in Copenhagen. Travel Behav. Soc. 2021, 24, 181–194. [Google Scholar] [CrossRef]
- Storme, T.; De Vos, J.; De Paepe, L.; Witlox, F. Limitations to the car-substitution effect of MaaS. Findings from a Belgian pilot study. Transp. Res. Part A Policy Pract. 2020, 131, 196–205. [Google Scholar] [CrossRef]
- Sochor, J.; Strömberg, H.; Karlsson, I.C.M. Implementing mobility as a service: Challenges in integrating user, commercial, and societal perspectives. Transp. Res. Rec. 2015, 2536, 1–9. [Google Scholar] [CrossRef]
- Gan, H.; Ye, X. Will commute drivers switch to park-and-ride under the influence of multimodal traveler information? A stated preference investigation. Transp. Res. Part F Traffic Psychol. Behav. 2018, 56, 354–361. [Google Scholar] [CrossRef]
- Tang, B.J.; Li, X.Y.; Yu, B.; Wei, Y.M. How app-based ride-hailing services influence travel behavior: An empirical study from China. Int. J. Sustain. Transp. 2020, 14, 554–568. [Google Scholar] [CrossRef]
- Zhao, X.; Vaddadi, B.; Sjöman, M.; Hesselgren, M.; Pernestål, A. Key barriers in MaaS development and implementation: Lessons learned from testing Corporate MaaS (CMaaS). Transp. Res. Interdiscip. Perspect. 2020, 8, 100227. [Google Scholar] [CrossRef]
- Li, T.; Chen, P.; Tian, Y. Personalized incentive-based peak avoidance and drivers’ travel time-savings. Transp. Policy 2021, 100, 68–80. [Google Scholar] [CrossRef]
- Bian, J.; Li, W.; Zhong, S.; Lee, C.; Foster, M.; Ye, X. The end-user benefits of smartphone transit apps: A systematic literature review. Transp. Rev. 2021, 1–20. [Google Scholar] [CrossRef]
- Song, C.; Guan, W.; Ma, J. Potential travel cost saving in urban public-transport networks using smartphone guidance. PLoS ONE 2018, 13, e0197181. [Google Scholar] [CrossRef] [PubMed] [Green Version]
- Lyons, G.; Hammond, P.; Mackay, K. The importance of user perspective in the evolution of MaaS. Transp. Res. Part A Policy Pract. 2019, 121, 22–36. [Google Scholar] [CrossRef]
- Romero, C.; Monzón, A.; Alonso, A.; Julio, R. Added value of a customized transit app for metropolitan bus trips. Transp. Res. Procedia 2020, 47, 513–520. [Google Scholar] [CrossRef]
- Wessel, N.; Allen, J.; Farber, S. Constructing a routable retrospective transit timetable from a real-time vehicle location feed and GTFS. J. Transp. Geogr. 2017, 62, 92–97. [Google Scholar] [CrossRef]
- Sarker, R.I.; Kaplan, S.; Anderson, M.K.; Haustein, S.; Mailer, M.; Timmermans, H.J.P. Obtaining transit information from users of a collaborative transit app: Platform-based and individual-related motivators. Transp. Res. Part C Emerg. Technol. 2019, 102, 173–188. [Google Scholar] [CrossRef]
- Mulley, C.; Nelson, J.D.; Wright, S. Community transport meets mobility as a service: On the road to a new a flexible future. Res. Transp. Econ. 2018, 69, 583–591. [Google Scholar] [CrossRef] [Green Version]
- Xu, R.; Frey, R.M.; Fleisch, E.; Ilic, A. Understanding the impact of personality traits on mobile app adoption—Insights from a large-scale field study. Comput. Hum. Behav. 2016, 62, 244–256. [Google Scholar] [CrossRef]
- Karlsson, I.C.M.; Mukhtar-Landgren, D.; Smith, G.; Koglin, T.; Kronsell, A.; Lund, E.; Sarasini, S.; Sochor, J. Development and implementation of Mobility-as-a-Service—A qualitative study of barriers and enabling factors. Transp. Res. Part A Policy Pract. 2020, 131, 283–295. [Google Scholar] [CrossRef]
- Mehdizadeh Dastjerdi, A.; Kaplan, S.; de Abreu e Silva, J.; Nielsen, O.A.; Pereira, F.C. Participating in environmental loyalty program with a real-time multimodal travel app: User needs, environmental and privacy motivators. Transp. Res. Part D Transp. Environ. 2019, 67, 223–243. [Google Scholar] [CrossRef]
- Jittrapirom, P.; Caiati, V.; Feneri, A.M.; Ebrahimigharehbaghi, S.; Alonso-González, M.J.; Narayan, J. Mobility as a service: A critical review of definitions, assessments of schemes, and key challenges. Urban Plan. 2017, 2, 13–25. [Google Scholar] [CrossRef] [Green Version]
- Chang, S.K.J.; Chen, H.Y.; Chen, H.C. Mobility as a service policy planning, deployments and trials in Taiwan. IATSS Res. 2019, 43, 210–218. [Google Scholar] [CrossRef]
- Gärling, T.; Bamberg, S.; Friman, M.; Fujii, S.; Richter, J. Implementation of Soft Transport Policy Measures to Reduce Private Car Use in Urban Areas. Geography 2008, 5, 1–12. [Google Scholar]
- Gössling, S. ICT and transport behavior: A conceptual review. Int. J. Sustain. Transp. 2018, 12, 153–164. [Google Scholar] [CrossRef]
- Buningh, S.; Venema, A.; Martijnse-Hartikka, R. MOBI-Promoting Smart Mobility to Employees. 2016. Available online: http://www.mobi-project.eu/site/assets/files/1071/d1_3_mobi_final_report_-_results_and_lessons.pdf (accessed on 15 June 2021).
- Semanjski, I.; Aguirre, A.J.L.; De Mol, J.; Gautama, S. Policy 2.0 platform for mobile sensing and incentivized targeted shifts in mobility behavior. Sensors 2016, 16, 1035. [Google Scholar] [CrossRef] [Green Version]
- Bowden, H.; Hellen, G. A Data Driven, Segmentation Approach to Real World Travel Behaviour Change, Using Incentives and Gamification; Springer International Publishing: Berlin/Heidelberg, Germany, 2018; ISBN 9783319997568. [Google Scholar]
- Kelpin, R.; Giesel, F.; Heinrichs, M. Streetlife Field Trials—Applied Gamification Approaches as a Key to More Sustainable Mobility Behaviour. In Proceedings of the European Transport Conference 2016, Barcelona, Spain, 5–7 October 2016. [Google Scholar]
- Cellina, F.; Bucher, D.; Mangili, F.; Simão, J.V.; Rudel, R.; Raubal, M. A large scale, app-based behaviour change experiment persuading sustainable mobility patterns: Methods, results and lessons learnt. Sustainability 2019, 11, 2674. [Google Scholar] [CrossRef] [Green Version]
- Cellina, F.; Vittucci Marzetti, G.; Gui, M. Self-selection and attrition biases in app-based persuasive technologies for mobility behavior change: Evidence from a Swiss case study. Comput. Hum. Behav. 2021, 125, 106970. [Google Scholar] [CrossRef]
- Anable, J.; Wright, S. Work Package 7 Golden Questions and Social Marketing Guidance Report Authors: Dr. Jillian Anable and Dr. Steve Wright (University of Aberdeen) GOLDEN QUESTIONS REPORT. Intellegent Energy Europe. 2017. Available online: https://civitas.eu/sites/default/files/segment_deliverable_7.8.4_golden_questions_and_social_marketing_guidance_report.pdf (accessed on 23 May 2021).
- Kamargianni, M.; Li, W.; Matyas, M.; Schäfer, A. A Critical Review of New Mobility Services for Urban Transport. Transp. Res. Procedia 2016, 14, 3294–3303. [Google Scholar] [CrossRef] [Green Version]
- Utriainen, R.; Pöllänen, M. Review on mobility as a service in scientific publications. Res. Transp. Bus. Manag. 2018, 27, 15–23. [Google Scholar] [CrossRef]
- Di Dio, S.; La Gennusa, M.; Peri, G.; Rizzo, G.; Vinci, I. Involving people in the building up of smart and sustainable cities: How to influence commuters’ behaviors through a mobile app game. Sustain. Cities Soc. 2018, 42, 325–336. [Google Scholar] [CrossRef]
- Mouratidis, K.; Peters, S.; van Wee, B. Transportation technologies, sharing economy, and teleactivities: Implications for built environment and travel. Transp. Res. Part D Transp. Environ. 2021, 92, 102716. [Google Scholar] [CrossRef]
- Buningh, S.; Martijnse-Hartikka, R.; Christiaens, J. Mobi-modal shift through gamification. In Proceedings of the Transport Research Arena (TRA) 5th Conference: Transport Solutions from Research to Deployment, Paris, France, 14–17 April 2014. [Google Scholar]
- Bopp, M.; Sims, D.; Matthews, S.A.; Rovniak, L.S.; Poole, E.; Colgan, J. There’s an app for that: Development of a smartphone app to promote active travel to a college campus. J. Transp. Health 2016, 3, 305–314. [Google Scholar] [CrossRef]
- Schikofsky, J.; Dannewald, T.; Kowald, M. Exploring motivational mechanisms behind the intention to adopt mobility as a service (MaaS): Insights from Germany. Transp. Res. Part A Policy Pract. 2020, 131, 296–312. [Google Scholar] [CrossRef]
- Vij, A.; Ryan, S.; Sampson, S.; Harris, S. Consumer Preferences for Mobility-as-a-Service (MaaS) in Australia. Transp. Res. Part C Emerg. Technol. 2020, 117, 102699. [Google Scholar] [CrossRef]
- Sun, X.; Wandelt, S. Transportation mode choice behavior with recommender systems: A case study on Beijing. Transp. Res. Interdiscip. Perspect. 2021, 11, 100408. [Google Scholar] [CrossRef]
- Broll, G.; Cao, H.; Ebben, P.; Holleis, P.; Jacobs, K.; Koolwaaij, J.; Luther, M.; Souville, B. Tripzoom: An app to improve your mobility behavior. In Proceedings of the 11th International Conference on Mobile and Ubiquitous Multimedia, Ulm, Germany, 4–6 December 2012; pp. 1–4. [Google Scholar] [CrossRef]
- Reitberger, W.; Ploderer, B.; Obermair, C.; Tscheligi, M. The PerCues Framework and Its Application for Sustainable Mobility. In Proceedings of the Persuasive Technology; de Kort, Y., IJsselsteijn, W., Midden, C., Eggen, B., Fogg, B.J., Eds.; Springer: Berlin/Heidelberg, Germany, 2007; pp. 92–95. [Google Scholar]
- Froehlich, J.; Dillahunt, T.; Klasnja, P.; Mankoff, J.; Consolvo, S.; Harrison, B.; Landay, J.A. UbiGreen: Investigating a Mobile Tool for Tracking and Supporting Green Transportation Habits. Sustainability 2009, 56, 1043–1052. [Google Scholar]
- Takayama, C.; Lehdonvirta, V.; Shiraishi, M.; Washio, Y.; Kimura, H.; Nakajima, T. Ecoisland: A system for persuading users to reduce CO2 emissions. In Proceedings of the 2009 Software Technologies for Future Dependable Distributed Systems, Tokyo, Japan, 17 March 2009; pp. 59–63. [Google Scholar]
- Harries, T.; Eslambolchilar, P.; Stride, C.; Rettie, R.; Walton, S. Walking in the wild—Using an always-on smartphone application to increase physical activity. In IFIP Conference on Human-Computer Interaction; Springer: Berlin/Heidelberg, Germany, 2013; pp. 19–36. [Google Scholar] [CrossRef] [Green Version]
- Jylhä, A.; Nurmi, P.; Sirén, M.; Hemminki, S.; Jacucci, G. Matkahupi: A persuasive mobile application for sustainable mobility. In Proceedings of the 2013 ACM Conference on Pervasive and Ubiquitous Computing Adjunct Publication, Zurich, Switzerland, 8–12 September 2013; pp. 227–230. [Google Scholar] [CrossRef]
- Gabrielli, S.; Maimone, R. Digital interventions for sustainable urban mobility: A pilot study. In Proceedings of the 2013 ACM Conference on Pervasive and Ubiquitous Computing Adjunct Publication, Zurich, Switzerland, 8–12 September 2013; pp. 119–122. [Google Scholar] [CrossRef]
- Bothos, E.; Mentzas, G.; Prost, S.; Schrammel, J.; Röderer, K. Watch your emissions: Persuasive strategies and choice architecture for sustainable decisions in urban mobility. Psychnol. J. 2014, 12, 107–126. [Google Scholar]
- Meloni, I.; Sanjust, B.; Delogu, G.; Sottile, E. Development of a technological platform for implementing VTBC programs. Transp. Res. Procedia 2014, 3, 129–138. [Google Scholar] [CrossRef]
- Baird, T. “Nudging” Active Travel: A Framework for Behavioral Interventions Using Mobile Technology. In Proceedings of the Transportation Research Board 93rd Annual Meeting, Washington, DC, USA, 12–16 January 2014. [Google Scholar]
- Wunsch, M.; Millonig, A.; Seer, S.; Schechtner, K.; Stibe, A.; Chin, R.C.C. Challenged to Bike: Assessing the Potential Impact of Gamified Cycling Initiatives. Evaluation 2016, 23, 24. [Google Scholar]
- Kazhamiakin, R.; Marconi, A.; Perillo, M.; Pistore, M.; Valetto, G.; Piras, L.; Avesani, F.; Perri, N. Using gamification to incentivize sustainable urban mobility. In Proceedings of the 2015 IEEE First International Smart Cities Conference (ISC2), Guadalajara, Mexico, 25–28 October 2015. [Google Scholar] [CrossRef]
- Shankari, K.; Park, J.; Gadgil, T.; Katz, R.H.; Culler, D.E. Information Display for Societal Problems: Data, Game, or Choice? 2015. Available online: https://www2.eecs.berkeley.edu/Pubs/TechRpts/2015/EECS-2015-7.pdf (accessed on 28 June 2021).
- Schrammel, J.; Prost, S.; Mattheiss, E.; Bothos, E.; Tscheligi, M. Using Individual and Collaborative Challenges in Behavior Change Support Systems: Findings from a Two-Month Field Trial of a Trip Planner Application. In International Conference on Persuasive Technology; MacTavish, T., Basapur, S., Eds.; Springer International Publishing: Cham, Switzerland, 2015; Volume 9072, pp. 160–171. [Google Scholar]
- Meurer, J.; Lawo, D.; Janßen, L.; Wulf, V. Designing mobility eco-feedback for elderly users. In Proceedings of the Proceedings of the 2016 CHI Conference Extended Abstracts on Human Factors in Computing Systems, San Jose, CA, USA, 7–12 May 2016; pp. 921–926. [Google Scholar]
- Ebermann, C.; Brauer, B. The Role of Goal Frames Regarding the Impact of Gamified Persuasive Systems on Sustainable Mobility Behavior. Research Papers, 174. 2016. Available online: http://aisel.aisnet.org/ecis2016_rp/174 (accessed on 10 July 2021).
- Cheng, Y.-M.; Lee, C.-L. Persuasive and engaging design of a Smartphone App for cycle commuting. mUX J. Mob. User Exp. 2015, 4, 1. [Google Scholar] [CrossRef] [Green Version]
- Piras, F.; Sottile, E.; Meloni, I. Modal Share Change following Implementation of Travel Demand Management Strategies. Transp. Res. Rec. 2018, 2672, 731–741. [Google Scholar] [CrossRef]
- Huang, B.; Thomas, T.; Groenewolt, B.; Fioreze, T.; van Berkum, E. The effect of incentives to promote cycling: A mobility living lab. In Proceedings of the Proceedings of the Transportation Research Board 97th Annual Meeting, Washington, DC, USA, 7–11 January 2018. [Google Scholar]
- Khoshkangini, R.; Valetto, G.; Marconi, A. Generating personalized challenges to enhance the persuasive power of gamification. CEUR Workshop Proc. 2017, 1833, 70–83. [Google Scholar]
- Brazil, W.; Caulfield, B.; Bothos, E. An Examination of the Role of Emissions Information in Transport Behaviour: The Results of a Smart Phone Trial in Dublin, Ireland. In Proceedings of the 96th Annual Meeting of the Transportation Research Board, Washington, DC, USA, 8–12 January 2017; pp. 8–12. [Google Scholar]
- Park, H.; Sanguinetti, A.; Castillo-Cortes, G. EcoTrips: Leveraging Co-benefits and Metaphorical Metrics in a Mobile App to Promote Walking and Biking for Short Trips. In Design, User Experience, and Usability: Designing Pleasurable Experiences; Springer: Berlin/Heidelberg, Germany, 2017; Available online: https://escholarship.org/uc/item/4wc8g5sm (accessed on 1 July 2021).
- Wu, S.; Bai, Q.; Sengvong, S. GreenCommute: An influence-aware persuasive recommendation approach for public-friendly commute options. J. Syst. Sci. Syst. Eng. 2018, 27, 250–264. [Google Scholar] [CrossRef]
- Campos-Sánchez, F.S.; Valenzuela-Montes, L.M.; Abarca-Álvarez, F.J. Evidence of green areas, cycle infrastructure and attractive destinations working together in development on urban cycling. Sustainability 2019, 11, 4730. [Google Scholar] [CrossRef] [Green Version]
- Ahmed, S.; Adnan, M.; Janssens, D.; Wets, G. A personalized mobility based intervention to promote pro-environmental travel behavior. Sustain. Cities Soc. 2020, 62, 102397. [Google Scholar] [CrossRef]


| App [Ref.] | Location | Method | Description | Relevant Findings |
|---|---|---|---|---|
| UbiGo [17] | Gothenburg (Sweden) | Pilot [n = 195, 6 months] | Payment platform, multimodal monthly pass (per family). Incentives for avoiding private car. Mobility agent. | Users (97%) wanted to continue with the service. 49% perceived cost savings. 44% reported less car use. |
| Smile [9] | Vienna (Austria) | Pilot [n = 200, 1 year] | Multimodal info, payment platform, and customer service. |
|
| UMAJI | Taipei (Taiwan) | In operation | Multimodal info, payment platform, multimodal monthly pass (bus, urban rail, public bike). | After the first three months: PT ridership increased 3.2% and 80% of initial users increased their use. |
| [33] | ||||
| Kaohsiung (Taiwan) | In operation | Multimodal info, payment platform, multimodal monthly passes oriented to two social segments. | After the first three months: 21% of users were motorized mode travelers and 15,492 packages were sold. | |
| MenGo | ||||
| — [13] | California (USA) | Survey [n = 1975] | Ride-hailing among millennials and Generation X people |
|
| DIDI [19] | China | Survey [n = 9762] | Ride-hailing (taxis and private car companies) and car-pooling (“hitching service”) service in operation. |
|
| Touring [16] | Ghent (Belgium) | Pilot [n = 90, 2.5 months] | Budget given to use several travel modes. Payment platform, not for all modes. | Clear reduction in car use (overall for daily commuting). Largely substituted by privately owned e-bike. |
| CMaaS [20] | (Sweden) | Pilot [n = 400, 6 months] | MaaS for a large company. Multimodal services and booking platform exclusively for employees. | 50% of users are willing to use car-sharing. Possible shift from car if good incentives are provided. |
| Tripi [7] | Sydney (Australia) | Pilot [n = 92, 4 months] | Payment platform and three different multimodal monthly passes (PT, Uber, taxi, car share, car rental). | Financial benefits are key. “Pay-as-you-go + payment platform” is not interesting. Multimodal monthly passes, reduced car use. |
| DriveNow [15] | Copenhagen (Denmark) | Survey [n = 1496, 2.5 years] | Free-floating car-sharing service, in operation since 2015. |
|
| Ref./Year Duration/N | App/Web | Strategies Implemented | Relevant Findings |
|---|---|---|---|
| [36]/ 2014–2016/ 3–4 months/ N = 900 | From5To4 (Web) Prototype | Feedback, badges, gamification, rewards, goals, social comparison, social competition, cooperation. |
|
| [37] /2015/ 6 months/ N = 3400 | Routecoach (App/web) Prototype | Tailoring, tunneling, suggestion, reduction, feedback, challenges. |
|
| [38]/2015/ 6 months/ N = 667 | BetterPoints (App/web) Prototype | Badges, rewards, challenges, notifications/messages, social comparison/competition, goals. |
|
| [39]/2016/ 3 months/ N = 64 | StreetLife1 (app) Prototype | Badges, rewards, social comparison and competition |
|
| [40]/2016/ 1 year/ N = 52 | GoEco! (app) Prototype | Tailoring, feedback, simulation, suggestion, tunneling, goals, encouraging messages, challenges, badges/rewards, social comparison |
|
| [41]/2017/ 13 weeks/ N = 207 | Bellidea (app) Prototype | Feedback, badges, rewards, challenges, social comparison and competition. |
|
Publisher’s Note: MDPI stays neutral with regard to jurisdictional claims in published maps and institutional affiliations. |
© 2022 by the authors. Licensee MDPI, Basel, Switzerland. This article is an open access article distributed under the terms and conditions of the Creative Commons Attribution (CC BY) license (https://creativecommons.org/licenses/by/4.0/).
Share and Cite
Casquero, D.; Monzon, A.; García, M.; Martínez, O. Key Elements of Mobility Apps for Improving Urban Travel Patterns: A Literature Review. Future Transp. 2022, 2, 1-23. https://doi.org/10.3390/futuretransp2010001
Casquero D, Monzon A, García M, Martínez O. Key Elements of Mobility Apps for Improving Urban Travel Patterns: A Literature Review. Future Transportation. 2022; 2(1):1-23. https://doi.org/10.3390/futuretransp2010001
Chicago/Turabian StyleCasquero, Daniel, Andrés Monzon, Marta García, and Oscar Martínez. 2022. "Key Elements of Mobility Apps for Improving Urban Travel Patterns: A Literature Review" Future Transportation 2, no. 1: 1-23. https://doi.org/10.3390/futuretransp2010001