1. Introduction
The rapid growth of e-commerce deliveries over the last decade is bringing about changes to the freight transportation sector. E-commerce retail sales in the U.S. represented 4% of the total retail sales in 2010, rising to 11.8% in 2020 [
1] and the rate of e-commerce adoption increased during the COVID-19 pandemic [
2] with a potential lasting effect. An increase in e-commerce-derived shipments leads to the “fragmentation” of shipments, since these shipments are smaller and spatially/temporally more spread out than conventional business-to-business (B2B) shipments [
3]. Moreover, express services for e-commerce deliveries [
4] and high return rates contribute to process inefficiencies and can lead to greater negative externalities, such as congestion and higher emissions. For example, in Germany, 77% of shoppers have returned products and one third of all distributors have average return rates of over 20%, partially due to incentives such as “free-of-charge” returns [
3].
Transportation modes that serve trips performed by individuals often have spare capacity, which can be used for freight. This concept is referred to by various terms, including cargo hitching [
5,
6], combined people-and-freight systems [
7], and short-haul integration [
8]. Examples of cargo hitching include using the spare capacity of public transportation, such as rail and bus, for replenishing the inventories of retail stores and using taxis or mobility-on-demand services to transport freight/parcels [
8]. Crowd logistics or crowd sourcing is another a type of cargo-hitching scheme. Its crux is the use of occasional carriers with spare capacity to perform some task (e.g., freight pickups/deliveries), or in other words, it involves outsourcing tasks originally performed by a company to a large pool of individuals [
7].
Cargo hitching offers a potential solution to deal with increased parcel delivery demand. In long-haul transportation, the joint use of passenger and freight modes is common, such as with airplanes and ferries. On the other hand, there are still limited examples of cargo hitching in urban environments. Van Duin et al. [
9] discussed a series of urban cargo hitching initiatives across Europe and in India. The authors highlight the promising benefits of cargo hitching, while they also point out the uncertainty about its long-term viability due to a lack of an understanding regarding viable business models. Recent real-world applications of cargo hitching came to the spotlight during the COVID-19 pandemic, where mobility-on-demand (MOD) services, provided both by transportation network companies (such as Uber, Lyft, Grab, etc.) and conventional taxis, were used to increase the capacity of logistics services to support grocery deliveries [
10,
11]. It is plausible that the MOD system is comparatively better suited to handling time-sensitive deliveries than conventional freight vehicle delivery tours. However, several questions, such as “how much freight can be moved by the MOD system with cargo hitching?” and “what are the potential impacts of cargo hitching on the level of service for passengers?” remain to be answered in the context of the viability concerns raised by Van Duin et al. [
9]. The critical challenge for cargo hitching is that it should not cause the quality of passenger services (travel and waiting times) to deteriorate [
8]. Furthermore, the acceptance of a delivery task is subject to specific factors relevant to the transporting and receiving parties [
12,
13,
14,
15]. The case can be made for a specific type of shipment, such as parcels, which are typically small, lightweight, and can be carried without special equipment. We use the term “parcel” to refer to shipments suitable for cargo-hitching services and focus on such shipments.
In this paper, we aim to partially address these questions by studying the application of cargo hitching to MOD vehicles using detailed microsimulation models of passenger and freight demand and network congestion/supply, exploring how operational assumptions and constraints, i.e., how shipments are assigned to MOD trips, influences passenger travel and dedicated freight-vehicle flows. We use the term MOD hereafter to refer to services provided for using single- and shared-ride taxi services.
This paper contributes to the existing literature on cargo hitching in the following respects:
- (1)
By applying an agent-based simulation framework to systematically investigate the impacts of cargo hitching from the perspective of passengers, carriers, and planners.
- (2)
By performing extensive simulations to understand how different assignment strategies of freight demand to MOD vehicles impacts the flow of freight and passengers.
The simulation framework includes the detailed modelling of MOD services on the demand/supply sides, explicitly capturing demand–supply interactions. Simulations are performed using a city-wide model of Singapore, yielding insights for both carriers, shippers, MOD operators, and planners.
2. Literature Review
This literature review focuses on the application of cargo hitching to taxis and MOD services, although there are other application domains for cargo hitching, such as applications involving users of public transport [
16,
17,
18,
19] or private cars [
13,
20]. Moreover, we focus on business-to-consumer flows, despite the existence of research on reverse freight flows, such as returned parcels [
21]. Our focus on the application of pairing parcels and MOD is due to the rise in e-commerce, MOD, and express shipping services (e.g., Grab Express, Uber Connect, GoSend, and DiDi Delivery).
Li et al. [
22] introduced a new class of models, termed the share-a-ride problem (SARP), which extends the classical dial-a-ride problem (DARP) formulation to the case where people and parcels are transported by a fleet of taxis with passenger priority. Solution algorithms are proposed for two cases, the first where passengers and parcels are considered simultaneously, and the second where freight is inserted into pre-computed passenger travel routes. The authors use synthetic freight data in a San Francisco case study, and their results highlight the influence of the spatial distributions of requests on fleet performance (and thus profitability), with sharing strategies being fitted for denser urban areas. Nguyen et al. [
23] demonstrated the benefits of sharing by applying two matching algorithms for deploying taxis serving passengers and parcels with the objective of finding valid service options that achieve maximum profit. The authors considered a static case where all demand is known in advance under a direct-demand-serving strategy and a shared-ride strategy. The study shows that, even when a match rate is small (about 8%) in a shared-ride strategy, there are some savings compared to the direct-demand service across a range of indicators, such as cost, travel distance, and the number of taxis required to move parcels. However, no comparison with the case in which freight is served by conventional vehicles is provided. Chen et al. [
24] presented a method to explore the potential for chained taxi trips to move parcels, with stopovers at package interchange stations, which are 24-h convenience stores. Their case study used synthetic freight demand in Hangzhou, China. Taxis were assigned exclusively to parcel movements during off-peak hours and before passenger pickup and after passenger drop-off. Furthermore, the authors mentioned that incentives were required for taxi drivers to participate in the initiative, which might limit the practical feasibility of this proposed solution. Najafabadi and Allahviranloo [
25] developed an algorithm to match taxis and delivery requests in a real-time dynamic setting, aiming to minimize distance travelled, transportation cost, and the number of vehicles used. They used parcel delivery demand estimated based on a household travel survey. Benefits were identified for some scenarios; however, in these scenarios, passenger travel times increased by 8% to 13% but have inversely proportional cost savings due to the sharing setting.
In summary, there are several gaps in existing studies in the context of a systematic evaluation of cargo hitching. First, they do not explicitly compare the performance of the cargo-hitching service against the case where e-commerce demand is served by dedicated freight vehicles. This is crucial in order to understand the broader impacts on network congestion, emissions, and the environment. Moreover, such a comparison requires demand and supply models that replicate the spatial-temporal characteristics of passenger and freight demand. Parcels are typically transported in multi-stop delivery tours rather than in dedicated trips, which can influence the relative performance of freight vehicles. Second, existing studies do not realistically model network congestion, nor do they examine the impacts on network performance. The latter can be explored from the perspective of the transportation planner or the passengers, both of which are important aspects of the cargo-hitching service that warrant investigation.
We attempt to address these gaps by carrying out a systematic evaluation of cargo hitching, using detailed agent- and activity-based models of passenger and freight demand and supply that realistically represent passenger and freight flows. We consider a set of realistic scenarios regarding the assignment of parcels to the MOD vehicles, such as only using MOD vehicles when the freight demand does not compete directly with the passenger demand, or sharing a ride but picking up the parcel before the passenger and dropping it off after the passenger alighted. These could be viewed as additional constraints (in addition to passenger priority) employed to ensure that passenger service does not significantly deteriorate.
3. Simulation Framework
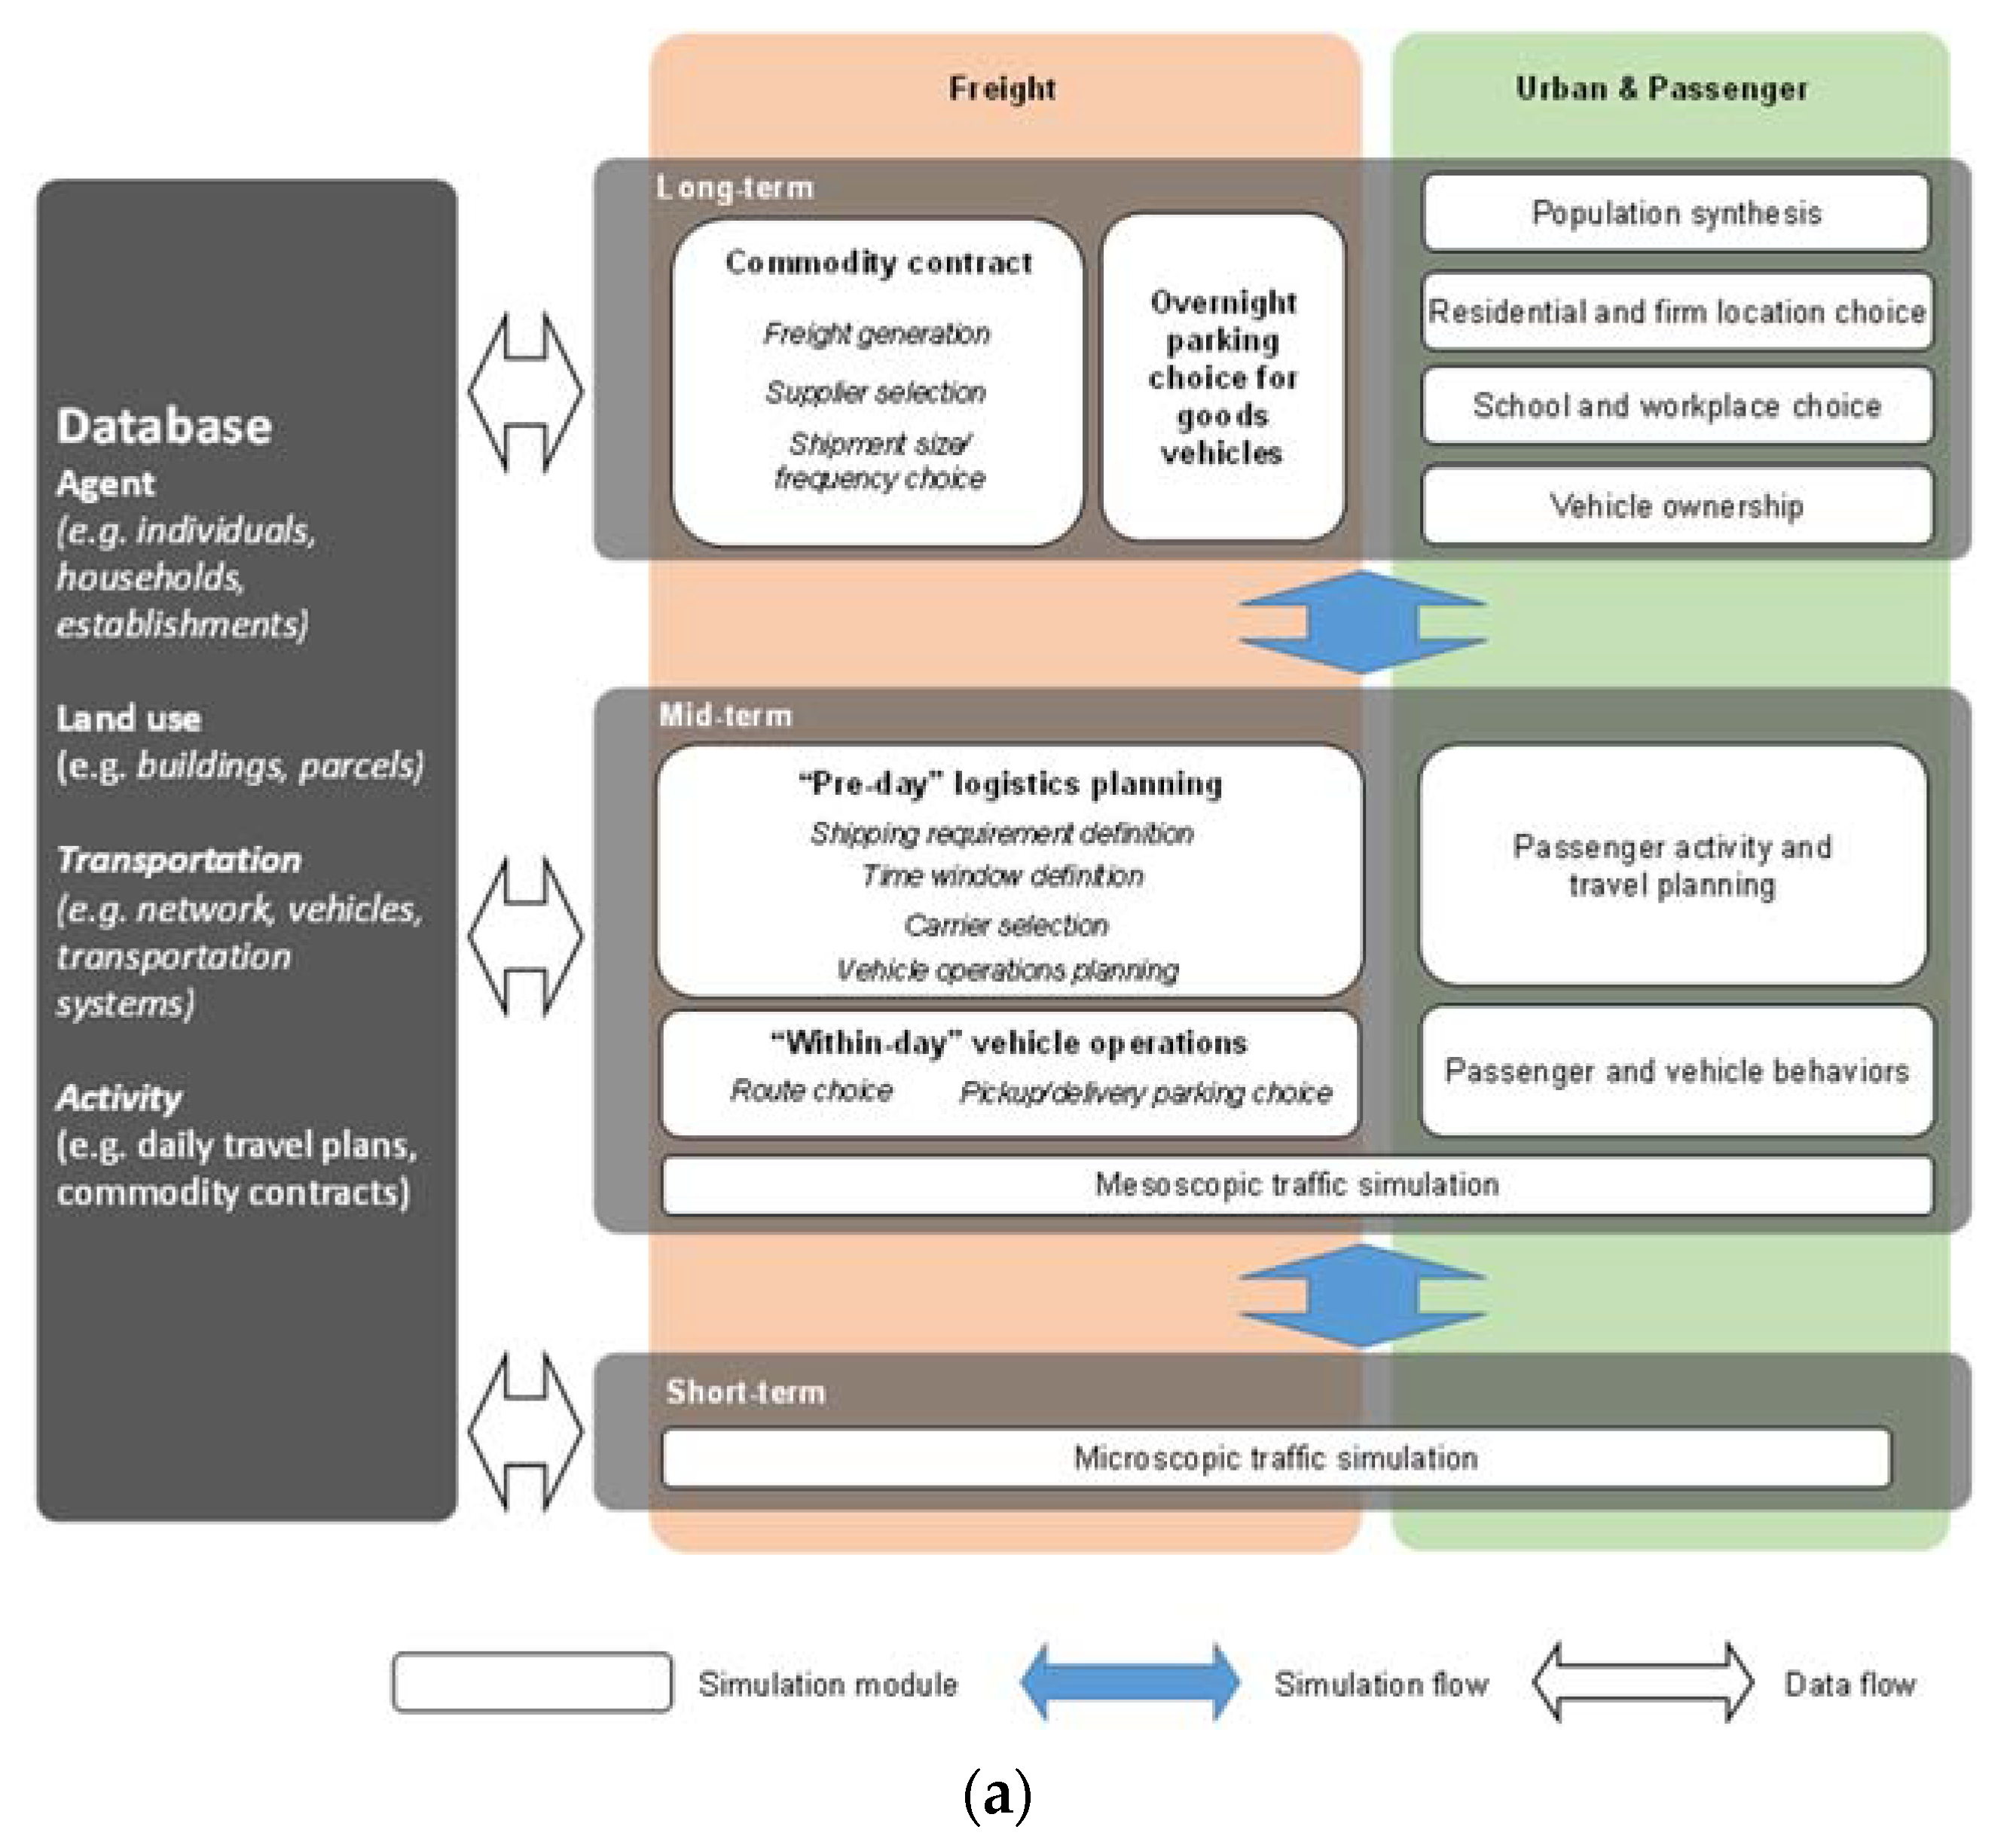
The evaluation of the network-wide impacts of cargo hitching requires a high-fidelity simulation framework that models freight and passenger demand, supply, and their interactions. We use an agent- and activity-based simulation platform called SimMobility, which integrates disaggregated behavioral models at multiple time scales in a consistent and coherent manner, and simulates both urban freight and passenger travel and activity patterns [
26,
27]. The overall framework of the SimMobility platform is shown in
Figure 1a, which consists of freight and passenger simulators organized into three models: long-term, mid-term, and short-term models.
The long-term model captures land use and economic activity as they are related to a set of longer-term decisions (residential choice, workplace choice), which are more stable in time [
28,
29]. Households and individuals are considered as well as businesses (i.e., commodity flows [
30]), including the overnight parking choices of freight vehicles [
31].
Figure 1.
Simulation platform. (
a) Framework of SimMobility (modified from [
32]). (
b) SimMobility, mid-term model.
Figure 1.
Simulation platform. (
a) Framework of SimMobility (modified from [
32]). (
b) SimMobility, mid-term model.
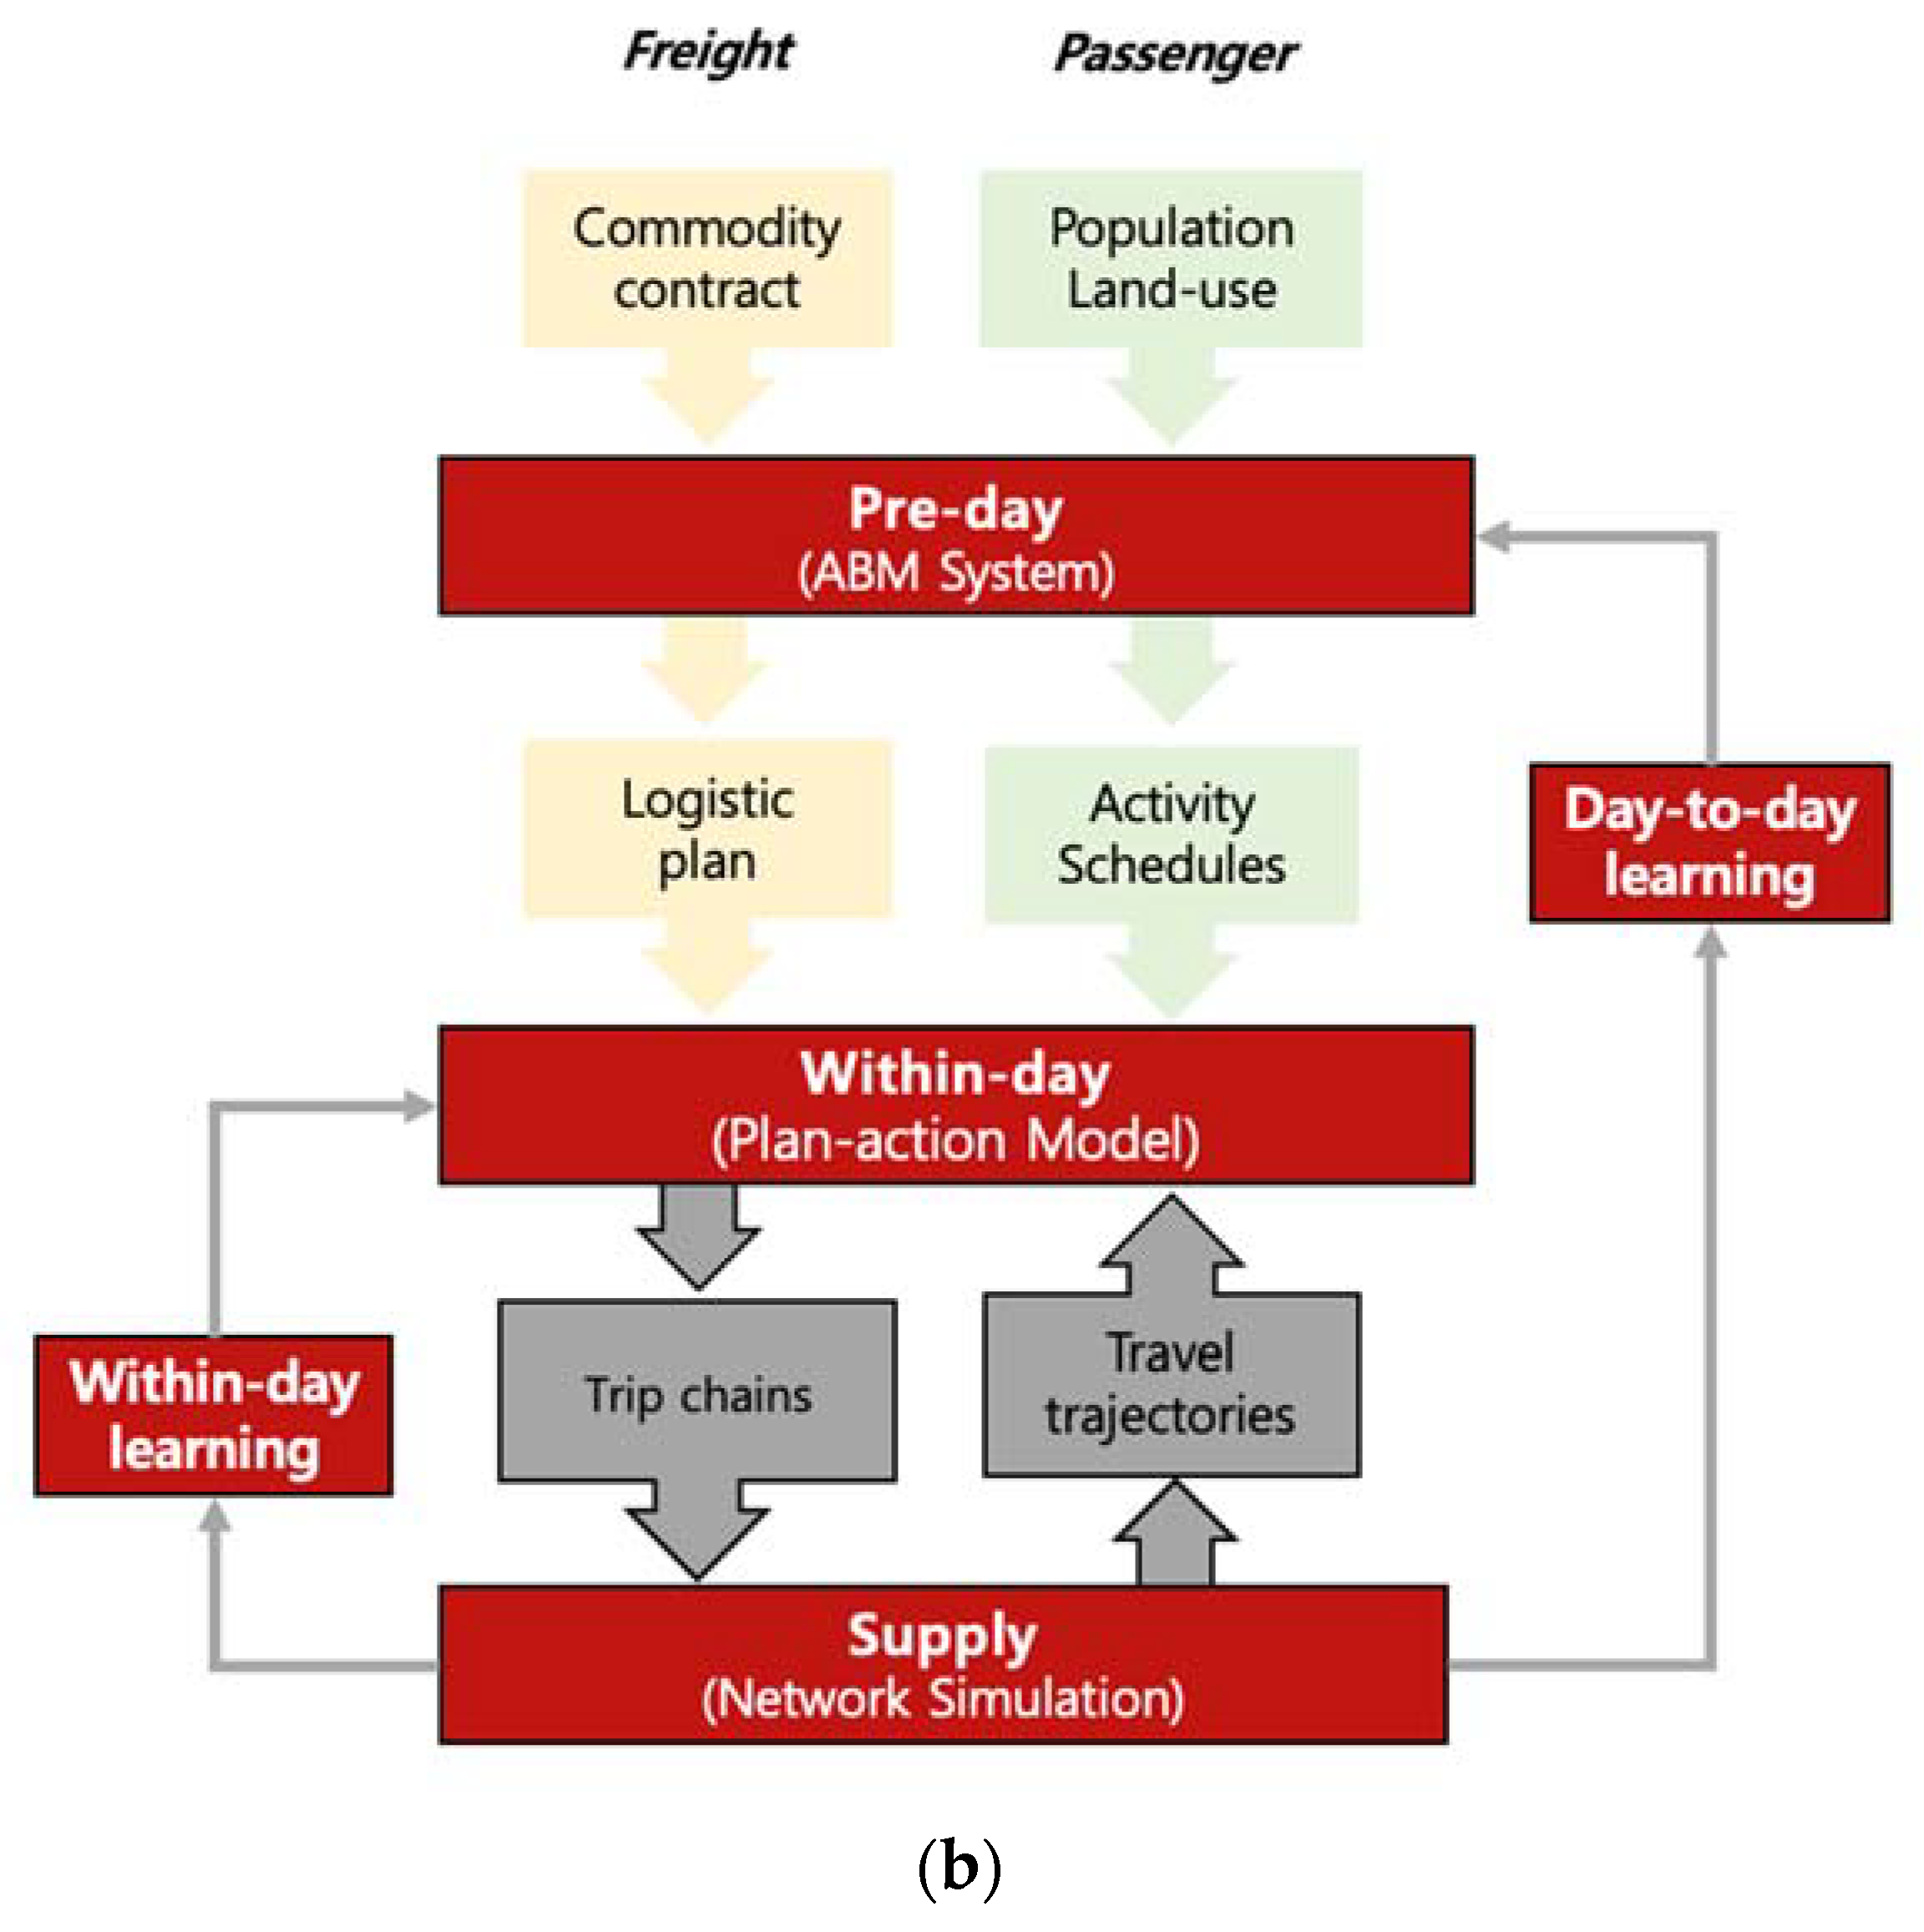
The mid-term model simulates passenger and freight mobility patterns for an average day through three components: the pre-day, within-day, and supply components (see
Figure 1b). On the passenger side, the pre-day component simulates individual activities and travel patterns using an activity-based demand model. The activity and travel plans are then executed in the within-day and supply components. The within-day component simulates departure time and route-choice decisions, as well the response of travelers to information and other events, following which the supply component simulates their movement on a multimodal network using a mesoscopic traffic simulator. The supply component also includes explicit models of fleet operators, termed controllers. On the freight side, the pre-day component simulates logistics planning decisions that generate the vehicle tours of carriers, whereas the within-day component simulates freight vehicle operations, such as route choice and pickup/delivery parking choice [
32]. The detailed tours and movements of the freight vehicles, together with the passenger movements, are then simulated on the network using the mesoscopic traffic simulator at the supply level. The details of the mid-term model are available in Lu et al. [
33]. The mid-term model was also used in past studies [
34,
35,
36]. We describe the part of the model relevant to this research in
Section 3.
Finally, the short-term model is a traffic micro-simulator, simulating network performance at a granularity of milliseconds through behavioral models of vehicle movement. It also models traffic control and management systems, as well as communication networks. Azevedo et al. [
37] provide the details of the model.
In this paper, we primarily use the mid-term model, whose components are described in more detail next.
3.1. Mid-Term Pre-Day Component
As noted previously, the pre-day module generates transportation demand for passenger and freight in the form of detailed activity schedules. On the passenger side, the pre-day model is an activity-based model system that uses the day-activity schedule approach [
38]. The activity-based model system is formulated as a hierarchical series of logit and nested-logit discrete choice models organized into three levels: the day-pattern level, the tour level, and the intermediate stop level. Bottom-level decisions are conditional on top-level decisions, and the levels are related through logsums (expected maximum utility). The day-pattern level predicts the occurrence of tours, which are anchored around primary activities and intermediate stops (i.e., secondary activities) of various purposes (including work, education, shopping, and other). The tour level then predicts the details of each tour generated at the day-pattern level, specifying tour characteristics, such as the start time and end time of the primary activity, activity location, and travel mode. Following this, the stop level generates the intermediate stops for each tour and specifies the details of each intermediate stop (including location, duration, and mode). The various levels in conjunction determine a detailed travel and activity pattern or schedule for everyone in the population [
39].
A similar type of schedule is constructed for each freight vehicle, with activities consisting of pickups, deliveries, and/or overnight parking. On the freight side, the pre-day component handles the conversion of shipment demand to vehicle tours. It is a system of models that simulates shipping requirement definition, time-window selection, carrier selection, and vehicle operation planning. These models take as inputs a list of commodity contracts (i.e., selling and purchasing policies), which include the information concerning the commodity type, shipper–receiver pairs, delivery frequency and weight, and provides a shipment list to be handled in an average day. Carrier selection is modeled using a multinomial logit model that considers the travel distance from the supplier and the carrier. Further, a distinction is made between carriers that deal with parcel and non-parcel shipments. Vehicle operation planning is performed at the carrier level, assigning shipments to vehicles, and forming tours. The output—vehicle operation plans (VOPs)—include details such as planned stop locations, arrival and departure times, and stop purposes (overnight parking, pickup, or delivery). These plans, outlining vehicle tours, are used as the inputs for a mesoscopic traffic simulation. Note that the pre-day models were initially designed to deal with B2B shipments, whereas, for this paper, we simulate scenarios that also consider business-to-consumer (B2C) shipments. The generation of B2C shipments is described in
Section 4.1 and
Section 4.2. When no cargo-hitching service is in place, the B2C shipments are added to the B2B demand pool, which is assumed to be exclusively transported by businesses defined as parcel carriers. In contrast, when a cargo-hitching service is operating, the B2C shipments are handled by the MOD service to the maximum extent possible, and otherwise by parcel carriers.
3.2. Mid-Term Within-Day and Supply Components
The pre-day component described previously generates activity schedules for both passenger and freight, which are translated into actions in the within-day and supply components using a plan–action approach [
40]. Specifically, on the passenger side, the within-day component includes models of departure time choice, route choice, and mode shift/re-scheduling models in response to real-time information. On the freight side, the within-day component includes models of route choice and pickup/delivery parking choice. Following this, the supply module simulates the trajectories of passengers and freight vehicles on an integrated multi-modal network. The supply component includes a mesoscopic traffic simulator, which models traffic dynamics using a combination of macroscopic speed–density relationships and a deterministic queuing model, and together capture spill-back effects and the dynamics of congestion propagation and dissipation on the network [
34]. The mesoscopic traffic simulator is integrated with controllers that replicate the operation fleet managers (bus, train, and mobility on-demand services).
The controller for MOD, termed the smart mobility service controller (SMS controller) simulates all relevant aspects of the operations of an on-demand service (including processing requests, assigning vehicles to requests, dispatching, routing, and rebalancing). More specifically, passengers send ride requests in the form of an origin and destination. The SMS controller processes these requests periodically during the simulation and performs vehicle assignments for the individual requests online (i.e., customer demand is not known a priori). For the matching of requests to vehicles, an insertion heuristic is used, which maintains a schedule for each vehicle and attempts to insert incoming requests into the existing schedules of nearby vehicles within a pre-specified search radius equal to 5 km, to ensure that waiting times and travel times of all passengers are within pre-defined thresholds (15 min for maximum wait/travel times). More details of the matching heuristic may be found in [
39,
41,
42]. Minor modifications are made to the matching heuristic to model the cargo-hitching service. We defer this discussion to
Section 4.2, where additional assumptions underlying the cargo-hitching service and the various scenarios are described. Finally, additional actions of the controller include rebalancing idle vehicles (i.e., to zones of higher demand) or directing these vehicles to suitable parking or holding locations.
3.3. Demand–Supply Interactions
The interactions between demand and supply are explicitly considered through two iterative learning mechanisms, day-to-day and within-day learning, which involve performing several iterations (or runs) of the pre-day, within-day, and supply simulations to achieve consistency (or equilibrium) between demand and supply, measured by the travel time and waiting time discrepancies (expected vs. realized), which must lie within a pre-specified tolerance level. A simple method of successive averaging of the travel time and waiting times is used in the iterative process to achieve consistency.
4. Experimental Design
This section details the SimMobility application to the city-state of Singapore, the simulation setup, the scenarios, and the metrics used to quantify system changes.
4.1. Application to Singapore
The simulations of cargo hitching are performed by applying SimMobility to a future scenario of Singapore in 2030. The synthetic population of Singapore for 2030 (6.7 million individuals) was generated using a Bayesian approach [
43] based on socio-economic data, land-use data, and relevant control totals (see [
29] for details on the population synthesis). The pre-day demand model for 2030 relies on a calibrated, activity-based model system for the year 2012 (that matches observed tour/stop generation rates, activity shares, and modes closely) estimated using household travel survey data [
33,
39]. This model was enhanced with the MOD modes by assuming a similar utility specification of taxis and by calibrating relevant alternative specific constants and scale parameters of the mode and mode–destination choice models against aggregate data on the usage of single-ride and shared-ride MOD modes [
42]. The calibration and validation also included matching simulated outputs to observed screen-line counts, public transit smart card data, and network travel times (for more details on the model calibration, the reader is referred to Oh et al. [
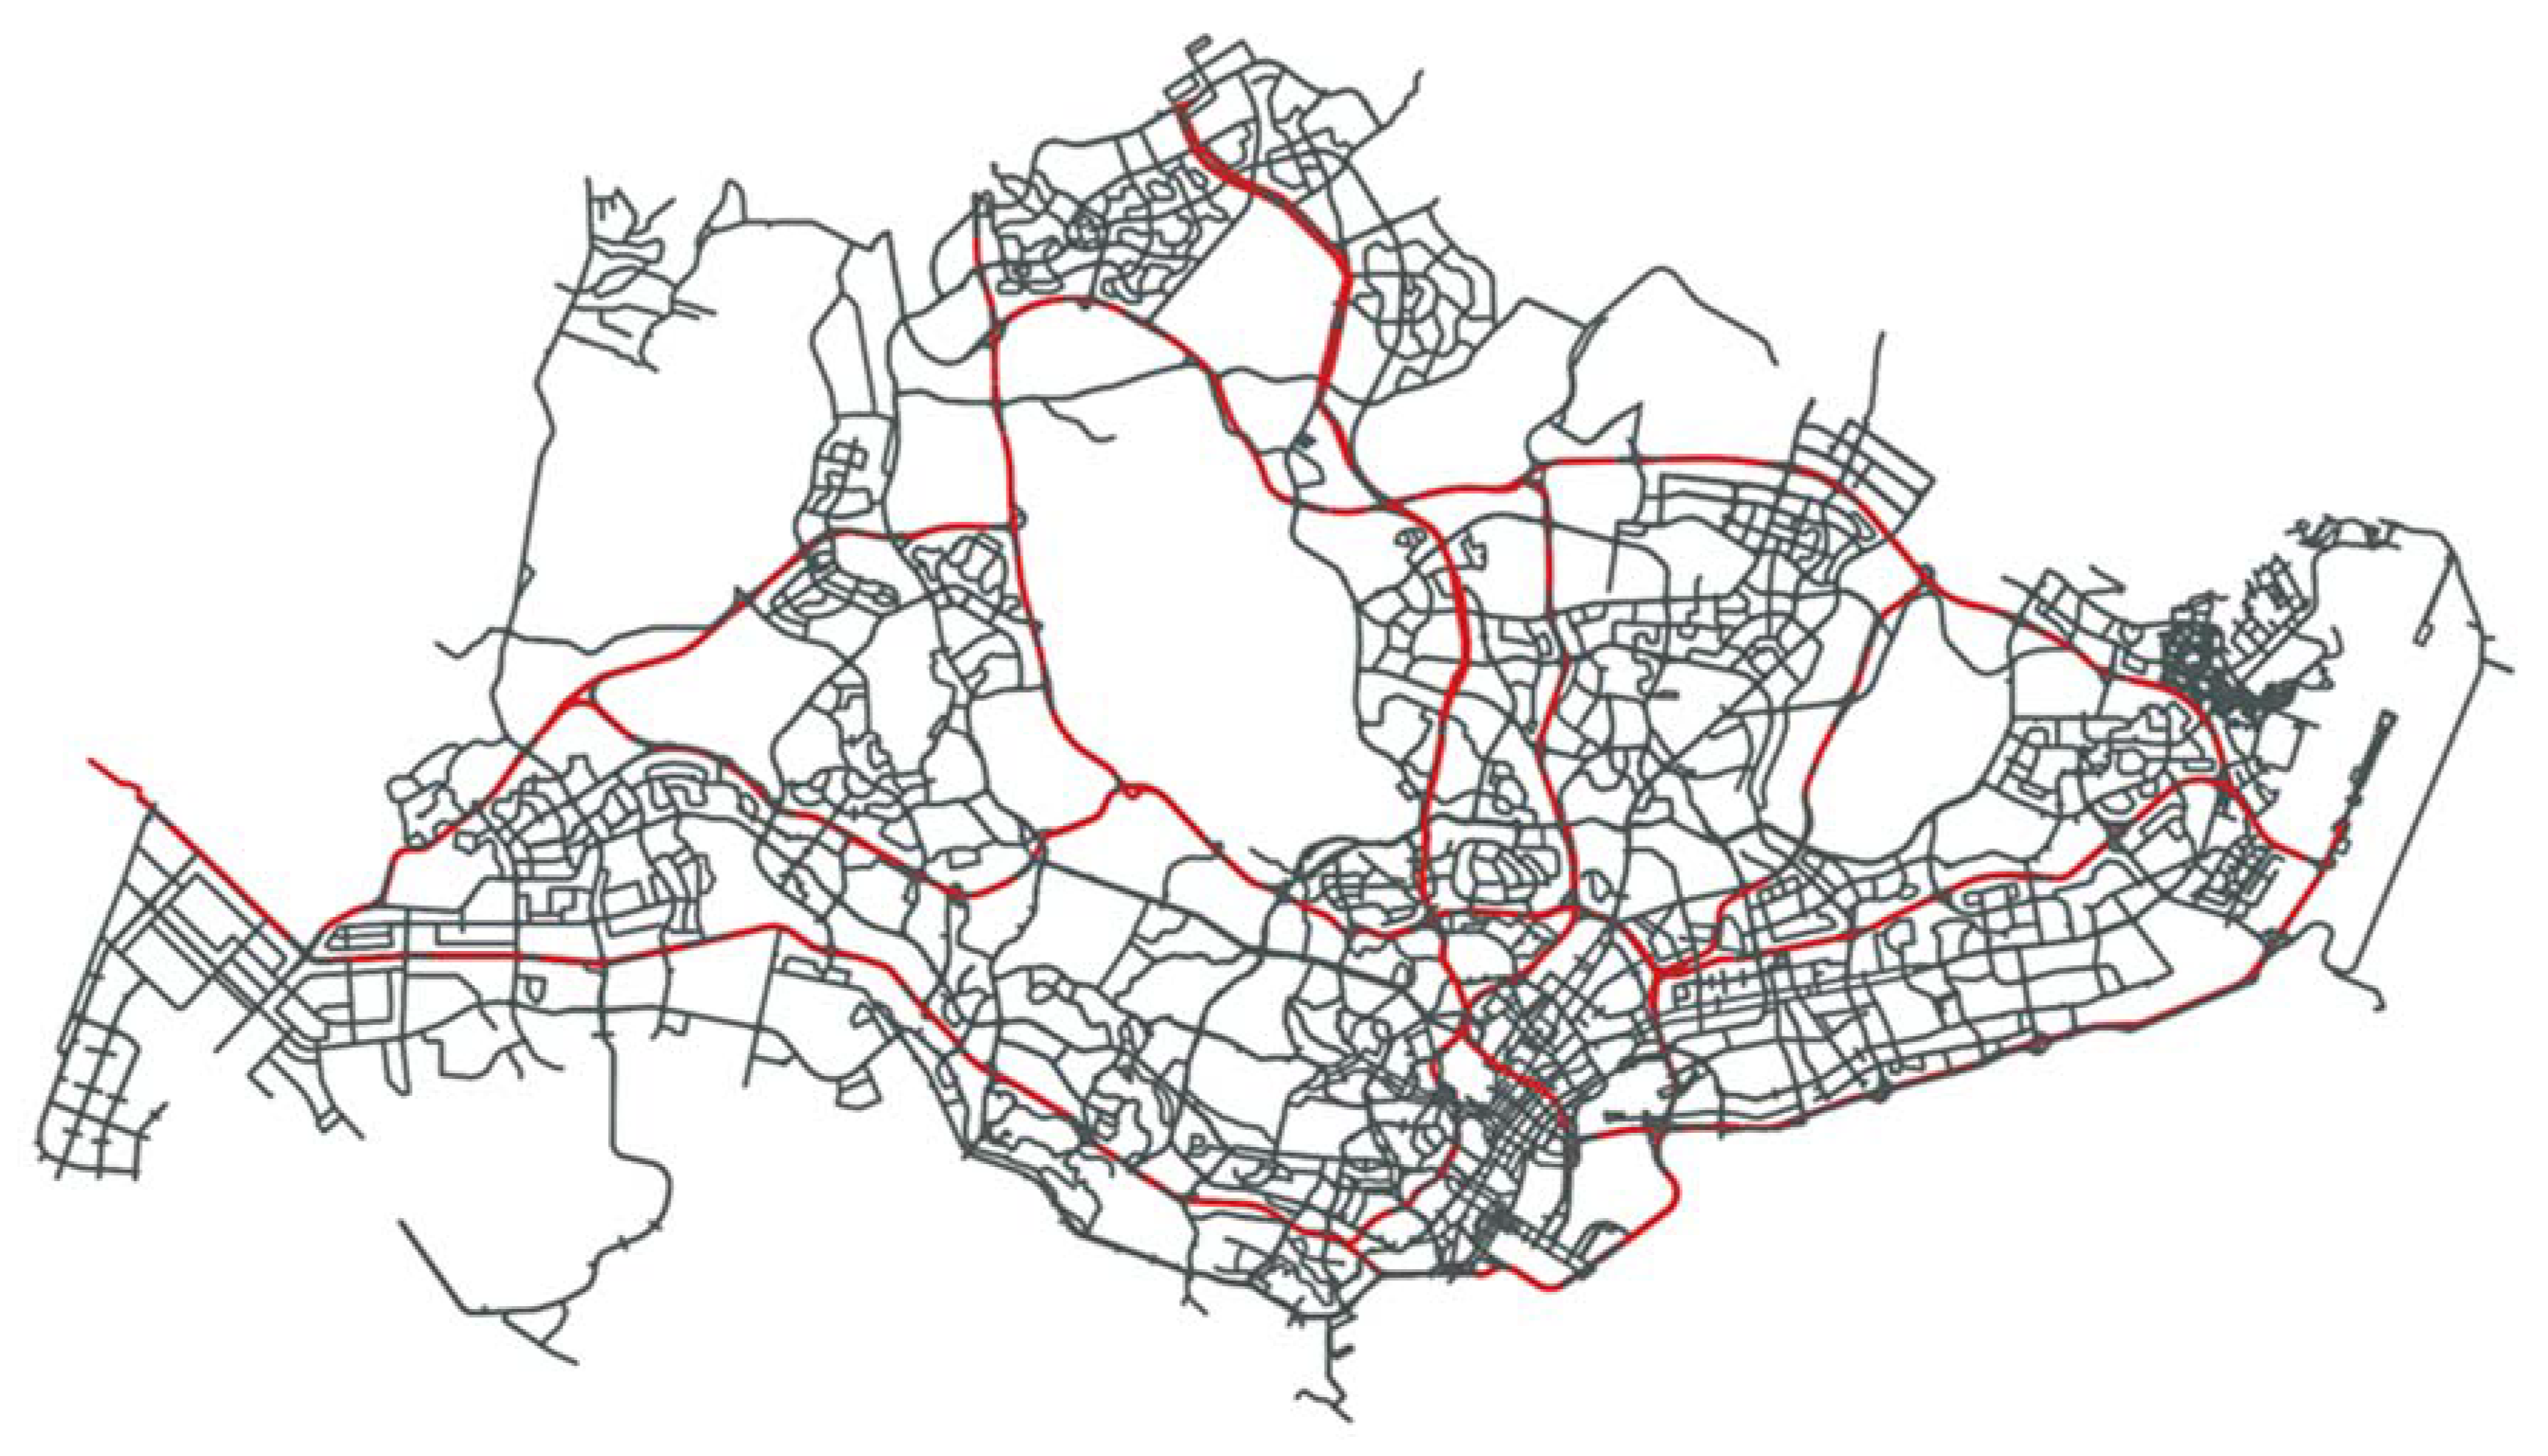
39]). The freight model is calibrated against 2012 screen-line traffic count data, applied to the predicted presence of business establishments in 2030, considering land-use plans and employment growth as well as available vehicle fleets. The road and transit networks of the year 2030 in Singapore consist of 1169 zones, 6375 nodes, 15,128 links, 730 bus lines covering 4813 bus stops, and 26 MRT (rail) lines over 186 stations. The road network is shown in
Figure 2. The generation of the parcel demand is described later in
Section 4.1.2.
4.1.1. Passenger Demand and Supply
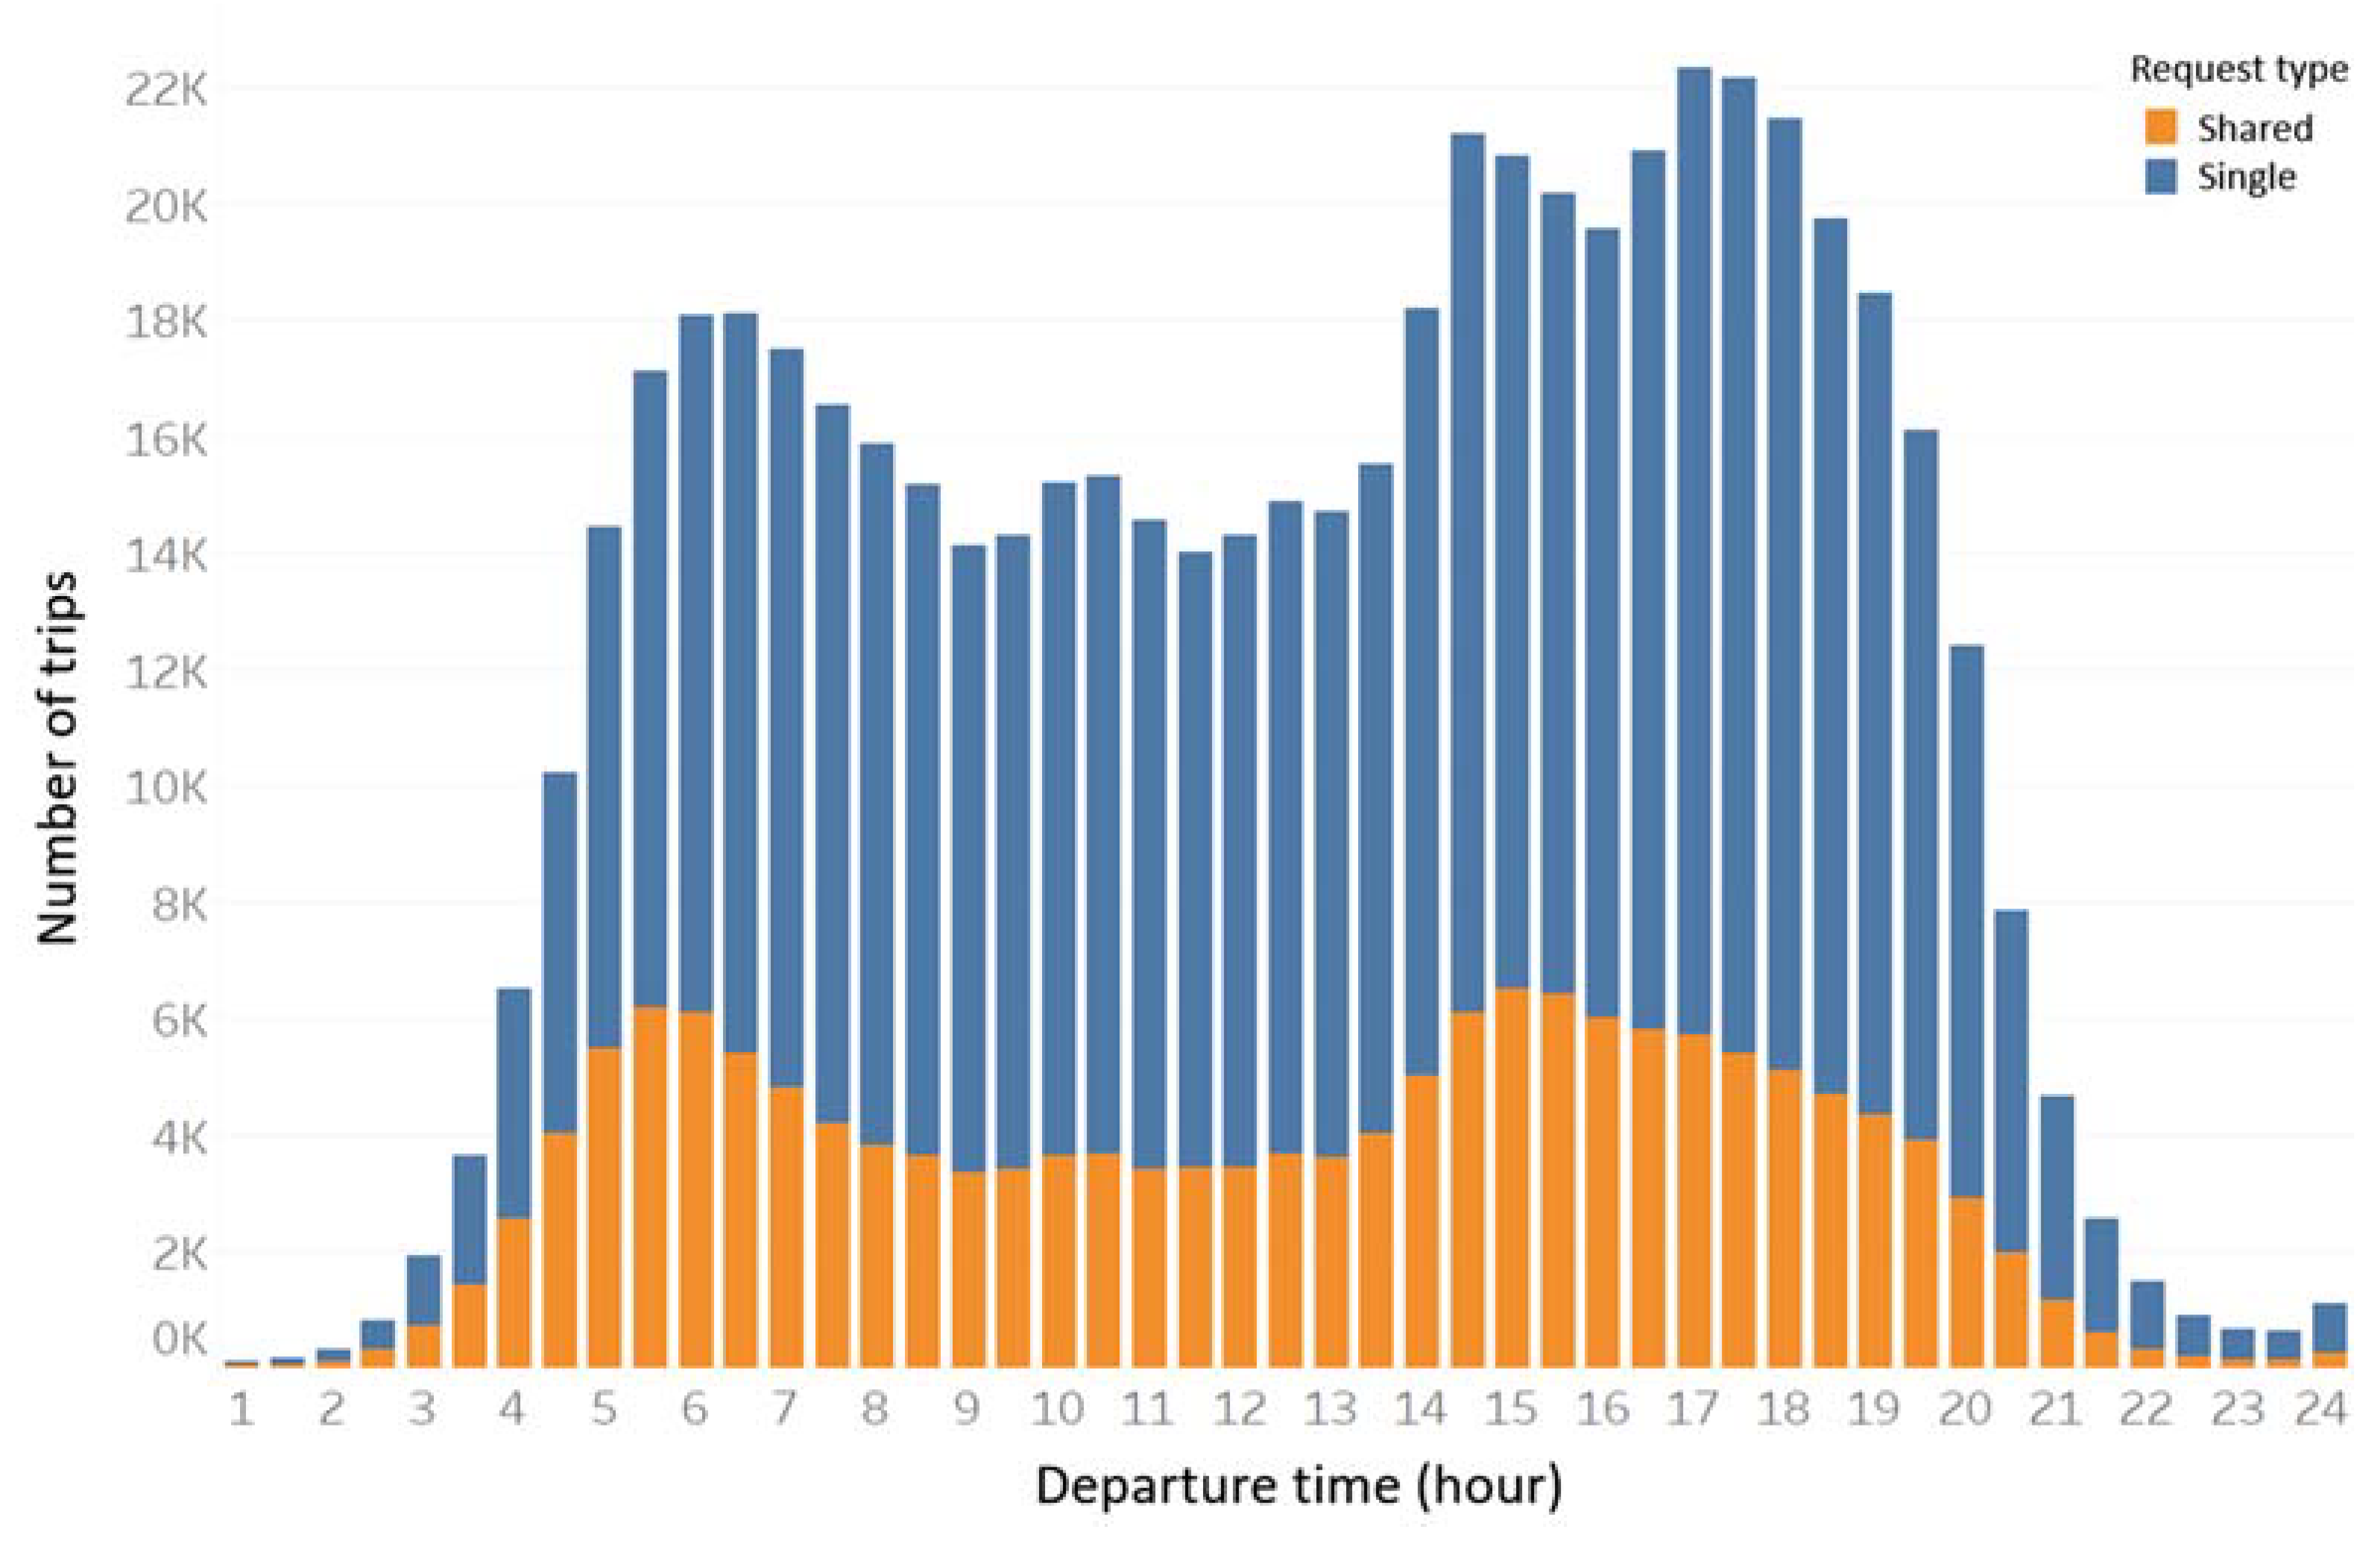
Table 1 summarizes the passenger demand by mode for 24 h, as reflected in the simulation. Accordingly, the total number of passenger trips is 8,991,057 for various activities such as work, education, shopping, and ‘other’. Of these, 21% are private vehicle trips by car and taxi, while public transit trips make up 48.5% by bus and/or MRT. Note that passengers have access to the MRT station by foot, bus, or MOD. Regarding the on-demand services, the passenger demand for MOD is composed of 576,786 trips over the 24-h period (a mode share of 6.4%). The temporal distribution of MOD demand is shown in
Figure 3. It shows a typical commuting pattern with demand surges in the morning and afternoon peak periods. Requests for shared rides represent 27% of total MOD requests. For details of the mode choice models, we refer the readers to Oh et al. [
39]. The average travel times and distances for MOD single and shared rides are 13 min/12 km and 17 min/15 km, respectively.
4.1.2. B2B and B2C Shipments
The SimMobility version used for this experiment simulates B2B shipments. Our models have been calibrated against traffic counts. For the purposes of this paper, we have generated a set of same-day parcel deliveries (B2C shipments) which are added to our base demand composed of B2B movements. A maximum of 67,000 same-day parcel deliveries were generated. They are equivalent to 34% of total present-day daily e-commerce delivery demand [
44], 12% of the total MOD requests, and 43% of the total shared MOD requests in the simulation setting. This demand was defined using preliminary simulations which determined that 67 K is the maximum B2C demand that can be satisfied (the fleet of MOD vehicles is fixed) under the cargo-hitching scenarios we considered. Leftover demand, which occurs for one scenario, is assumed to be handled by conventional freight vehicles, since it is assumed that all the B2C demand is to be served in the same day. Moreover, we note that this experiment does not explicitly model other types of B2C deliveries, such as ready-to-eat food deliveries. We acknowledge that these would add to the total demand but nonetheless remain constant across scenarios.
Parcel demand is obtained by randomly sampling delivery requests from e-commerce delivery records of an anonymous large parcel delivery carrier in Singapore. Data were collected for the year of 2019, with the sample covering around 1 month of delivery records. Packages ranged in size, with a maximum of up to 50 cm
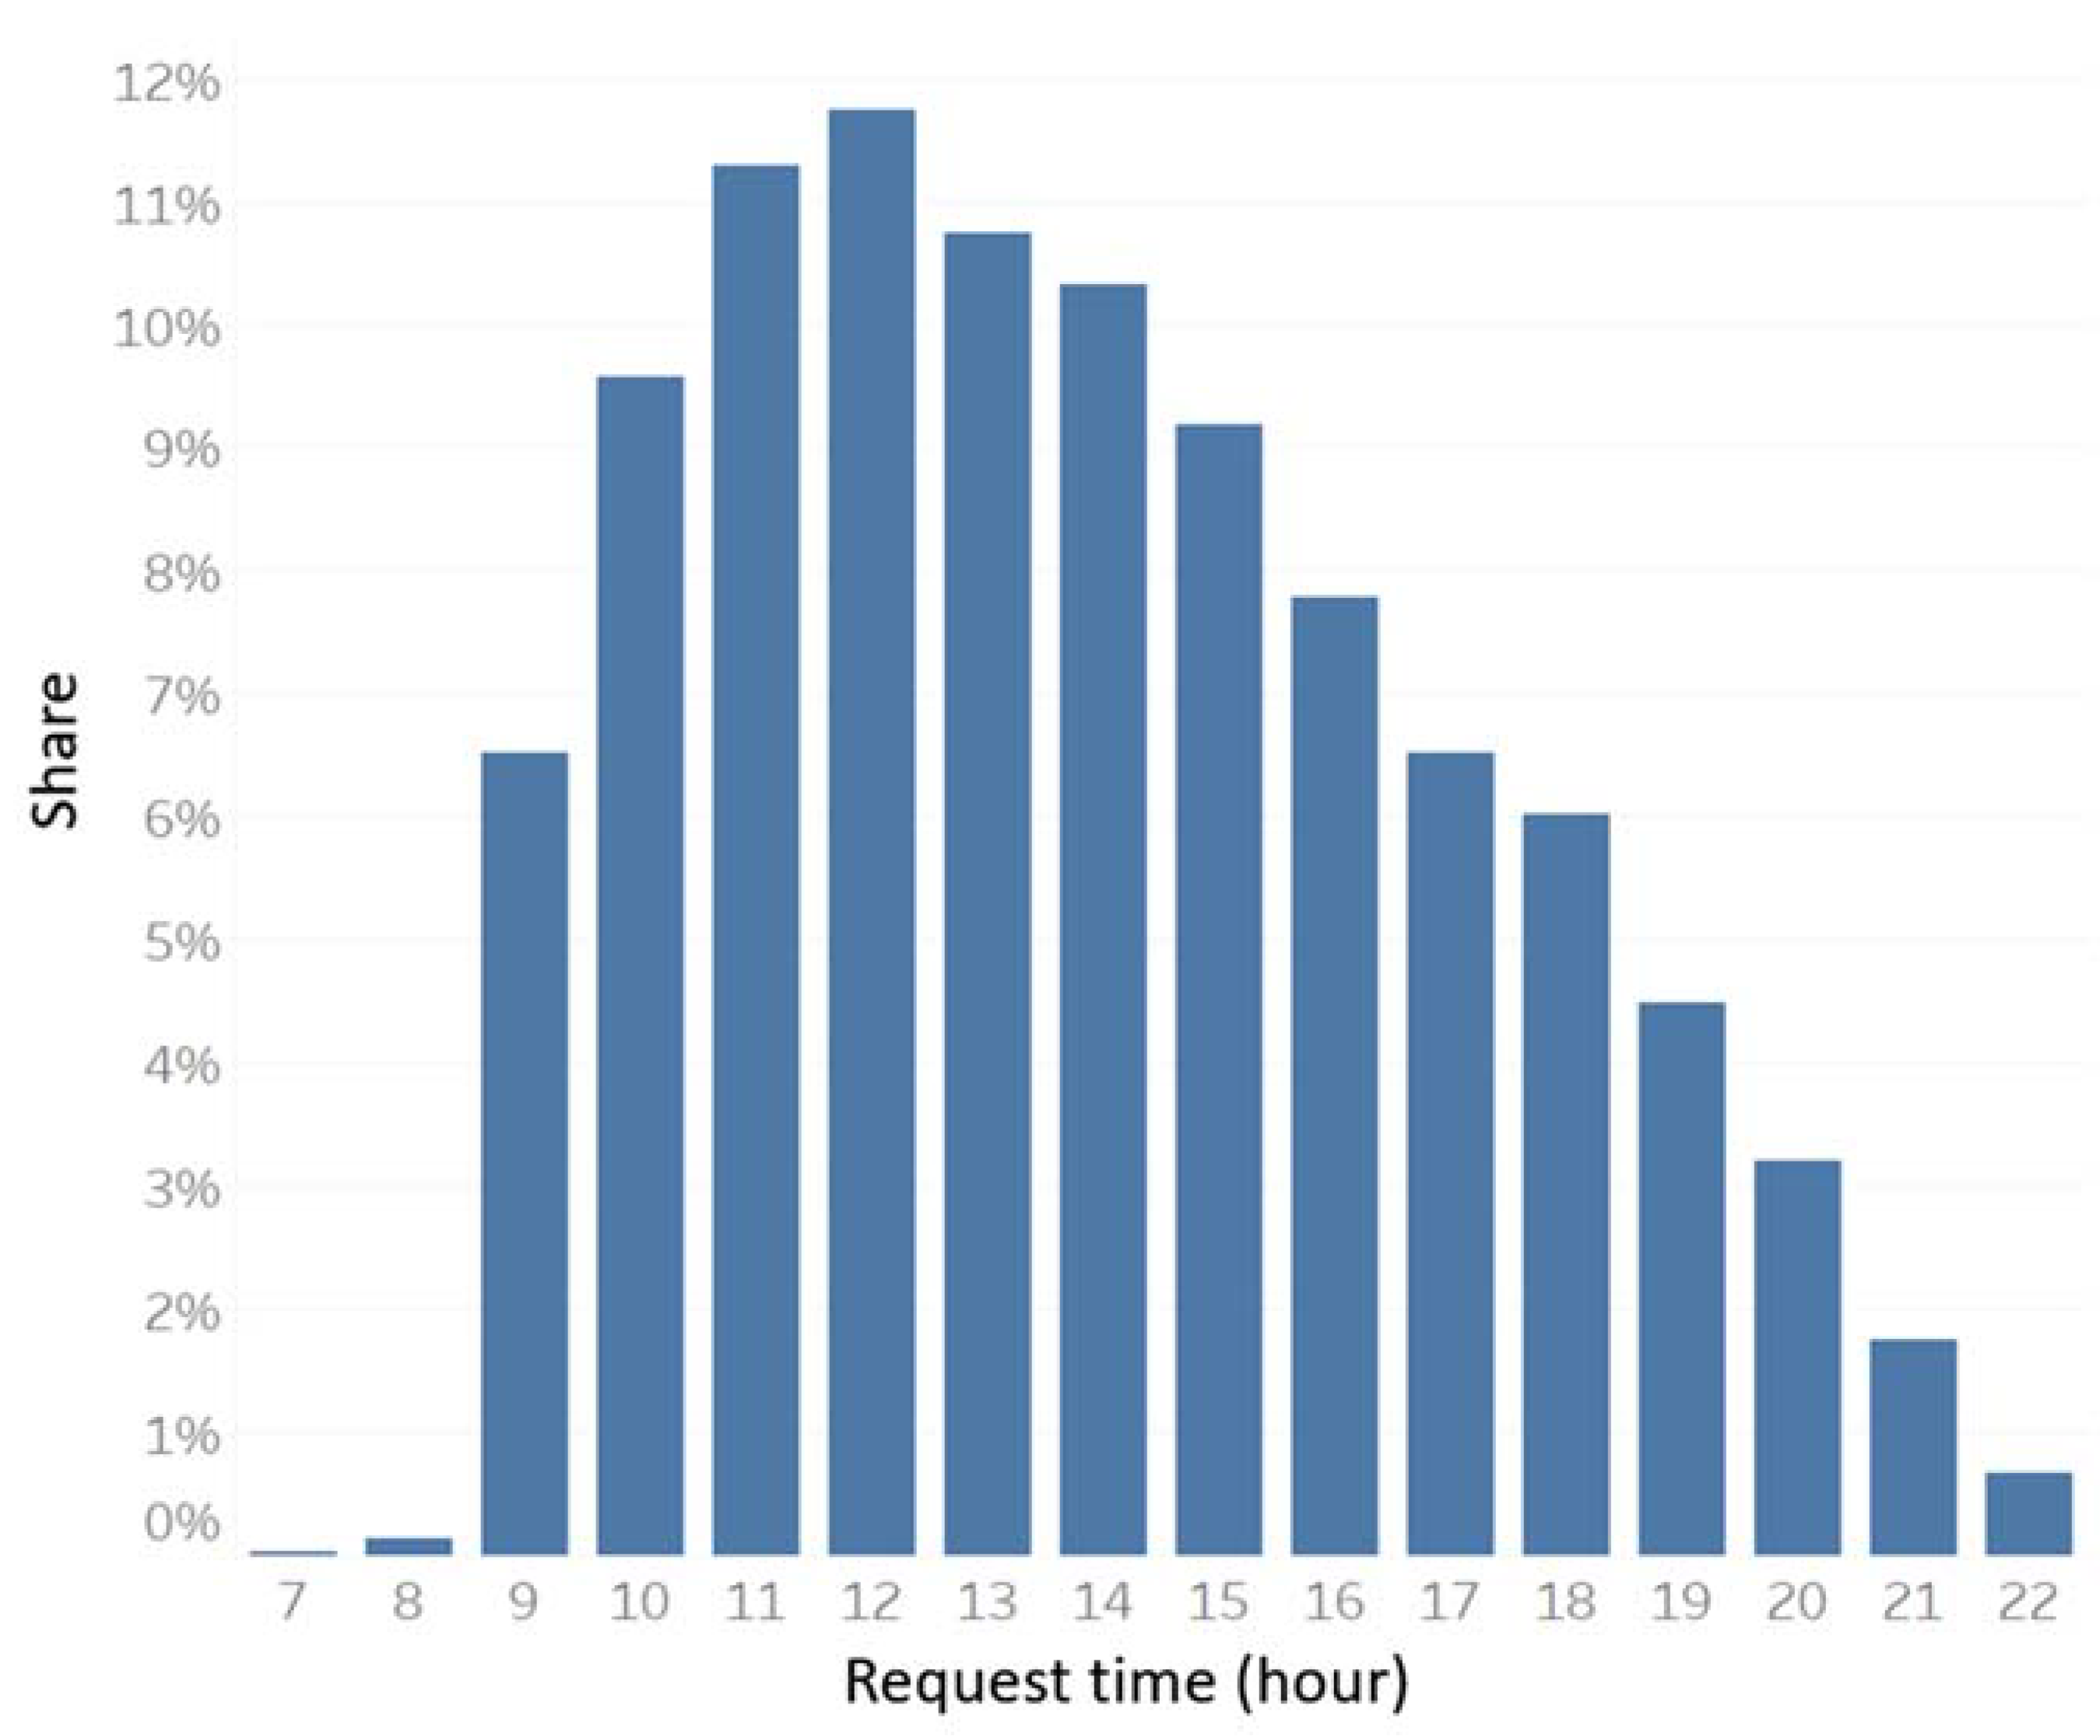
3 boxes. Sampling took place for the spatial (i.e., origin, destination) and temporal (i.e., delivery time) attributes of the shipments, while the generated parcel demand was validated to be representative and empirically reasonable with regards to the spatial and temporal distribution of demand. The information about the delivery time-windows is lacking in the records. Thus, we assume that the realized delivery time is the request time. The assumed temporal distribution of parcel requests to the MOD vehicles is shown in
Figure 4.
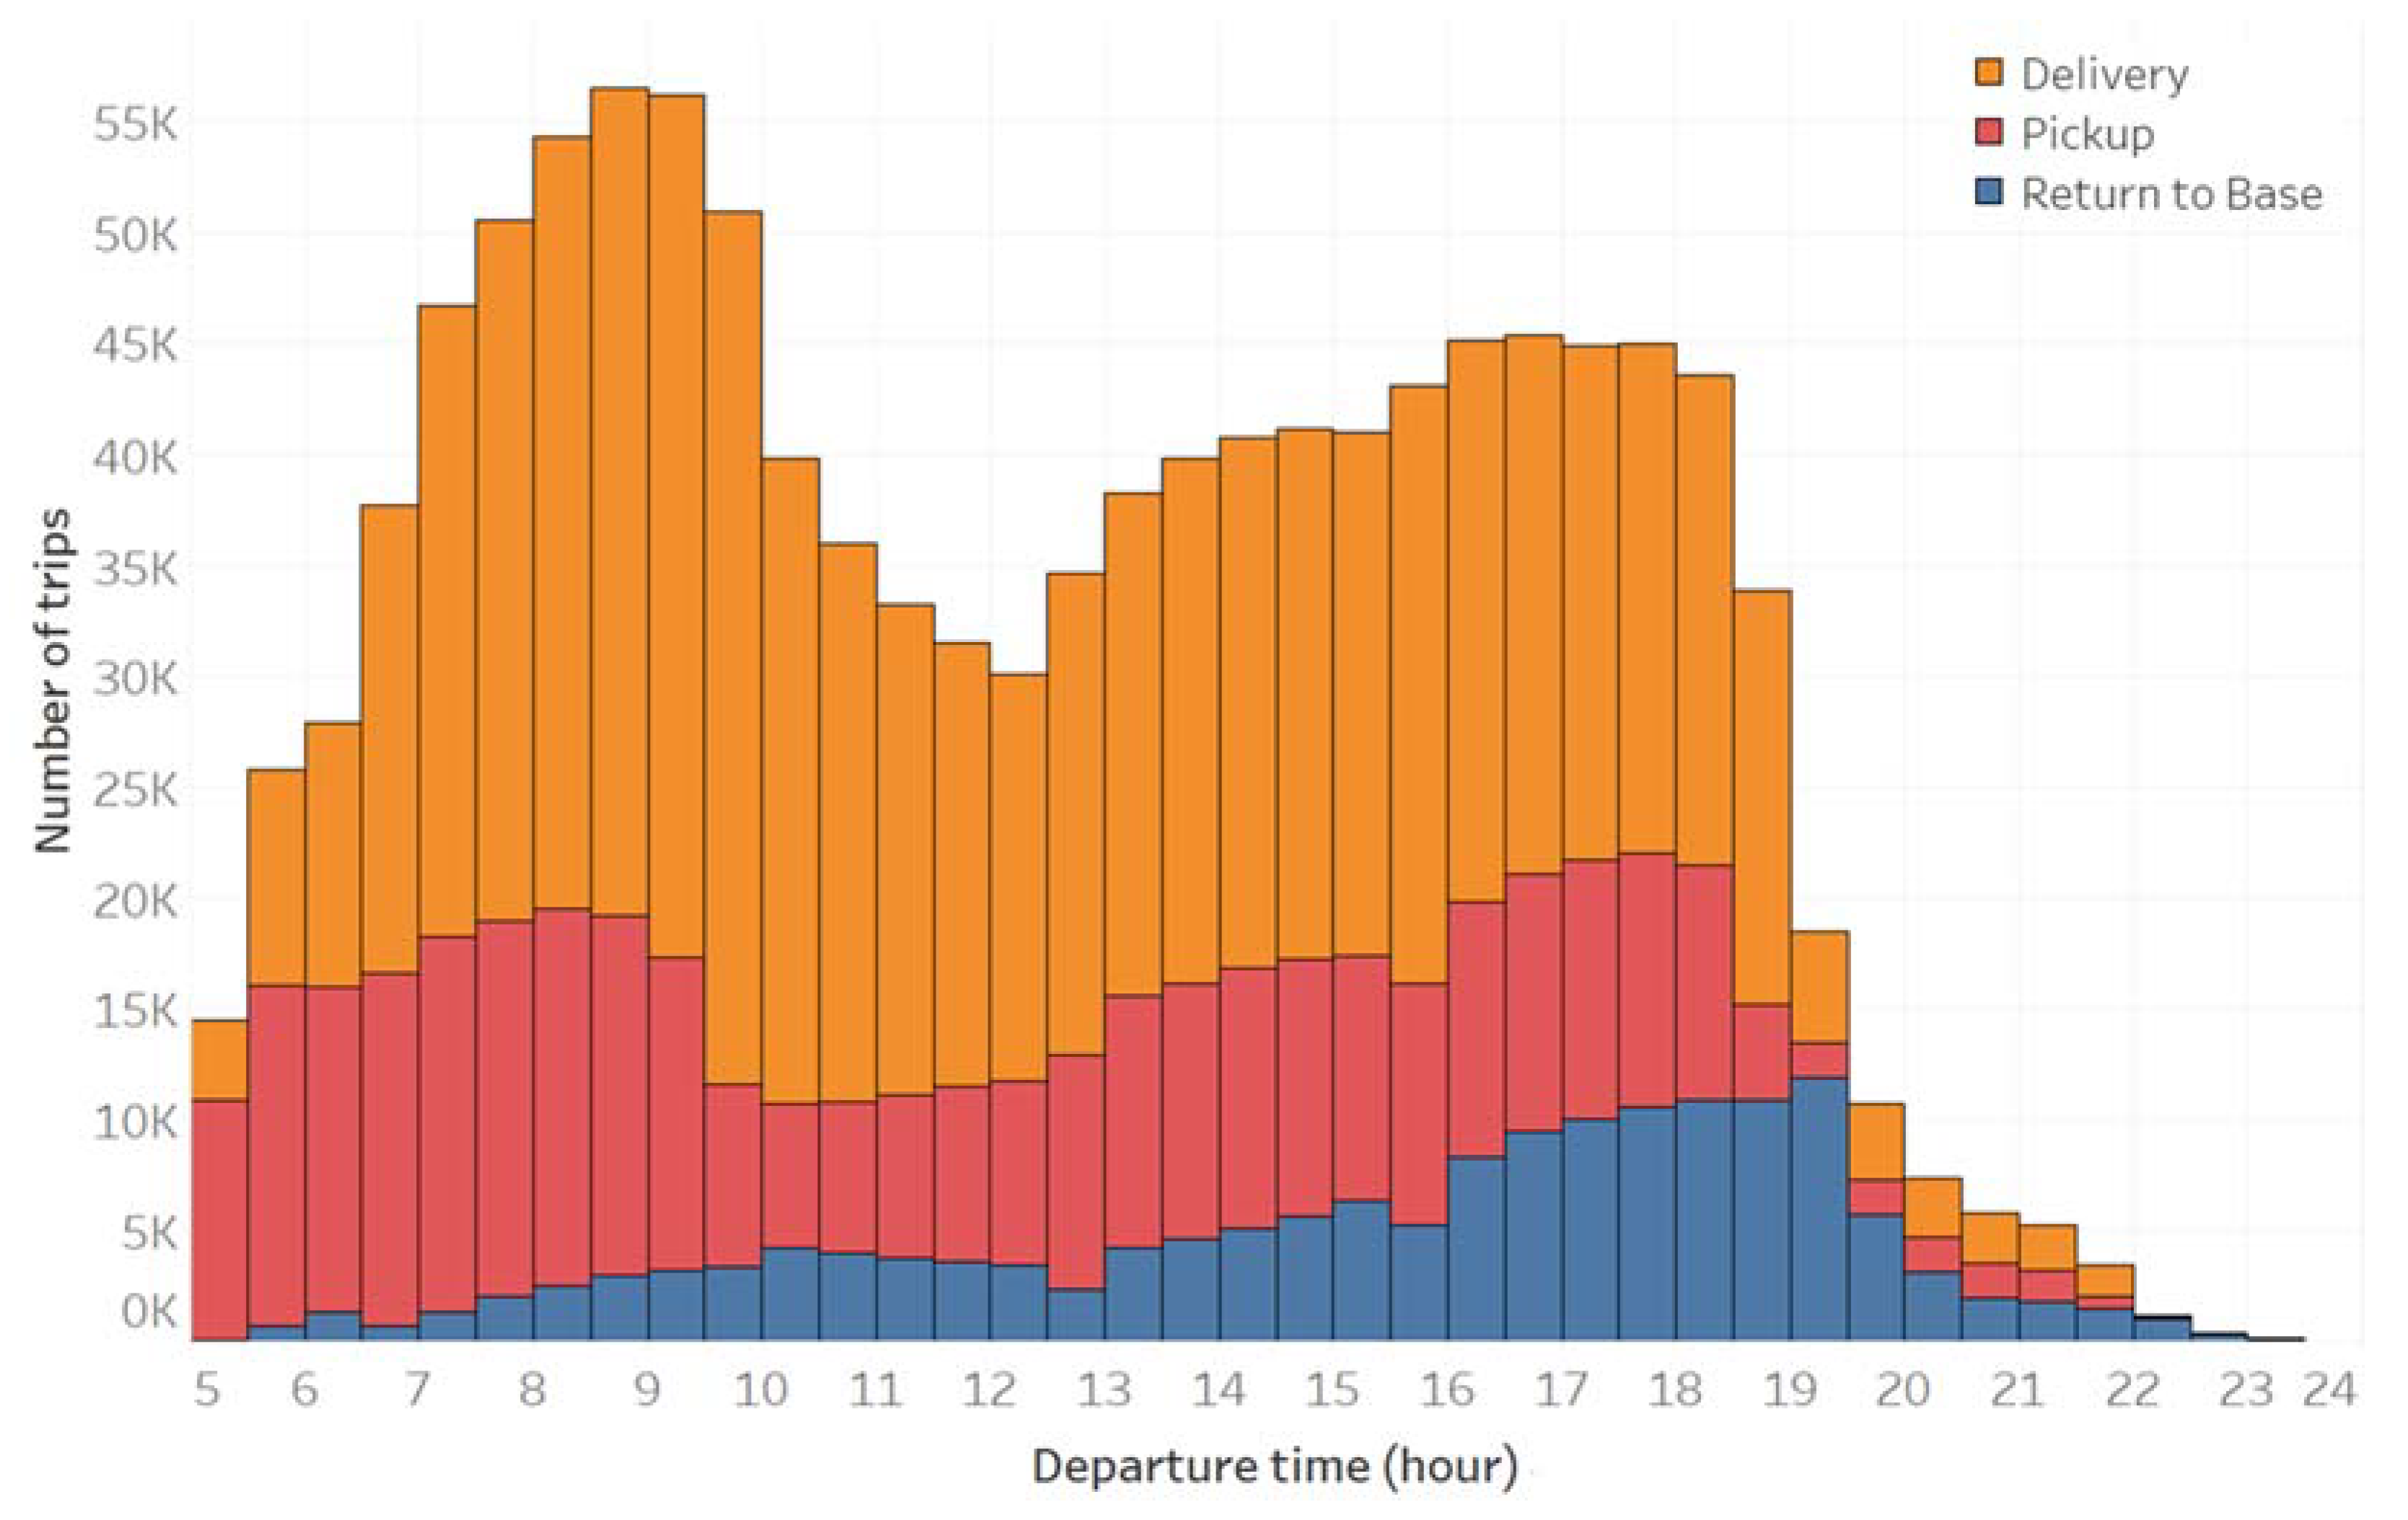
An illustration of the resulting freight vehicle trips handling the predicted B2B and B2C same-day shipments without cargo hitching, is shown in
Figure 5. The total number of trips is 1.18 million.
4.2. Scenarios
Here, we define the cargo-hitching scenarios that involve the MOD fleet that serves passenger and same-day parcel deliveries, and which vary according to the operational configurations of the MOD service. In all scenarios, the MOD fleet size is assumed to be equal to 22,680. The fleet size is set to ensure a high request satisfaction rate for passenger requests, high vehicle utilization during the peak period, and reasonable waiting times, based on preliminary simulations with varying fleet sizes. Specifically, 96% of the total passenger MOD demand (described in
Section 4.1.1) is served, with 48% of requests being served in 5 min or less and 85% of requests served within 10 min, and with around 70–80% of vehicles utilized during the peak period.
For a comparison with the existing MOD fleet size, the number of private hire vehicles in Singapore in 2019 is 45,000 [
45]. These vehicles are not operating 24 h a day or during the same period, but with drivers only working for a few hours a day. In our scenarios, vehicles are assumed available 24 h a day. Thus, our fleet size assumption is a plausible representation of present-day fleets. The following settings are made for simplifying the simulations of the MOD fleet:
While passenger mode choices consider modal costs explicitly, the vehicle assignment process, to either a passenger or a parcel, does not consider delivery/ride fees. In other words, real-time effects of spatial demand and supply imbalances on ride prices (i.e., dynamic pricing or surge pricing) are not modeled.
The assignment follows an online approach (i.e., real time), and demand is not known to the SMS controller prior (described in
Section 3.2); thus, the controller does not reposition vehicles considering expected or anticipated demand. Vehicles are initialized at the parking locations distributed across the network.
The SMS controller handles both non-shared and shared ride requests, and the choice of a single or shared ride (made by the individual user) is determined by the demand models. Each ride request is assumed to be for a single passenger.
A maximum waiting time threshold is 10 min for requests by passengers (the waiting time constraint within the insertion heuristic is described earlier in
Section 3.2). The requests that remain in the booking system for longer than this threshold default to “failed” and these passengers are assumed to use public transit.
A parcel takes the space equivalent to that of a passenger seat.
The operational scenarios are defined as follows:
Baseline (Base): The SMS controller only serves passenger trip requests for single/shared-ride services. All parcels are handled by conventional freight vehicles.
Shared (SHR): Parcel delivery requests to the SMS controller are considered for shared rides but a passenger must already have been assigned to the vehicle for a parcel request to be accepted. Additional requests up to the fulfilment of vehicle capacity can be accepted at any point of the ride subject to the constraints associated with the waiting time of the new passenger and the detour to the passenger(s) in the vehicle (tolerated delay) and those already scheduled for pickup (waiting time and tolerated delay).
Shared and idle (SHR+IDL): This is a variant of SHR where, if no match to a shareable passenger ride can be found and idle MOD vehicles are able to accept the parcel delivery request, they will carry the parcel. In more detail, for an assignment cycle (set to 10 s), the SMS controller will review pending requests, and if parcel delivery requests cannot be assigned to a shared ride (subject to criteria listed in SHR), and any vehicle has not been assigned any request for 1 min or more, those vehicles are eligible to serve the parcel delivery request subject to its distance to the parcel origin. The maximum distance a vehicle will travel to serve a request is subject to the acceptable waiting time specified for parcel delivery requests, and a random vehicle is selected if there are more than one available under this threshold.
Shared and restricted idle (SHR+RIDL): This is a variant of SHR+IDL aiming to minimize the impact of idle vehicle assignments on passenger rides. For this, parcel delivery services using idle vehicles (i.e., without any passenger) are limited to non-peak periods (i.e., the periods except for the morning (7:00 a.m.–10:00 a.m.) and evening (4:00 p.m.–9:00 p.m.) peaks). Furthermore, for passengers not to experience any stopover for parcel pickup or delivery, parcels are only picked up before the first passenger ride and dropped off after the last passenger for that ride bundle.
4.3. Metrics
The following metrics are used to evaluate the relevant impacts on the mobility system, considering the perspectives of multiple agents:
MOD passengers: requests served, travel time, and waiting time from the request for a ride.
Shippers: requests (parcels) served and waiting time from the request to pick up.
Carriers: freight vehicle drivers’ total driving time (vehicle hour traveled, or VHT) and vehicle kilometers traveled (VKT).
MOD operator: total demand served, VKT, vehicle utilization (% in time).
Network performance: VHT, VKT, and travel time index, defined as the ratio of simulated travel time to free-flow travel time.
5. Results
In this section we summarize the simulation results for each scenario. The displayed results are averages of outputs from three simulations in each scenario to account for the simulator stochasticity. First, looking at the MOD passengers in shared rides (
Table 2), which are used for cargo hitching, there is a small decrease in passenger requests served (between 1% and 2%), with the higher decrease in the SHR+IDL scenario where the assignment of parcels to idle vehicles is unrestricted. Travel times, which consider the flows of all other vehicle types (both passenger and freight vehicles) in the network, change little in the peak period (2% to 3%), but can increase by up to 2 min in the midday period, which is expected, considering the additional freight parcel deliveries being fulfilled. Waiting times have small increases in the order of seconds (1% to 4%).
Figure 6 and
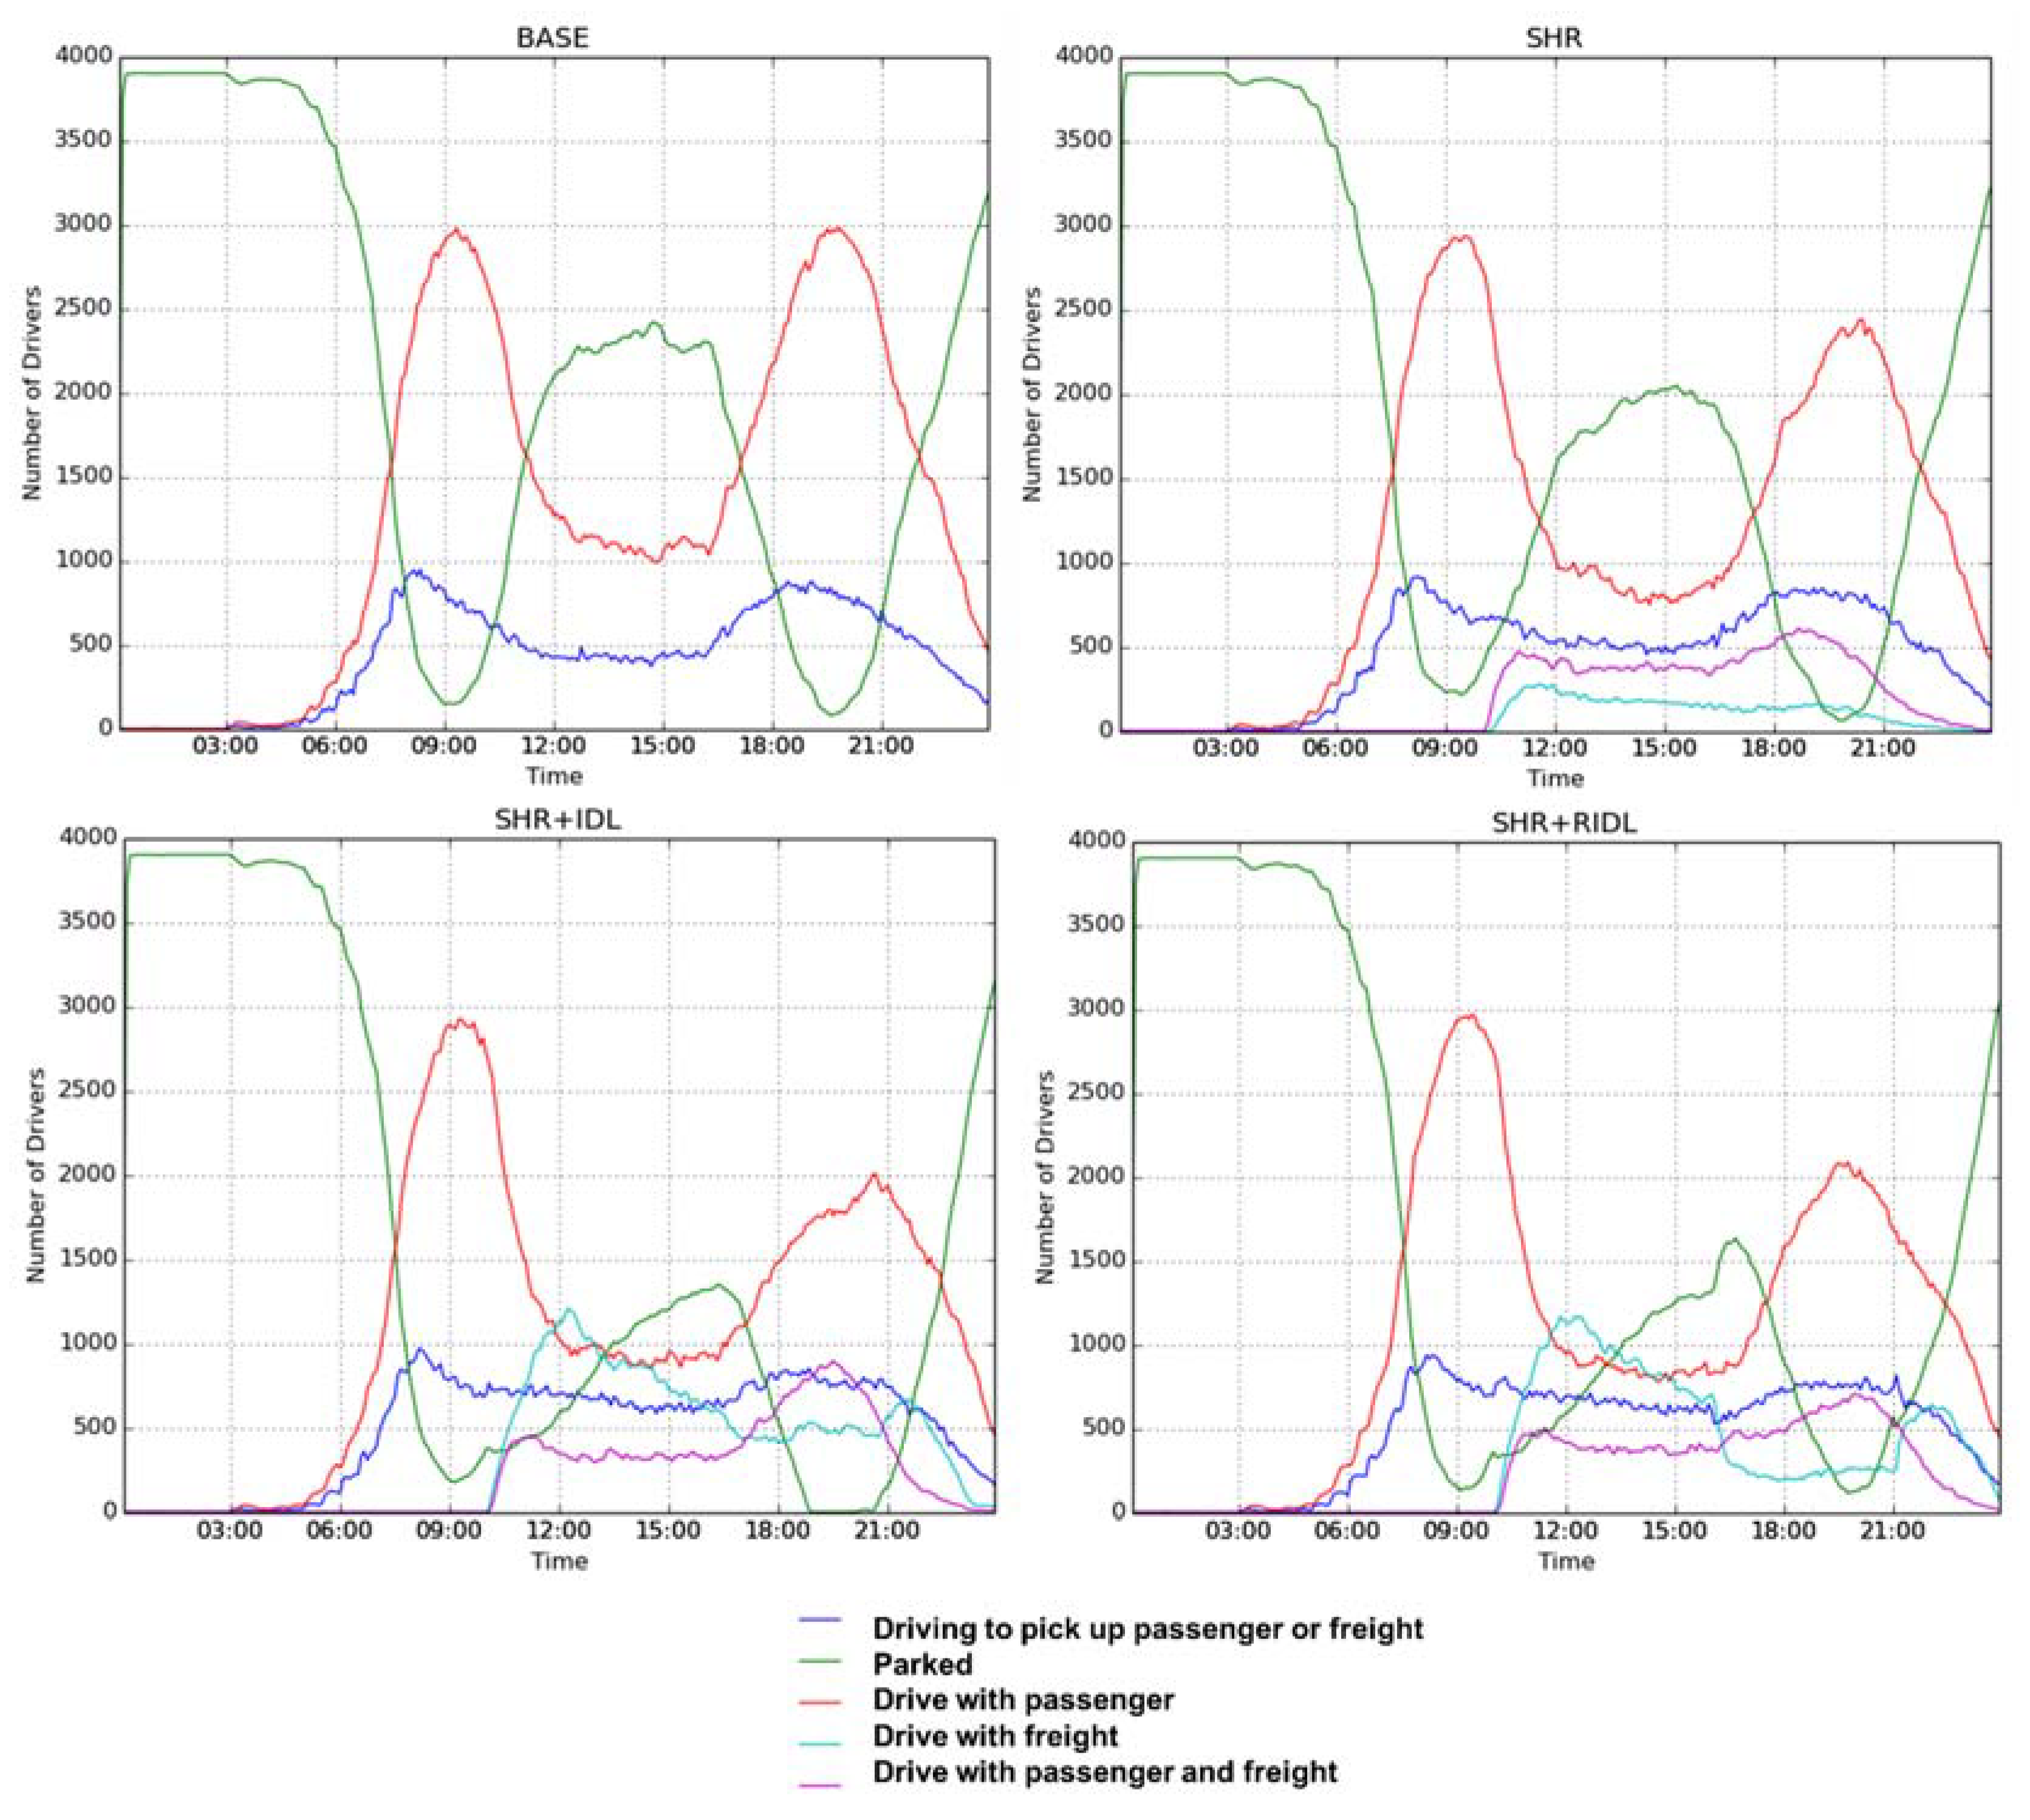
Figure 7 illustrate the vehicle status and utilization over time and the statistics concerning the relation between requests and their fulfilment, respectively. In
Figure 6, we can see that the use of idle vehicles (SHR+IDL and SHR+RIDL) leads to a decrease in the number of vehicles parked during the period between the passenger demand in the morning and evening peaks. Moreover, in
Figure 6, we can see how the restrictions to the assignment of idle vehicles to freight during the peak period leads to a decrease in the fulfilment of freight during this period. However, the cyan line (“Drive with freight”) is not completely eliminated due to vehicles already handling demand and circulating in the network, and due to the status of the vehicle being changed to “Drive with freight” once all passengers in a shared ride have left the vehicle. This helps to achieve a more efficient fleet usage (green line, “Parked”). In
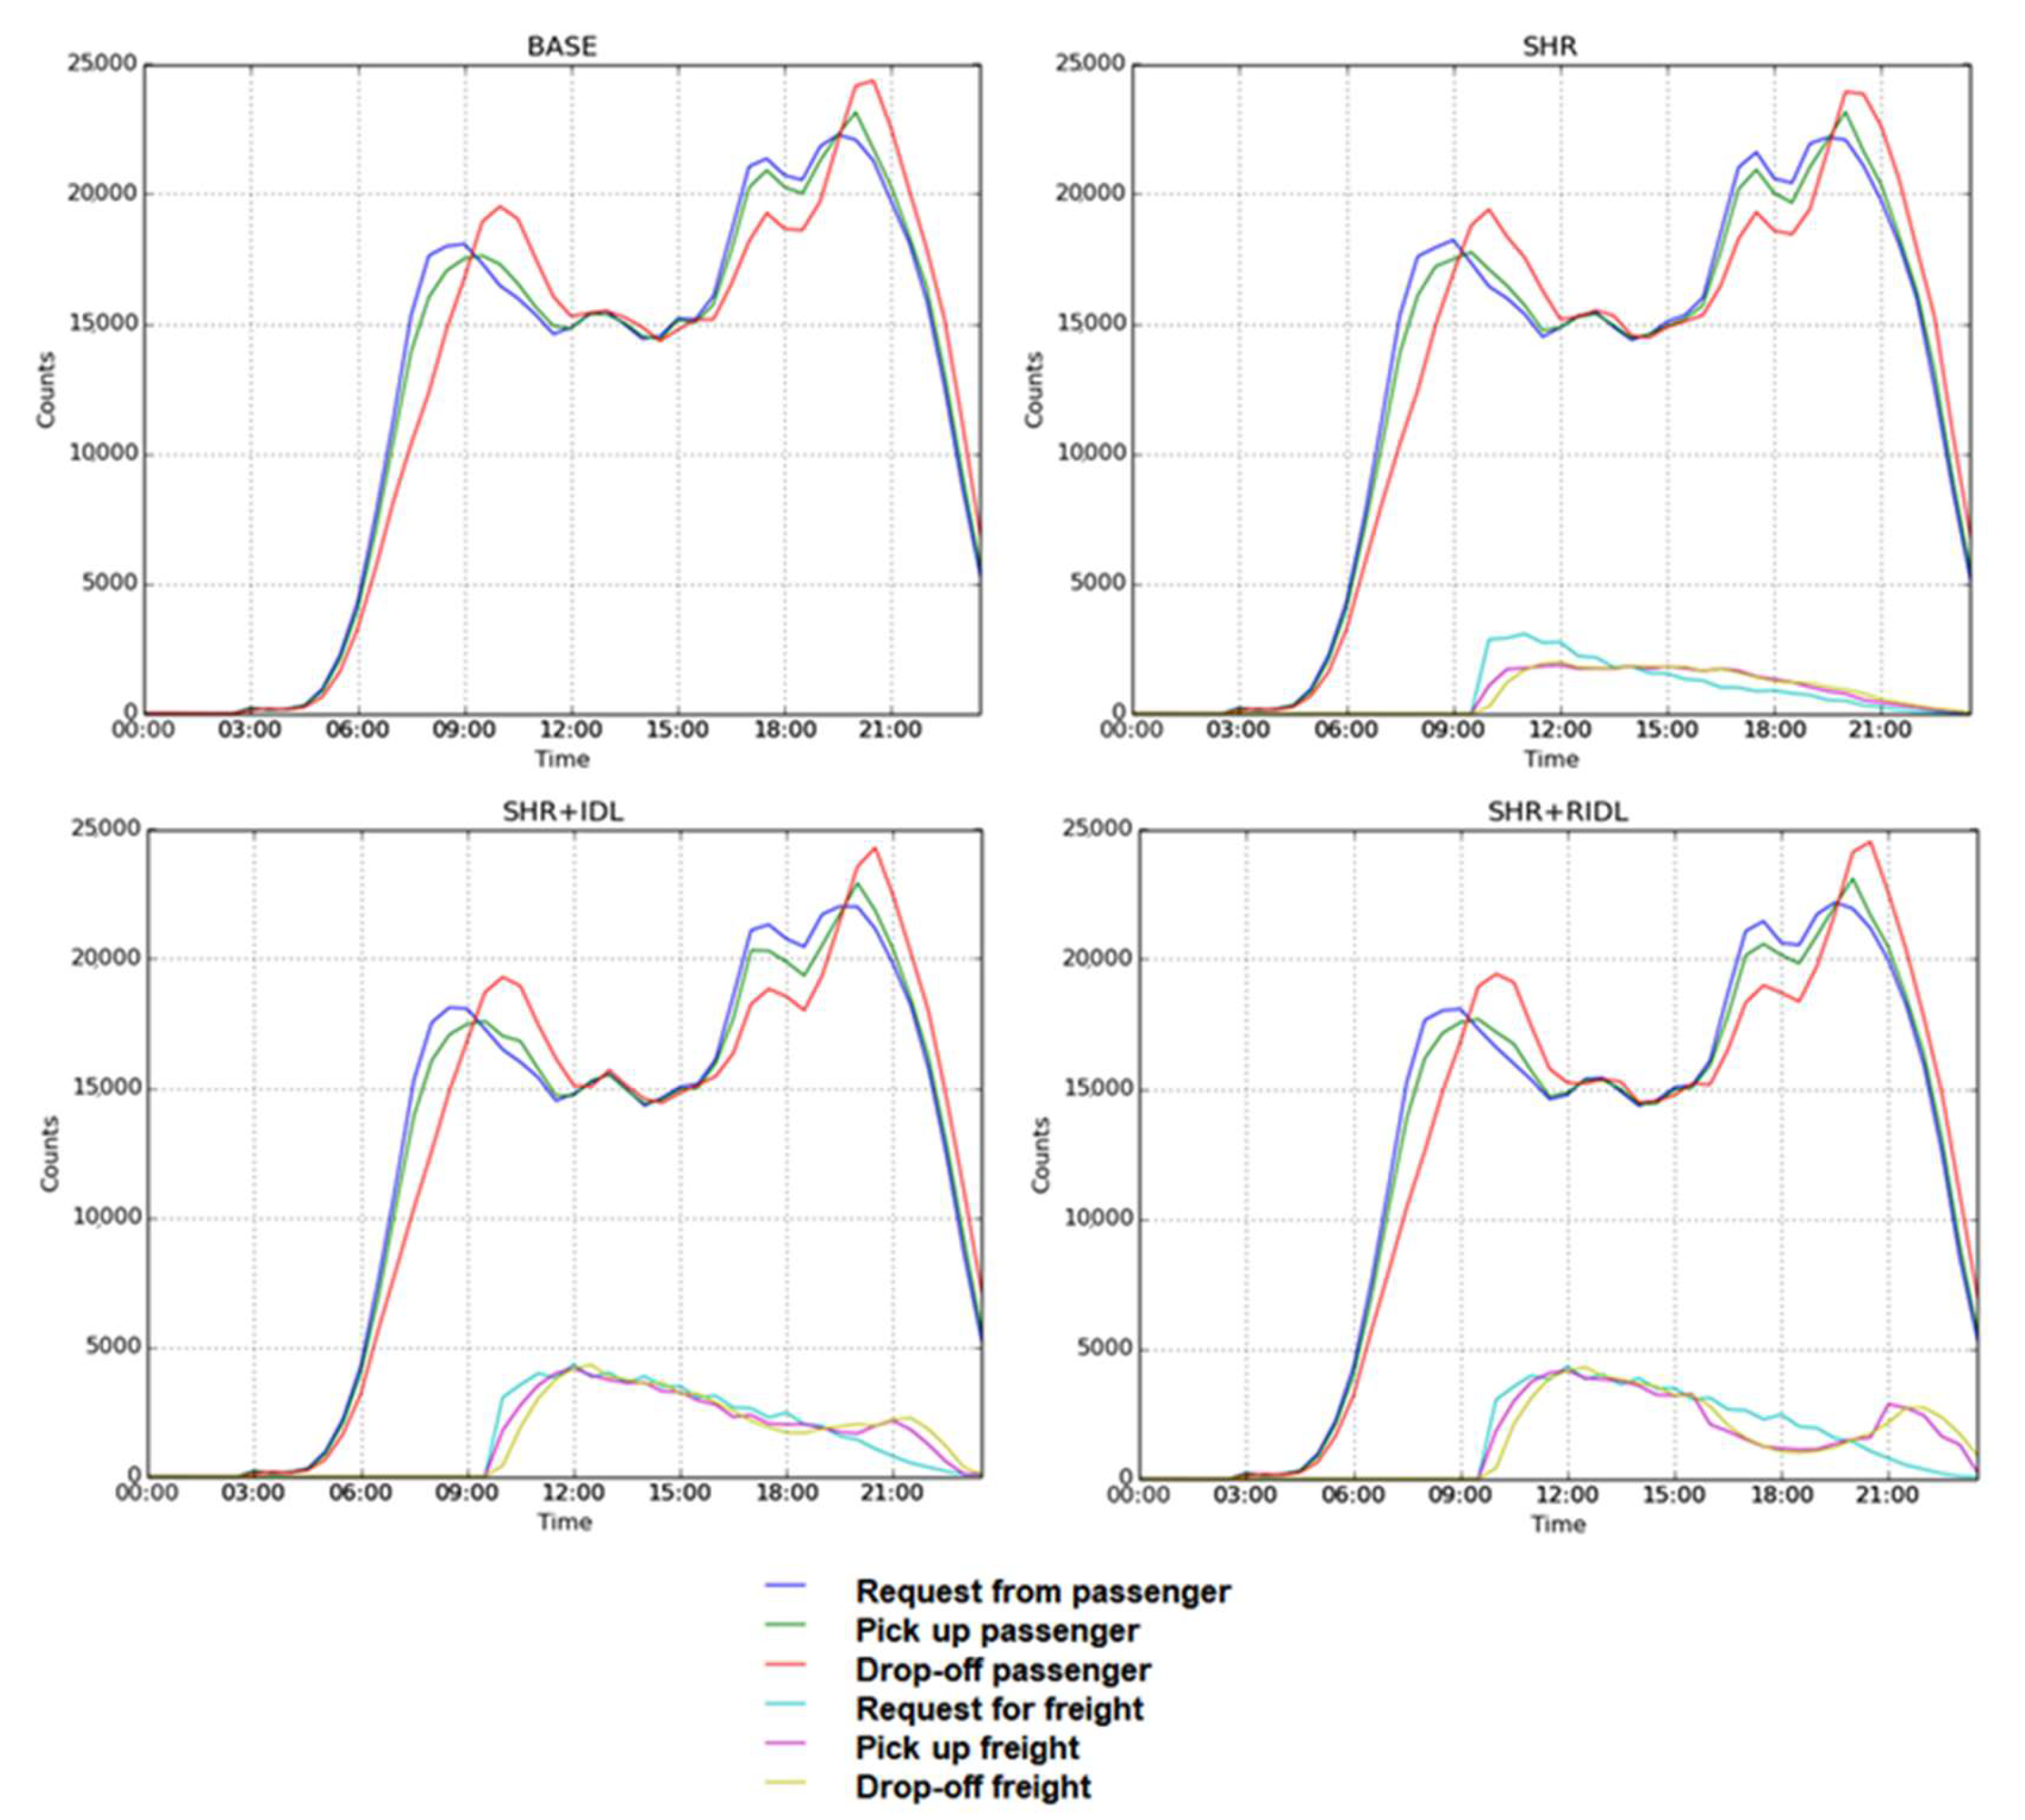
Figure 7, the use of idle vehicles between the peaks for moving freight is seen for all scenarios except the baseline scenario. This is possible due to the complementarity between the demand profiles. Lastly, in
Figure 7, the gap between demand and supply for SHR can be seen in the gap between the cyan (“Request for freight”) to purple (“Pick up freight”) lines. Using the idle vehicles in SHR+IDL and SHR+RIDL leads to a nearly complete match, except during the evening peak, which is compensated post peak, particularly for the SHR+RIDL scenario.
The number of additional requests handled by the MOD service is shown in
Table 3, which illustrates the metrics for shippers and carriers. The baseline scenario shows “not applicable” for shippers, given that the MOD service is used to assist shippers with deliveries. The SHR scenario only allows for handling a comparatively smaller number of freight deliveries—34 K instead of 67 K for SHR+IDL and SHR+RIDL. Waiting times for pickups vary between scenarios. Larger waiting times are seen for the morning and midday periods in the SHR scenario, since a match with a shared ride needs to take place. However, in SHR+IDL and SHR+RIDL, waiting times in the morning peak and midday periods decrease substantially. In the evening peak period, for SHR+IDL, if no sharing match can be found at the time of the request, the matching algorithm defaults to looking for an idle vehicle. However, demand for passenger transport is high in the evening peak, and compared to the SHR scenario, SHR+IDL is dealing with twice the number of requests. Thus, on average, the time taken to serve each request increases. This can also be observed in
Figure 6, where it is visible that all vehicles are busy during the evening peak, and in
Figure 7, where, as the evening peak ends, there is a peak in the number of freight requests being served due to a backlog. For SHR+RIDL, the peak periods are restricted for passenger trips, and thus the waiting times for parcel deliveries increases even more since it does not allow using any potential vehicle that has not been assigned a request right away. Note that the passengers’ waiting times remained within the reasonable boundary across the scenarios as shown in
Table 2. Additionally, as expected, the driving time and distance traveled by the carriers decreased by between 3% and 6% due to the offloaded demand to the MOD service.
For the MOD operator (
Table 4), results show that leveraging the extra capacity of vehicles allows serving up to 11% more additional requests (summing passenger and freight requests). However, this is inefficient, illustrated by the respective increase in distance travelled (17%). Still, this is not surprising, as a freight vehicle tour can handle comparatively more parcels, and we assumed one parcel would take up the equivalent of a passenger seat. Still, the potential for performing parcel deliveries as a means to reduce the discrepancy in vehicle usage between peaks and the midday period is evident. Increases in midday vehicle utilization are due to the additional demand being handled, reaching up to 81% from the baseline case.
With regards to network performance (
Table 5), the shift of parcel delivery demand to MOD vehicles results in a small reduction in total VKT by MOD and freight vehicles, which leads to modest improvements in congestion levels. The average travel time index (distance-weighted TTI) remains around 1.5 over 24 h. It increases significantly during the peak periods up to around 2.6 to 2.7, but with negligible change relative to the baseline. The main reason for a small VKT saving is hypothesized to be related to some of the underlying assumptions of the analysis. For example, a maximum of four parcels can be matched with a vehicle as it is assumed that a parcel takes up the space of a passenger. Given all other constraints, this results in the reduction in the VKT by freight vehicles being counteracted by the increase in the VKT of MOD vehicles. We expect that when not carrying passengers, the MOD vehicles could be assigned more parcels to reduce the efficiency gap between these and the conventional freight vehicles that can carry more parcels. Moreover, the assumption about freight carriers knowing all demand in advance, works to their advantage in these results. It can be argued that the service is useful in instances of “immediate deliveries” that do not allow for efficient consolidation in freight vehicles.
6. Conclusions
In this paper, we apply an agent-based simulation framework to systematically investigate the impacts of cargo hitching when applied to MOD services. We considered the perspective of passengers, shippers, carriers, and planners, while exploring a few illustrative operational strategies, named shared (SHR), shared and idle (SHR+IDL), and shared and restricted idle (SHR+RIDL). Results were distinct according to each strategy, and an argument can be made towards the use of “idle” vehicles in addition to shared rides, given adequate limits. Further, the results provided insights into the order of magnitude of parcel movements that can be absorbed by an MOD system, as well as the impacts on the quality of service for passengers and fleet usage. Overall, there are potential gains to be made by delivering parcels using MOD vehicles, with minimal impact to passenger travel and while reducing freight vehicle VHT and VKT, subject to operational settings. Despite a small decrease in passenger rides, there is a net increase in the number of requests handled by the MOD operator. This could be beneficial for drivers’ revenue, since there are more service requests during a day. However, this is the case due to the demand profiles being complementary to each other. This may or may not hold under future activity patterns of e-commerce and telework adoption.
The operational strategies, and hence the assignment method, were designed so that the impact on the passenger service level was minimal, and results indicated that those methods could fulfill this goal. However, our assumption regarding a parcel taking up a passenger seat could have contributed to this. Had we assumed that more parcels could be assigned to a vehicle, this could have led to higher impacts on the quality of service for the passenger. Still, it should be noted that the assumed fleet size is equivalent to, or smaller than, current MOD fleets in the study area. Thus, our estimates are considered conservative in terms of vehicle availability for performing parcel deliveries. Moreover, as previously mentioned, during idle periods, when passengers are less likely to be matched with parcels, these vehicles could be assigned more than four parcels. This would further add to reducing the efficiency gap that led to a minimal saving in network-level VKT. Lastly, the experiment assumed that when the parcels are assigned to carriers, adequate time is given to plan for efficient tours, as they know all demand in advance. This might not hold, as same-day demand comes throughout the day, which in this case provides support for the arguments that speak in favor of the cargo-hitching service, although failed assignments (and deliveries) would need adequate processes to be handled, such as by dispatching a dedicated vehicle.
There are several improvements that we envision for future research. Regarding simulation realism, we ought to first enhance the B2C freight demand scenario with dedicated e-commerce demand models accounting for all B2C parcel demand, inclusive of non-same day deliveries. The assumed total of parcel demand assigned to MOD vehicles is expected to have different influences on the simulation results according to the operational scenario. For shared rides, increased demand could have higher impacts on passenger service levels. For cases using idle vehicles, we aim to quantify how varying the parcel-carrying ability of the MOD vehicles can impact the savings of conventional freight VKT. This is something we put forward to explore in the future. Regarding the analysis of operational scenarios, there is potential to explore more sophisticated settings, such as having a defined time to search for sharing matches and only then defaulting to using idle vehicles, or allowing single rides to also move freight parcels if these are picked up before the passenger and dropped off following the drop-off of the passenger. Lastly, the application of the cargo-hitching concept to other modes, such as bus and metro, or even upcoming alternatives, such as automated mobility-on-demand, could be worth exploring.
Author Contributions
A.R.A.: Conceptualization, Methodology, Software, Validation, Formal Analysis, Investigation, Data Curation, Writing—Original Draft, Writing—Review and Editing, Supervision, Project administration, Funding acquisition; T.S.: Conceptualization, Methodology, Software, Writing—Review and Editing; S.O.: Formal Analysis, Visualization, Writing—Review and Editing; C.C.: Formal Analysis, Visualization; R.S.: Conceptualization, Methodology Writing—Review and Editing; W.H.C.: Software; Y.H.: Formal Analysis; J.C.: Formal Analysis, Visualization; L.C.: Conceptualization, Writing—Review and Editing, Funding Acquisition; M.B.-A.: Conceptualization, Methodology, Funding Acquisition. All authors have read and agreed to the published version of the manuscript.
Funding
The research was funded in part by the National Research Foundation, Prime Minister’s Office, Singapore, under its CREATE programme, Singapore–MIT Alliance for Research and Technology (SMART) Future Urban Mobility (FM) IRG; and funded in part by the SUTD-MIT International Design Centre (IDC) under the grant (IDG21800101). We acknowledge the support of the Land Transport Authority (LTA) of Singapore in providing the road network for this study. Any findings, conclusions, recommendations, or opinions expressed are those of the authors only.
Institutional Review Board Statement
Not applicable.
Informed Consent Statement
Not applicable.
Data Availability Statement
Conflicts of Interest
On behalf of all authors, the corresponding author states that there is no conflict of interest.
References
- U.S. Department of Commerce. U.S. Census Bureau News “QUARTERLY RETAIL E-COMMERCE SALES 1st QUARTER 2020”. Available online: https://www2.census.gov/retail/releases/historical/ecomm/20q1.pdf (accessed on 12 August 2020).
- Adobe Analytics, Adobe Digital Economy Index. July 2020. Available online: https://www.adobe.com/content/dam/www/us/en/experience-cloud/digital-insights/pdfs/adobe_analytics-digital-economy-index-2020.pdf (accessed on 12 August 2020).
- Morganti, E.; Seidel, S.; Blanquart, C.; Dablanc, L.; Lenz, B. The impact of e-commerce on final deliveries: Alternative parcel delivery services in France and Germany. Transp. Res. Procedia 2014, 4, 178–190. [Google Scholar] [CrossRef] [Green Version]
- Dablanc, L.; Morganti, E.; Arvidsson, N.; Woxenius, J.; Browne, M.; Saidi, N. The rise of on-demand ‘Instant Deliveries’ in European cities. In Supply Chain Forum: An International Journal; Taylor & Francis: Abingdon, UK, 2017; Volume 18, pp. 203–217. [Google Scholar]
- Trentini, A.; Mahléné, N. Toward a shared urban transport system ensuring passengers & goods cohabitation. TeMA J. Land Use Mobil. Environ. 2010, 3, 37–44. [Google Scholar]
- Sampaio, A.; Savelsbergh, M.; Veelenturf, L.; van Woensel, T. Crowd-Based City Logistics. s.l.; SCL Report Series; 17-02; Georgia Institute of Technology: Atlanta, GA, USA, 2017; pp. 1–14. Available online: https://pure.tue.nl/ws/portalfiles/portal/91609533/scl_17_02.pdf (accessed on 12 August 2020).
- Mourad, A.; Puchinger, J.; Chu, C. A survey of models and algorithms for optimizing shared mobility. Transp. Res. Part B Methodol. 2019, 123, 323–346. [Google Scholar] [CrossRef]
- Savelsbergh, M.; Woensel, T.V. City logistics: Challenges and opportunities. Transp. Sci. 2016, 50, 79–590. [Google Scholar] [CrossRef]
- Van Duin, R.; Wiegmans, B.; Tavasszy, L.; Hendriks, B.; He, Y. Evaluating new participative city logistics concepts: The case of cargo hitching. Transp. Res. Procedia 2019, 39, 565–575. [Google Scholar] [CrossRef]
- Kai Yi, W. ComfortDelGro Taxis to Deliver Groceries from RedMart as Orders Surge [News Article]. Straits Times, Published APR 14, 2020, 4:00 PM SGT. Available online: https://www.straitstimes.com/singapore/transport/comfortdelgro-taxis-to-deliver-groceries-from-redmart-as-orders-surge (accessed on 12 August 2020).
- Ho, O. Taxi, Private-Hire Drivers Tapped to Meet Demand for Food and Grocery Deliveries [News Article]. Straits Times, Published MAR 30, 2020, 5:00 AM SGT. Available online: https://www.straitstimes.com/singapore/taxi-private-hire-drivers-tapped-to-meet-demand-for-food-and-grocery-deliveries (accessed on 12 August 2020).
- Paloheimo, H.; Lettenmeier, M.; Waris, H. Transport reduction by crowdsourced deliveries—A library case in Finland. J. Clean. Prod. 2016, 132, 240–251. [Google Scholar] [CrossRef]
- Devari, A.; Nikolaev, A.G.; He, Q. Crowdsourcing the last mile delivery of online orders by exploiting the social networks of retail store customers. Transp. Res. Part E Logist. Transp. Rev. 2017, 105, 105–122. [Google Scholar] [CrossRef]
- Punel, A.; Stathopoulos, A. Modeling the acceptability of crowdsourced goods deliveries: Role of context and experience effects. Transp. Res. Part E Logist. Transp. Rev. 2017, 105, 18–38. [Google Scholar] [CrossRef]
- Ermagun, A.; Stathopoulos, A. To bid or not to bid: An empirical study of the supply determinants of crowd-shipping. Transp. Res. Part A Policy Pract. 2018, 116, 468–483. [Google Scholar] [CrossRef]
- Shen, J.; Qiu, F.; Li, W.; Feng, P. A new urban logistics transport system based on a public transit service. In Proceedings of the 15th COTA International Conference of Transportation Professionals (CICTP 2015), Beijing, China, 24–27 July 2015; pp. 650–661. [Google Scholar]
- Pimentel, C.; Alvelos, F. Integrated urban freight logistics combining passenger and freight flows—Mathematical model proposal. Transp. Res. Procedia 2018, 30, 80–89. [Google Scholar] [CrossRef]
- Serafini, S.; Nigro, M.; Gatta, V.; Marcucci, E. Sustainable crowdshipping using public transport: A case study evaluation in Rome. Transp. Res. Procedia 2018, 30, 101–110. [Google Scholar] [CrossRef]
- Gatta, V.; Marcucci, E.; Nigro, M.; Patella, S.M.; Serafini, S. Public transport-based crowdshipping for sustainable city logistics: Assessing economic and environmental impacts. Sustainability 2019, 11, 145. [Google Scholar] [CrossRef] [Green Version]
- Arslan, A.M.; Agatz, N.; Kroon, L.; Zuidwijk, R. Crowdsourced delivery—A dynamic pickup and delivery problem with ad hoc drivers. Transp. Sci. 2019, 53, 222–235. [Google Scholar] [CrossRef] [Green Version]
- Chen, C.; Zhang, D.; Ma, X.; Guo, B.; Wang, L.; Wang, Y.; Sha, E. Crowddeliver: Planning city-wide package delivery paths leveraging the crowd of taxis. IEEE Trans. Intell. Transp. Syst. 2016, 18, 1478–1496. [Google Scholar] [CrossRef]
- Li, B.; Krushinsky, D.; Reijers, H.A.; Van Woensel, T. The share-a-ride problem: People and parcels sharing taxis. Eur. J. Oper. Res. 2014, 238, 31–40. [Google Scholar] [CrossRef] [Green Version]
- Nguyen, N.Q.; Nghiem, N.V.D.; Do, P.T.; Le, K.T.; Nguyen, M.S.; Mukai, N. People and parcels sharing a taxi for Tokyo city. In Proceedings of the Sixth International Symposium on Information and Communication Technology, Hue, Vietnam, 3–4 December 2015; pp. 90–97. [Google Scholar]
- Chen, C.; Pan, S.; Wang, Z.; Zhong, R.Y. Using taxis to collect citywide E-commerce reverse flows: A crowdsourcing solution. Int. J. Prod. Res. 2017, 55, 1833–1844. [Google Scholar] [CrossRef]
- Najafabadi, S.; Allahviranloo, M. Integrated Approach For City Logistics: A Dynamic Taxi Crowdshipping Model. In Proceedings of the 98th Annual Meeting of Transportation Research Board, Washington, DC, USA, 13–17 January 2019. [Google Scholar]
- Alho, A.R.; Sakai, T.; Zhao, F.; You, L.; Jing, P.; Cheah, L.; Zegras, C.; Ben-Akiva, M. Laboratories for Research on Freight Systems and Planning. In Urban Informatics; Shi, W., Goodchild, M.F., Batty, M., Kwan, M.P., Zhang, A., Eds.; The Urban Book Series; Springer: Singapore, 2021. [Google Scholar] [CrossRef]
- Adnan, M.; Pereira, F.C.; Azevedo, C.L.; Basak, K.; Lovric, M.; Raveau, S.; Zhu, Y.; Ferreira, J.; Zegras, C.; Ben-Akiva, M.E. SimMobility: A Multi-scale Integrated Agent-Based Simulation. In Proceedings of the 95th Annual Meeting of the Transportation Research Board, Washington, DC, USA, 10–14 January 2016. [Google Scholar]
- Zhu, Y.; Diao, M.; Ferreira, J.; Zegras, P.C. An integrated microsimulation approach to land-use and mobility modeling. J. Transp. Land Use 2018, 11, 633–659. [Google Scholar] [CrossRef]
- Zhu, Y.; Ferreira, J., Jr. Synthetic population generation at disaggregated spatial scales for land use and transportation microsimulation. Transp. Res. Rec. 2014, 2429, 168–177. [Google Scholar] [CrossRef]
- Sakai, T.; Bhavathrathan, B.K.; Alho, A.; Hyodo, T.; Ben-Akiva, M. Commodity flow estimation for a metropolitan scale freight modeling system: Supplier selection considering distribution channel using an error component logit mixture model. Transportation 2020, 47, 997–1025. [Google Scholar] [CrossRef] [Green Version]
- Gopalakrishnan, R.; Alho, A.R.; Sakai, T.; Hara, Y.; Cheah, L.; Ben-Akiva, M. Assessing overnight parking infrastructure policies for commercial vehicles in cities using agent-based simulation. Sustainability 2020, 12, 2673. [Google Scholar] [CrossRef] [Green Version]
- Sakai, T.; Alho, A.R.; Bhavathrathan, B.; Chiara, G.D.; Gopalakrishnan, R.; Jing, P.; Hyodo, T.; Cheah, L.; Ben-Akiva, M. SimMobility Freight: An agent-based urban freight simulator for evaluating logistics solutions. Transp. Res. Part E Logist. Transp. Rev. 2020, 141, 102017. [Google Scholar] [CrossRef]
- Lu, Y.; Adnan, M.; Basak, K.; Pereira, F.C.; Carrion, C.; Saber, V.H.; Ben-Akiva, M. Simmobility mid-term simulator: A state of the art integrated agent based demand and supply model. In Proceedings of the 94th Annual Meeting of the Transportation Research Board, Washington, DC, USA, 11–15 January 2015. [Google Scholar]
- Adnan, M.; Pereira, F.C.; Azevedo, C.L.; Basak, K.; Koh, K.; Loganathan, H.; Peng, Z.H.; Ben-Akiva, M. Evaluating disruption management strategies in rail transit using SimMobility mid-term simulator: A study of Singapore MRT North-East line. In Proceedings of the 96th Annual Meeting of the Transportation Research Board, Washington, DC, USA, 8–12 January 2017. [Google Scholar]
- Adnan, M.; Biran, B.H.N.; Baburajan, V.; Basak, K.; Ben-Akiva, M. Examining impacts of time-based pricing strategies in public transportation: A study of Singapore. Transp. Res. Part A Policy Pract. 2020, 140, 127–141. [Google Scholar] [CrossRef]
- Le, D.T.; Zegras, P.C.; Zhou, M.; Fereirra, J.; Nguyen-Phuoc, D.Q.; Ben-Akiva, M.; Oh, S.; Seshadri, R. Simulating Multi-scaled Impacts of Automated Mobility-on-Demand Services. In Proceedings of the 2019 IEEE Intelligent Transportation Systems Conference (ITSC), Auckland, New Zealand, 27–30 October 2019; IEEE: Piscataway, NJ, USA, 2019; pp. 1245–1250. [Google Scholar]
- Azevedo, C.L.; Deshmukh, N.M.; Marimuthu, B.; Oh, S.; Marczuk, K.; Soh, H.; Basak, K.; Toledo, T.; Peh, L.-S.; Ben-Akiva, M.E. SimMobility Short-Term: An Integrated Microscopic Mobility Simulator. Transp. Res. Rec. J. Transp. Res. Board 2017, 2622, 13–23. [Google Scholar] [CrossRef] [Green Version]
- Ben-Akiva, M.; Bowman, J.L.; Gopinath, D. Travel demand model system for the information era. Transportation 1996, 23, 241–266. [Google Scholar] [CrossRef]
- Oh, S.; Seshadri, R.; Azevedo, C.L.; Kumar, N.; Basak, K.; Ben-Akiva, M. Assessing the impacts of automated mobility-on-demand through agent-based simulation: A study of Singapore. Transp. Res. Part A Policy Pract. 2020, 138, 367–388. [Google Scholar] [CrossRef]
- Ben-Akiva, M. Planning and action in a model of choice. In Choice Modelling: The State-of-the-Art and the State-of-Practice; Emerald Group Publishing Limited: Bingley, UK, 2010. [Google Scholar]
- Oh, S.; Seshadri, R.; Le, D.T.; Zegras, P.C.; Ben-Akiva, M.E. Evaluating Automated Demand Responsive Transit Using Microsimulation. IEEE Access 2020, 8, 82551–82561. [Google Scholar] [CrossRef]
- Biran, B.-H.N.; Oke, J.B.; Kumar, N.; Basak, K.; Araldo, A.; Seshadri, R.; Akkinepally, A.; Azevedo, C.L.; Ben-Akiva, M. From traditional to automated mobility on demand: A comprehensive framework for modeling on-demand services in SimMobility. Transp. Res. Rec. J. Transp. Res. Board 2019, 2673, 15–29. [Google Scholar] [CrossRef]
- Sun, L.; Erath, A. A Bayesian network approach for population synthesis. Transp. Res. Part C Emerg. Technol. 2015, 61, 49–62. [Google Scholar] [CrossRef]
- Wong, L. 1,000 Parcel Locker Stations to Be Rolled out Nationwide by End-2022 [News Article]. Straits Times, Published MAR 4, 2020, 5:00 AM SGT. Available online: https://www.straitstimes.com/singapore/1000-parcel-locker-stations-to-be-rolled-out-nationwide-by-end-2022 (accessed on 10 August 2020).
- Channel News Asia Private-Hire Car Operators to Be Licensed from Next Year as Parliament Passes New Regulatory Framework. Available online: https://www.channelnewsasia.com/news/singapore/private-hire-car-drivers-grab-gojek-licensed-lta-transport-bill-11786370 (accessed on 10 August 2020).
| Publisher’s Note: MDPI stays neutral with regard to jurisdictional claims in published maps and institutional affiliations. |
© 2021 by the authors. Licensee MDPI, Basel, Switzerland. This article is an open access article distributed under the terms and conditions of the Creative Commons Attribution (CC BY) license (https://creativecommons.org/licenses/by/4.0/).


 ,
, 


