Article

A Methodological Approach to Extracting Patterns of Service Utilization from a Cross-Continuum High Dimensional Healthcare Dataset to Support Care Delivery Optimization for Patients with Complex Problems

1
Department of Health Information Science, Faculties of Human and Social Development, Victoria Campus, University of Victoria, Victoria, BC V8P 5C2, Canada
2
Department of Computer Science, Faculties of Engineering and Computer Science, Victoria Campus, University of Victoria, Victoria, BC V8P 5C2, Canada
3
Department of Clinical Psychology, Faculty of Social Science, Victoria Campus, University of Victoria, Victoria, BC V8P 5C2, Canada
4
Departments of Psychiatry and Bioethics, School of Occupational Therapy, Faculties of Medicine and Health, Dalhousie University, Halifax, NS B3H 4R2, Canada
5
Independent Researcher, Victoria, BC V8Y 2W3, Canada
6
Retired Physician and Independent Computer Scientist, Victoria, BC V9C 4B1, Canada
7
Department of Statistical Sciences, Faculties of Arts and Science, St. George Campus, University of Toronto, Toronto, ON M5S 1A1, Canada
8
Departments of Mathematics and Statistics, Faculty of Science, Victoria Campus, University of Victoria, Victoria, BC V8P 5C2, Canada
9
Predictive Services Unit, Wildfire Service, Province of British Columbia, Victoria, BC V8W 9V1, Canada
*
Author to whom correspondence should be addressed.
BioMedInformatics 2024, 4(2), 946-965; https://doi.org/10.3390/biomedinformatics4020053
Submission received: 22 February 2024 / Revised: 10 March 2024 / Accepted: 25 March 2024 / Published: 1 April 2024
(This article belongs to the Special Issue Feature Papers in Clinical Informatics Section)

Abstract

:
Background: Optimizing care for patients with complex problems entails the integration of clinically appropriate problem-specific clinical protocols, and the optimization of service-system-encompassing clinical pathways. However, alignment of service system operations with Clinical Practice Guidelines (CPGs) is far more challenging than the time-bounded alignment of procedures with protocols. This is due to the challenge of identifying longitudinal patterns of service utilization in the cross-continuum data to assess adherence to the CPGs. Method: This paper proposes a new methodology for identifying patients’ patterns of service utilization (PSUs) within sparse high-dimensional cross-continuum health datasets using graph community detection. Result: The result has shown that by using iterative graph community detections, and graph metrics combined with input from clinical and operational subject matter experts, it is possible to extract meaningful functionally integrated PSUs. Conclusions: This introduces the possibility of influencing the reorganization of some services to provide better care for patients with complex problems. Additionally, this introduces a novel analytical framework relying on patients’ service pathways as a foundation to generate the basic entities required to evaluate conformance of interventions to cohort-specific clinical practice guidelines, which will be further explored in our future research.

Graphical Abstract

1. Introduction

1.1. Patterns of Service Utilization (PSUs) for Health-Service-System Optimization

To provide the best possible care to patients with complex needs over time, the service system needs to be optimized. This optimization entails the integration of clinically appropriate problem-specific clinical protocols, and the optimization of service-system-encompassing clinical pathways. With regard to problem-specific clinical protocols, consider the problem of sepsis protocols for emergency departments [1]: these are protocols that are clearly articulated and often coded as clinical decision support tools with clinical information systems. They specify the signs and symptoms that should alert clinicians to the possibility of a patient becoming septic [1]. Using locally available evidence, they specify the diagnostic and the investigation that need to be carried out to perform differential diagnosis and recommend interventions that provide a protocol-based care [1]. Clinical information systems usually contain the data necessary to populate sepsis clinical decision support protocols [1]. Additionally, the sepsis protocols being enacted/or not can be seen within the local data [1]. Hence, clinical operations can be optimized around circumscribed protocols, such as sepsis protocols, and the extraction of aggregated information from transactional clinical information systems can support the effort.
To illustrate optimization encompassing service system clinical pathways, consider the acute care hospitalization and ambulatory care follow-up for persons with schizophrenia. Also, consider optimally interoperating cross-continuum service models that scale up to complexly unfolding chronic conditions that are covered by clinical practice guidelines (CPGs). Following the above, examples of the cross-continuum services that could be required would include (1) an array of services that covers the prodromal phases of a chronic often relapsing condition such as schizophrenia, (2) the acute care hospitalization, (3) an array of post-discharge stabilization and rehabilitation options, including various arrangements of services including mobile crisis response and psychiatric consultation, (4) an array of progressively more staffing-intensive case management models, (5) various secondary or tertiary residential care options, (6) psychosocial rehabilitation services, and (7) addictions harm reduction or rehab/recovery services for persons with a co-morbid substance use disorder. Also, various services will need engagement to address the various medical comorbidities or emergent conditions usually associated with the schizophrenia condition, such as the engagement of various services to address the risk for kidney disease associated with side-effects of psychiatric medications via their attendant risk for metabolic syndromes [2], or the heightened risk for cardiovascular disease [3]. This level of complexity is not unique to schizophrenia cohorts. There are more than 50 CPGs in the BC guidelines to address high prevalence problems with various degrees of complexities [4].
Optimizing clinical operations around circumscribed protocols may be possible via access to service encounters and related information to determine whether a protocol is indicated, e.g., problems and diagnosis, lab results, together with information about what procedures were performed. With this information input into clinical governance bodies in the service system, operations can be optimized around circumscribed protocols. Standard methods such as statistical process control [5] can also be applied. Optimizing service system operations around CPGs, on the other hand, is far more involved. These CPGs may involve a diverse array of services, assembled into a branching array of protocols whose enactment is conditional upon the clinical, functional and behavioral risk profiles of persons, at any point in time, over time.
Alignment of service system operations with CPGs is far more challenging than time-bounded alignment of procedures with protocols. The challenges arise from at least two sources. The first is concerned with the breadth of information required to know whether the CPG is being enacted in a clinically appropriate manner. If the CPG recruits services that span a full continuum of services, e.g., medical/surgical services for various physical health concerns, mental health services (acute care, ambulatory, residential care, etc.), addictions services, and possibly outreach for homeless persons, given the downward socio-economic mobility of persons with problems such as schizophrenia—access to cross-continuum encounters data from one or more systems is required.
Secondly, even if such data are accessible, there is the foundational challenge when trying to align service system operations around CPGs at a population level: the challenges of identifying longitudinal patterns of service utilization in the data. This include: (1) knowing what was carried out, (2) knowing whether it should have been carried out, and (3) knowing whether outcomes intended by CPGs are being achieved, and if not, why not. Given the number of service entities involved in providing coverage for a complex CPG relative to the number of people who require those services, the relevant data are likely to be distributed quite sparsely in a high-dimensional space.
If we cannot optimize processes we cannot see in the data, then pattern recognition methods must be employed with these sparse, high-dimensional arrays of continuum and time-spanning health service data in order to identify the patterns. This paper illustrates a method for identifying high-prevalence patterns of service utilization (PSUs) in high-dimensional health service datasets associated with clinically specified sub-populations, e.g., persons with a confirmed diagnosis of schizophrenia. The method is built on a foundation of well-understood graph community detection machine learning methods—Louvain [6]. However, importantly, the methodology employs these community detection methods in a nested, iterative way to yield PSUs that are relatively homogeneous with respect to function and are tied in clearly clinically discernable ways to clinical cohorts.

1.2. Abundance and Scarcity of Published Work in ML-Derived Supports for Effective Service System Operations

The objectives of the work presented in this paper are ultimately practical. However, the research also seeks to advance methodological knowledge more broadly. The goal is to supply a methodology that addresses a pronounced gap in an otherwise very large body of work that employs various machine learning (ML) methods with health datasets, to promote better care.
This gap in the literature is covered in [7], who proposes a simplified model within the health domain that loosely groups a diverse array of machine learning-derived information products (ML “Knowables”) into nine layered elements that extend from the intracellular “omic” layer up to the population epidemiological level—see Figure 1. Noting the positioning of CPG-relevant analytics in this scheme (layers 6), the research work reported in this document is located within layer 6, 7, and 8, where the most prominent gap can be noticed. The scheme depicted in Figure 1 is abstracted from a review of roughly 270 studies employing machine learning with health data.
To summarize (with a small number of illustrative references):

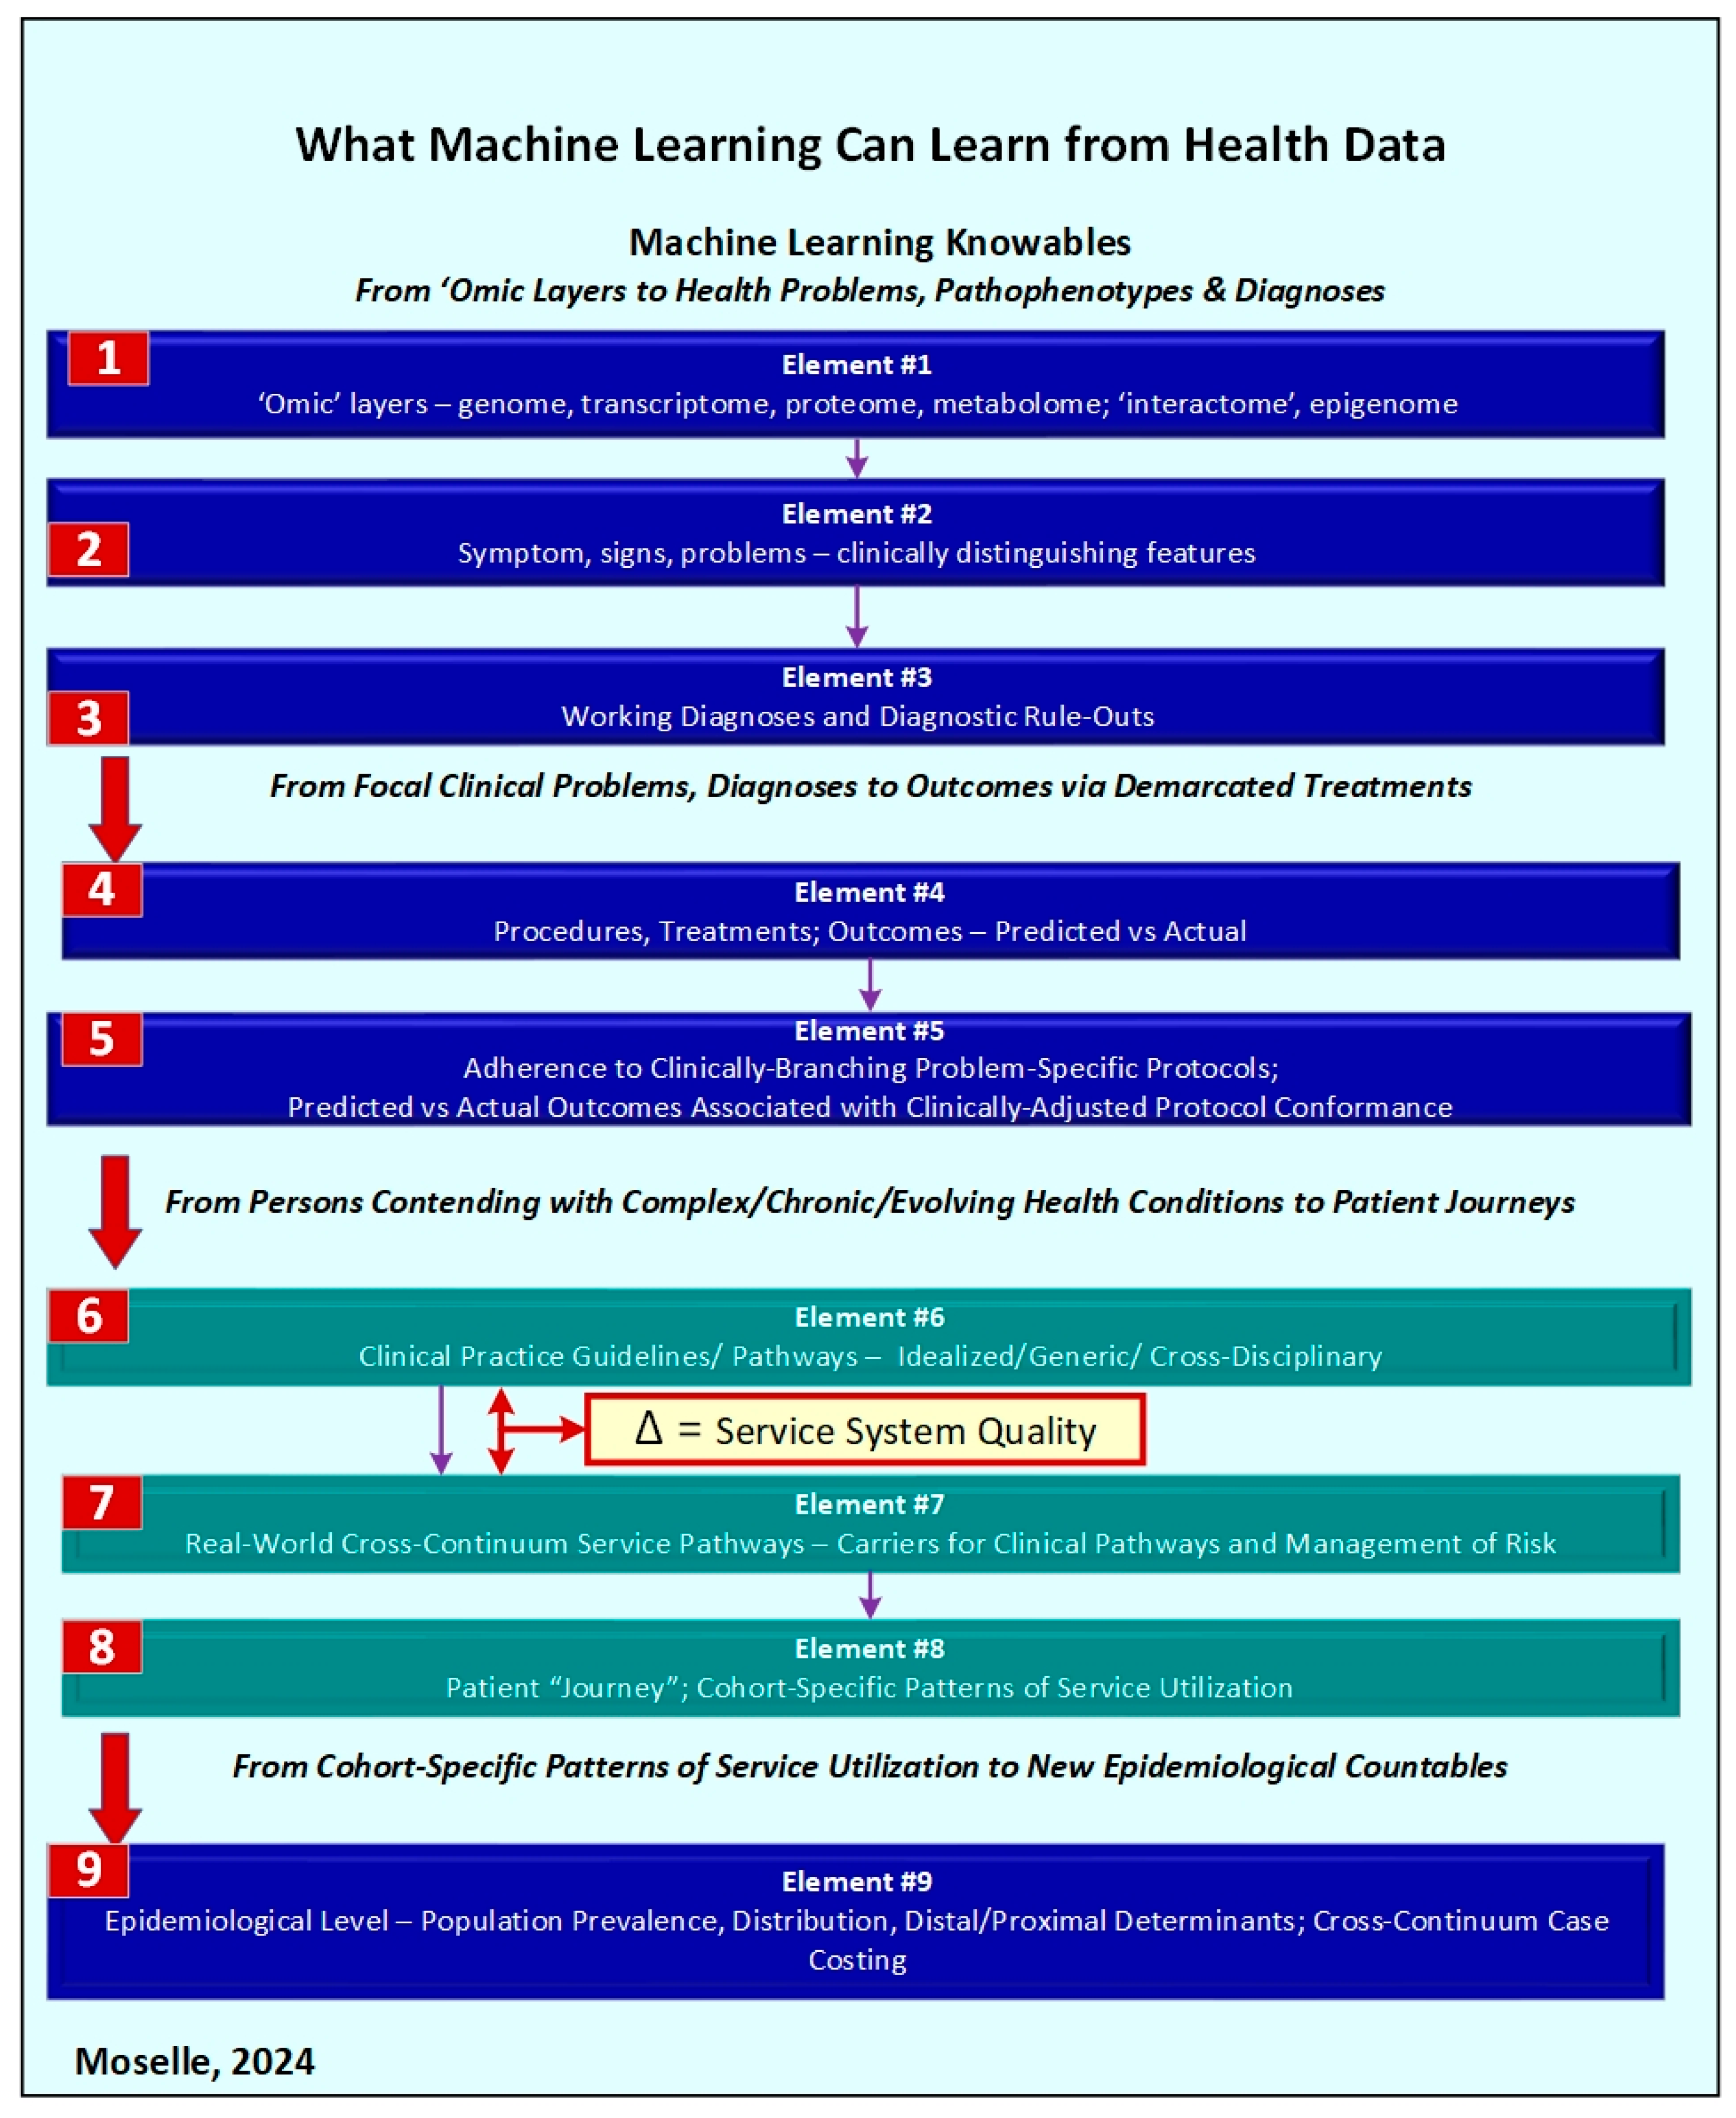
Element # 1—‘-Omic’ Layers:

These refer to the full range of molecular interactions that can occur at a cellular level, either between or within families (e.g., protein–protein interactions; protein-DNA interactions). Trans-omic models are constructed from contents located at multiple ‘-omic’ layers (e.g., genome, proteome, transcriptome) and describe the connections between genotype and the expression of genotypes in far more complexly structured phenotypic entities, ranging from body structures to disease entities. Graph/network modeling methods are distinctively well-suited to pattern recognition and clinical taxonomic efforts that span the omic levels [8]. Details on the use of graph/network methods employed to construct these “trans-omic” entities is provided in [8].

Element # 2—Symptoms, Signs, Problems:

These contents include subjective experiences of the patient (symptoms) and impacts of those symptoms, together with externally observable features that are directly accessible to the diagnostician. A major body of work employing graph-based deep learning is concerned with extracting clinically relevant signals from a large array of sources relating to a diverse array of diagnostic entities. A thorough analysis of this body of work and assessment of potential and future directions is provided in [9]. While much of the work compares performance against interpretations made by clinical experts to train algorithms, some of the work is concerned with the relative performance of humans vs. machine, e.g., [10].

Element # 3—Working Diagnoses and Rule-Outs:

There are two relevant bodies of published material: (1) work that seeks to extract diagnoses from free text-based documents, and (2) work that seeks to establish a diagnosis or identify cases based on material contained in a patient record. Regarding the first category, there is a large literature employing Natural Language Processing (NLP) methods. Many of these works are concerned with extracting discrete diagnoses or creating labelled datasets for supervised machine learning procedures from free-text radiology reports [11,12,13,14]. Similar work has been carried out with other types of source free-text documents to extract categories of information that are quite distinct from what would be featured in radiology reports, e.g., health-risk behaviors from mental health records [15].

Element # 4—Procedures, Treatments, Expected Outcomes:

Moving up from Element # 3 to Element # 4, NLP methods may be used to identify procedures or treatments that were performed, using free text or other source documents; NLP and other ML methods may also be used to determine effectiveness of procedures, or to identify treatments (e.g., molecular-level interventions) that are more/less likely to produce clinical benefit. Additionally, there is a substantial body of work undertaken and reported recently that employs network medicine methods to support the personalized medicine agenda. This agenda seeks to create clinical phenotypes anchored in processes taking place at a molecular level or organ or body level, and target interventions to those processes. Work in the field spans a range, from precision medicine at a pathophysiological/molecular level, e.g., [16], to work focused on specific conditions, including a large body of literature on machine-learning-based approaches to cancer care [17,18,19,20,21], celiac disease [22], diabetes [23], and allergic disease [24].

Element # 5—Problem-Specific Protocols—And Expected Outcomes:

The focus here is on problems which may require an array of interventions, particularly when there are multiple etiologic factors involved in the production of arrays of related diagnostic entities. Outcomes associated with care that conforms/does not conform to protocols have been extensively studied using various classic statistical methods, e.g., [25] for work concerned with protocol-based care for sepsis. However, the literature becomes quite thin with regard to the use of ML approaches to determine whether care conforms to protocols, or to evaluate outcomes associated with care that conforms to protocols. With regard to outcomes, ML methods are being used to estimate risk for outcomes or predict outcomes, including risk for rehospitalization [26,27], and psychiatric readmission [28].

Element # 6—Clinical Guidelines/Clinical Pathways

Clinical practice guidelines consist of structured sequences of clinical interventions [29]. Rotter et al. [30] further stipulate that a clinical pathway consists of a translation of generic clinical practice guidelines into processes taking place with local health service system structures. In other word, clinical pathways are clinical practice guidelines translated into local service system terms [30]. ML and related procedures have been used to provide visibility into factors located on care pathways that predict key interventions located on the pathway, e.g., the use and speed of thrombolysis in acute response to stroke [31].

Element # 7—Service Pathways

Service pathways are “real-world” depictions of activities that actually take place following a clinical pathway within a local array of health services. These pathways are keyed to problems that do not lend themselves to complete resolution at any particular service unit, and are therefore embodied as networks of interactions of patients with networks of providers who are associated with service units. These Service Pathways may then be assembled into collections at a patient-level to reflect their point-in-time and longitudinal health profiles, the local contexts of their lives (including environmental factors and distal/non-medical/social determinants of health), local service system capacity and operational characteristics, and possibly changing population-level “competition” for access to scarce services. Hence, service pathways consist of cohort-specific predictable recurring patterns of service utilization that actually take place within a local service system [32,33,34].

Element # 8—Patient Journeys

Assembled from one or more Service Pathways. They reflect the interaction of the person with a service system as they contend with possibly multiple problems, associated with bounded episodes of care or changing personal need [35].

Element # 9—Epidemiological Aspects

Treating processes (e.g., PSUs) as “countables” in order to estimate demand and measure impacts of efforts to alter service system dynamics [36].
There are very large numbers of studies covering Elements # 1–5, where the focus is on discrete diagnostic entities and associated procedures or protocols. The picture changes when the focus shifts to Element # 6, where the core unit of analysis is CPG adherence. There will generally be large numbers of clinical trials supporting each of the component recommended practices associated with each stage in the treatment of a chronic condition or with different branches in an array of trajectories common to a disease. These clinical trials form the evidentiary foundations for evidence-based CPGs. However, what is largely missing in the ML literature is work that operationalizes the construct “CPG-adherence” and evaluates the impacts of such adherence.
This thinning of the ML literature is equally apparent within the domains set out by Elements # 7 and 8, where the focus is on locating patterns of service events that span the health service system. This is also the case for Element # 9, which requires products of Elements # 7 and 8 to supply new trans-diagnostic “countables”.
One factor can at least be identified that could contribute to this clearly discernible trailing off of work in an otherwise very comprehensive literature: if benefits of CPG-based care for complex or chronic problems are at least partially emergent characteristics of adherence at all stages of disease progression within clinically complex entities, then studies would need to access very diverse longitudinal bodies of clinical features of persons, treatments and procedures, related longitudinally to a broad array of service entities, linked at a person level. Within this inevitably sparse and very high-dimensional space, every case is likely to be distinguishable. Based on well-established principles of statistical disclosure control [37], virtually every case would be regarded in principle as a carrier of risk for re-identification. The use of perturbative methods such as differential privacy [38,39], that alter the truth of the source data, must be ruled out because they require the results of analyses of unperturbed data to demonstrate that analytical integrity has not been compromised [38]. Given the above, and associated limitations in real-world public access to the required data [40], the literature covering Elements # 6–9 is very thin.

1.3. Objectives

The work presented in this paper is organized around the following questions that are directly relevant to quality assurance/quality improvement activities in a complex service system working under conditions of fiscal constraint to meet the needs of populations with complex problems:
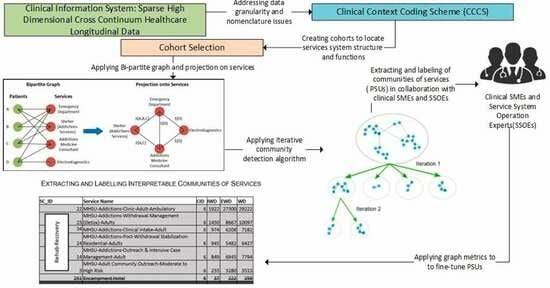
  • What mechanism can be used to address the cross-continuum data granularity and nomenclature issues to generate intelligible dataset that can be analyzed?
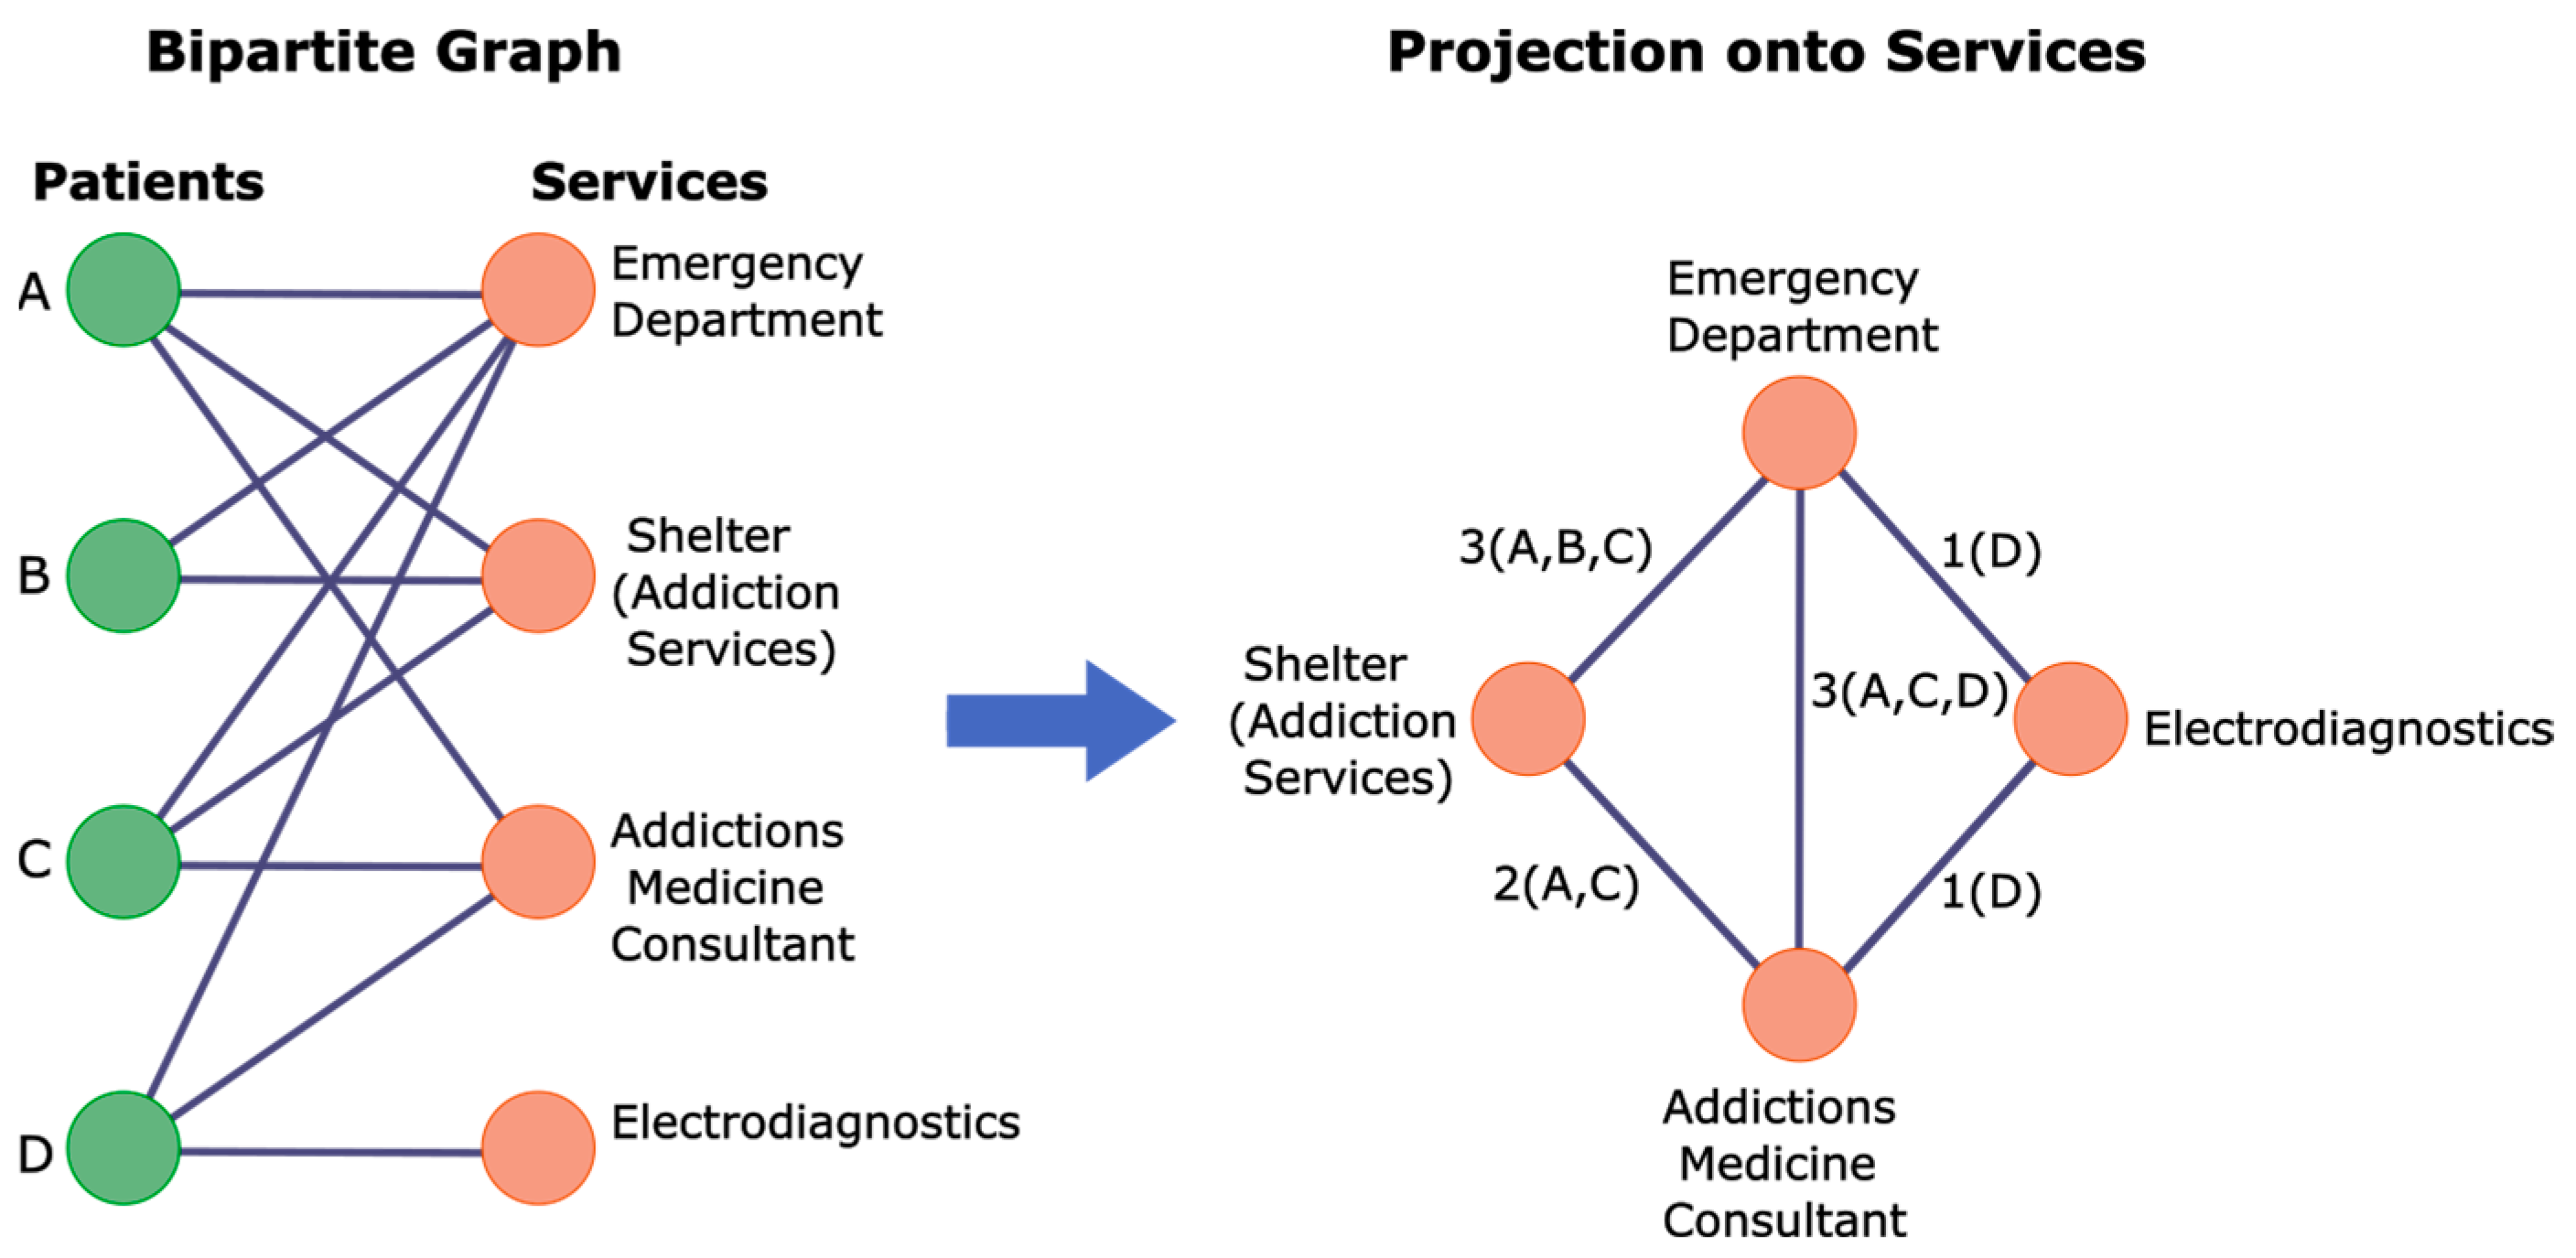
  • For cohorts with large volumes of interactions with diverse arrays of services spanning the continuum, can graph machine learning methods (community detection) be employed to extract clinically understandable clusters of services (PSUs), which reflect distinctive needs?
  • Methodologically, what mechanism can be used to determine the optimal number of communities?
  • Within a given community of services, can one separate out those services that reflect common features of cohorts, such as need or risk, versus those services that are keyed to variable features of persons within cohorts? Stated in slightly different terms, can one separate out services that “belong” in communities versus services that are forced into one community or another by the community detection algorithms?
  • Can one generate results that are readily and correctly interpretable by persons who do not have a background in statistics, research, or data science?

2. Methodological Approach

2.1. Source Data

Source data for the work consists of retrospective longitudinal transactional data contents extracted from a single instance of a Clinical Information System (CIS) deployed across the continuum of services provided by one of the Health Authorities within Canada (hereinafter referred to as “the health service organization” or “host organization”). The span of the health service organization includes almost all secondary and tertiary services for all ages, for persons contending with medical/surgical issues and/or mental health/substance use issues. This includes acute care/intensive care services, hospital and community-based emergency response, ambulatory services, residential care services for older adults or persons contending with mental health issues, case management services, and a range of addictions harm reduction or rehab and recovery-oriented services. The encounter data accessed by this study consists of approximately 10 million encounters over 7 years for approximately 1 million patients. With the exception of a small number of restricted services where data are strictly embargoed (e.g., services for persons who are victims of sexual assault) this represents data for all service recipients. To access the source data, a certificate of approval was provided by the University of Victoria Research Ethics Board (REB), following the British Columbia, Canada Ethics harmonization guideline.

2.2. Features Selection

The data used for this study consist of patients encounters data collected over several years by the host organization. The data collected for this study included the following: (1) demographic data: gender, and (2) encounters data: patient identifier (Patient ID), encounter number (encrypted), encounter type, age at encounter, service code, entry code (e.g., via emergency), admit date, discharge date, transfer date, transfer-to, transfer-from, discharge disposition, admit facility, admit building, admit unit name, admit location, and location classifiers.
There are three main activities required to conduct the analysis for the work reported in this document: (1) addressing the nomenclature and data granularity issue, (2) cohort selection, and (3) graph analytics. With regard to addressing nomenclature and data granularity issues, all the location and service-related data including service code, admit facility, admit building, admit unit name, admit location, location classifiers were used to generate Service Class Names and Service Class IDs. At the end of this step all location and service-related fields were replaced by the equivalent Service Class IDs and Service Class Names. More details on this step are provided in the section below. To select the cohort of interest for this study, the Service Class ID, the demographic data and remaining encounters data, including patient identifier, encounter number, encounter type, age at encounter, service code, entry code, admit date, discharge date, and discharge disposition were used. For the cohort of interest chosen for this research, the transfer details were not needed. As a result, the transfer date, transfer-to, and transfer-from fields were not used. During cohort selection process, any of the chosen demographics or encounters data fields can be used as a filter to fine-tune the cohort selection criteria. More details on the cohort selection process are provided in a subsequent sub-section under the analysis and results section. Finally, to create the bi-partite graph to conduct graph analytics, once the cohort selection was completed, only the patient identifier and Service Class ID were used.

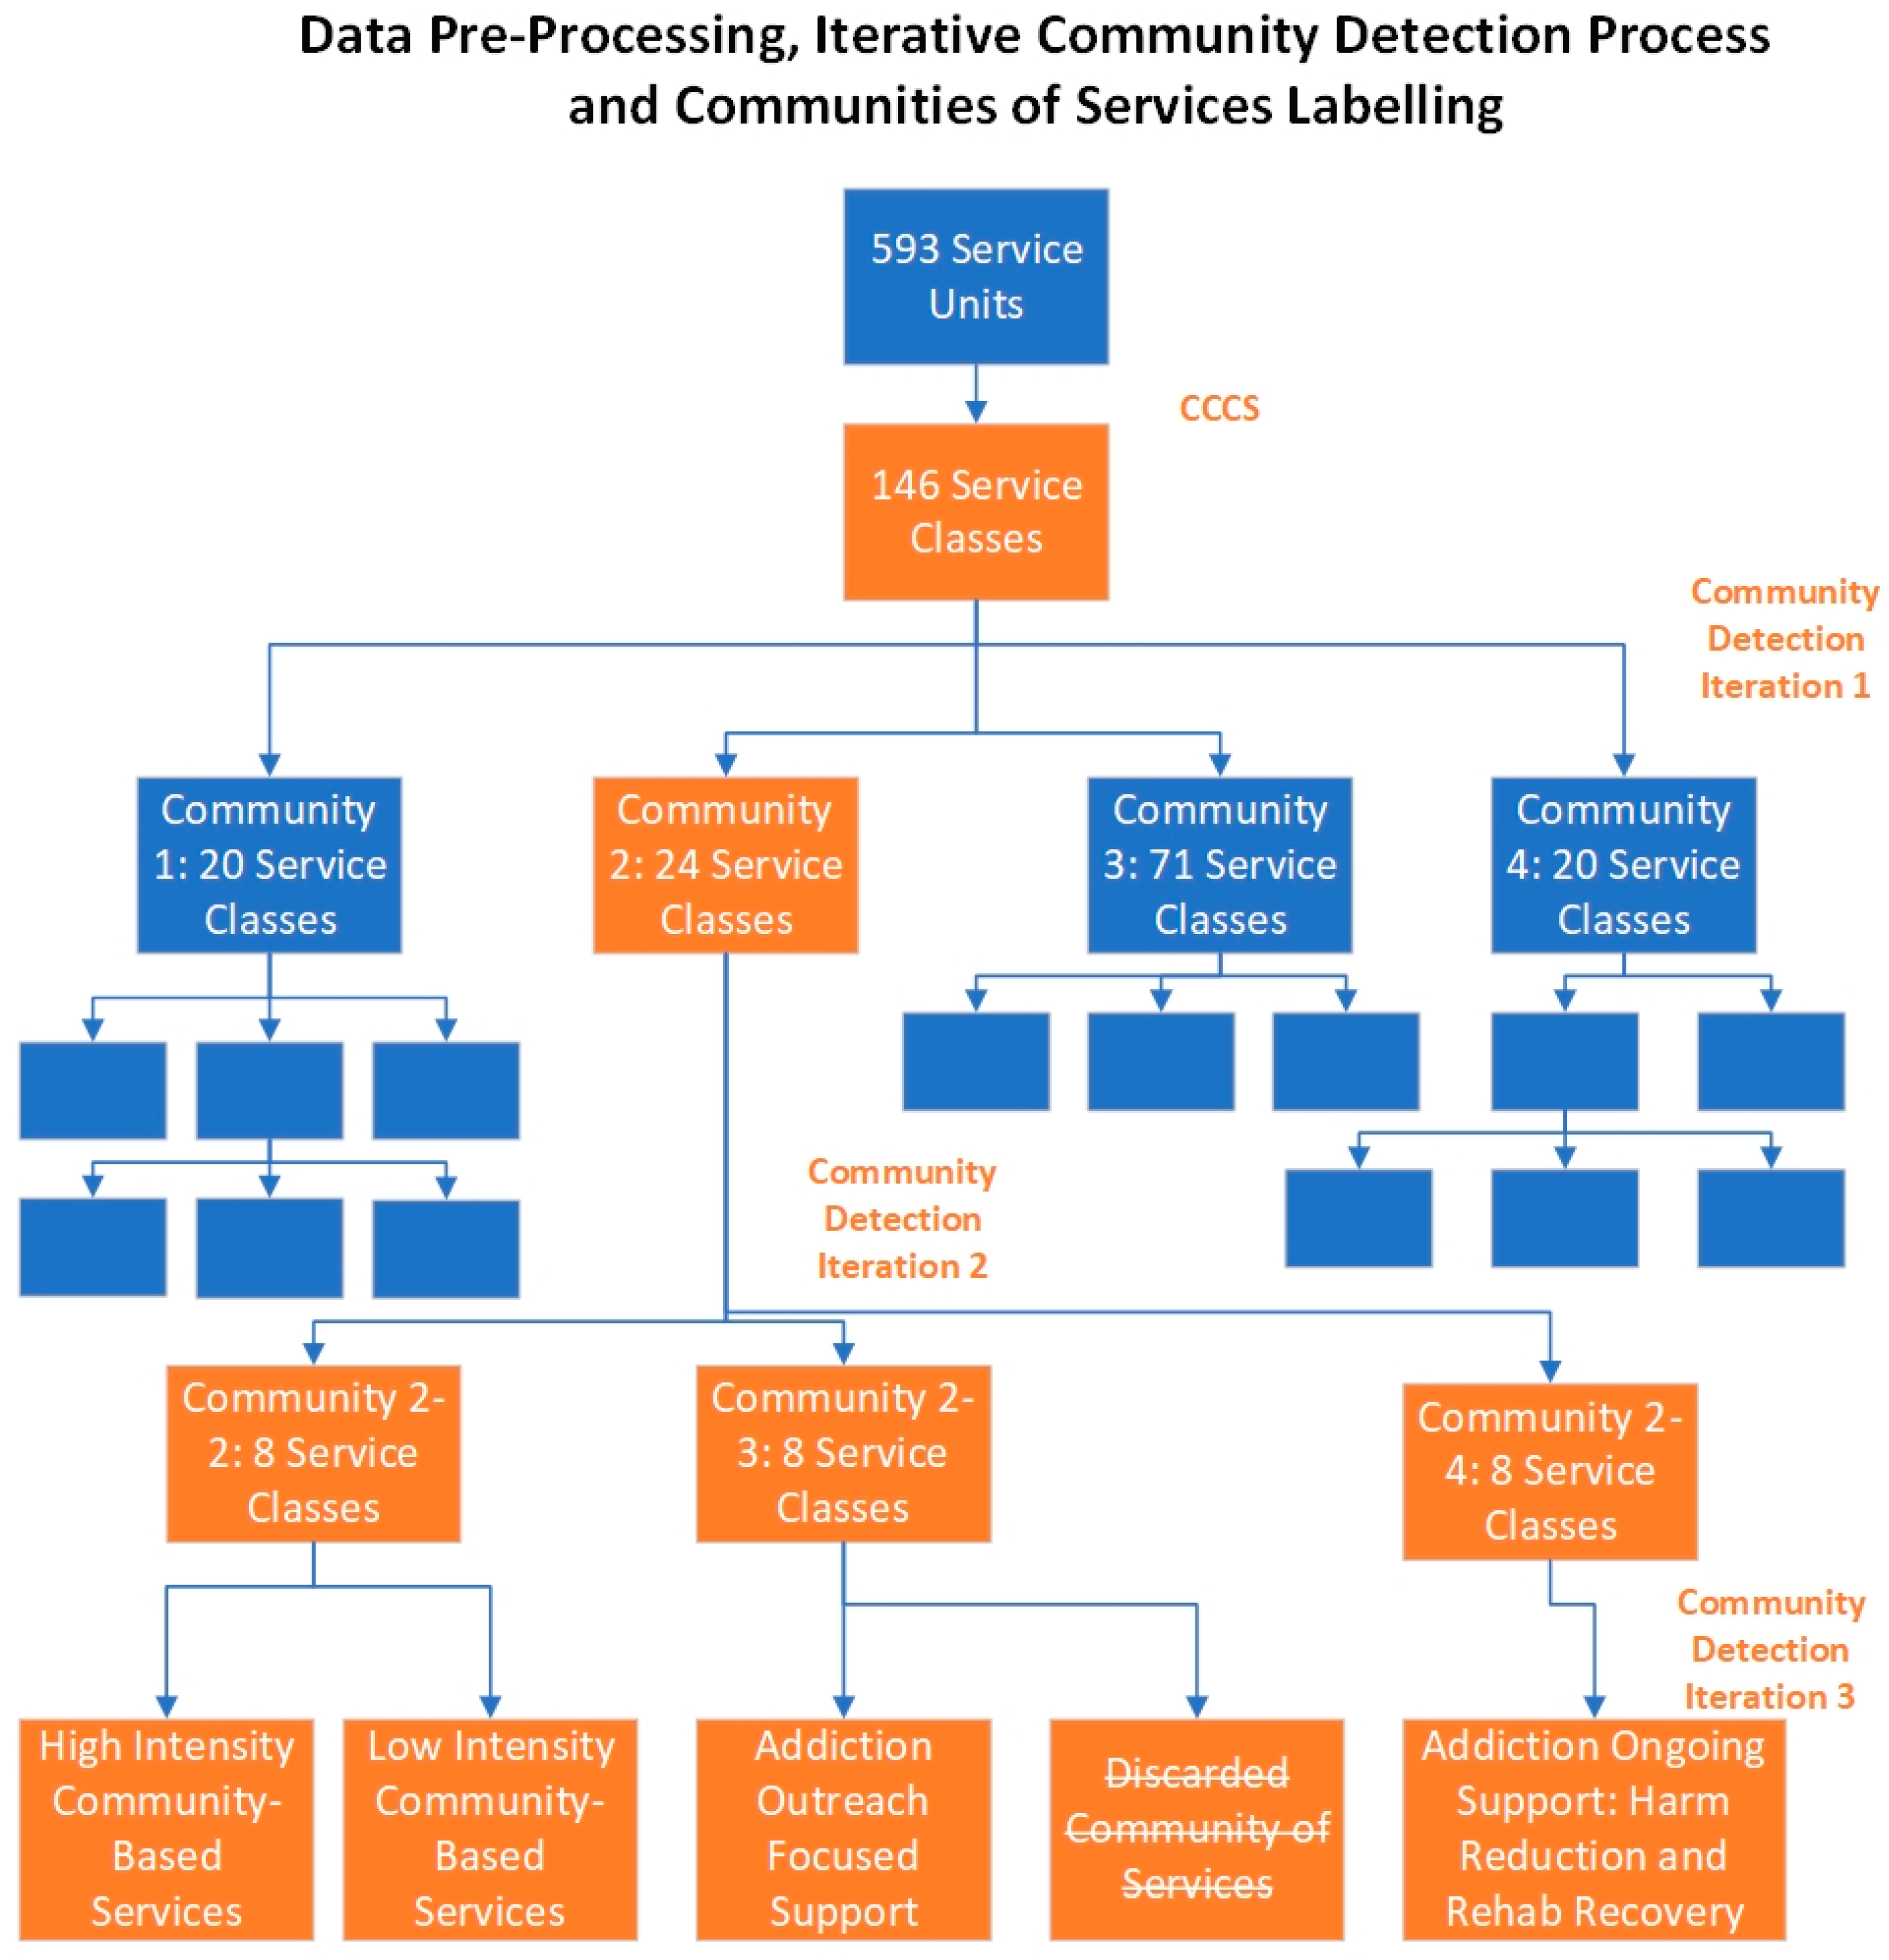
2.3. Data Pre-Processing and Data Re-Engineering—Addressing Nomenclature and Data Granularity Issues

The health service organization consists of an array of programs and services that is architected as roughly 2000+ Service Units within the implementation of their CIS. In modeling the structure and dynamics of patient interaction with services, meaningful distinctions between functions performed by services must be preserved. However, there are issues of spurious or unnecessary granularity that need to be addressed in the raw source encounter data. The term “spurious granularity” refers to Service Units that show up in the data as different entities when they perform identical functions on behalf of cohorts of similar persons. The term “unnecessary granularity” refers to Service Units that have three features: (1) they are identified as distinctive Service Units in the CIS location build; (2) although they are not functionally identical, the distinguishing features are not germane to a particular modeling task at hand; and (3) given the sparseness of the data, it is unlikely that various machine-learning-based clustering procedures will group these services together.
An example of “unnecessary granularity” would be an Emergency Department, which will show up in the CIS location build as an ambulatory treatment area, a trauma bay, a treatment bed, an area named “general”, and a checkout area. There might be modeling purposes that require this level of granularity. However, for a more cross-continuum macro-level view of patient encounter histories, this level of granularity may break otherwise-homogeneous patterns of service utilization into fragments, based on where the patient was located for a single Emergency Department encounter.
An example of “spurious granularity” is the presence of 90+ homecare service units in the host organization’s CIS location build. For operational and contracts management purposes, these locations need to be preserved as unique entities. However, for the analysis required for this study, these represent only one functional entity that is responsible for dealing with homecare-related services.
Additionally, Unit Names associated with Service Units in the CIS location build are often opaque or uninterpretable. For example, an addiction post-withdrawal stabilization unit appears in this location build as “Holly”, or there is a Service Unit named “Clinics” which provides ambulatory services for children and youths with physical disabilities. There are large numbers of Service Units where the Unit Names are uninterpretable, or interpretation is a matter of guessing.
The Clinical Context Coding Scheme (CCCS) [41] was designed as a flexible solution to issues of data granularity and nomenclature. This scheme is organized around six sets of codes, constituting a semantic layer applied to all 2000+ Service Units. The roughly 200 Service Classes employed for the modeling in this paper consist of equivalence classes formed by the application of these code sets to those Service Units. Also, each Service Class has a name that bears some discernible relationship to the functions performed by the component Service Units. This enables visualizations of patterned entities to be understood, and it also supports the use of any supervised machine learning procedures that require meaningfully labeled data. The modeling activities reported in this paper are performed on patient–service encounters with Service Classes.

2.4. Creating Cohorts to Locate Service System Structures and Functions

The community detection algorithms employed in this work will generate clusters of Service Classes, without regard for the underlying reason for groups of services to co-occur in multiple patient journeys within a cohort. There are two classes of reasons for this co-occurrence; there are cases where services appear as interoperating units because the services collectively perform a distinctive function in a consistent fashion for diverse groups of patients. For example, laboratory services, medical imaging, and emergency departments will co-occur in the records of large numbers of patients who are contending with a very diverse array of problems.
However, the clustering of some services reflects the dynamics of service access by groups of patients, even if the functions performed by component Service Units are not dependent on one another, and/or the component services are located under distinct administrative or clinical management structures within the health service organization. For example, a cluster might emerge that consists of three services: hospital-based emergency departments, addictions medicine specialist consultation services in emergency departments or medical/surgical acute care units, and a community-based-maximum-23-hours-stay shelter for persons who are under the influence of drugs or alcohol. The services are not linked by diagnosis and are not located under a single administrative unit within the health service organization.
The connections between these services represent recurring patterns of cross-continuum service access on the part of select groups of patients, such as homeless persons who are heavy users of various substances and experience a host of physical health problems. When graph methods are employed for other cohorts, e.g., older adults contending with heart failure, the emergency department may show up in a different cluster that includes electro-diagnostic, cardio-vascular treatment and rehabilitation services.
To detect cohort-specific clusters of services, the starting point is the identification of a cohort of concern using an array of clinically characterizable features. These cohorts of concern are identified and defined by Subject Matter Experts (SMEs). Graph community detection algorithms are then executed on the cohort. This enables the identification of services that reflects characteristic functions of the services, compared to cohort-specific clusters that reflect the needs of cluster members and the efforts made by those members or providers to connect those persons with services.

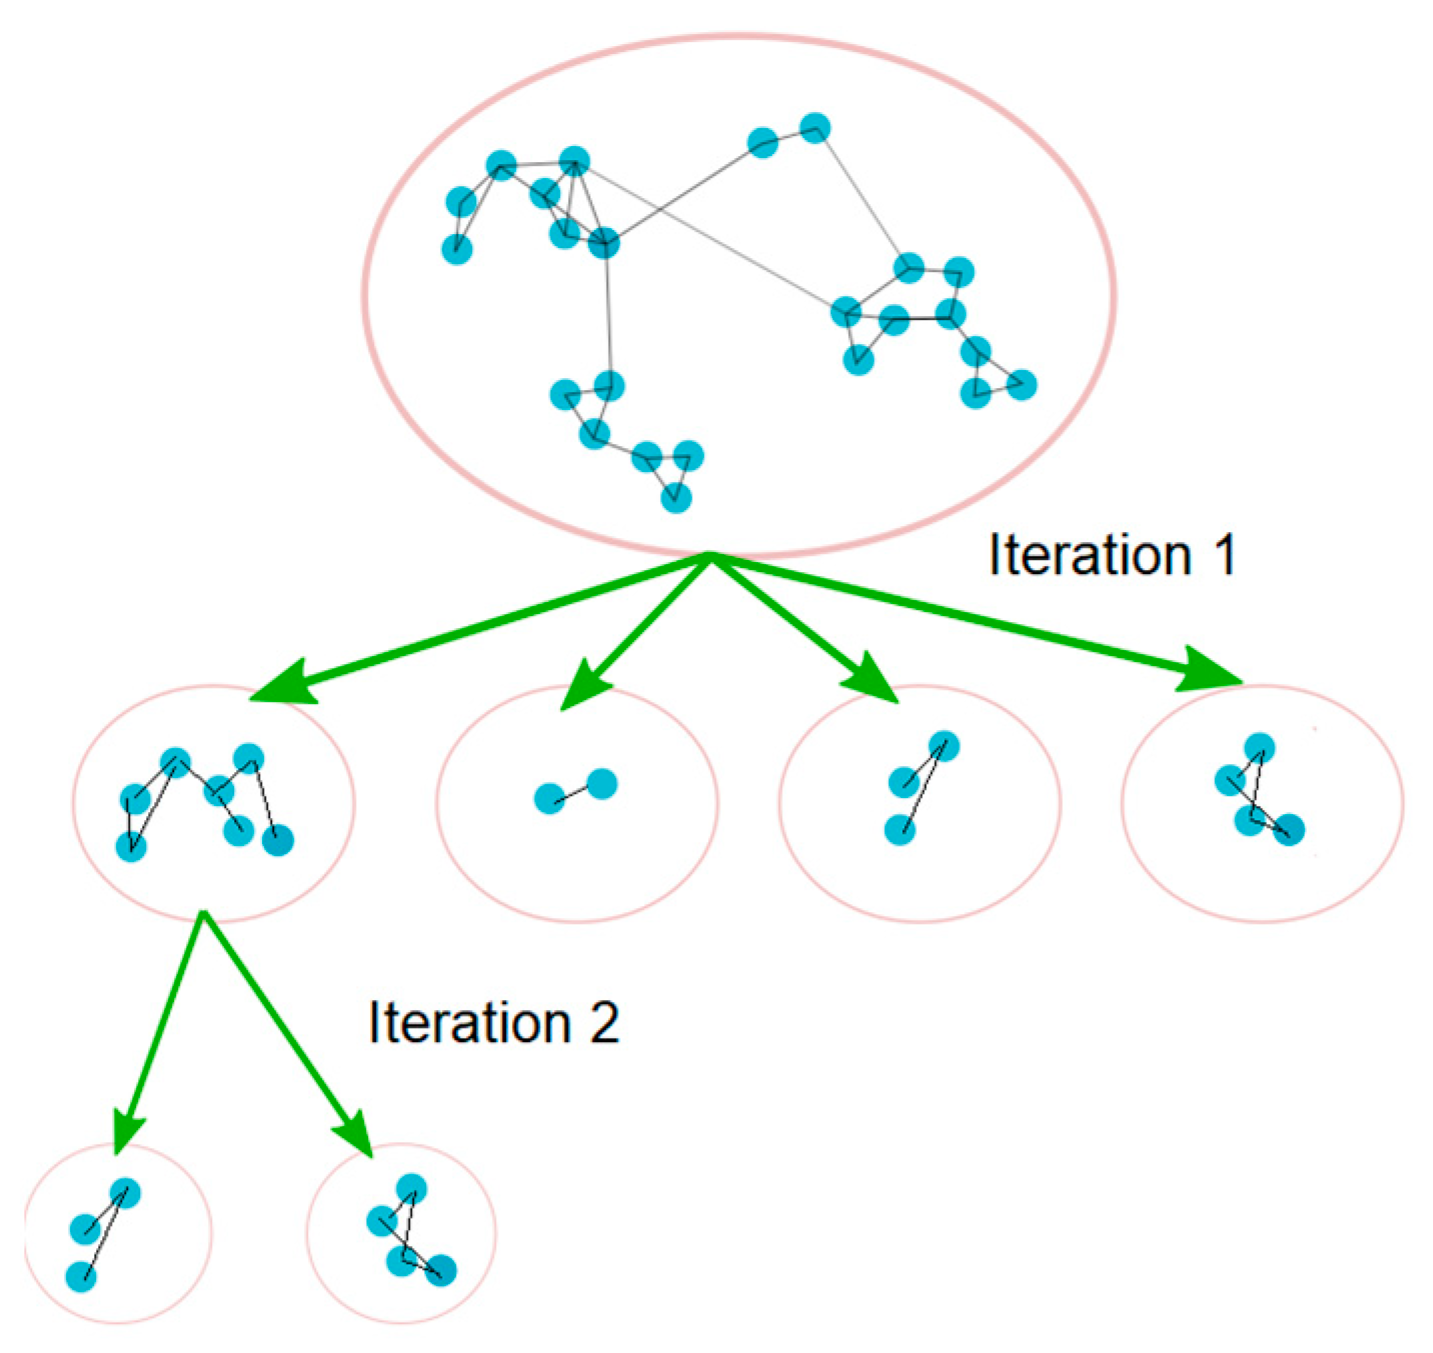
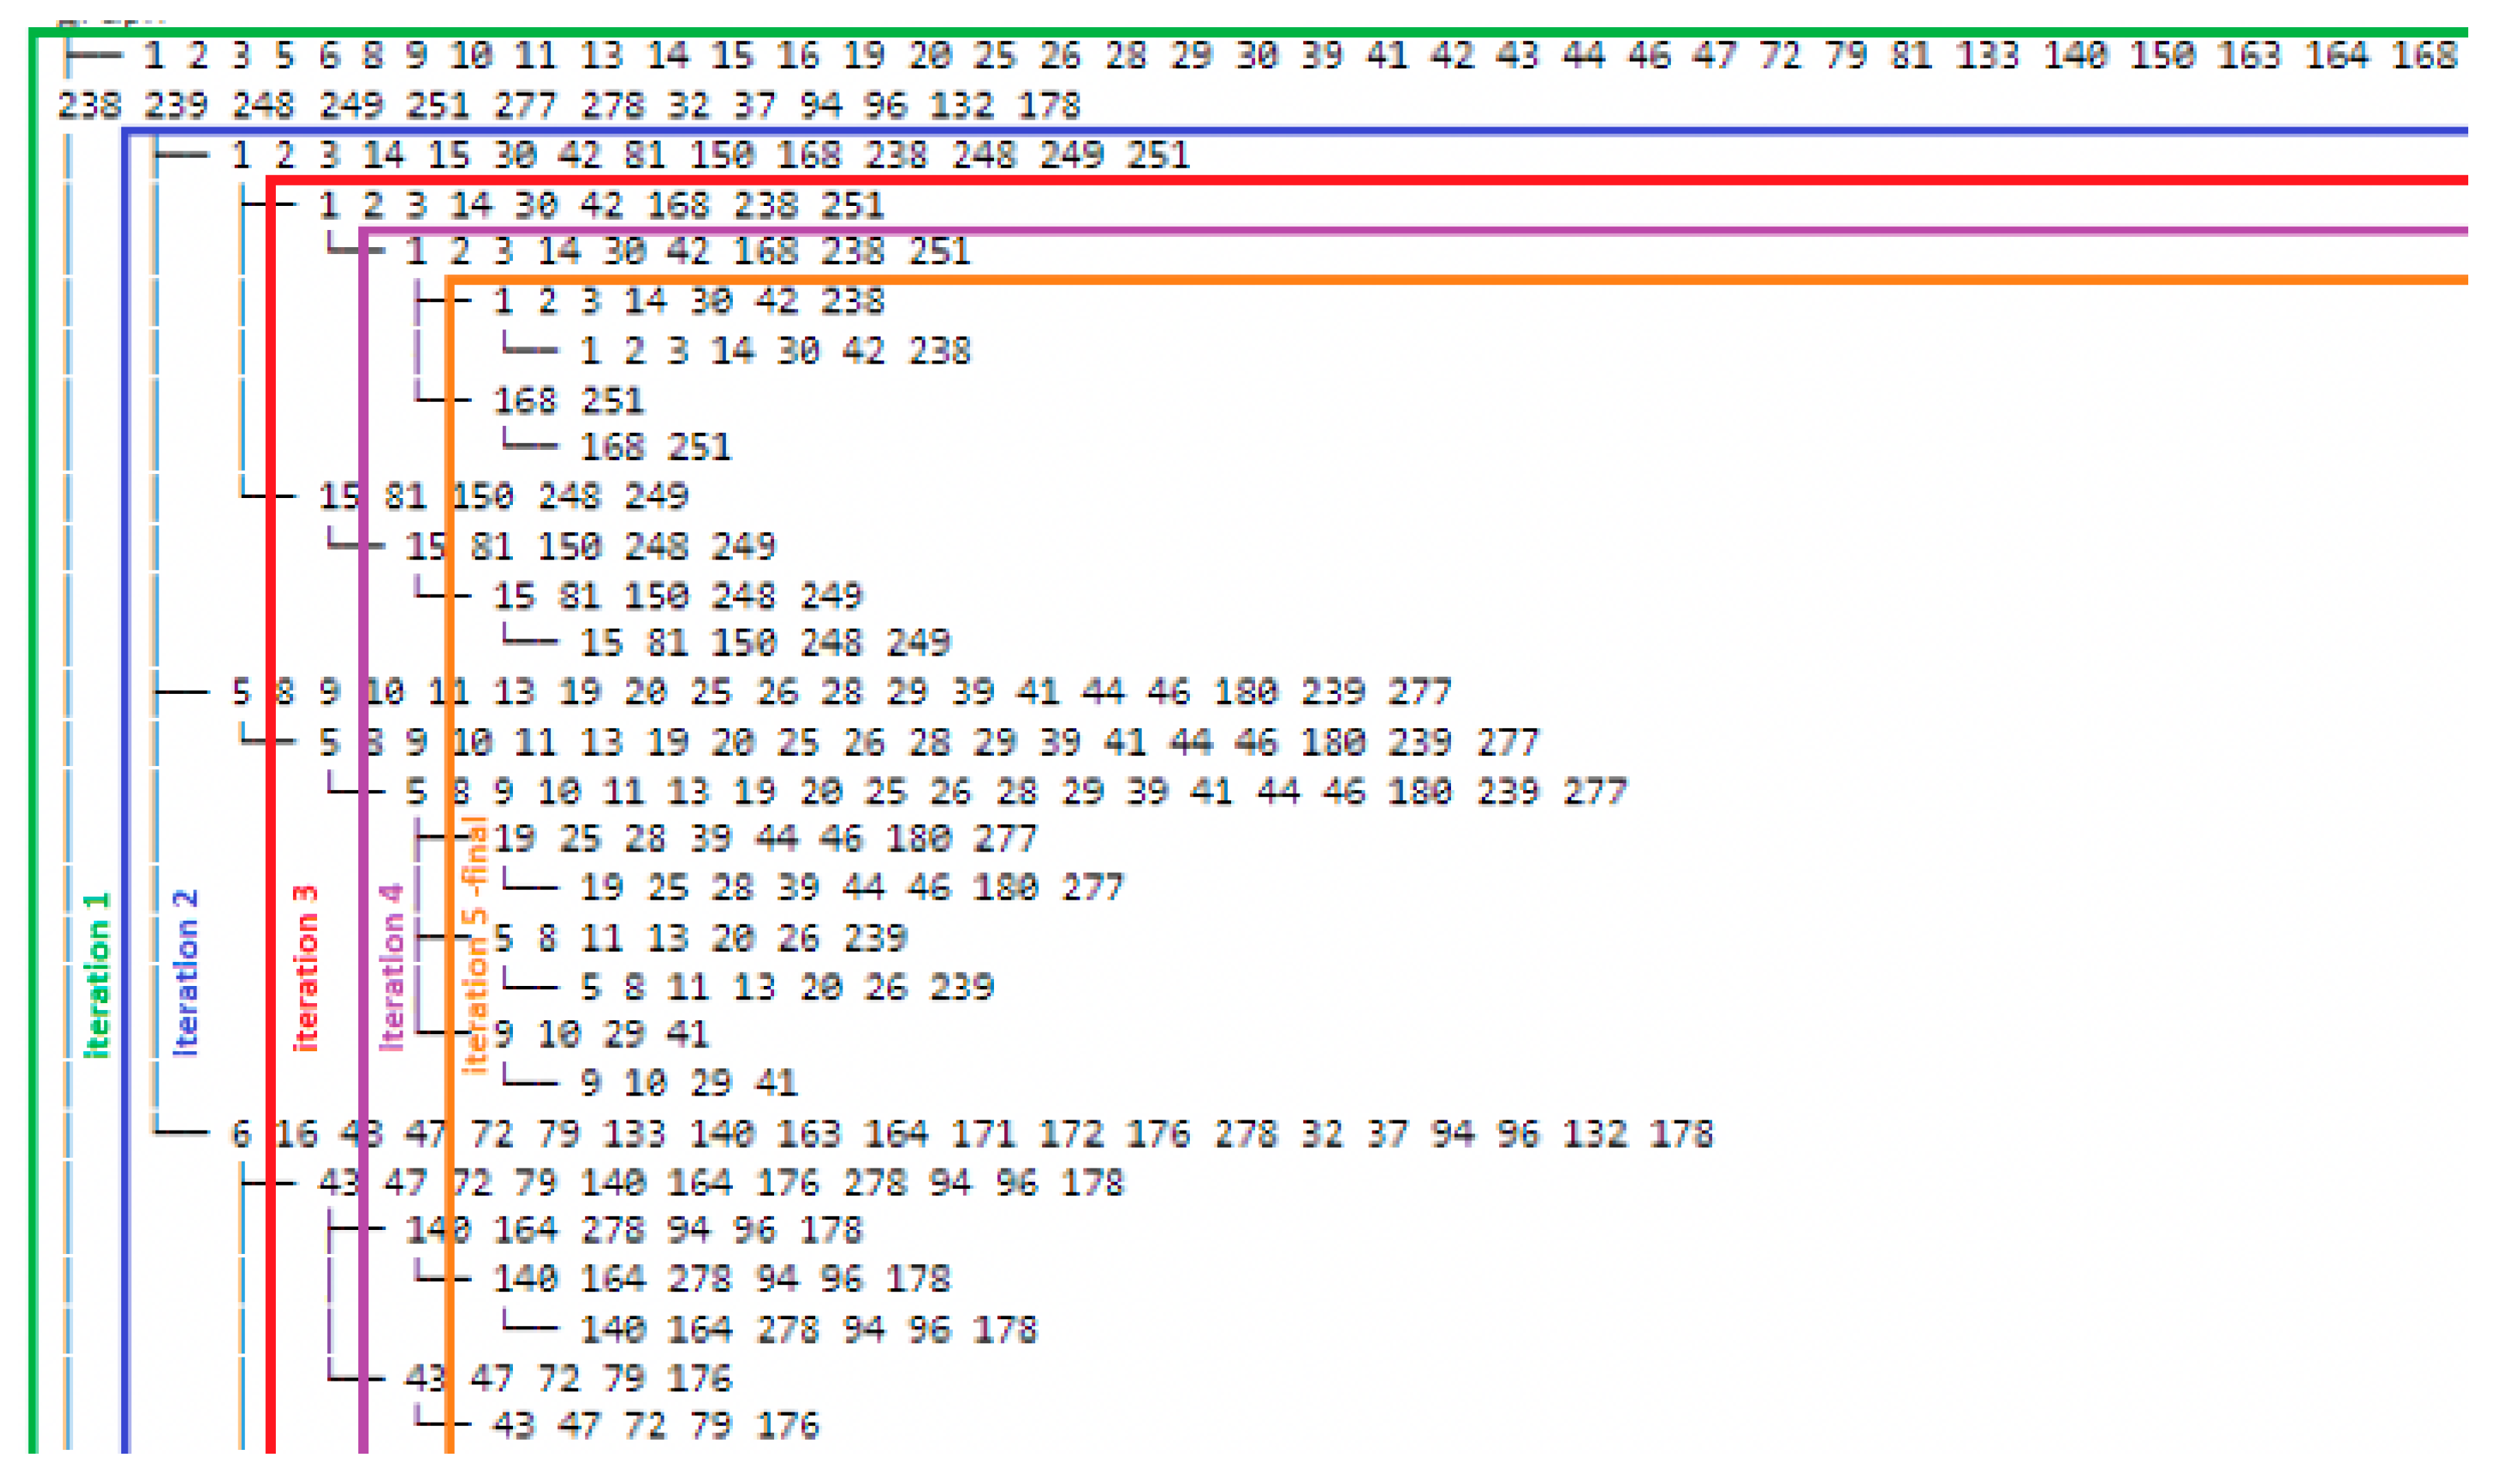
2.5. Generating Communities of Services

The raw data for the work presented in this paper consists of encounter histories for every patient with a history of access to services within the health service organization since 2016—one million people and ten million encounters. Each encounter contains an anonymized patient identifier, a unique encounter identifier key, date and time stamps, a unique CCCS Service Class ID and Service Class name.
The encounter data are engineered as a bipartite graph consisting of patients and encounters, using nodes with edges connecting patients to Service Classes. A patient is connected to a Service Class when he/she uses the service. Given a bipartite graph, one can perform a bipartite projection onto services. A given pair of Service Classes is connected by a patient when they are both accessed by the same patient. The number of patients who use both Services Classes becomes the weight of the edge connecting those two Service Classes (see Figure 2).
After completing the bipartite projection onto Service Classes, we use the Louvain graph community detection algorithm [6] to uncover the grouping of Service Classes that reflect relatively high-prevalence PSUs by patients. There are other well-known clustering algorithms such as Fast-Greedy, Edge-Betweenness, and Leading-Eigen [42]. However, through the analysis conducted, it was found that the Louvain algorithm often produces the most intelligible results.
The Louvain algorithm works by maximizing the modularity value which is defined as
Q = 1 2 m i , j A i j k i k j 2 m δ c i , c j
where A i j is the weight of the edge between node i and node j, k i is the sum of the edge weights over all the edges that are connected to node i, and m is the total edge weights in the graph. Here, c i is the label of the community in which node i belongs to. At the beginning each node has its own community. The algorithm starts by randomly choosing a node, then checks other nodes attached to that node to see if merging the communities would result in higher Q.
This algorithm works with the weights associated with all pairs of Service Classes in the bipartite projected graph. They create clusters that maximize the weighted degree of interconnection of Service Classes within a community (in-degrees), while minimizing the degree of interconnection with other Service Classes (out-degrees). Modularity is a measure that reflects the success of this conjoint optimization of in-degrees and out-degrees.
Community detection methods may be applied in a nested fashion, iteratively within communities generated at a previous iteration (see Figure 3). While conducting the analysis, it was noticed from the clinical perspective that the results were often still too coarse, with many heterogeneous Service Classes clustered together, when nested iterative community detection was not applied. It should be emphasized that the concept of iteration referred to here is not the same as the number of passes in the Louvain algorithm. In the proposed approach, once the Louvain algorithm has generated the first set of communities, each community is isolated and treated as a new graph and the Louvain algorithm is applied again on each of the isolated graphs. This means that each community, once generated, can be considered as a graph by its own and therefore we can apply the Louvain algorithm to it, resulting in smaller sub-communities. Because each iteration results in a finer-grained delineation of service system structures, the total number of communities will increase until communities can no longer be divided any further, i.e., further iterations do not yield a finer-grained delineation of the community structure in the data.
To demonstrate the iterative community detection process, Figure 4 provides a snapshot of results for an illustrative community detection iteration process. As an example, let us consider a sub-community with Service Classes ID: 1, 2, 3, 14, 15, 30, 42, 81, 150, 168, 238, 248, 249, 251. Suppose this sub-community is one of the communities that were generated as the result of iteration 2. At iteration 3, this sub community splits into two, including sub-community 1, 2, 3, 14, 30, 42, 168, 238, 251, and sub-community 15, 81, 150, 248, 249. At iteration 4, only sub-community 1, 2, 3, 14, 30, 42, 168, 238, 251 is broken further into sub-community 1, 2, 3, 14, 30, 230, and sub-community 168, 151. However, it can be noticed that sub-community 15, 81, 150, 248, 249 remains unchanged at iteration 4. Finally, at iteration 5, we can observe that the community detection algorithm is no longer able to break the last sub communities any further. As a result, the iteration stops at this level and the result is reviewed with a clinical subject matter expert (SME) and a service system operation expert (SSOE) to determine the iteration that provides the result that is most clinically meaningful.

2.6. Extracting PSUs from Communities of Services

Communities of service that are generated from cross-continuum health service data by unsupervised graph clustering procedures will typically include services that are used by almost all persons within a cohort who interact with any of the services in the cluster. They may also include services that are associated with variable features of fractions of the total group of people who use the services within a community. To identify a core set of services within a community that embody a clinically meaningful function that relates to the needs of a clinically characterizable cohort, the following heuristics was employed:
  • Quantitative criteria using metadata: graph metrics including the graph internal weighted degree, the external weighted degree, and the weighted degree (sum of internal and external weighted degrees) were used, to determine the cut-off point.
  • Qualitative criteria: these include judgments from clinical cohort-specific subject matter experts regarding the characteristics of the cohorts within which the community detection has been run.

3. Analysis and Results

3.1. Analysis Setup: Cohort Creation

As described previously, the CCCS codes were layered onto the raw location data to yield a re-engineered, analysis-ready version of the encounter data. To illustrate the methods and distinctive products associated with the proposed method, a cohort of people contending with schizophrenia was created. This was based on their access to Schizophrenia Services. The schizophrenia cohort was composed of 2008 patients (772 females, 1233 males, and 3 unknown gender), aged between 12 and 87 years, with a range between 1 and 200 interactions. For graph analytics, only two columns are required. Hence, as shown in Table 1, the data representing this cohort used for graph analytics is only composed of the Patient ID and Service Class ID representing the patients encounters.
The tools and languages that were used include R 4.1.3 and Python 3.10.4. The description of the custom R Shinny tool was used to generate/analyze cohorts, as well as the Python code, which can be provided upon request.

3.2. Generating Communities of Services

Going through the iterative community detection process is analogous to the process of separating wheat from chaff. Using the schizophrenia cohort as an example and applying the iterative community detection, several communities of services related to several areas of patients’ needs were generated. Some of the communities are made of services that are functionally connected and some are knit together by the features of cohort members.
A total of three iterations were performed: at the first iteration, 4 communities were generated, followed by 10 communities at the second iteration, then 22 communities at the third iteration. After three iterations, the number of communities did not increase above 22, hence meeting the stop criteria.
Table 2, Table 3 and Table 4 highlight the refinement process. The information presented in the table include Service Class ID (SC_ID), service class name, community ID (CID), internal weighted degree (IWD), external weighted degree (EWD) and weighted degree (WD). One of the four communities (community ‘1-2′) generated at the first iteration was used as an example. As illustrated in Table 2, at the first iteration resolution, community ‘1-2′ is made of a mix of various heterogeneous services. At the second iteration, as illustrated in Table 3, community ‘1-2′ is broken into three communities (‘2-2′, ’2-3′, and ‘2-4′) that are gradually becoming homogeneous with regard to rehab recovery and harm reduction treatment services.
At the third iteration, only the services that were in community ‘2-2′, ‘2-3′ at the second iteration are broken into two communities each (‘3-2′, ‘3-3′, ‘3-4′, and ‘3-5′). However, community ‘2-4′ from the second iteration remained unchanged. Subsequent iterations are not able to yield any additional breaking of the communities, hence the algorithm stops. Working with team members with a clinical and health services system operations background, it was determined that the third iteration provided an appropriate resolution with an interpretable community of services. With their help, as illustrated in Table 4, the various generated communities were reviewed and labeled as follows:
(1) High intensity community-based treatment (13, 10): this is the community of services that provide high intensity community-based treatment and support for people with severe psychiatric illnesses. (2) Lower intensity community-based treatment (26, 29, 20, 81): this is the community of services that provide lower intensity community-based treatment and support for people with severe psychiatric illnesses. (3) Addiction-outreach focused support (14, 243, 270): these are the services that provide support for people with high risk/high needs addiction problems. This is a linkage-focused set of services, not a treatment-focused set of services and a link to rehab recovery/harm reduction services. People using these services are mostly disfranchised, likely homeless and weakly connected to other services, and potentially high users of low barriers services such as the emergency. (4) Additions ongoing support (34, 22, 161, 23, 203, 21, 24): providing rehab recovery and harm reduction services. Under these services, people receive structured ongoing support to help with addictions problems. These services can be wrapped around patients to help manage various risk related to addictions problems.
Also, notice the removal of some services—represented in the table using strike-through texts (3, 74, 175 and 158) from within some of the communities due to a relatively lower internal weighted degree. Finally, notice the exclusion of the community made of service classes (30, 171, 272 and 275), labelled as “X”. These services were forced into one community by the community detection algorithm that must fit every service class into a community. In consultation with team members with clinical and health services system operations background, it was determined that these services do not display any interpretable characteristic or perform any function as a group. Also, notice their overall relatively low internal weighted degree across the entire community. Referring to the analogy previously described and equating this sorting and labelling process to “separating wheat from chaff”, the community of services (30, 171, 272 and 275) can be referred to as “chaff” and can be safely discarded.

4. Discussion

Figure 5 outlines the end-to-end process for extracting PSUs from a longitudinal, sparse/high-dimensional encounters data. Given the methodological nature of the paper, only the results of one of the branches of the iterative communities (community 2) were reported. However, the process outlined for community 2 applies to the other communities (1, 3, and 4) as well, and their corresponding sub-communities. Although not reported, at the end, a total of 22 communities of services were extracted for the schizophrenia cohort.
The cohort that was chosen to illustrate the methodology proposed in this paper interacted with a total of 593 Service Units. These represent services that spawn across the continuum of care and were documented as encounters in the host organization CIS. To extract any meaningful PSUs at this level of granularity (both “spurious granularity” and “unnecessary granularity”) is not feasible, regardless of the ML algorithm used. The application of CCCS provided an opportunity to address the granularity and nomenclature issues and reduce the dimension of the data and make it analysis ready. This step converted the 593 Service Units into analyzable 146 Service Classes, as illustrated in Figure 5. With the nomenclature issue addressed, and the data granularity reduced, the data is ready for the application of an iterative community detection algorithm. At the end of the iterative community detection, a total of 22 communities of services were generated. A sample of those communities of services, as shown in Figure 5, have demonstrated that meaningful patterns of service utilization can emerge from this process with the help of SMEs and SSOEs combined with the use of various graph metrics. Graph/network models are well suited for pattern recognition, and have been used in many domains [8,43,44,45]. However, there is no work, to our knowledge, that has used a pattern recognition approach to a cross continuum multi-dimensional dataset to extract meaningful patterns of services utilization.
Hence, from a methodological perspective, the strength and importance of this paper is the ability to demonstrate that working from a large body of longitudinal, sparse/high-dimensional encounter data spanning a full continuum of secondary and tertiary health services, it is possible to generate intelligible patterns of service utilization. The work in this paper has demonstrated that graph community detection methods and metrics, when combined with the application of an appropriate semantic layer and engagement of relevant SMEs, have the potential to generate face-valid intelligible results from initially sparse, high-dimensional patient–service system encounter data.
The methodology featured in this paper starts with the use of a semantic layer, CCCS, to perform the initial phase of the dimensional reduction. This coding is both generated and applied to the more granular Service Units by service system experts. It is not derived empirically. The next stage in the analysis involved team members with both an analytical and clinical background in the selection of the cohort of interest, i.e., the schizophrenia cohort. As shown in Figure 5, the schizophrenia cohort was engaged with 593 Service Units. The application of CCCS permitted the 593 Services Units to be reduced to 146 Service Classes, hence setting the stage for carrying out graph community detection. Graph community detection was carried iteratively on the cohort of interest. The models were refined by using graph metrics such as modularity to set cut-offs and eliminate Service Classes that are only weakly associated with other elements within PSUs. Subject matter experts provided feedback on the level of resolution and applied labels to the resulting communities. Those labels relate directly to the functions performed by services constituting the communities. The community of services that failed to demonstrate interpretable characteristics was discarded.
Community detection and related methods are being used as a means for providing visibility (literally) into patterns in the data. The objective is not to produce a definitive answer to questions such as “how is this cohort partitioned?”. There is no underlying truth regarding a given patient journey or PSUs associated with cohorts that the methods are correctly or incorrectly detecting. It is helpful to think of the methods presented in this paper as a macroscope that provides visibility into patterns that are located in sparse high-dimensional datasets—patterns located in a space that is too complex for them to be detected by SMEs without the assistance of pattern detection/construction tools. The objective is to produce information that can be used by parties with expert knowledge of cohorts and service system operations to develop tactics to solve problems based on patterns that are identified and depicted by the tools.
There are several important contributions from this study. First, the methods set out in this paper generate a foundation set of observables that can be used with various other methods to generate actionable results. One important set of results that will be featured in other papers makes use of these basic observables to predict sentinel events, such as overdoses or falls in older adults. Methodologically, some of that work entails bipartite projections onto people, rather than services, yielding clusters of people who are relatively homogeneous with respect to PSUs, and are then shown to be relatively homogeneous with respect to sentinel events via prediction models using community membership as features.
Second, the methods set out in this paper provide a foundation set of observables that are directly applicable to the task of evaluating the impacts of services on patient journeys and on outcomes. The PSUs can be used to attach features to people that can then be employed to generate risk-adjusted measures of outcomes. Moreover, PSUs can themselves be regarded as outcome measures in a straightforward pre- vs. post-design, e.g., PSUs for older adults before a fall that resulted in an acute care admission vs. PSUs for those same persons after the fall and resulting hospitalization.
Third, the work presented in this paper constitutes an initial depiction of an innovative set of methods demonstrating the ability to produce clinically understandable results that span the service continuum and go well beyond more common metrics of service system operations such as frequency of visits to emergency departments or acute care readmissions. Further work is required to determine how/when/whether other methods such as Natural Language Processing produce similar results. Such work is underway.
There are also a couple of limitations with the proposed methodology. First, the model proposed in this research is atemporal, the events are collapsed across time and the order of the events are not taken into consideration. The intent is to highlight the prevalence of connection between services, using the edge weights to assess the strength of prevalence. However, this model fails to capture the strength of coupling between services as well as the order of events. This is a limitation that will be addressed in a subsequent study. Second, given the data that was used for this analysis, the findings are limited to the host organization, and hence not immediately generalizable/transferable to other jurisdictions. This is especially important, as the host organization is a relatively self-contained jurisdiction, compared to other healthcare jurisdictions where patients typically move between different jurisdictions for their care needs. However, the methods outlined in this paper are generalizable to other healthcare jurisdictions.

5. Conclusions

The proposed methodology in this paper for analyzing complex healthcare data has enabled the identification of patterns in patient–service encounter data that are difficult to detect via classic statistical methods and deeply resistant to interpretation given the names attached to Service Units in the CIS location build. The CCCS, together with graph community detection methods, set the foundation to generate the basic entities required to evaluate conformance of complex sequences of interventions to cohort-specific clinical practice guidelines (CPGs). In the literature to date, we have not come across work that “drills up” to the level of full cross-continuum patterns of service utilization in a data space that incorporates a very broad array of hospital and community-based acute care, ambulatory, case management and residential services. The use of a patients’ services pathway as a foundation in evaluating the conformance of intervention to cohort specific CPGs will be the focus of future research.
Ultimately, we expect there are considerable implications related to the generated communities of services. This includes the possibility of influencing the reorganization of some services within the host organization service structure, in order to provide better care for vulnerable patients with mental and other complex healthcare challenges. These organizational/systems/process impacts would require the engagement of quality assurance/quality improvement processes in the organization, as well as support from the host organization’s senior leadership for uptake and use of the results.

Author Contributions

Conceptualization, J.B., K.M., A.R. (Abraham Rudnick) and A.K.; data curation, J.B. and S.R.; formal analysis, J.B., Y.S., H.S., K.M. and A.R. (Abraham Rudnick); investigation, J.B. and K.M.; methodology, J.B., Y.S., H.S., K.M., A.R. (Abraham Rudnick) and A.K.; project administration, J.B.; resources, J.B., K.M. and S.R.; software, J.B., Y.S., H.S., S.R., E.C., J.H., M.H. and A.R. (Ashlin Richardson); supervision, J.B., K.M., A.R. (Abraham Rudnick) and A.K.; validation, J.B., Y.S., K.M., A.R. (Abraham Rudnick) and E.C.; visualization, J.B. and K.M.; writing—original draft, J.B.; writing—review and editing, J.B., Y.S., H.S., K.M., A.R. (Abraham Rudnick), S.R., A.K., J.H., G.Y.D., K.O. and A.R. (Ashlin Richardson). All authors have read and agreed to the published version of the manuscript.

Funding

This research received no external funding.

Institutional Review Board Statement

A certificate of approval was provided by the University of Victoria Research Ethics Board (REB), following the British Columbia, Canada Ethics harmonization guideline. The REB number is H21-02817.

Informed Consent Statement

Not applicable.

Data Availability Statement

The datasets presented in this article are unavailable because of privacy or ethical restrictions. Requests to access the datasets require a certificate of approval by the University of Victoria Research Ethics Board, following the British Columbia, Canada Ethics harmonization guideline.

Conflicts of Interest

The authors declare no conflicts of interest.

References

  1. McVeigh, S.E. Sepsis management in the emergency department. Nurs. Clin. 2020, 55, 71–79. [Google Scholar] [CrossRef] [PubMed]
  2. Laursen, T.M.; Nordentoft, M.; Mortensen, P.B. Excess Early Mortality in Schizophrenia. Annu. Rev. Clin. Psychol. 2014, 10, 425–448. [Google Scholar] [CrossRef] [PubMed]
  3. Laursen, T.M.; Munk-Olsen, T.; Vestergaard, M. Life expectancy and cardiovascular mortality in persons with schizophrenia. Curr. Opin. Psychiatry 2012, 25, 83–88. [Google Scholar] [CrossRef] [PubMed]
  4. BC Guidelines. 2024. Available online: https://www2.gov.bc.ca/gov/content/health/practitioner-professional-resources/bc-guidelines (accessed on 7 March 2024).
  5. Thor, J.; Lundberg, J.; Ask, J.; Olsson, J.; Carli, C.; Härenstam, K.P.; Brommels, M. Application of statistical process control in healthcare improvement: Systematic review. BMJ Qual. Saf. 2007, 16, 387–399. [Google Scholar] [CrossRef] [PubMed]
  6. Blondel, V.D.; Guillaume, J.-L.; Lambiotte, R.; Lefebvre, E. Fast unfolding of communities in large networks. J. Stat. Mech. Theory Exp. 2008, 2008, P10008. [Google Scholar] [CrossRef]
  7. Moselle, K.; Bambi, J.; Santoso, Y.; Sadri, H.S.; Robertson, S.; Howie, J.; Rudnick, A.; Chang, E. Abundance andScarcity of Published Work in MachineLearning Derived Supports for Effective ServiceSystem Operations, University of Victoria, Victoria, BC, Canada. 2024; unpublished. [Google Scholar]
  8. Barabási, A.-L.; Loscalzo, J.; Silverman, E.K. Network Medicine: Complex Systems in Human Disease and Therapeutics; Harvard University Press: Cambridge, MA, USA, 2017. [Google Scholar]
  9. Ahmedt-Aristizabal, D.; Armin, M.A.; Denman, S.; Fookes, C.; Petersson, L. Graph-based deep learning for medical diagnosis and analysis: Past, present and future. Sensors 2021, 21, 4758. [Google Scholar] [CrossRef] [PubMed]
  10. Jaremko, J.L.; Felfeliyan, B.; Hareendranathan, A.; Thejeel, B.; Vanessa, Q.-L.; Østergaard, M.; Conaghan, P.G.; Lambert, R.G.W.; Ronsky, J.L.; Maksymowych, W.P. Volumetric Quantitative Measurement of Hip Effusions by Manual Versus Automated Artificial Intelligence Techniques: An Omeract Preliminary Validation Study, 3rd ed.; Elsevier: Amsterdam, The Netherlands, 2021; Volume 51, pp. 623–626. [Google Scholar]
  11. Banerjee, I.; Madhavan, S.; Goldman, R.E.; Rubin, D.L. Intelligent word embeddings of free-text radiology reports. In Proceedings of the AMIA Annual Symposium Proceedings, American Medical Informatics Association, Washington, DC, USA, 4–8 November 2017; p. 411. [Google Scholar]
  12. Elkin, P.L.; Froehling, D.; Wahner-Roedler, D.; Trusko, B.; Welsh, G.; Ma, H.; Asatryan, A.X.; Tokars, J.I.; Rosenbloom, S.T.; Brown, S.H. NLP-Based Identification of Pneumonia Cases from Free-Text Radiological Reports; American Medical Informatics Association: Bethesda, MD, USA, 2008; p. 172. [Google Scholar]
  13. Garla, V.; Taylor, C.; Brandt, C. Semi-supervised clinical text classification with Laplacian SVMs: An application to cancer case management. J. Biomed. Inform. 2013, 46, 869–875. [Google Scholar] [CrossRef] [PubMed]
  14. Martinez, D.; Ananda-Rajah, M.R.; Suominen, H.; Slavin, M.A.; Thursky, K.A.; Cavedon, L. Automatic detection of patients with invasive fungal disease from free-text computed tomography (CT) scans. J. Biomed. Inform. 2015, 53, 251–260. [Google Scholar] [CrossRef]
  15. Stewart, R.; Velupillai, S. Applied natural language processing in mental health big data. Neuropsychopharmacology 2021, 46, 252. [Google Scholar] [CrossRef]
  16. Rost, B.; Radivojac, P.; Bromberg, Y. Protein function in precision medicine: Deep understanding with machine learning. FEBS Lett. 2016, 590, 2327–2341. [Google Scholar] [CrossRef]
  17. Alabi, R.O.; Almangush, A.; Elmusrati, M.; Mäkitie, A.A. Deep machine learning for oral cancer: From precise diagnosis to precision medicine. Front. Oral Health 2022, 2, 794248. [Google Scholar] [CrossRef] [PubMed]
  18. Carlisle, A.; Caceres, I.; Mehta, S.; Schindler, J.; Sharma, J. A combined machine learning and bioinformatic analysis approach identifies biological pathways that predict clinical stage and survival outcome in neuroblastoma patients. Cancer Res. 2015, 75, 3758. [Google Scholar] [CrossRef]
  19. Ge, L.; Chen, Y.; Yan, C.; Zhao, P.; Zhang, P.; Liu, J. Study progress of radiomics with machine learning for precision medicine in bladder cancer management. Front. Oncol. 2019, 9, 1296. [Google Scholar] [CrossRef]
  20. Hase, T.; Ghosh, S.; Palaniappan, S.K.; Kitano, H. Cancer network medicine. Netw. Med. 2017, 294–323. [Google Scholar] [CrossRef]
  21. Nakagawa, H.; Fujita, M. Whole genome sequencing analysis for cancer genomics and precision medicine. Cancer Sci. 2018, 109, 513–522. [Google Scholar] [CrossRef]
  22. Piccialli, F.; Calabrò, F.; Crisci, D.; Cuomo, S.; Prezioso, E.; Mandile, R.; Troncone, R.; Greco, L.; Auricchio, R. Precision medicine and machine learning towards the prediction of the outcome of potential celiac disease. Sci. Rep. 2021, 11, 5683. [Google Scholar] [CrossRef]
  23. Gökçay Canpolat, A.; Şahin, M. Glucose lowering treatment modalities of type 2 diabetes mellitus. Diabetes Res. Clin. Pract. 2021, 4, 7–27. [Google Scholar]
  24. Shamji, M.H.; Ollert, M.; Adcock, I.M.; Bennett, O.; Favaro, A.; Sarama, R.; Riggioni, C.; Annesi-Maesano, I.; Custovic, A.; Fontanella, S. EAACI guidelines on environmental science in allergic diseases and asthma–leveraging artificial intelligence and machine learning to develop a causality model in exposomics. Allergy 2023, 78, 1742–1757. [Google Scholar] [CrossRef]
  25. Pike, F.; Yealy, D.M.; Kellum, J.A.; Huang, D.T.; Barnato, A.E.; Eaton, T.L.; Angus, D.C.; Weissfeld, L.A. Protocolized care for early septic shock (ProCESS) statistical analysis plan. Crit. Care Resusc. 2013, 15, 301–310. [Google Scholar] [CrossRef]
  26. Norman, C.; Van Nguyen, T.; Névéol, A. Contribution of natural language processing in predicting rehospitalization risk. Med. Care 2017, 55, 781. [Google Scholar] [CrossRef]
  27. Orangi-Fard, N.; Akhbardeh, A.; Sagreiya, H. Predictive Model for Icu Readmission Based on Discharge Summaries Using Machine Learning and Natural Language Processing, 1st ed.; MDPI: Basel, Switzerland, 2022; p. 10. [Google Scholar]
  28. Rumshisky, A.; Ghassemi, M.; Naumann, T.; Szolovits, P.; Castro, V.M.; McCoy, T.H.; Perlis, R.H. Predicting early psychiatric readmission with natural language processing of narrative discharge summaries. Transl. Psychiatry 2016, 6, e921. [Google Scholar] [CrossRef]
  29. Panteli, D.; Legido-Quigley, H.; Reichebner, C.; Ollenschläger, G.; Schäfer, C.; Busse, R. Clinical practice guidelines as a quality strategy. Improv. Healthc. Qual. Eur. 2019, 233. [Google Scholar] [CrossRef]
  30. Rotter, T.; de Jong, R.B.; Lacko, S.E.; Ronellenfitsch, U.; Kinsman, L. Clinical pathways as a quality strategy. Improv. Healthc. Qual. Eur. 2019, 309. [Google Scholar] [CrossRef]
  31. Allen, M.; Pearn, K.; Monks, T.; Bray, B.D.; Everson, R.; Salmon, A.; James, M.; Stein, K. Can clinical audits be enhanced by pathway simulation and machine learning? An example from the acute stroke pathway. BMJ Open 2019, 9, e028296. [Google Scholar] [CrossRef] [PubMed]
  32. Huo, T.; George Jr, T.J.; Guo, Y.; He, Z.; Prosperi, M.; Modave, F.; Bian, J. Explore Care Pathways of Colorectal Cancer Patients with Social Network Analysis. Stud. Health Technol. Inform. 2017, 245, 1270. [Google Scholar] [PubMed]
  33. Carroll, N.; Richardson, I. Mapping a careflow network to assess the connectedness of connected health. Health Inform. J. 2019, 25, 106–125. [Google Scholar] [CrossRef] [PubMed]
  34. Aggarwal, N.; Ahmed, M.; Basu, S.; Curtin, J.J.; Evans, B.J.; Matheny, M.E.; Nundy, S.; Sendak, M.P.; Shachar, C.; Shah, R.U. Advancing artificial intelligence in health settings outside the hospital and clinic. NAM Perspect. 2020, 2020. [Google Scholar] [CrossRef] [PubMed]
  35. Lin, Z.; Yang, D.; Yin, X. Patient similarity via joint embeddings of medical knowledge graph and medical entity descriptions. IEEE Access 2020, 8, 156663–156676. [Google Scholar] [CrossRef]
  36. Rose, S. Intersections of machine learning and epidemiological methods for health services research. Int. J. Epidemiol. 2020, 49, 1763–1770. [Google Scholar] [CrossRef]
  37. El Emam, K.; Arbuckle, L. Anonymizing Health Data: Case Studies and Methods to Get You Started; O’Reilly Media, Inc.: Sebastopol, CA, USA, 2013. [Google Scholar]
  38. Bambauer, J.; Muralidhar, K.; Sarathy, R. Fool’s gold: An illustrated critique of differential privacy. Vand. J. Ent. Tech. L. 2013, 16, 701. [Google Scholar]
  39. Xu, C.; Ren, J.; Zhang, Y.; Qin, Z.; Ren, K. DPPro: Differentially Private High-Dimensional Data Release via Random Projection. IEEE Trans. Inf. Forensics Secur. 2017, 12, 3081–3093. [Google Scholar] [CrossRef]
  40. Malin, B.; Goodman, K. Between access and privacy: Challenges in sharing health data. Yearb. Med. Inform. 2018, 27, 55–59. [Google Scholar] [CrossRef] [PubMed]
  41. Koval, A.; Moselle, K. Clinical Context Coding Scheme-Describing Utilisation of Services of Island Health between 2007–2017. In Proceedings of the Conference of the International Population Data Linkage Association, Banf, AB, Canada, 12–14 September 2018. [Google Scholar]
  42. Chejara, P.; Godfrey, W.W. Comparative Analysis of Community Detection Algorithms; IEEE: Minneapolis, MN, USA, 2017; pp. 1–5. [Google Scholar]
  43. Niyirora, J.; Aragones, O. Network analysis of medical care services. Health Inform. J 2020, 26, 1631–1658. [Google Scholar] [CrossRef] [PubMed]
  44. Palmer, R.; Utley, M.; Fulop, N.J.; O’Connor, S. Using visualisation methods to analyse referral networks within community health care among patients aged 65 years and over. Health Inform. J. 2020, 26, 354–375. [Google Scholar] [CrossRef]
  45. Khazaee, A.; Ebrahimzadeh, A.; Babajani-Feremi, A. Application of pattern recognition and graph theoretical approaches to analysis of brain network in Alzheimer’s disease. J. Med. Imaging Health Inform. 2015, 5, 1145–1155. [Google Scholar] [CrossRef]
Figure 1. Machine learning “knowables” within the health arena—from ‘omics’ to epidemiology.
Biomedinformatics 04 00053 g001
Figure 2. Bipartite graph projection.
Biomedinformatics 04 00053 g002
Figure 3. Iterative community detection process.
Biomedinformatics 04 00053 g003
Figure 4. Sample Community Detection Iteration Process.
Biomedinformatics 04 00053 g004
Figure 5. PSUs extraction end-to-end process.
Biomedinformatics 04 00053 g005
Table 1. Fields with sample data representing the schizophrenia cohort format required for graph analytics (2 Nodes).
Patient_IDService Class ID
P122
P234
P3161
P422
P113
P5243
Table 2. At the first iteration, community ‘1-2′ (one of the communities chosen for illustration) is made of a mix of various heterogeneous services.
SC_IDService Class NameCIDIWDEWDWD
22MHSU-Addictions-Clinic-Adult-Ambulatory1-236921582527
34MHSU-Addictions-Clinical Intake-Adult1-236716151982
161Addictions Medicine Specialist Consultation to Acute Care1-229323182611
23MHSU-Addictions-Withdrawal Management (Detox)-Adults1-2201682883
13MHSU-Assertive Community Treatment (ACT)-Adult1-219612091405
203Overdose-Related Services1-2185812997
243MHSU-Addictions-Rapid/High-Intensity Assessment and Follow-Up1-21858951080
21MHSU-Addictions-Sobering and Assessment Centre1-2162592754
14MHSU-Addictions-Outreach and Intensive Case Management-Adult1-2144552696
29MHSU-Residential Care-Licensed1-211310401153
24MHSU-Addictions-Post-Withdrawal Stabilization-Residential-Adults1-2108351459
26MHSU-Residential Care-Lower-Level Support1-2108707815
10Tertiary Specialized Residential Care-Adult1-275338413
20MHSU-Rehab Services-Adult-Moderate Intensity1-245256301
270COVID-19 Outreach Assessment1-229136165
272COVID-19 Outreach Assessment Team-Provider1-2284371
81MHSU-Crisis Response-Walk-In1-226192218
171MHSU-Developmental Disabilities-Adults-Assessment and Support-Ambulatory1-223211234
175MHSU-Addictions-Supervised Consumption-Ambulatory1-2217091
30MHSU-Crisis-Residential1-22087107
3MHSU-Adult Community Outreach-Moderate to High Risk1-217136153
275COVID-19 MHSU Health Monitoring1-2154055
74Adjunctive Therapies in Acute Care-Respiratory1-241519
158Telehealth-Miscellaneous1-221214
Table 3. At the second iteration, community ‘1-2′ is broken into three communities (‘2-2′, ‘2-3′, and ‘2-4′) that are gradually becoming homogeneous, with ‘2-4′ especially becoming homogeneous with regard to harm-reduction and rehab recovery services.
SC_IDService NameCIDIWDEWDWD
13MHSU-Assertive Community Treatment (ACT)-Adult2-26313421405
26MHSU-Residential Care-Lower-Level Support2-253762815
29MHSU-Residential Care-Licensed2-25211011153
10Tertiary Specialized Residential Care-Adult2-234379413
20MHSU-Rehab Services-Adult-Moderate Intensity2-228273301
81MHSU-Crisis Response-Walk-In2-211207218
3MHSU-Adult Community Outreach-Moderate to High Risk2-28145153
74Adjunctive Therapies in Acute Care-Respiratory2-231619
14MHSU-Addictions-Outreach and Intensive Case Management-Adult2-332664696
243MHSU-Addictions-Rapid/High-Intensity Assessment and Follow-Up2-33110491080
270COVID-19 Outreach Assessment2-313152165
272COVID-19 Outreach Assessment Team-Provider2-3116071
275COVID-19 MHSU Health Monitoring2-374855
30MHSU-Crisis-Residential2-36101107
171MHSU-Developmental Disabilities-Adults-Assessment and Support-Ambulatory2-36228234
175MHSU-Addictions-Supervised Consumption-Ambulatory2-368591
34MHSU-Addictions-Clinical Intake-Adult2-425617261982
22MHSU-Addictions-Clinic-Adult-Ambulatory2-424722802527
161Addictions Medicine Specialist Consultation to Acute Care2-418924222611
23MHSU-Addictions-Withdrawal Management (Detox)-Adults2-4148735883
203Overdose-Related Services2-4113884997
21MHSU-Addictions-Sobering and Assessment Centre2-4103651754
24MHSU-Addictions-Post-Withdrawal Stabilization-Residential-Adults2-486373459
158Telehealth-Miscellaneous2-421214
Table 4. At the third iteration, community ‘2-2′ breaks into ‘3-2′ and ‘3-3′, whereas community ‘2-3′ breaks into ‘3-4′ and ‘3-5′. However, community ‘2-4′ from the second iteration remains unchanged at the third iteration.
CategorySC_IDService NameCIDIWDEWDWD
High intensity community-based treatment for people with severe psychiatric illness13MHSU-Assertive Community Treatment (ACT)-Adult3-22413811405
10Tertiary Specialized Residential Care-Adult3-220393413
3MHSU-Adult Community Outreach-Moderate to High Risk3-24149153
Lower intensity community-based treatment for people with severe psychiatric illness26MHSU-Residential Care-Lower-Level Support3-333782815
29MHSU-Residential Care-Licensed3-32911241153
20MHSU-Rehab Services-Adult-Moderate Intensity3-318283301
81MHSU-Crisis Response-Walk-In3-38210218
74Adjunctive Therapies in Acute Care-Respiratory3-321719
Addiction-outreach focused support for high risk/high needs addictions problems14MHSU-Addictions-Outreach and Intensive Case Management-Adult3-424672696
243MHSU-Addictions-Rapid/High-Intensity Assessment and Follow-Up3-42310571080
270COVID-19 Outreach Assessment3-411154165
175MHSU-Addictions-Supervised Consumption-Ambulatory3-468591
Biomedinformatics 04 00053 i00130MHSU-Crisis-Residential3-53104107
171MHSU-Developmental Disabilities-Adults-Assessment and Support-Ambulatory3-53231234
272COVID-19 Outreach Assessment Team-Provider3-536871
275COVID-19 MHSU Health Monitoring3-535255
Additions ongoing support: harm reduction and/or rehab recovery.34MHSU-Addictions-Clinical Intake-Adult3-625617261982
22MHSU-Addictions-Clinic-Adult-Ambulatory3-624722802527
161Addictions Medicine Specialist Consultation to Acute Care3-618924222611
23MHSU-Addictions-Withdrawal Management (Detox)-Adults3-6148735883
203Overdose-Related Services3-6113884997
21MHSU-Addictions-Sobering and Assessment Centre3-6103651754
24MHSU-Addictions-Post-Withdrawal Stabilization-Residential-Adults3-686373459
158Telehealth-Miscellaneous3-621214
Disclaimer/Publisher’s Note: The statements, opinions and data contained in all publications are solely those of the individual author(s) and contributor(s) and not of MDPI and/or the editor(s). MDPI and/or the editor(s) disclaim responsibility for any injury to people or property resulting from any ideas, methods, instructions or products referred to in the content.

