
High-Resolution Mapping of Seasonal Crop Pattern Using Sentinel Imagery in Mountainous Region of Nepal: A Semi-Automatic Approach

 , ,
, ,
Abstract
:1. Introduction
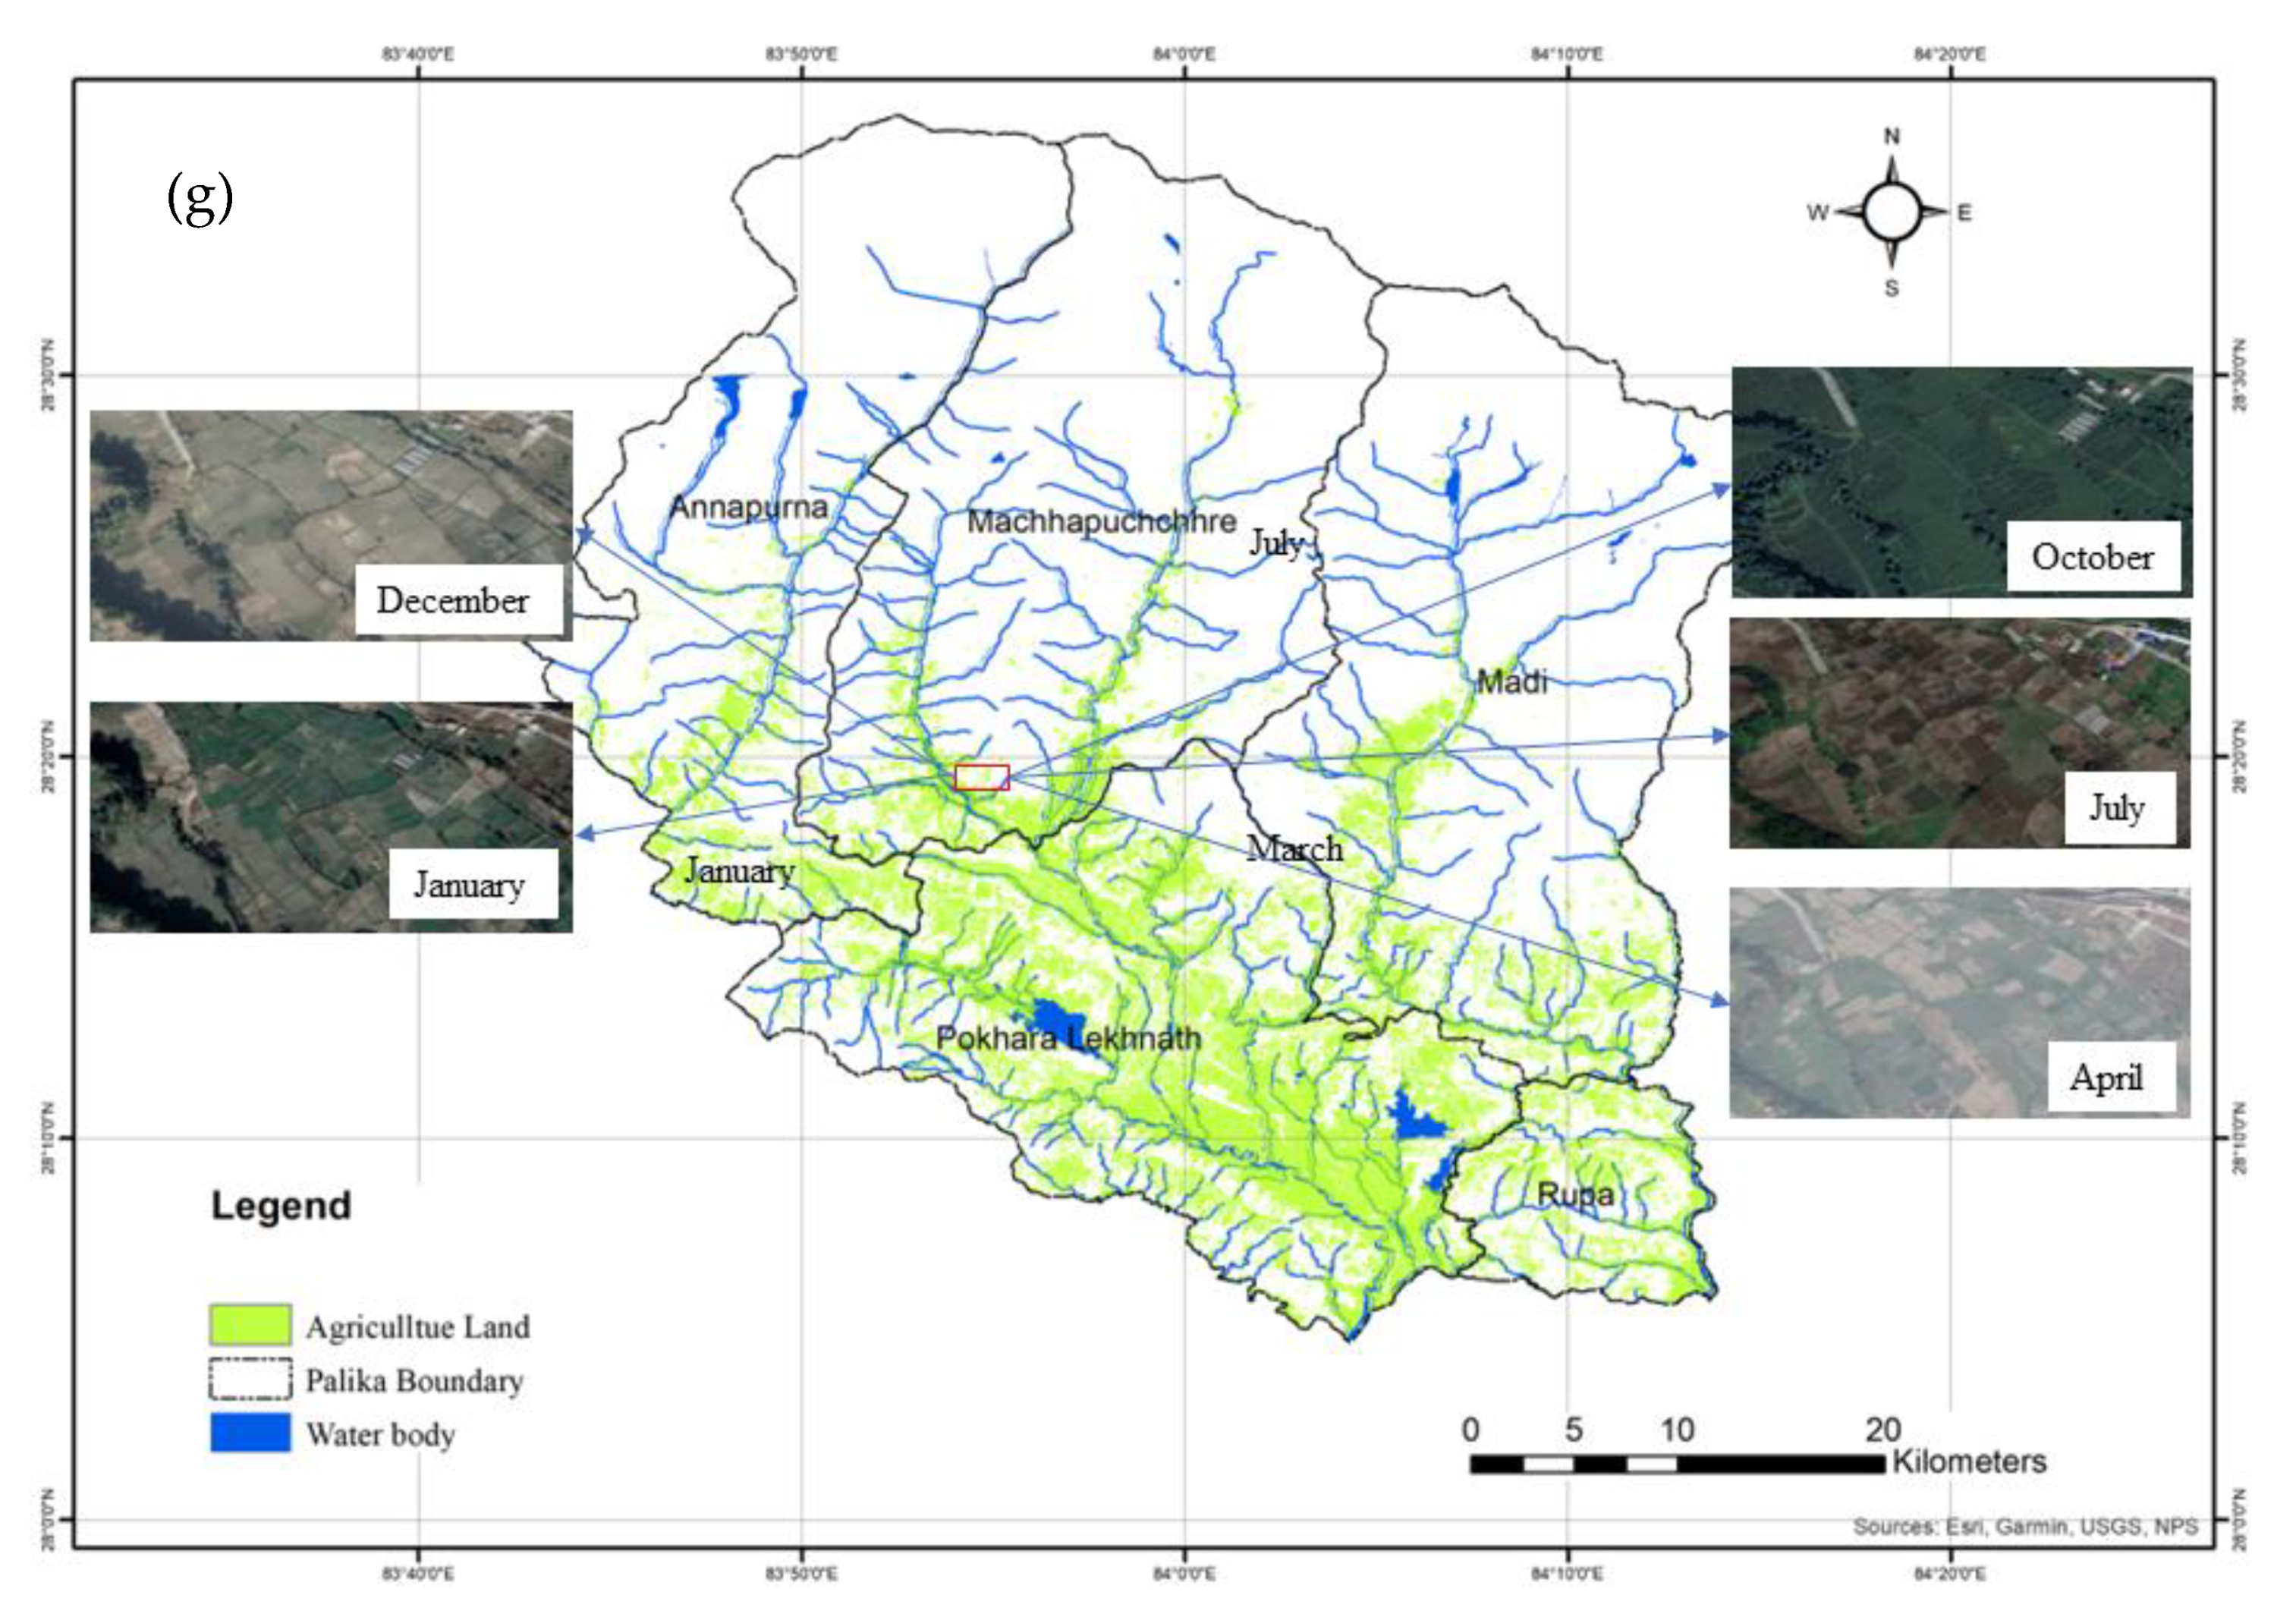
2. Study Area
3. Data and Method
3.1. Remotely Sensed Dataset
3.2. Field Based Data
- Land-use parameters such as cropland, rangelands, forest, etc.
- Cropping calendars for monsoon, winter, and autumn seasons for an agricultural area
- Irrigation (also seasonal) availability.
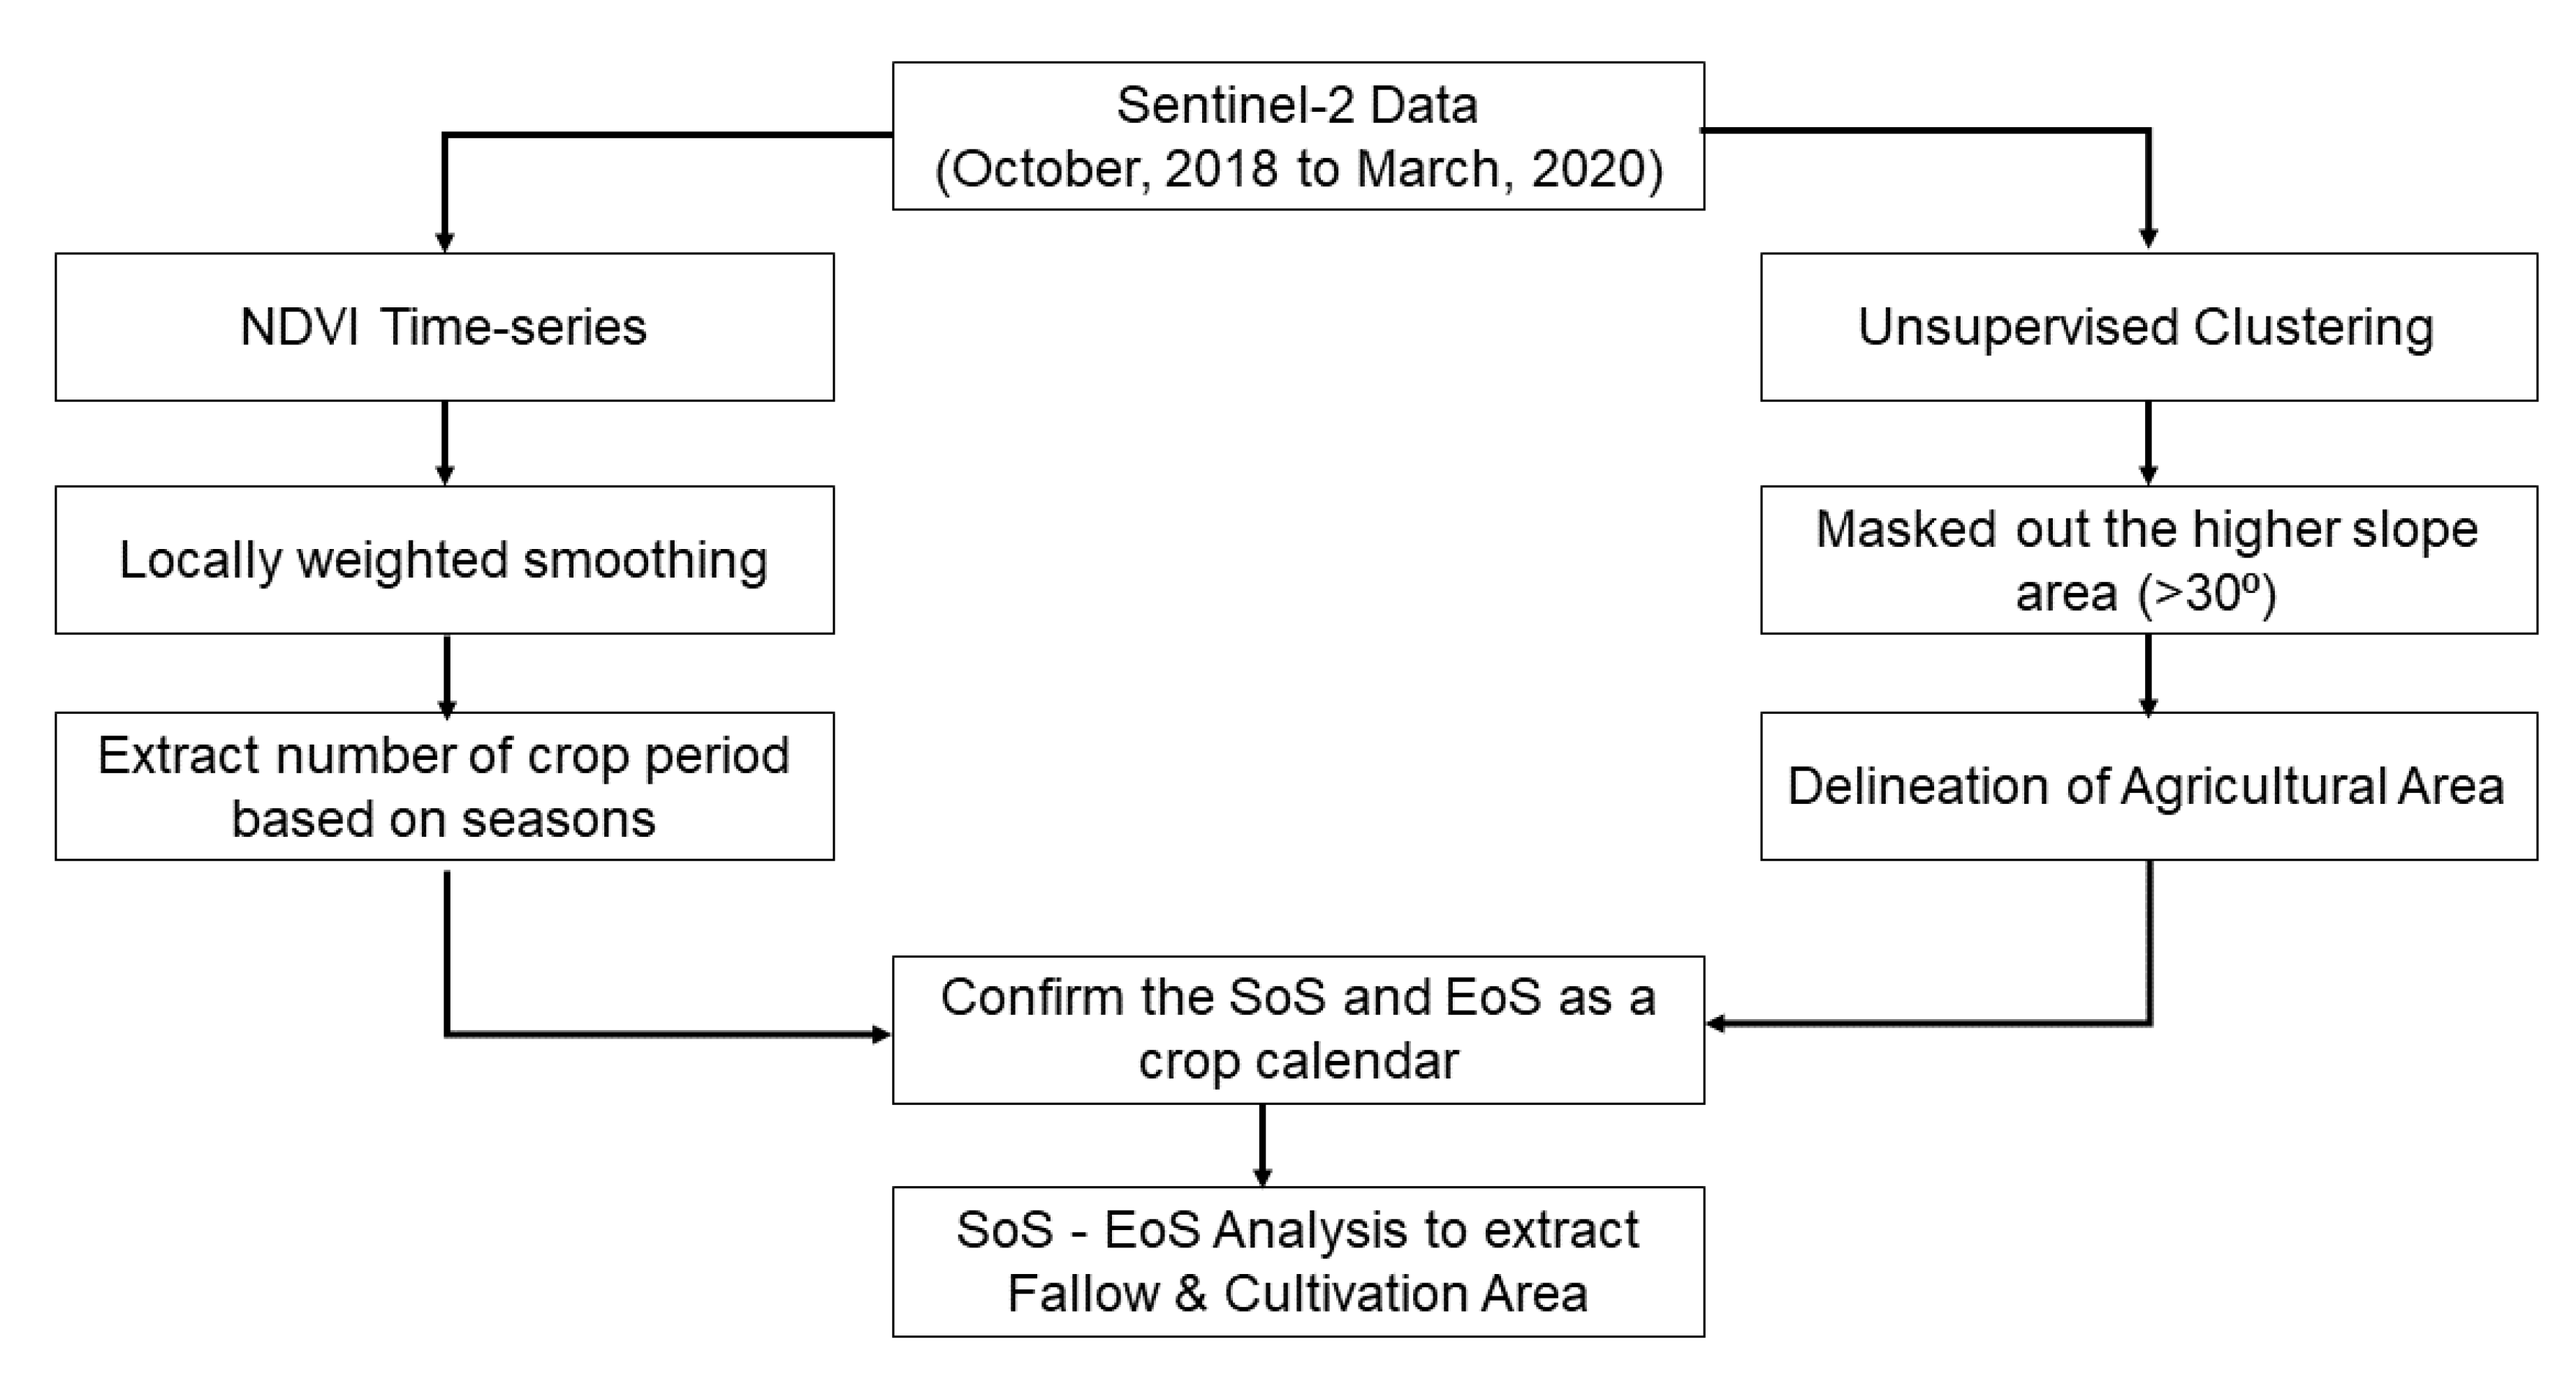
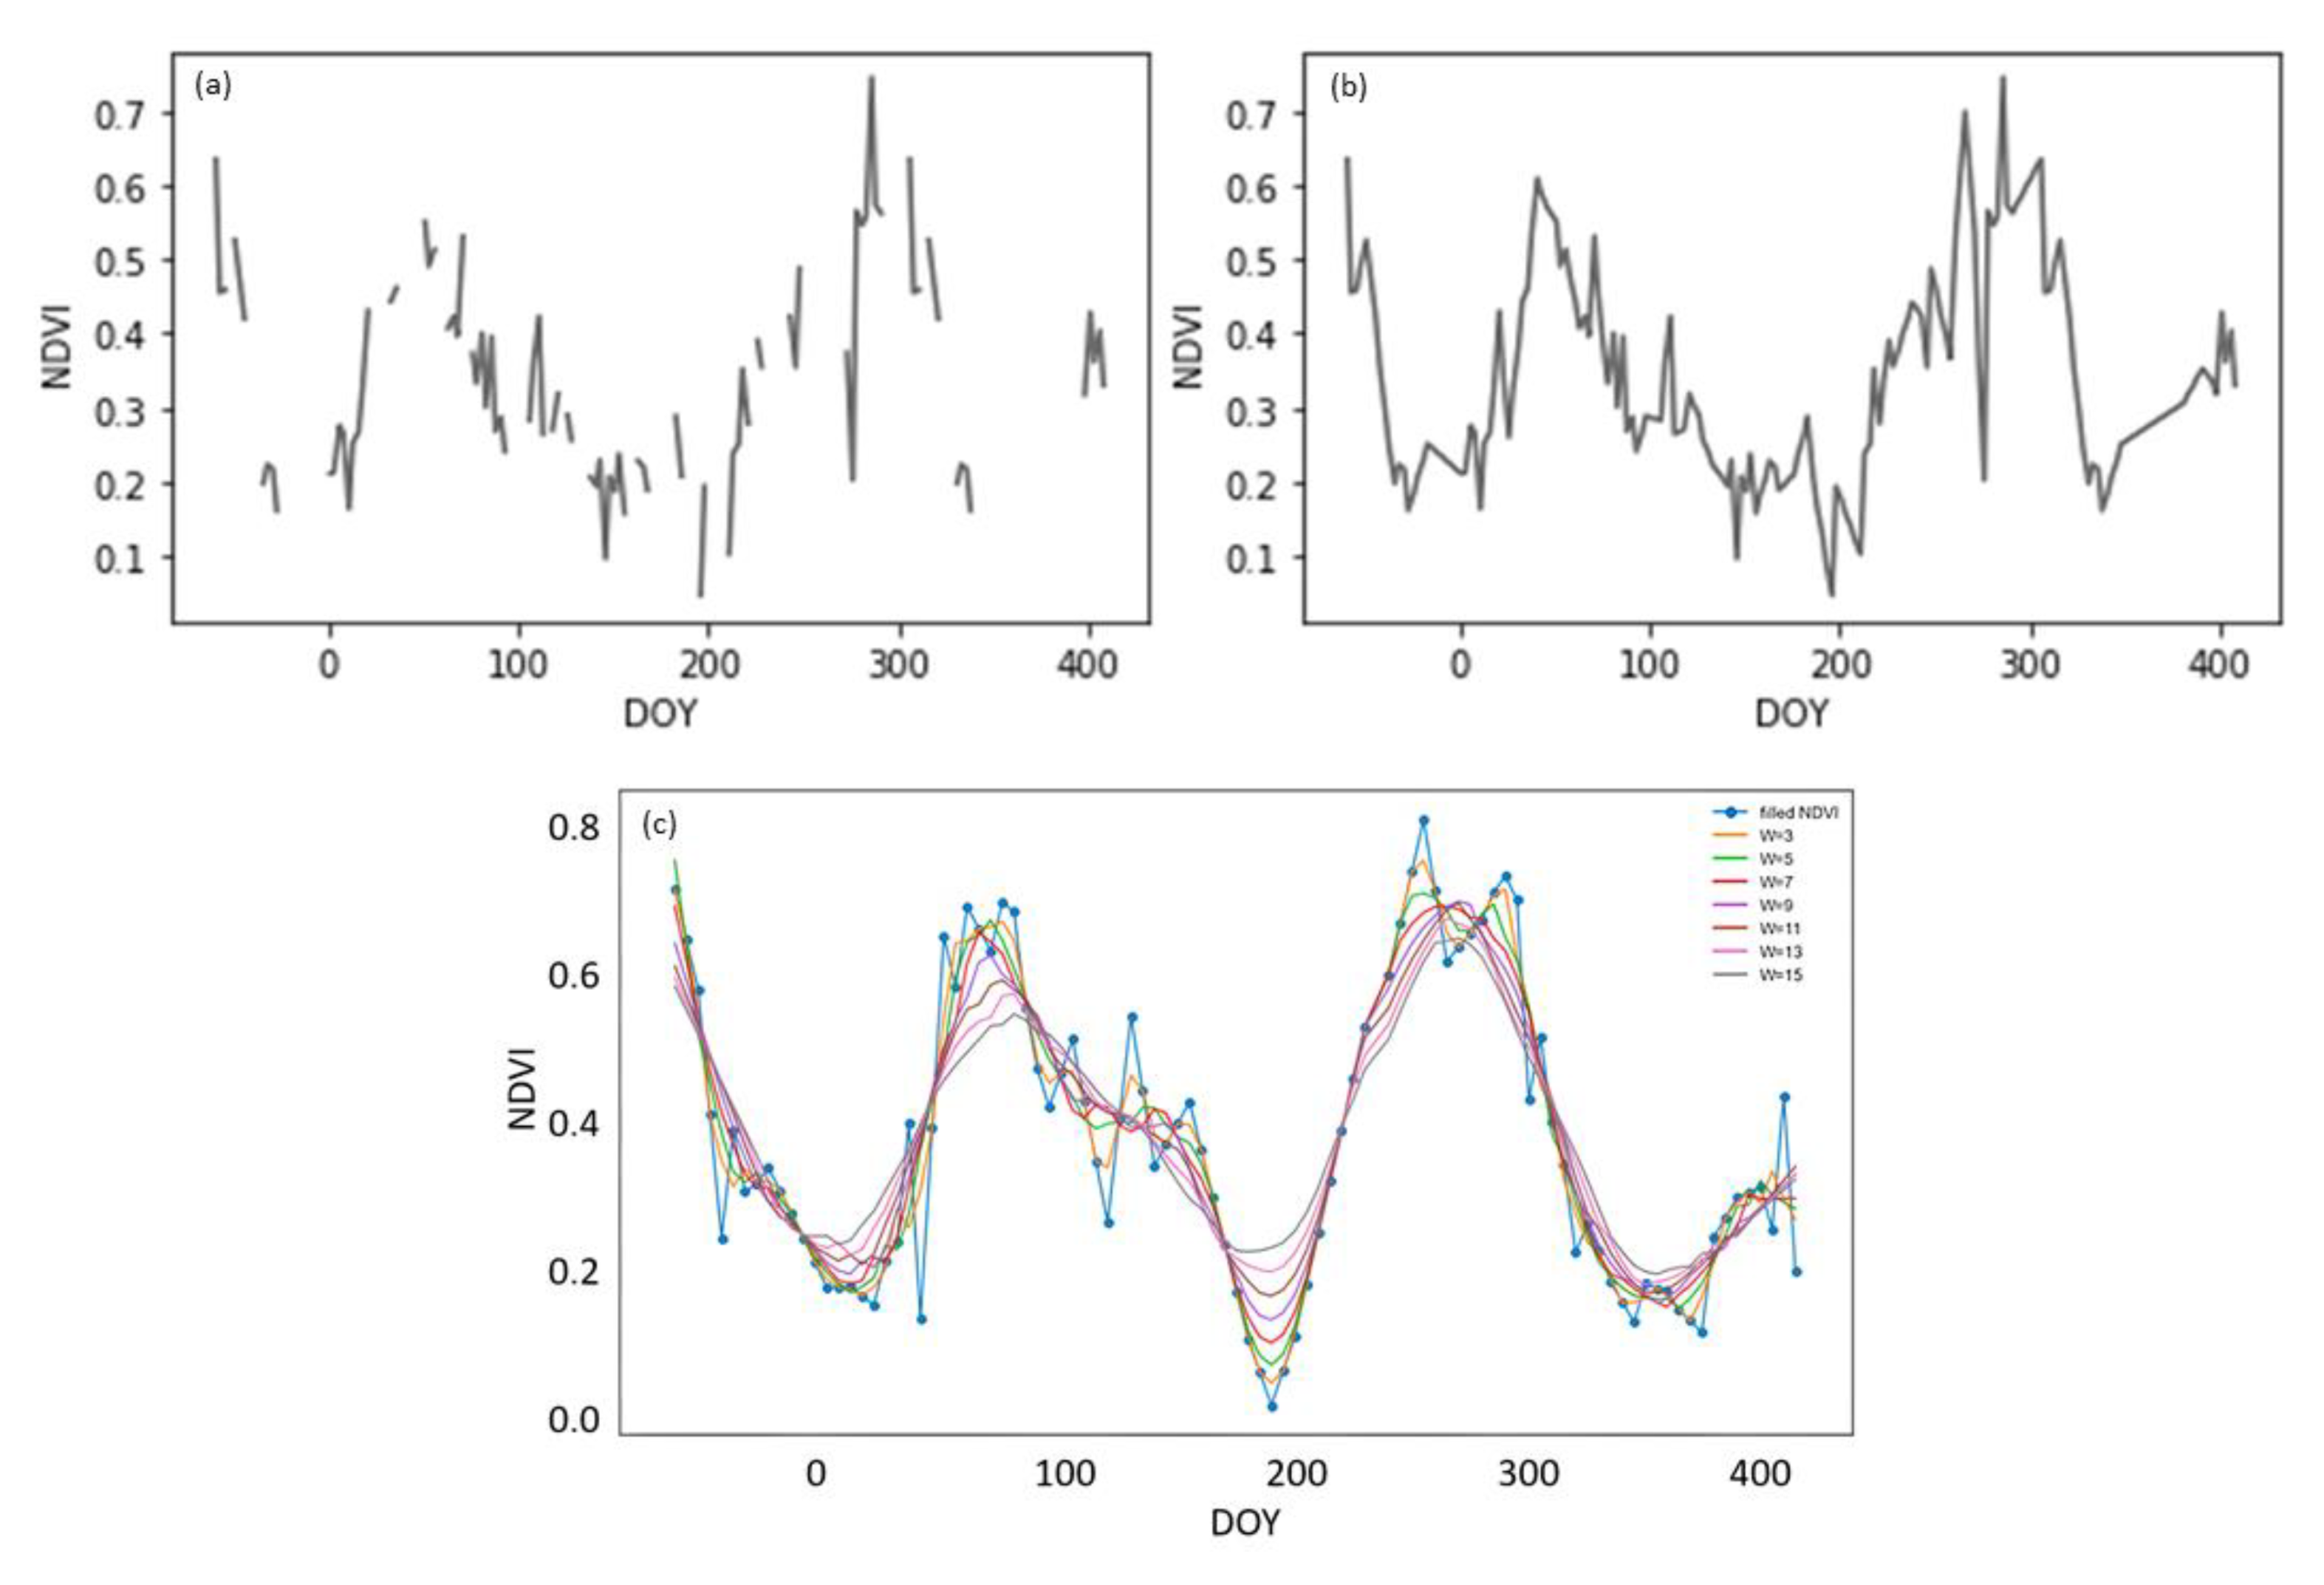
3.3. Crop Calendar Estimation
3.4. Accuracy Assessment
4. Results and Discussion
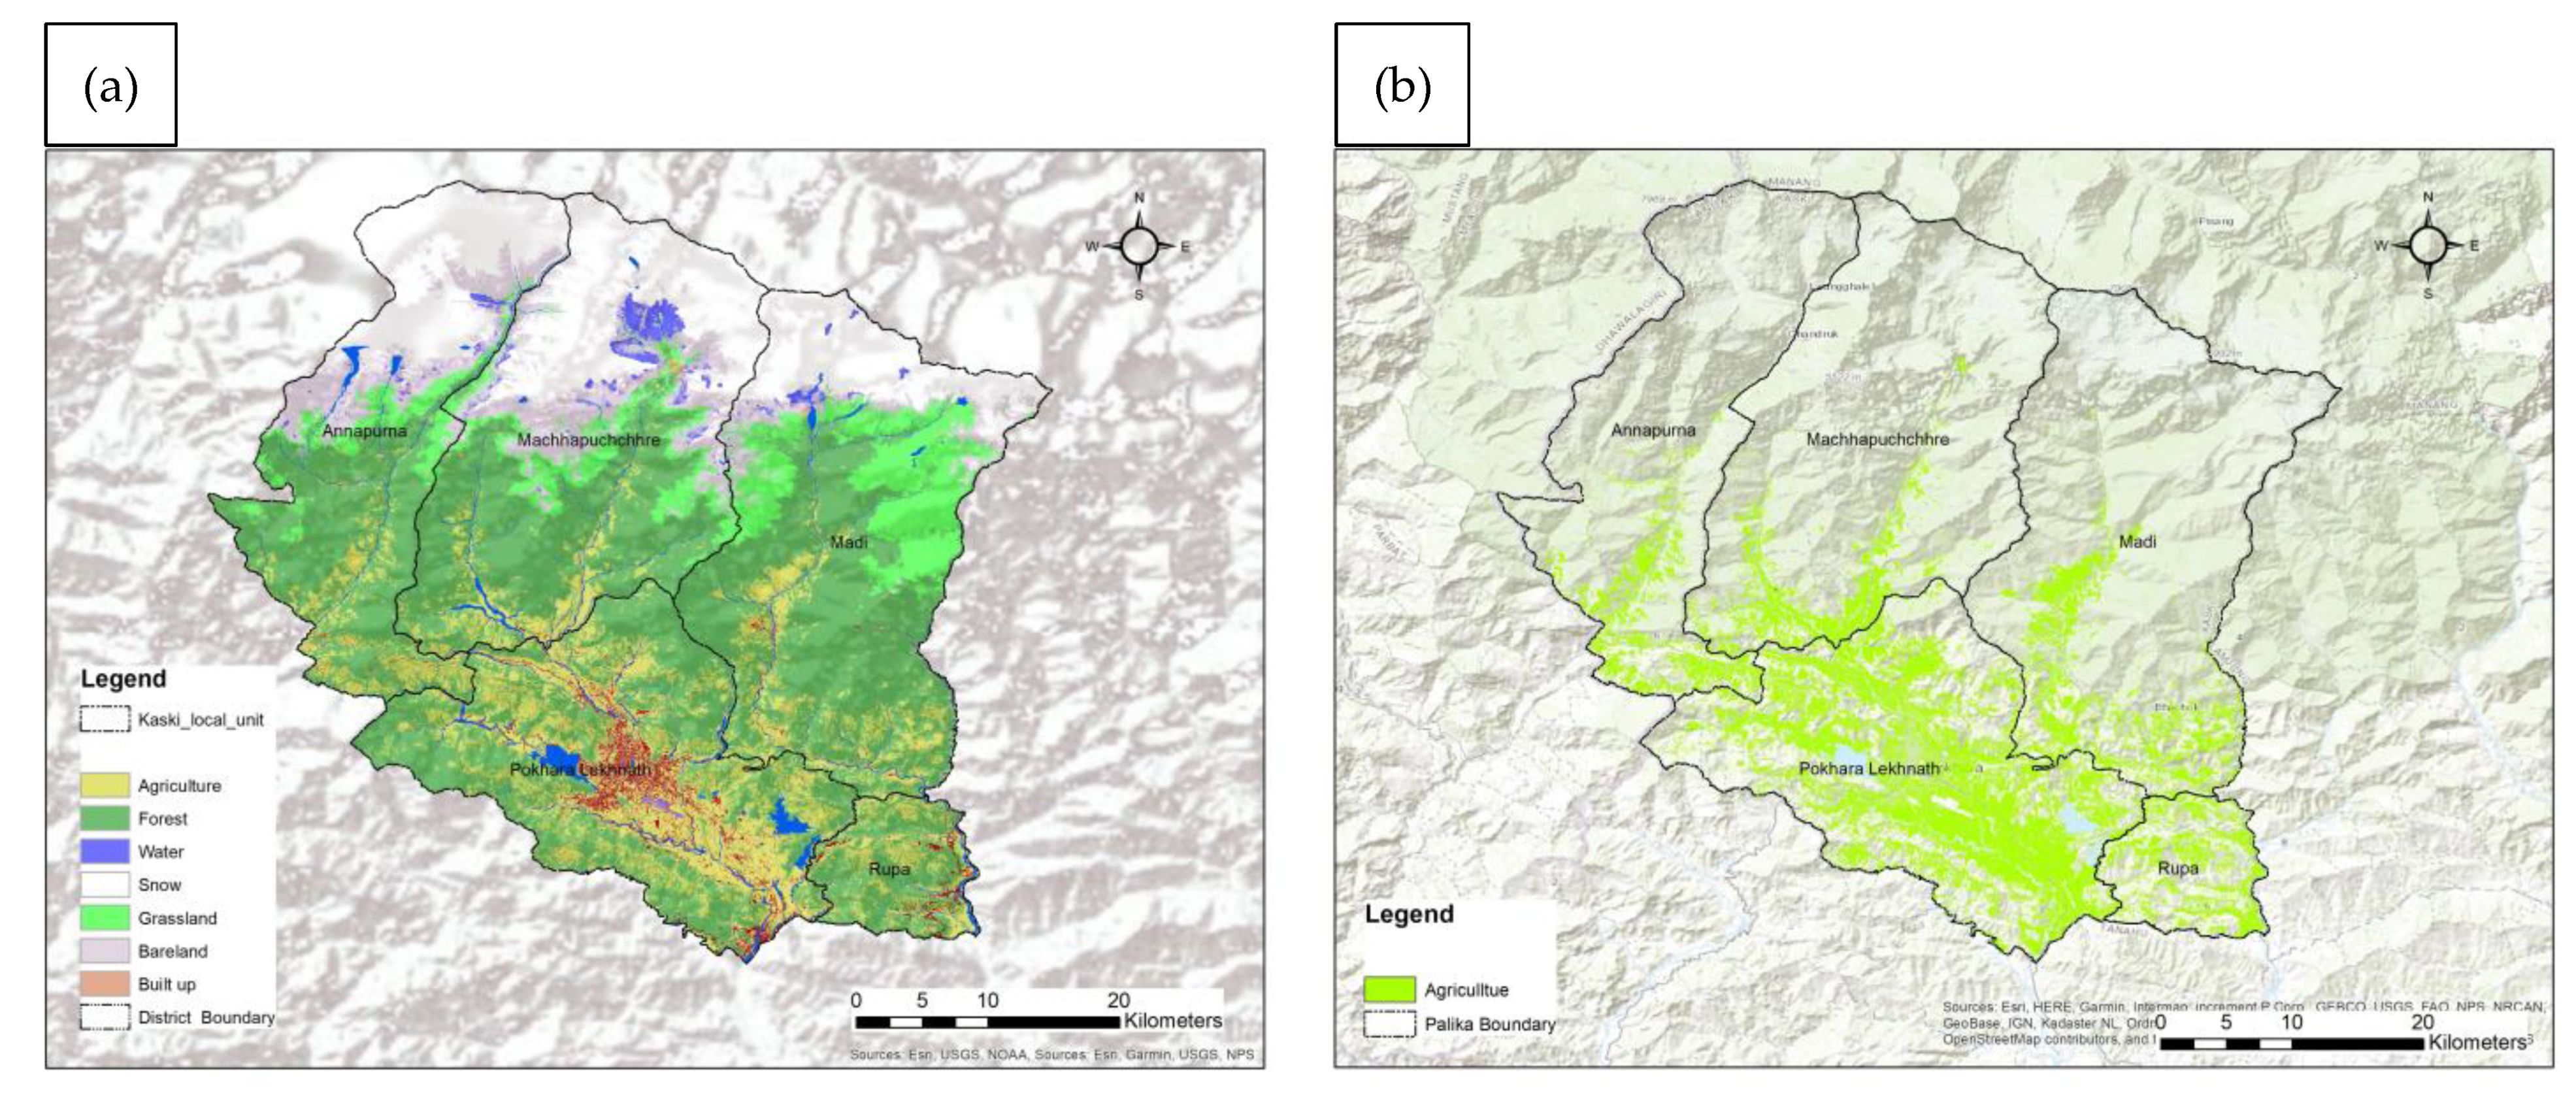
4.1. Agriculture Map
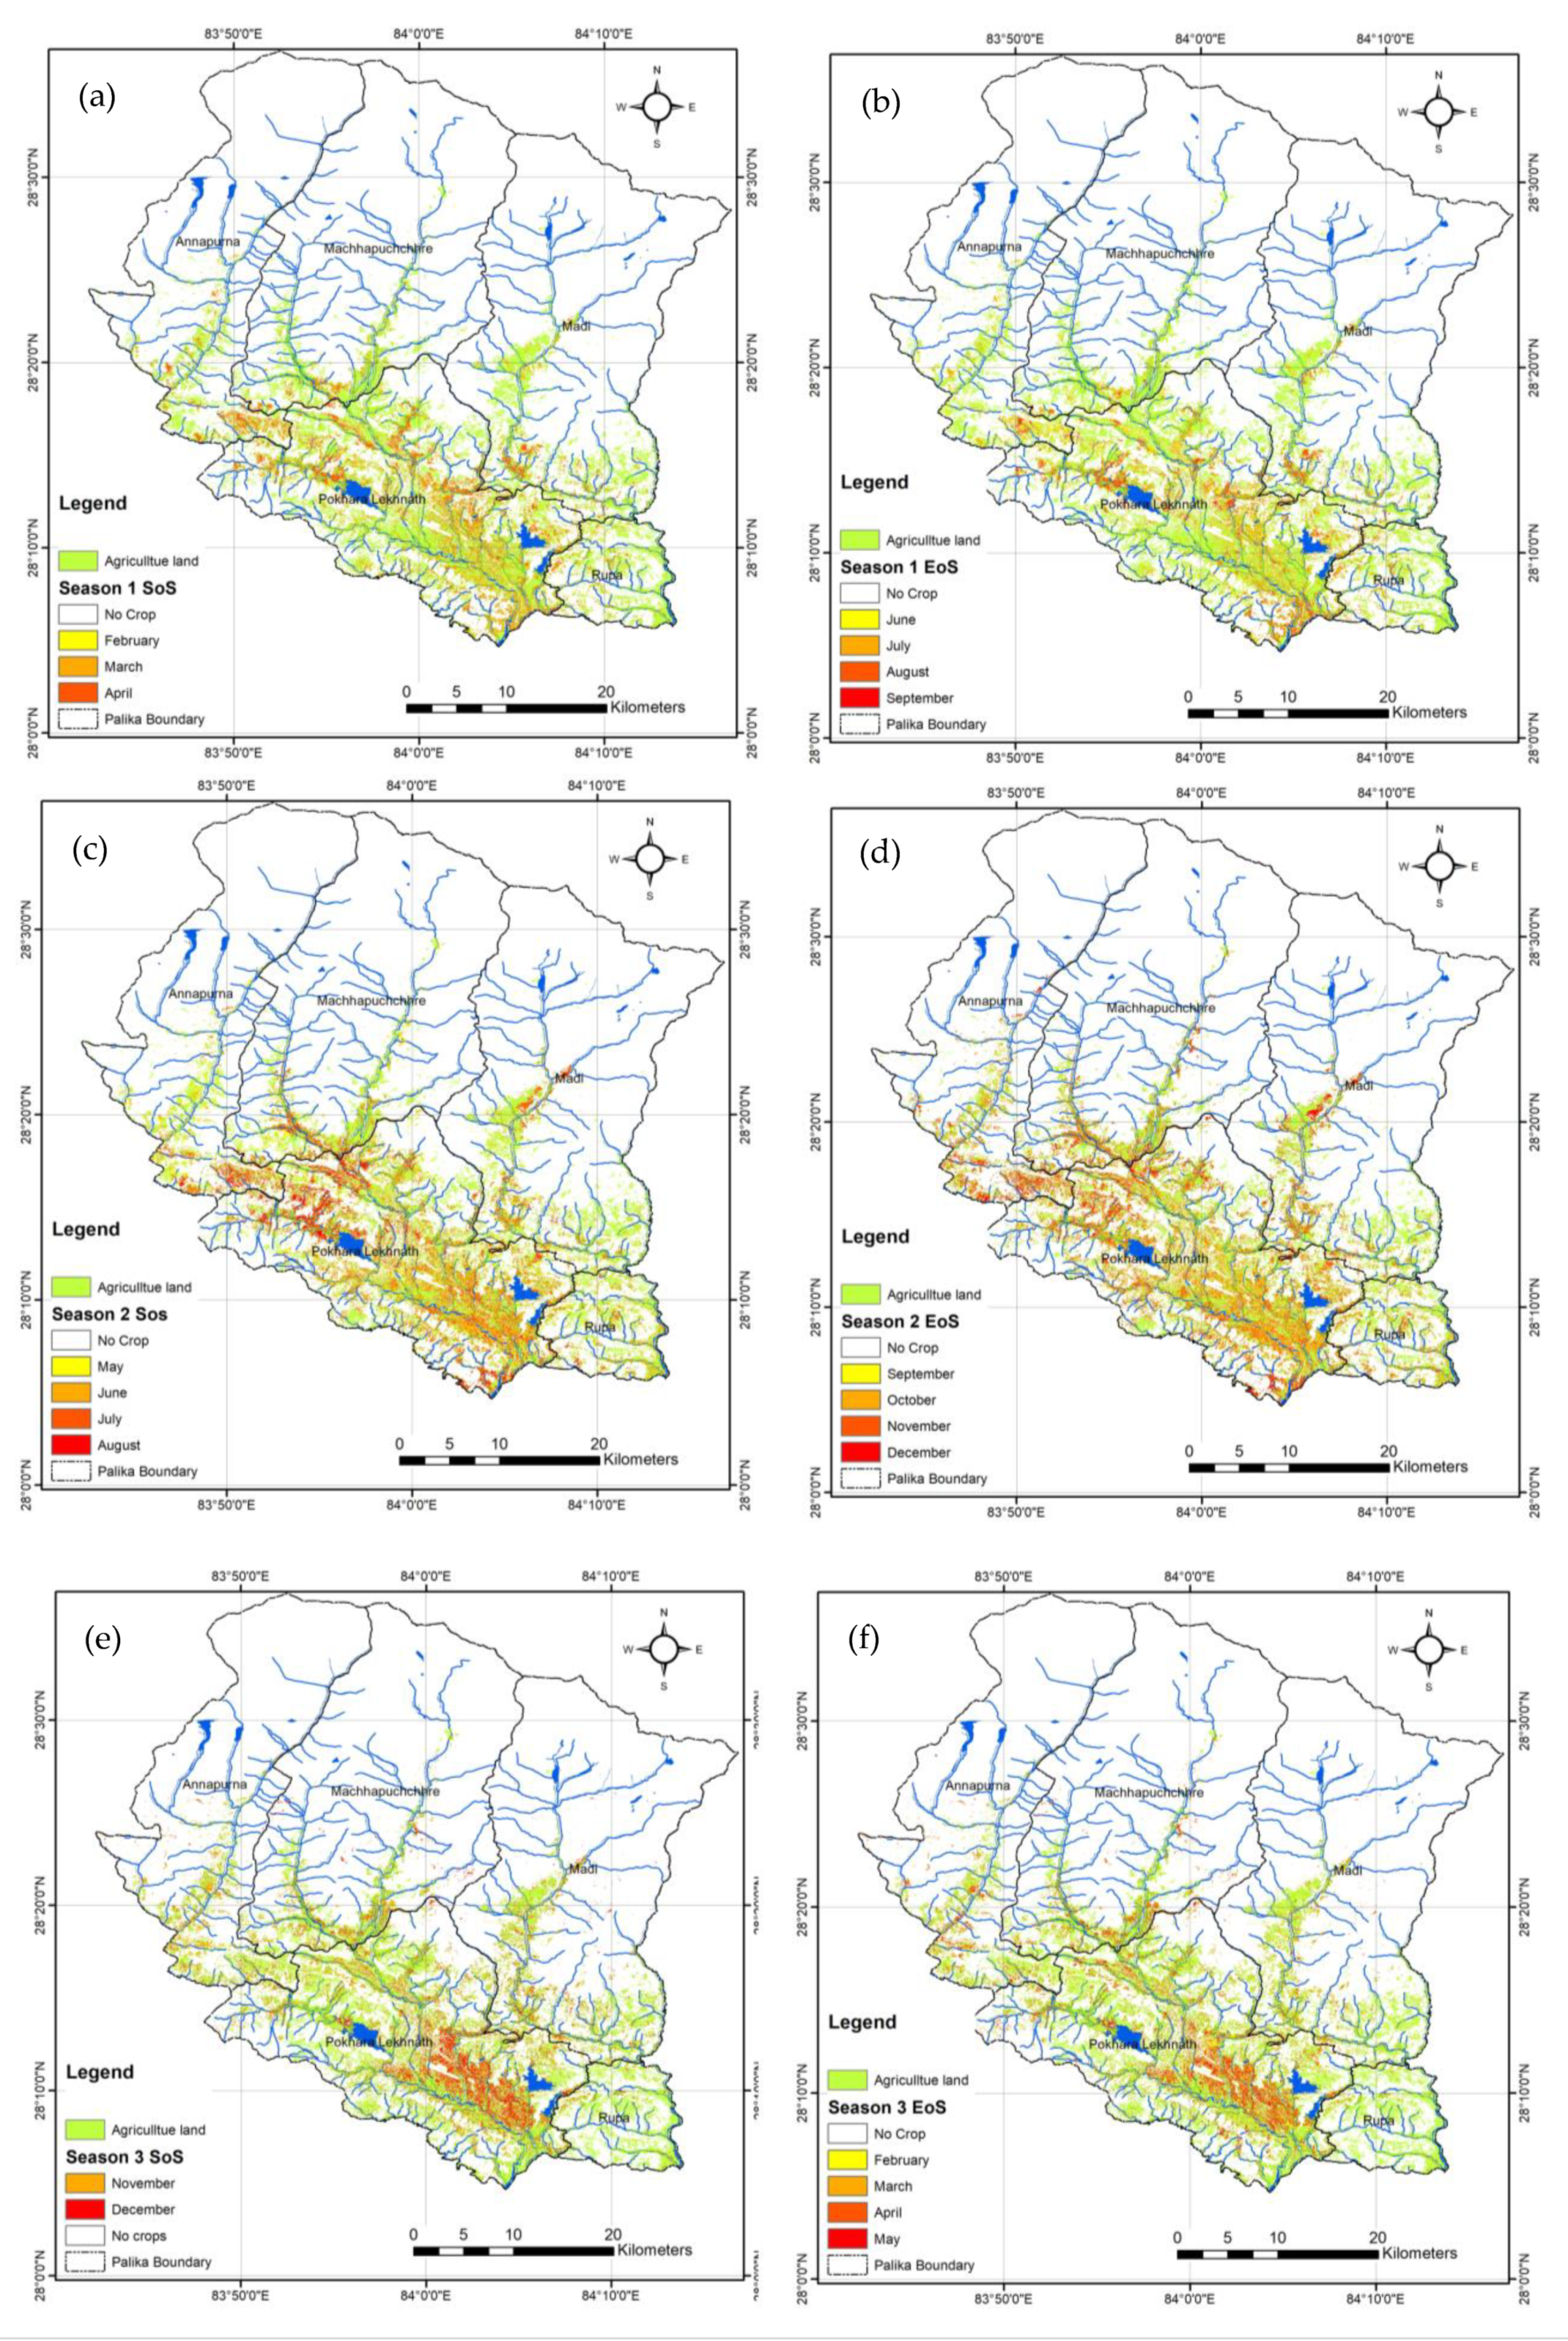
4.2. Crop Calendar
4.3. Seasonal Crop Dynamics
4.4. Discussion
5. Conclusions
Supplementary Materials
Author Contributions
Funding
Informed Consent Statement
Data Availability Statement
Conflicts of Interest
References
- Kubo, M.; Purevdorj, M. The Future of Rice Production and Consumption. J. Food Distrib. Res. 2004, 35, 128–142. [Google Scholar]
- Parry, M.L.; Rosenzweig, C.; Iglesias, A.; Livermore, M.; Fischer, G. Effects of Climate Change on Global Food Production under SRES Emissions and Socio-Economic Scenarios. Glob. Environ. Chang. 2004, 14, 53–67. [Google Scholar] [CrossRef]
- Laborte, A.G.; Paguirigan, N.C.; Moya, P.F.; Nelson, A.; Sparks, A.H.; Gregorio, G.B. Farmers’ Preference for Rice Traits: Insights from Farm Surveys in Central Luzon, Philippines, 1966–2012. PLoS ONE 2015, 10, e0136562. [Google Scholar] [CrossRef] [Green Version]
- Fritz, S.; See, L.; Bayas, J.C.L.; Waldner, F.; Jacques, D.; Becker-Reshef, I.; Whitcraft, A.; Baruth, B.; Bonifacio, R.; Crutchfield, J.; et al. A Comparison of Global Agricultural Monitoring Systems and Current Gaps. Agric. Syst. 2019, 168, 258–272. [Google Scholar] [CrossRef]
- Kang, Y.; Khan, S.; Ma, X. Climate Change Impacts on Crop Yield, Crop Water Productivity and Food Security—A Review. Prog. Nat. Sci. 2009, 19, 1665–1674. [Google Scholar] [CrossRef]
- Whitcraft, A.K.; Becker-Reshef, I.; Justice, C.O. Agricultural Growing Season Calendars Derived from MODIS Surface Reflectance. Int. J. Digit. Earth 2015, 8, 173–197. [Google Scholar] [CrossRef]
- Ye, X.I.N.; Yang, X.-Y.; Zhou, B.-R.; Wang, D.-J.; Zhou, H.-K.; Xu, W.-X.; Yao, B.-Q.; Ma, Z.; Li, Y.-K.; Yang, Y.-S.; et al. Relationship Between Phenology, Productivity, And Meteorological Factors in Recent 15 Years in the Pastoral Area of Qinghai, China. Int. J. Big Data Min. Glob. Warm. 2019, 1, 1950002. [Google Scholar] [CrossRef]
- Schenk, P.M.; McGrath, K.C.; Lorito, M.; Pieterse, C.M.J. Plant–Microbe and Plant–Insect Interactions Meet Common Grounds. New Phytol. 2008, 179, 251–256. [Google Scholar] [CrossRef] [Green Version]
- Giron, D.; Dubreuil, G.; Bennett, A.; Dedeine, F.; Dicke, M.; Dyer, L.A.; Erb, M.; Harris, M.O.; Huguet, E.; Kaloshian, I.; et al. Promises and Challenges in Insect–Plant Interactions. Entomol. Exp. Appl. 2018, 166, 319–343. [Google Scholar] [CrossRef] [Green Version]
- Li, H.; Zhu, H.; Qiu, L.; Wei, X.; Liu, B.; Shao, M. Response of Soil OC, N and P to Land-Use Change and Erosion in the Black Soil Region of the Northeast China. Agric. Ecosyst. Environ. 2020, 302, 107081. [Google Scholar] [CrossRef]
- Sun, T.; Feng, X.; Lal, R.; Cao, T.; Guo, J.; Deng, A.; Zheng, C.; Zhang, J.; Song, Z.; Zhang, W. Crop Diversification Practice Faces a Tradeoff between Increasing Productivity and Reducing Carbon Footprints. Agric. Ecosyst. Environ. 2021, 321, 107614. [Google Scholar] [CrossRef]
- Duflot, R.; San-Cristobal, M.; Andrieu, E.; Choisis, J.-P.; Esquerré, D.; Ladet, S.; Ouin, A.; Rivers-Moore, J.; Sheeren, D.; Sirami, C.; et al. Farming Intensity Indirectly Reduces Crop Yield through Negative Effects on Agrobiodiversity and Key Ecological Functions. Agric. Ecosyst. Environ. 2022, 326, 107810. [Google Scholar] [CrossRef]
- Johansson, J.; Nilsson, J.Å.; Jonzén, N. Phenological Change and Ecological Interactions: An Introduction. Oikos 2015, 124, 1–3. [Google Scholar] [CrossRef]
- Shammi, S.A.; Meng, Q. Use Time Series NDVI and EVI to Develop Dynamic Crop Growth Metrics for Yield Modeling. Ecol. Indic. 2021, 121, 107124. [Google Scholar] [CrossRef]
- Groten, S.M. NDVI-Crop Monitoring and Early Yield Assessment of Burkina Faso. Int. J. Remote Sens. 1993, 14, 1495–1515. [Google Scholar] [CrossRef]
- Seo, B.; Lee, J.; Do Lee, K.; Hong, S.; Kang, S. Improving Remotely-Sensed Crop Monitoring by NDVI-Based Crop Phenology Estimators for Corn and Soybeans in Iowa and Illinois, USA. F. Crop. Res. 2019, 238, 113–128. [Google Scholar] [CrossRef]
- Li, C.; Li, H.; Li, J.; Lei, Y.; Li, C.; Manevski, K.; Shen, Y. Using NDVI Percentiles to Monitor Real-Time Crop Growth. Comput. Electron. Agric. 2018, 162, 357–363. [Google Scholar] [CrossRef]
- Boschetti, M.; Busetto, L.; Manfron, G.; Laborte, A.; Asilo, S.; Pazhanivelan, S.; Nelson, A. PhenoRice: A Method for Automatic Extraction of Spatio-Temporal Information on Rice Crops Using Satellite Data Time Series. Remote Sens. Environ. 2017, 194, 347–365. [Google Scholar] [CrossRef] [Green Version]
- Sakamoto, T.; Yokozawa, M.; Toritani, H.; Shibayama, M.; Ishitsuka, N.; Ohno, H. A Crop Phenology Detection Method Using Time-Series MODIS Data. Remote Sens. Environ. 2005, 96, 366–374. [Google Scholar] [CrossRef]
- More, R.S.; Manjunath, K.R.; Jain, N.K.; Panigrahy, S.; Parihar, J.S. Derivation of Rice Crop Calendar and Evaluation of Crop Phenometrics and Latitudinal Relationship for Major South and South-East Asian Countries: A Remote Sensing Approach. Comput. Electron. Agric. 2016, 127, 336–350. [Google Scholar] [CrossRef]
- Bandaru, V.; Yaramasu, R.; PNVR, K.; He, J.; Fernando, S.; Sahajpal, R.; Wardlow, B.D.; Suyker, A.; Justice, C. PhenoCrop: An Integrated Satellite-Based Framework to Estimate Physiological Growth Stages of Corn and Soybeans. Int. J. Appl. Earth Obs. Geoinf. 2020, 92, 102188. [Google Scholar] [CrossRef]
- Mishra, B.; Busetto, L.; Boschetti, M.; Laborte, A.; Nelson, A. RICA: A Rice Crop Calendar for Asia Based on MODIS Multi Year Data. Int. J. Appl. Earth Obs. Geoinf. 2021, 103, 102471. [Google Scholar] [CrossRef]
- Kumar, A.; Roy, D.; Joshi, P.K.; Tripathi, G.; Adhikari, R.P. Impact of Contract Farming on Profits and Yield of Smallholder Farms in Nepal: An Evidence from Lentil Cultivation. Agric. Appl. Econ. Assoc. Annu. Meet. 2016, 33. [Google Scholar] [CrossRef]
- Rimal, B.; Zhang, L.; Rijal, S. Crop Cycles and Crop Land Classification in Nepal Using MODIS NDVI. Remote Sens. Earth Syst. Sci. 2018, 1, 14–28. [Google Scholar] [CrossRef]
- Karki, R.; Talchabhadel, R.; Aalto, J.; Baidya, S.K. New Climatic Classification of Nepal. Theor. Appl. Climatol. 2016, 125, 799–808. [Google Scholar] [CrossRef]
- Mishra, B.; Babel, M.S.; Tripathi, N.K. Analysis of Climatic Variability and Snow Cover in the Kaligandaki River Basin, Himalaya, Nepal. Theor. Appl. Clim. 2014, 116, 681–694. [Google Scholar] [CrossRef]
- MOALD. Statistical Information in Nepalese Agriculture 2075/76; Singha Durbar: Kathmandu, Nepal, 2020.
- Carman, C.S.; Merickel, M.B. Supervising ISODATA with an Information Theoretic Stopping Rule. Pattern Recognit. 1990, 23, 185–197. [Google Scholar] [CrossRef]
- Cleveland, W.S. Robust Locally Weighted Regression and Smoothing Scatterplots. J. Am. Stat. Assoc. 1979, 74, 829–836. [Google Scholar] [CrossRef]
- Jacoby, W.G. Loess: A Nonparametric, Graphical Tool for Depicting Relationships between Variables. Elect. Stud. 2000, 19, 577–613. [Google Scholar] [CrossRef]
- Fox, J.; Weisberg, S. Nonparametric Regression; SAGE: Newcastle, UK, 2016. [Google Scholar]
- Patel, J.H.; Oza, M.P. Deriving Crop Calendar Using NDVI Time-Series. Int. Arch. Photogramm. Remote Sens. Spat. Inf. Sci. ISPRS Arch. 2014, XL-8, 869–873. [Google Scholar] [CrossRef] [Green Version]
- Bastola, A.; Karki, T.; Marahatta, S.; Amgain, L.P. Growth, Phenology, Yield and Yield Attributes of Rice as Influenced by Tillage, Residue and Nitrogen Management Practice in Chitwan, Nepal. Afr. J. Agric. Res. 2021, 17, 128–136. [Google Scholar]
- Dahal, S.; Karki, T.B.; Amgain, L.P.; Bhattachan, B.K. Tillage, Residue, Fertilizer and Weed Management on Phenology and Yield of Spring Maize in Terai, Nepal. Int. J. Appl. Sci. Biotechnol. 2014, 2, 328–335. [Google Scholar] [CrossRef]
- Aman, K.C.; Acharya, T.D.; Wagle, N.; Lee, D.H. Tracking Long-Term Phenological Shift in Response to Climatic Parameters in Chitwan National Park, Nepal. Sensors Mater. 2021, 33, 3787–3799. [Google Scholar]
- Luintel, N.; Ma, W.; Ma, Y.; Wang, B.; Xu, J.; Dawadi, B.; Mishra, B. Tracking the Dynamics of Paddy Rice Cultivation Practice through MODIS Time Series and PhenoRice Algorithm. Agric. For. Meteorol. 2021, 307, 108538. [Google Scholar] [CrossRef]
- Sisheber, B.; Marshall, M.; Ayalew, D.; Nelson, A. Tracking Crop Phenology in a Highly Dynamic Landscape with Knowledge-Based Landsat–MODIS Data Fusion. Int. J. Appl. Earth Obs. Geoinf. 2022, 106, 102670. [Google Scholar] [CrossRef]
- Kontgis, C.; Schneider, A.; Ozdogan, M. Mapping Rice Paddy Extent and Intensi Fi Cation in the Vietnamese Mekong River Delta with Dense Time Stacks of Landsat Data. Remote Sens. Environ. 2015, 169, 255–269. [Google Scholar] [CrossRef]
- Jain, M.; Mondal, P.; DeFries, R.S.; Small, C.; Galford, G.L. Mapping Cropping Intensity of Smallholder Farms: A Comparison of Methods Using Multiple Sensors. Remote Sens. Environ. 2013, 134, 210–223. [Google Scholar] [CrossRef] [Green Version]


| Observed Data | ||||||||||
|---|---|---|---|---|---|---|---|---|---|---|
| Agriculture | Forest | Water | Snow | Grassland | Bareland | Builtup | Total | Users Accuracy | ||
| Classified data | Agriculture | 146 | 3 | 0 | 0 | 5 | 2 | 0 | 156 | 93.59 |
| Forest | 6 | 27 | 0 | 0 | 9 | 0 | 0 | 42 | 64.29 | |
| Water | 2 | 0 | 12 | 0 | 0 | 0 | 0 | 14 | 85.71 | |
| Snow | 0 | 0 | 2 | 6 | 0 | 2 | 0 | 10 | 60.00 | |
| Grassland | 3 | 3 | 0 | 0 | 14 | 0 | 0 | 20 | 70.00 | |
| Bareland | 2 | 0 | 0 | 0 | 2 | 32 | 8 | 44 | 72.73 | |
| Builtup | 0 | 0 | 0 | 0 | 4 | 11 | 42 | 57 | 73.68 | |
| Total | 159 | 33 | 14 | 6 | 34 | 47 | 50 | 343 | ||
| Producers Accuracy | 91.82 | 81.82 | 85.71 | 100.00 | 41.18 | 68.09 | 84.00 | 81.34 | ||
| Observation | Producers’ Accuracy | |||||
|---|---|---|---|---|---|---|
| Intensity | One | Two | Three | Total | ||
| Classification | One | 66.00 | 6 | 0.00 | 72.00 | 91.67 |
| Two | 2.00 | 44 | 4.00 | 50.00 | 88.00 | |
| Three | 0.00 | 3 | 21.00 | 24.00 | 87.50 | |
| Total | 68.00 | 53 | 25.00 | 146.00 | ||
| Users accuracy | 97.06 | 83 | 84.00 | 88.73 | ||
| Season | Area (ha) |
|---|---|
| One season | 13,519 |
| Two seasons | 6721 |
| Three seasons | 1164 |
Disclaimer/Publisher’s Note: The statements, opinions and data contained in all publications are solely those of the individual author(s) and contributor(s) and not of MDPI and/or the editor(s). MDPI and/or the editor(s) disclaim responsibility for any injury to people or property resulting from any ideas, methods, instructions or products referred to in the content. |
© 2023 by the authors. Licensee MDPI, Basel, Switzerland. This article is an open access article distributed under the terms and conditions of the Creative Commons Attribution (CC BY) license (https://creativecommons.org/licenses/by/4.0/).
Share and Cite
Mishra, B.; Bhandari, R.; Bhandari, K.P.; Bhandari, D.M.; Luintel, N.; Dahal, A.; Poudel, S. High-Resolution Mapping of Seasonal Crop Pattern Using Sentinel Imagery in Mountainous Region of Nepal: A Semi-Automatic Approach. Geomatics 2023, 3, 312-327. https://doi.org/10.3390/geomatics3020017
Mishra B, Bhandari R, Bhandari KP, Bhandari DM, Luintel N, Dahal A, Poudel S. High-Resolution Mapping of Seasonal Crop Pattern Using Sentinel Imagery in Mountainous Region of Nepal: A Semi-Automatic Approach. Geomatics. 2023; 3(2):312-327. https://doi.org/10.3390/geomatics3020017
Chicago/Turabian StyleMishra, Bhogendra, Rupesh Bhandari, Krishna Prasad Bhandari, Dinesh Mani Bhandari, Nirajan Luintel, Ashok Dahal, and Shobha Poudel. 2023. "High-Resolution Mapping of Seasonal Crop Pattern Using Sentinel Imagery in Mountainous Region of Nepal: A Semi-Automatic Approach" Geomatics 3, no. 2: 312-327. https://doi.org/10.3390/geomatics3020017