
A Dispersion Index for the Analysis of the Distribution of Activities in the Tunisian Coastal City of Nabeul

 ,
,  ,
,  and
and 
Abstract
:1. Introduction
1.1. Configuration of the Urban Network in Coastal Cities
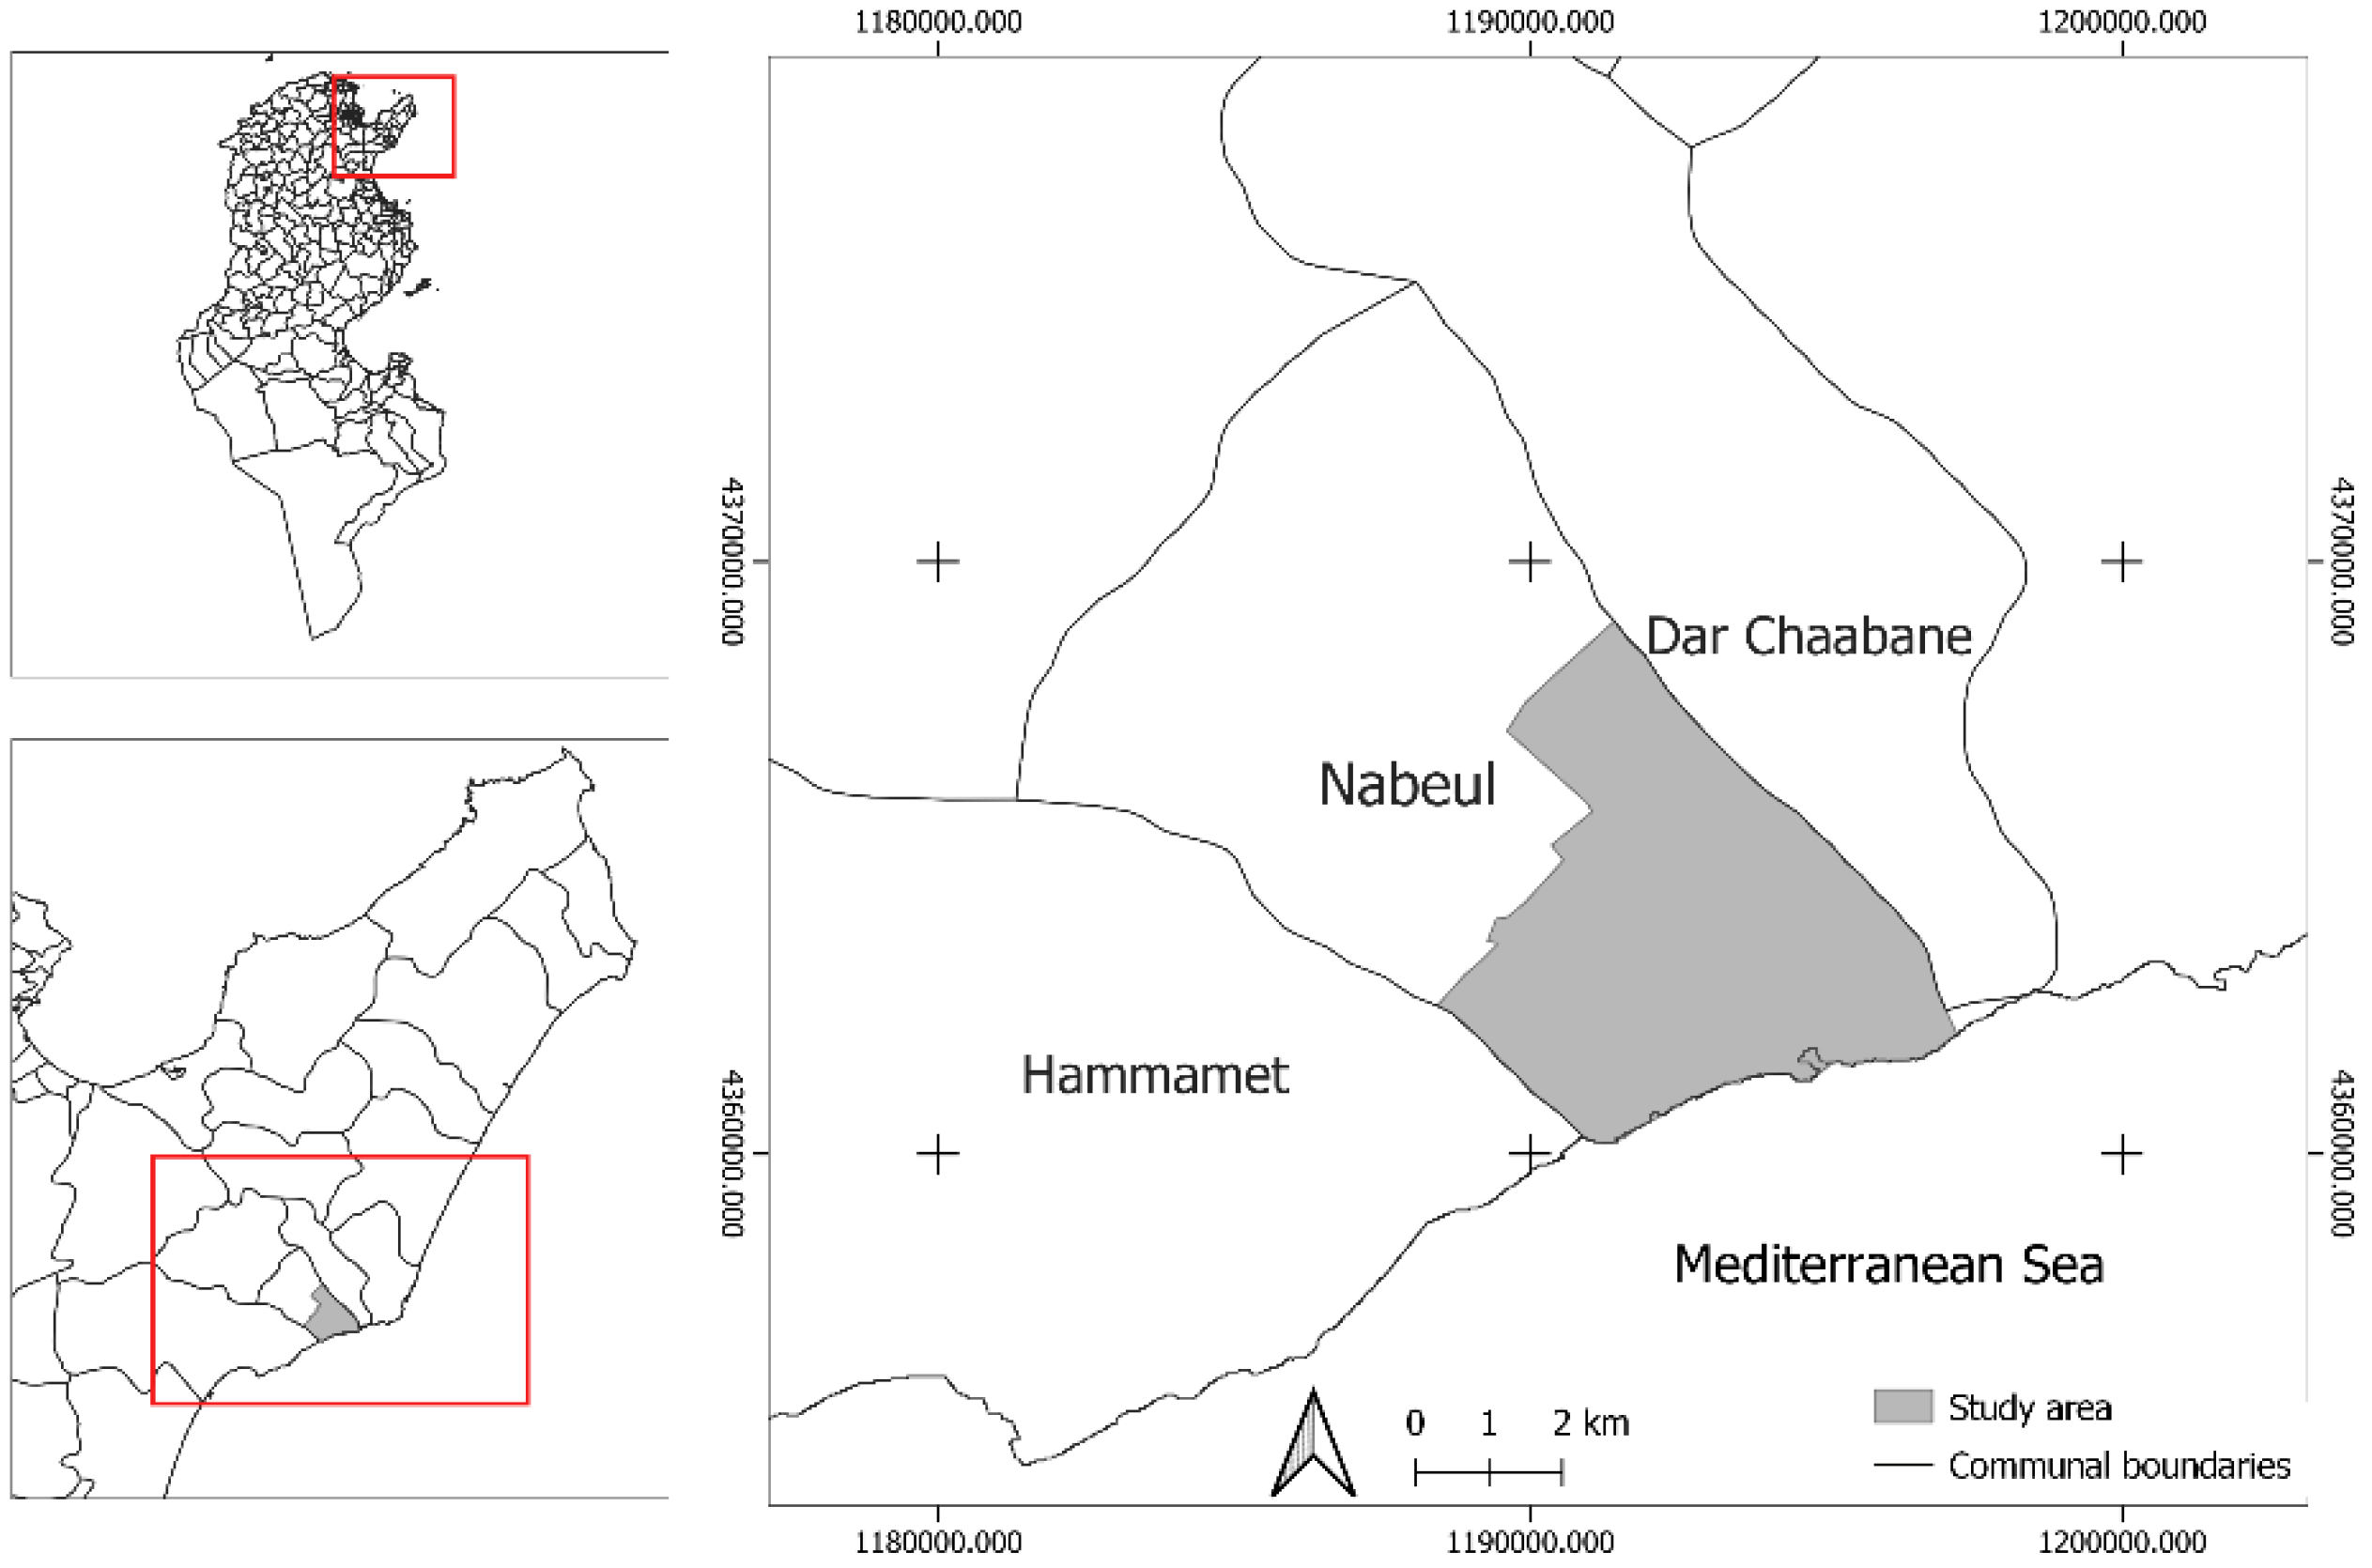
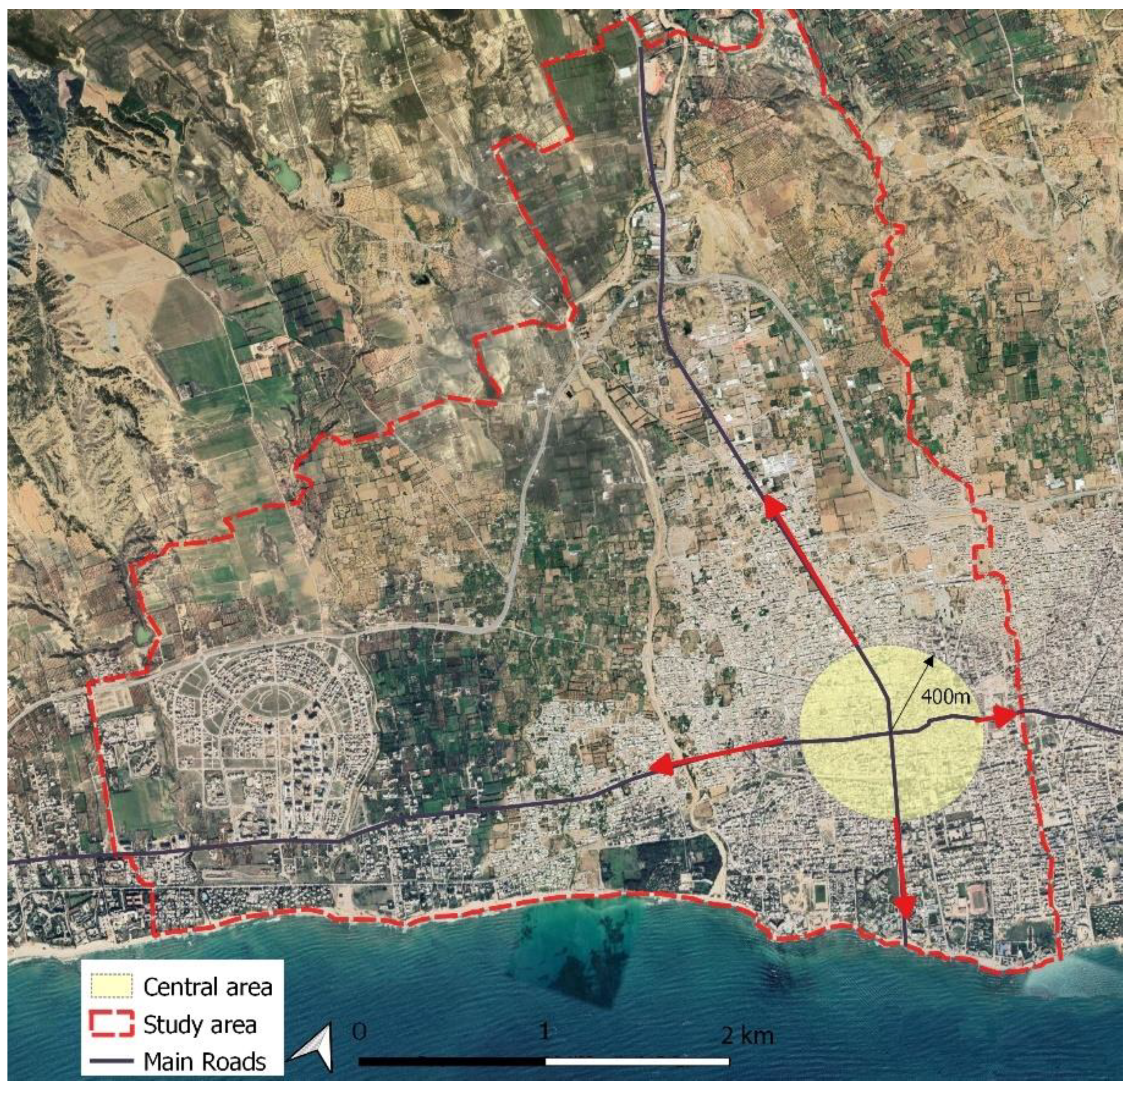
1.2. Research Case: The City of Nabeul
2. Materials and Methods
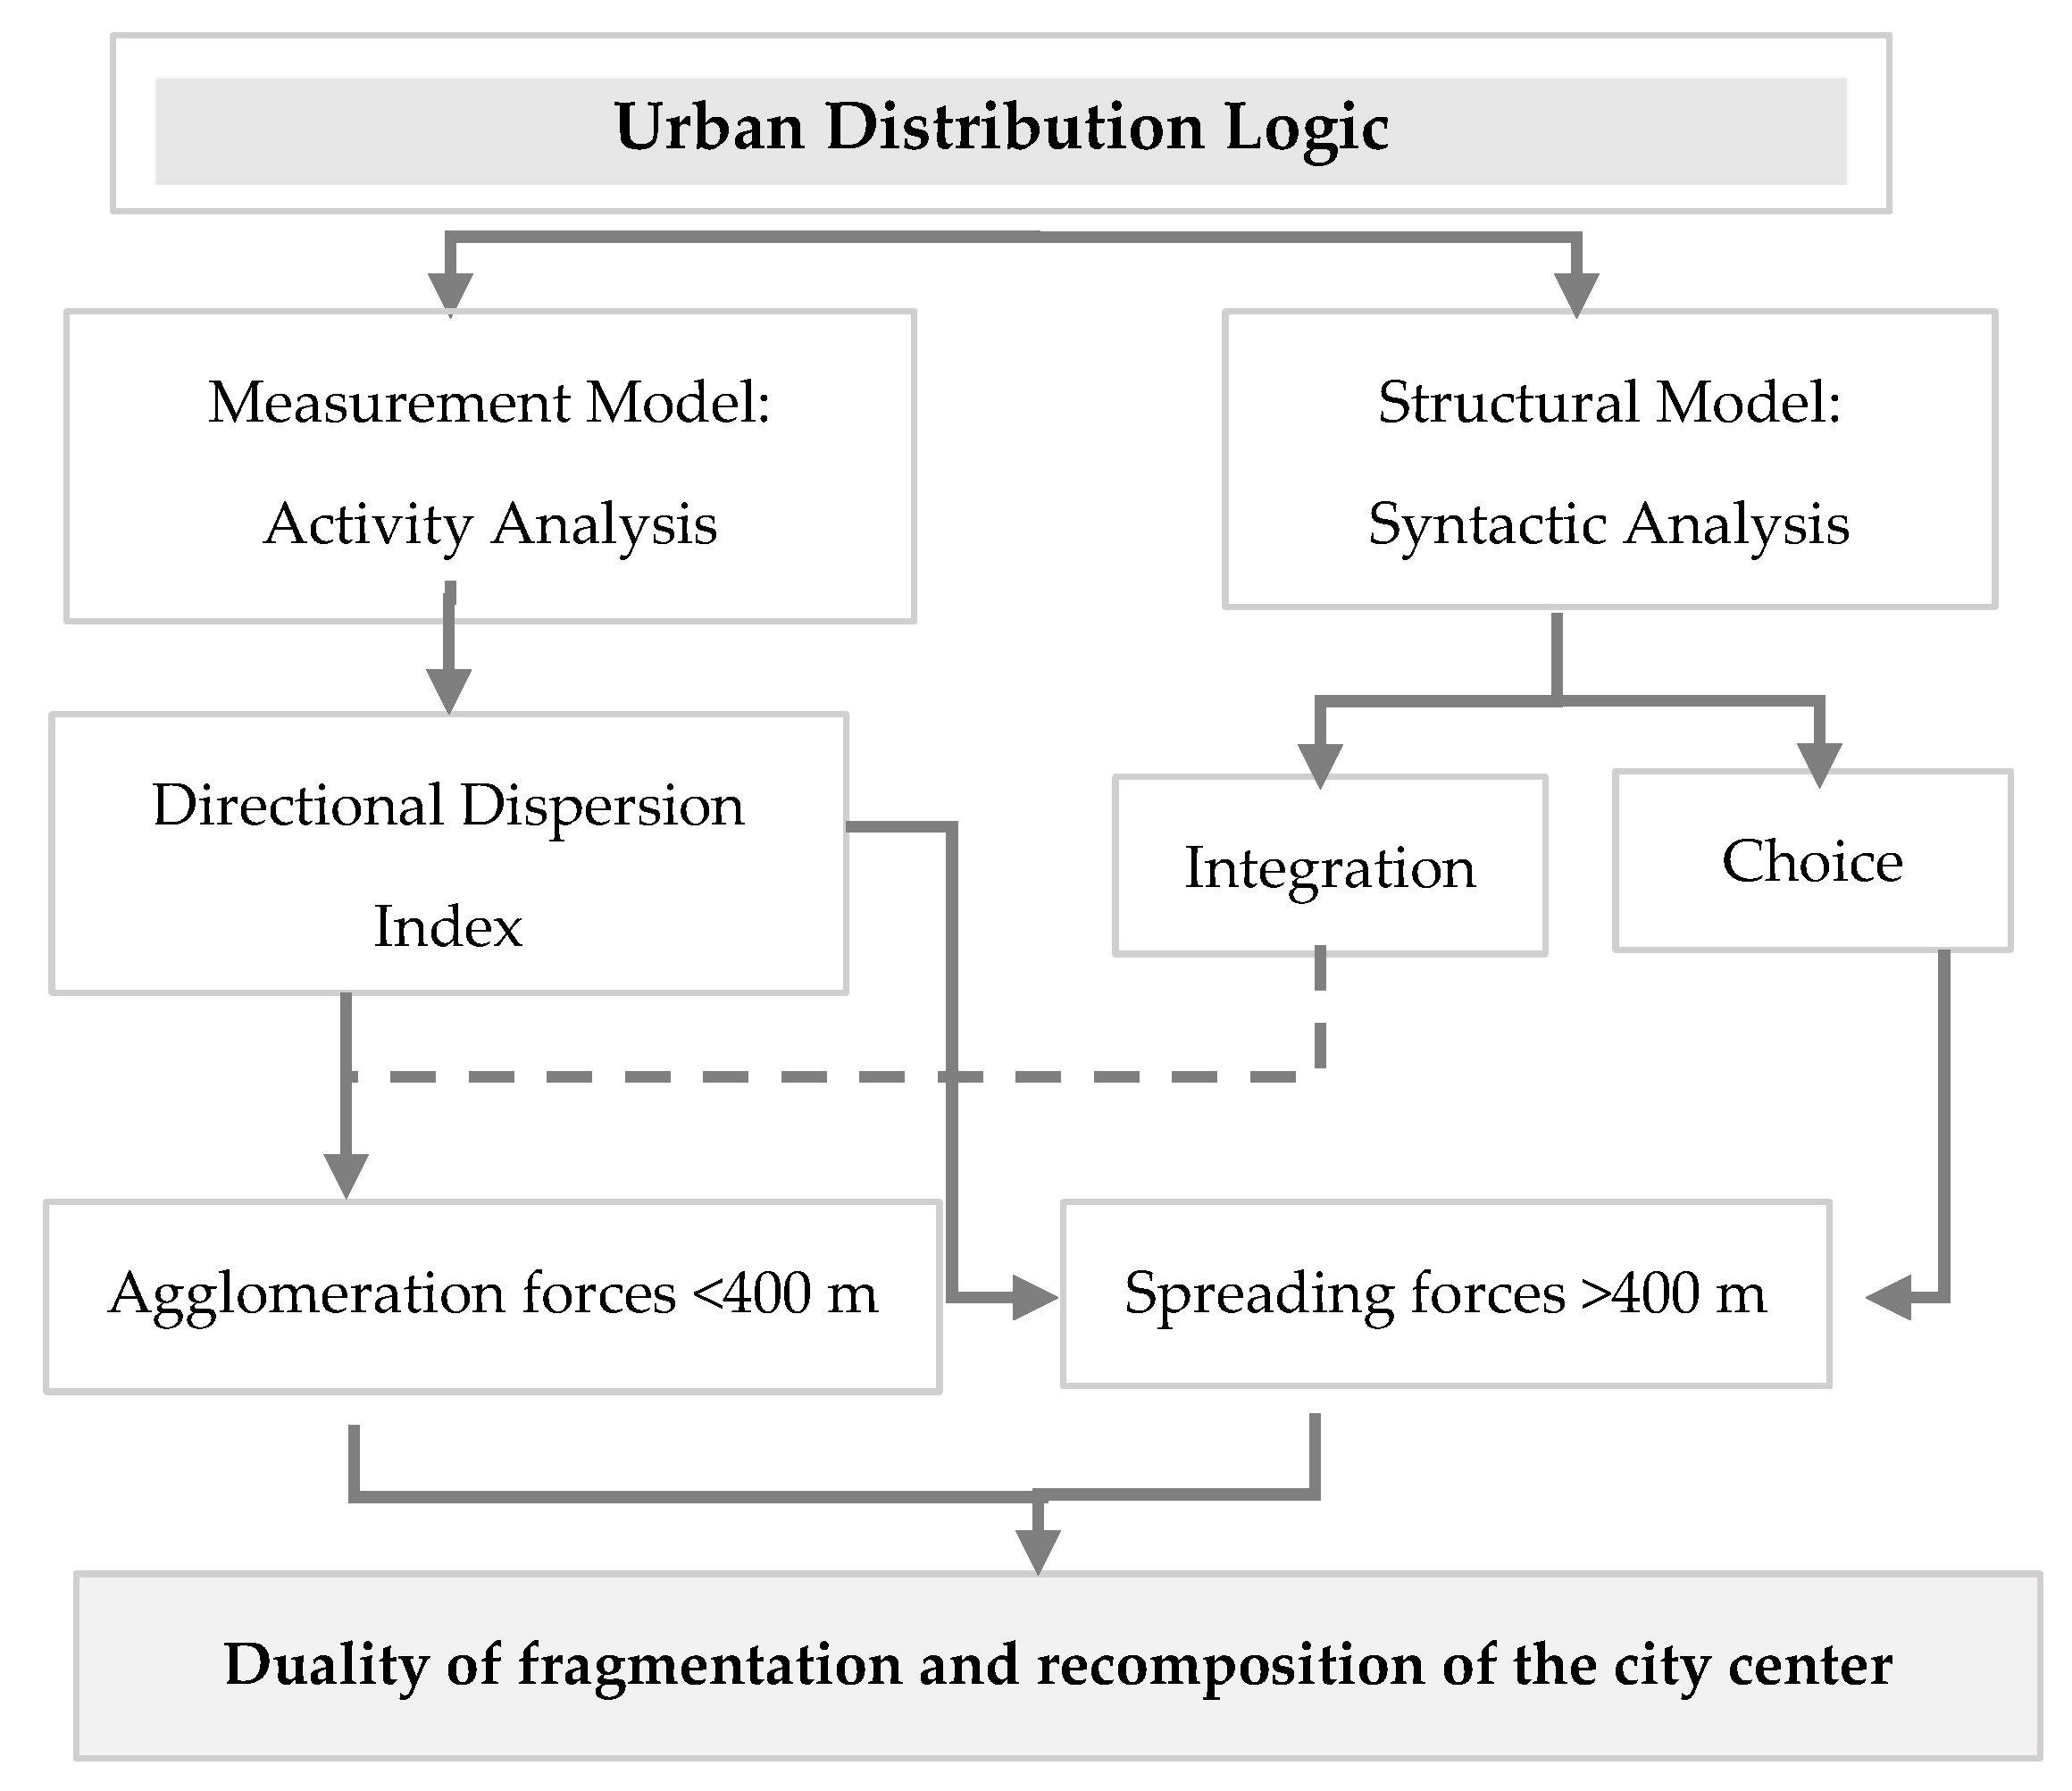
2.1. Construction of a Combined Urban Distribution Model
2.2. Searching for a Directional Dispersion Index


2.3. Syntactic Analysis
3. Experimental Results
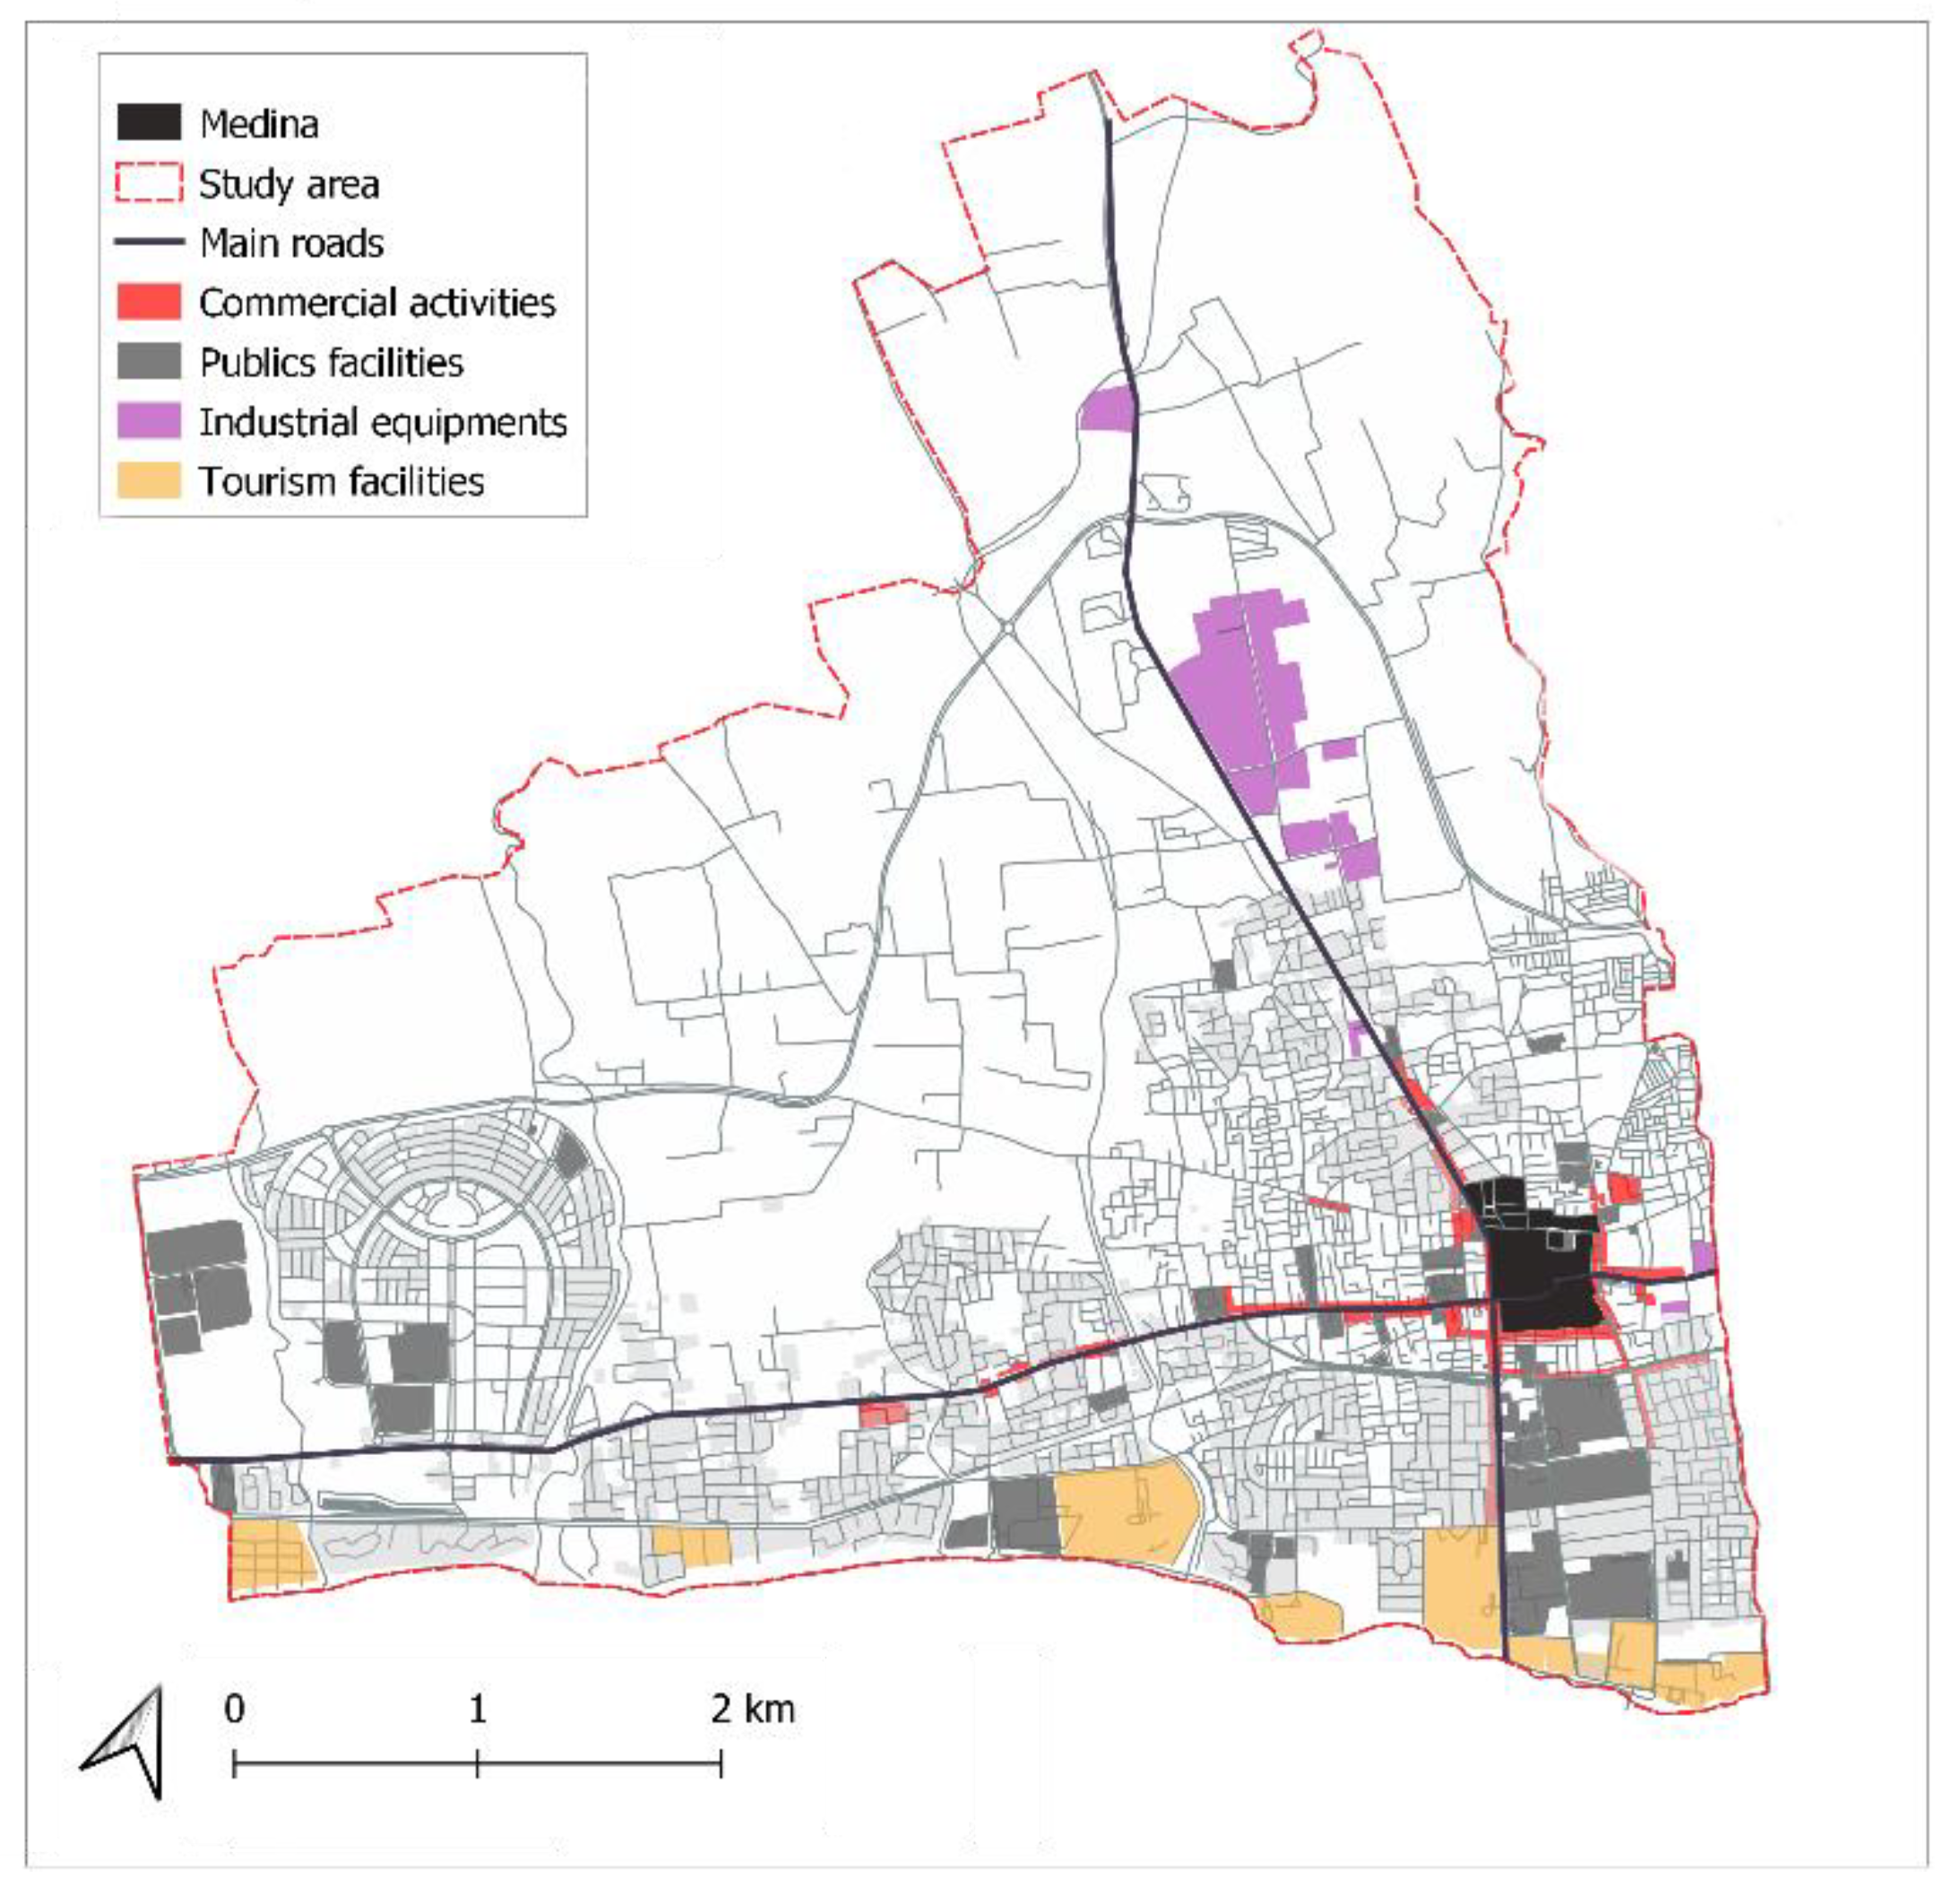
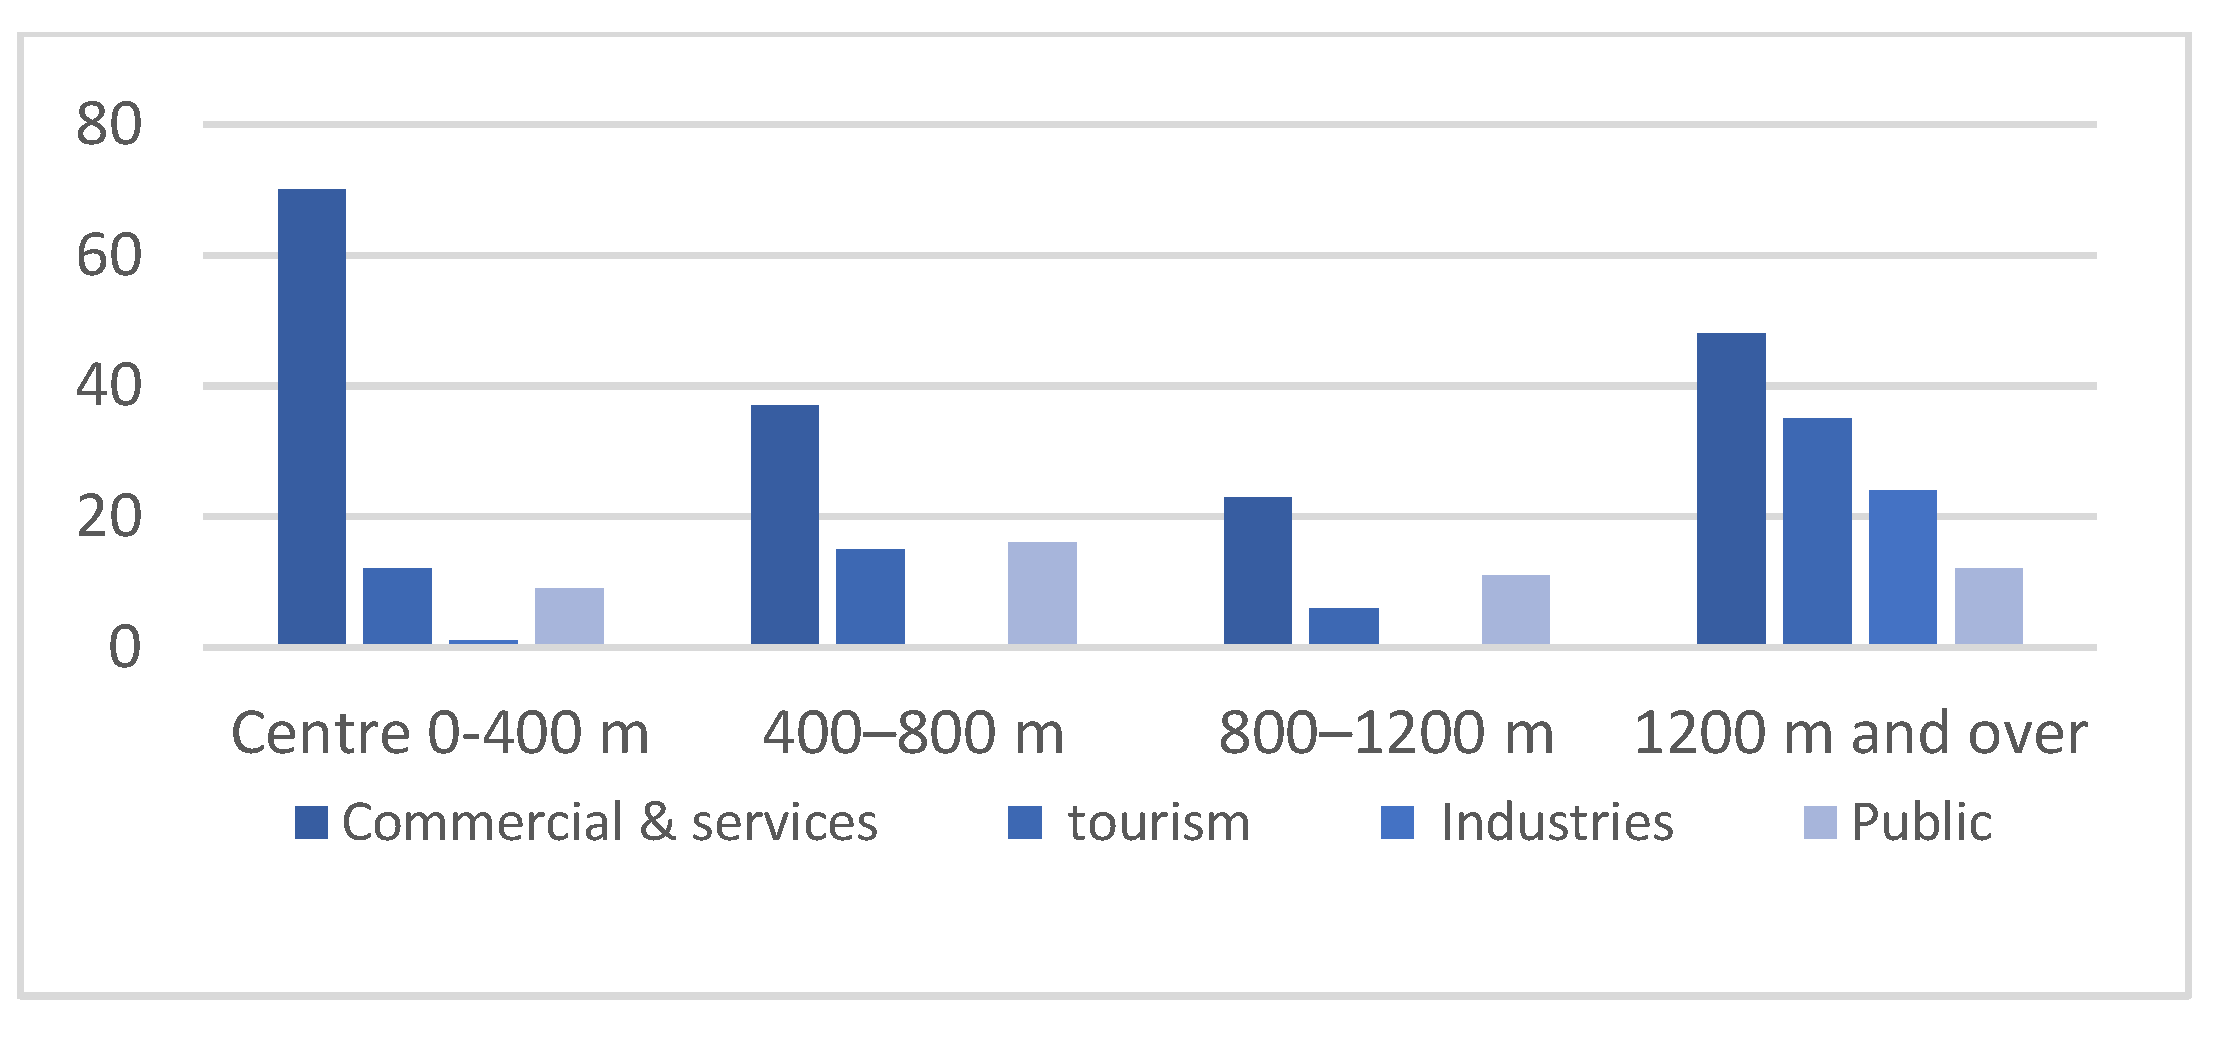
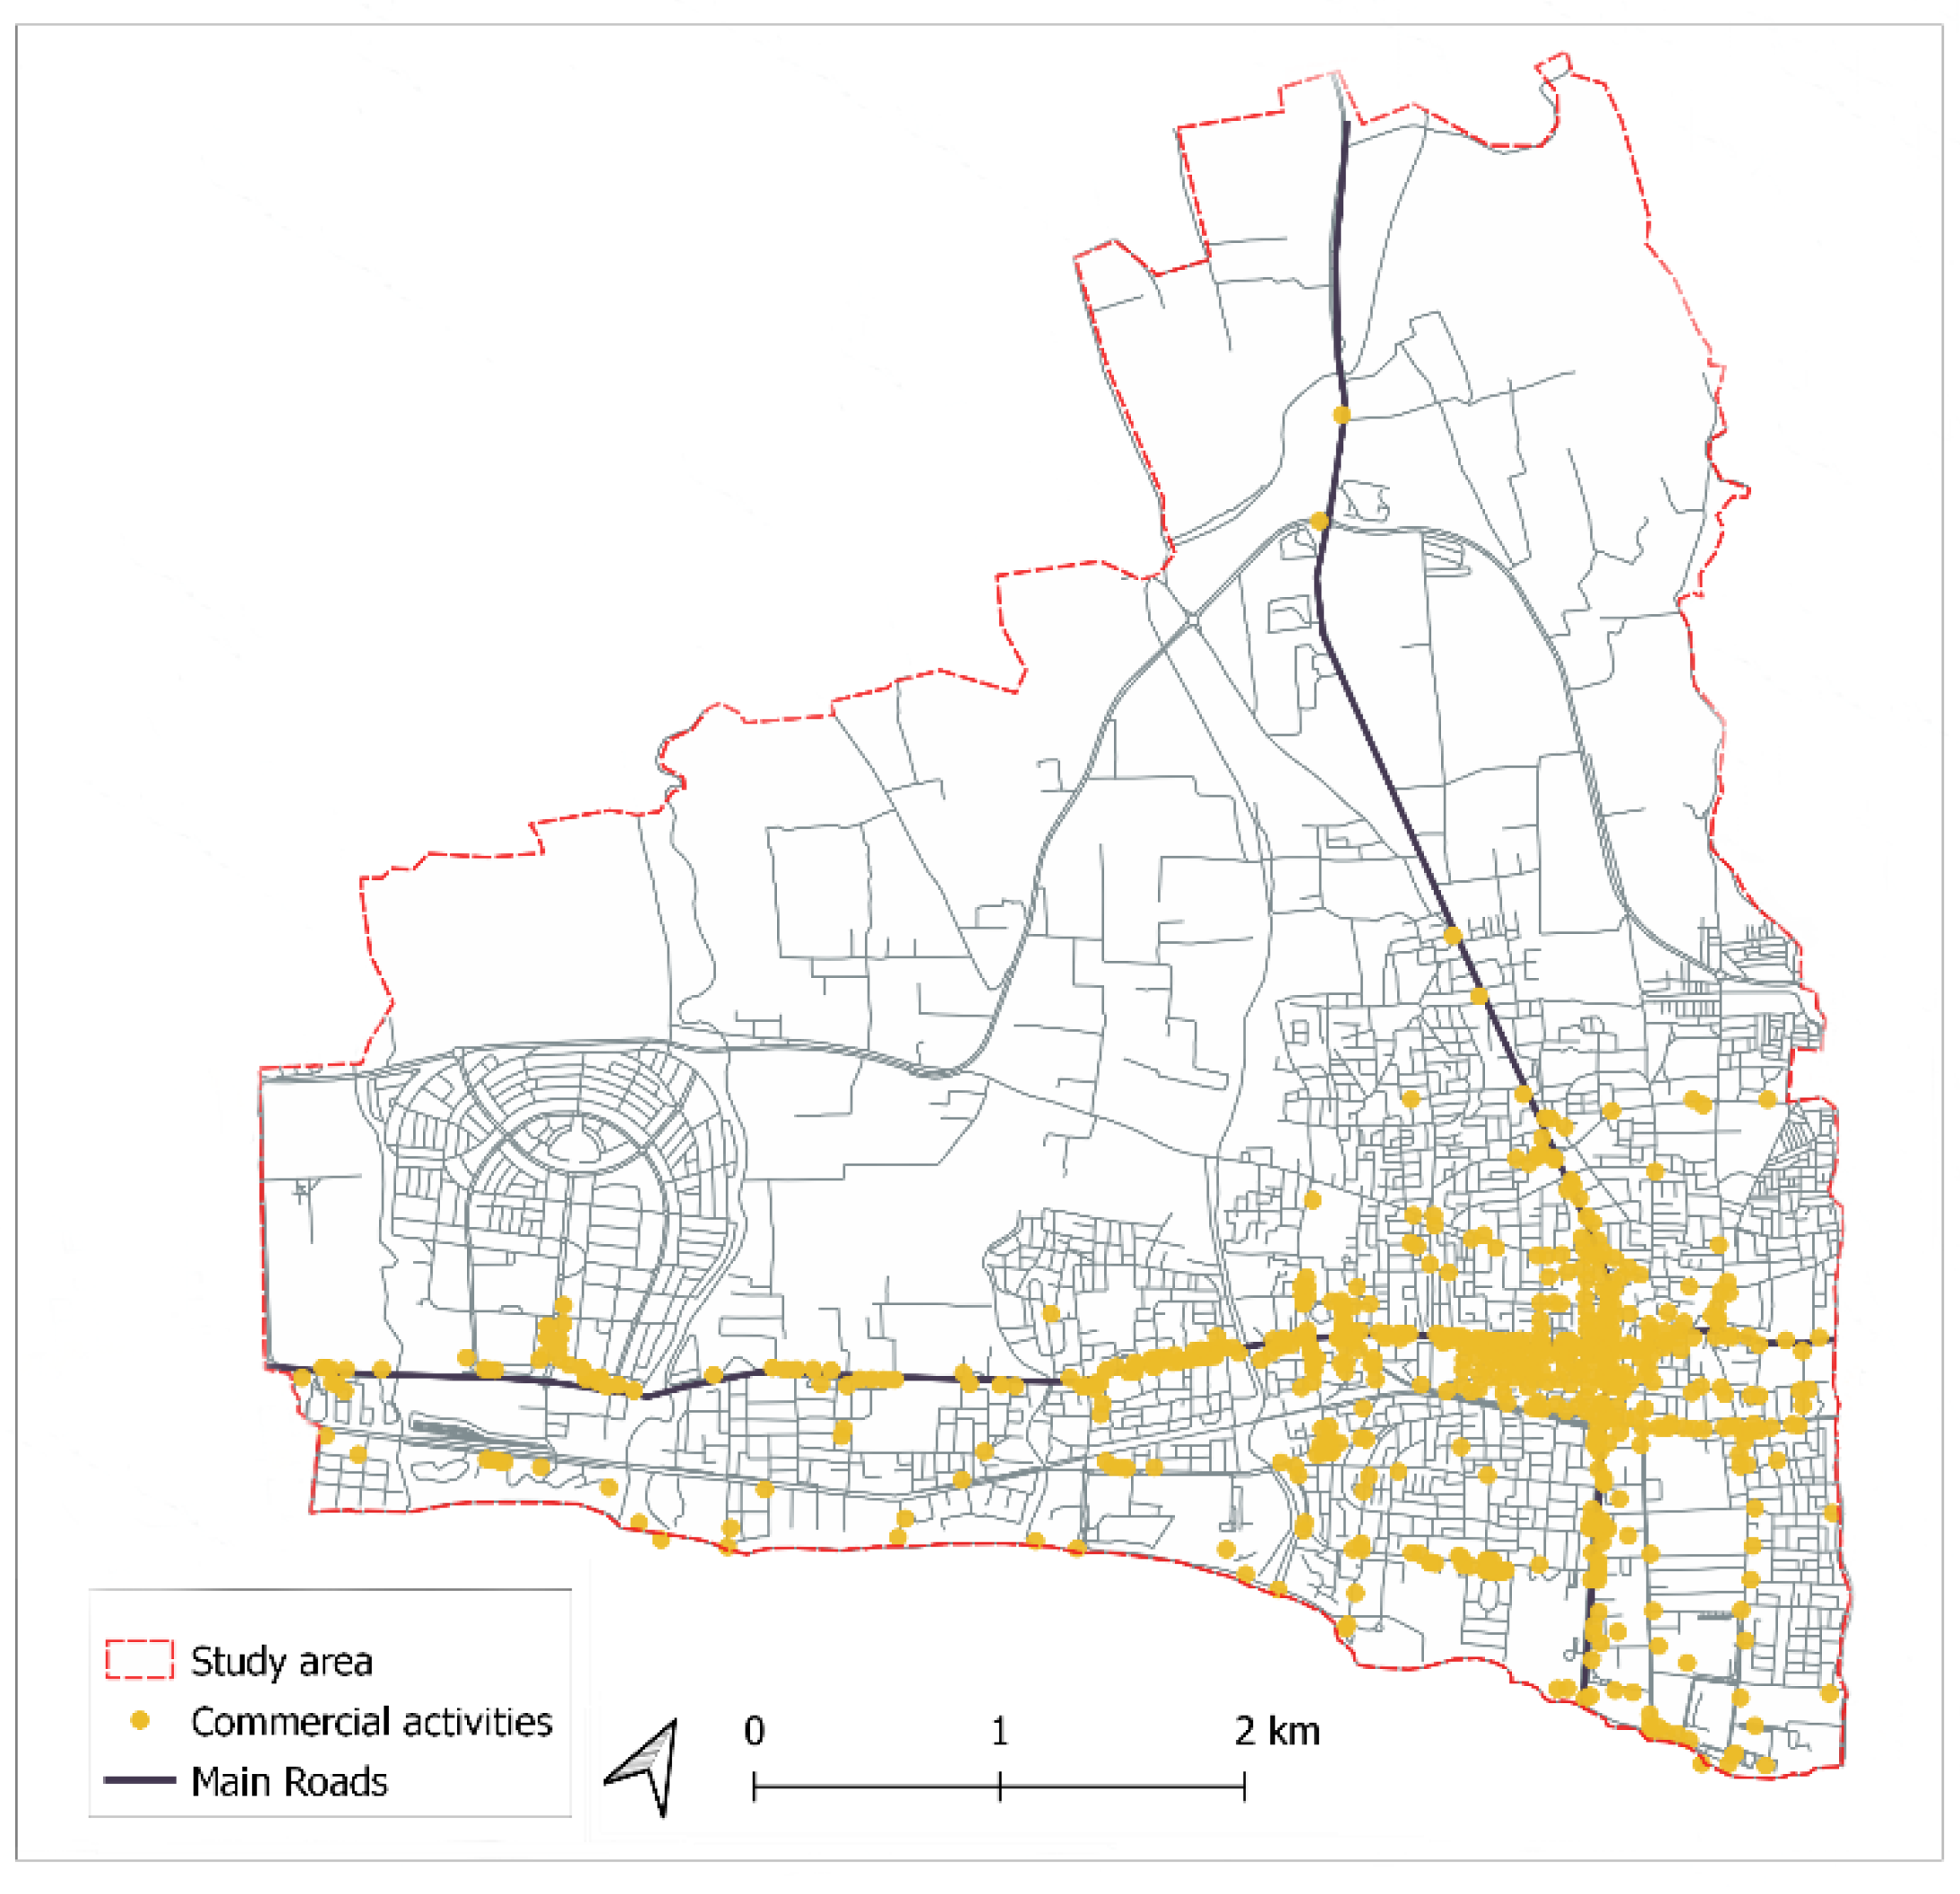
3.1. Distribution of Commercial and Service Activities in the Study Area
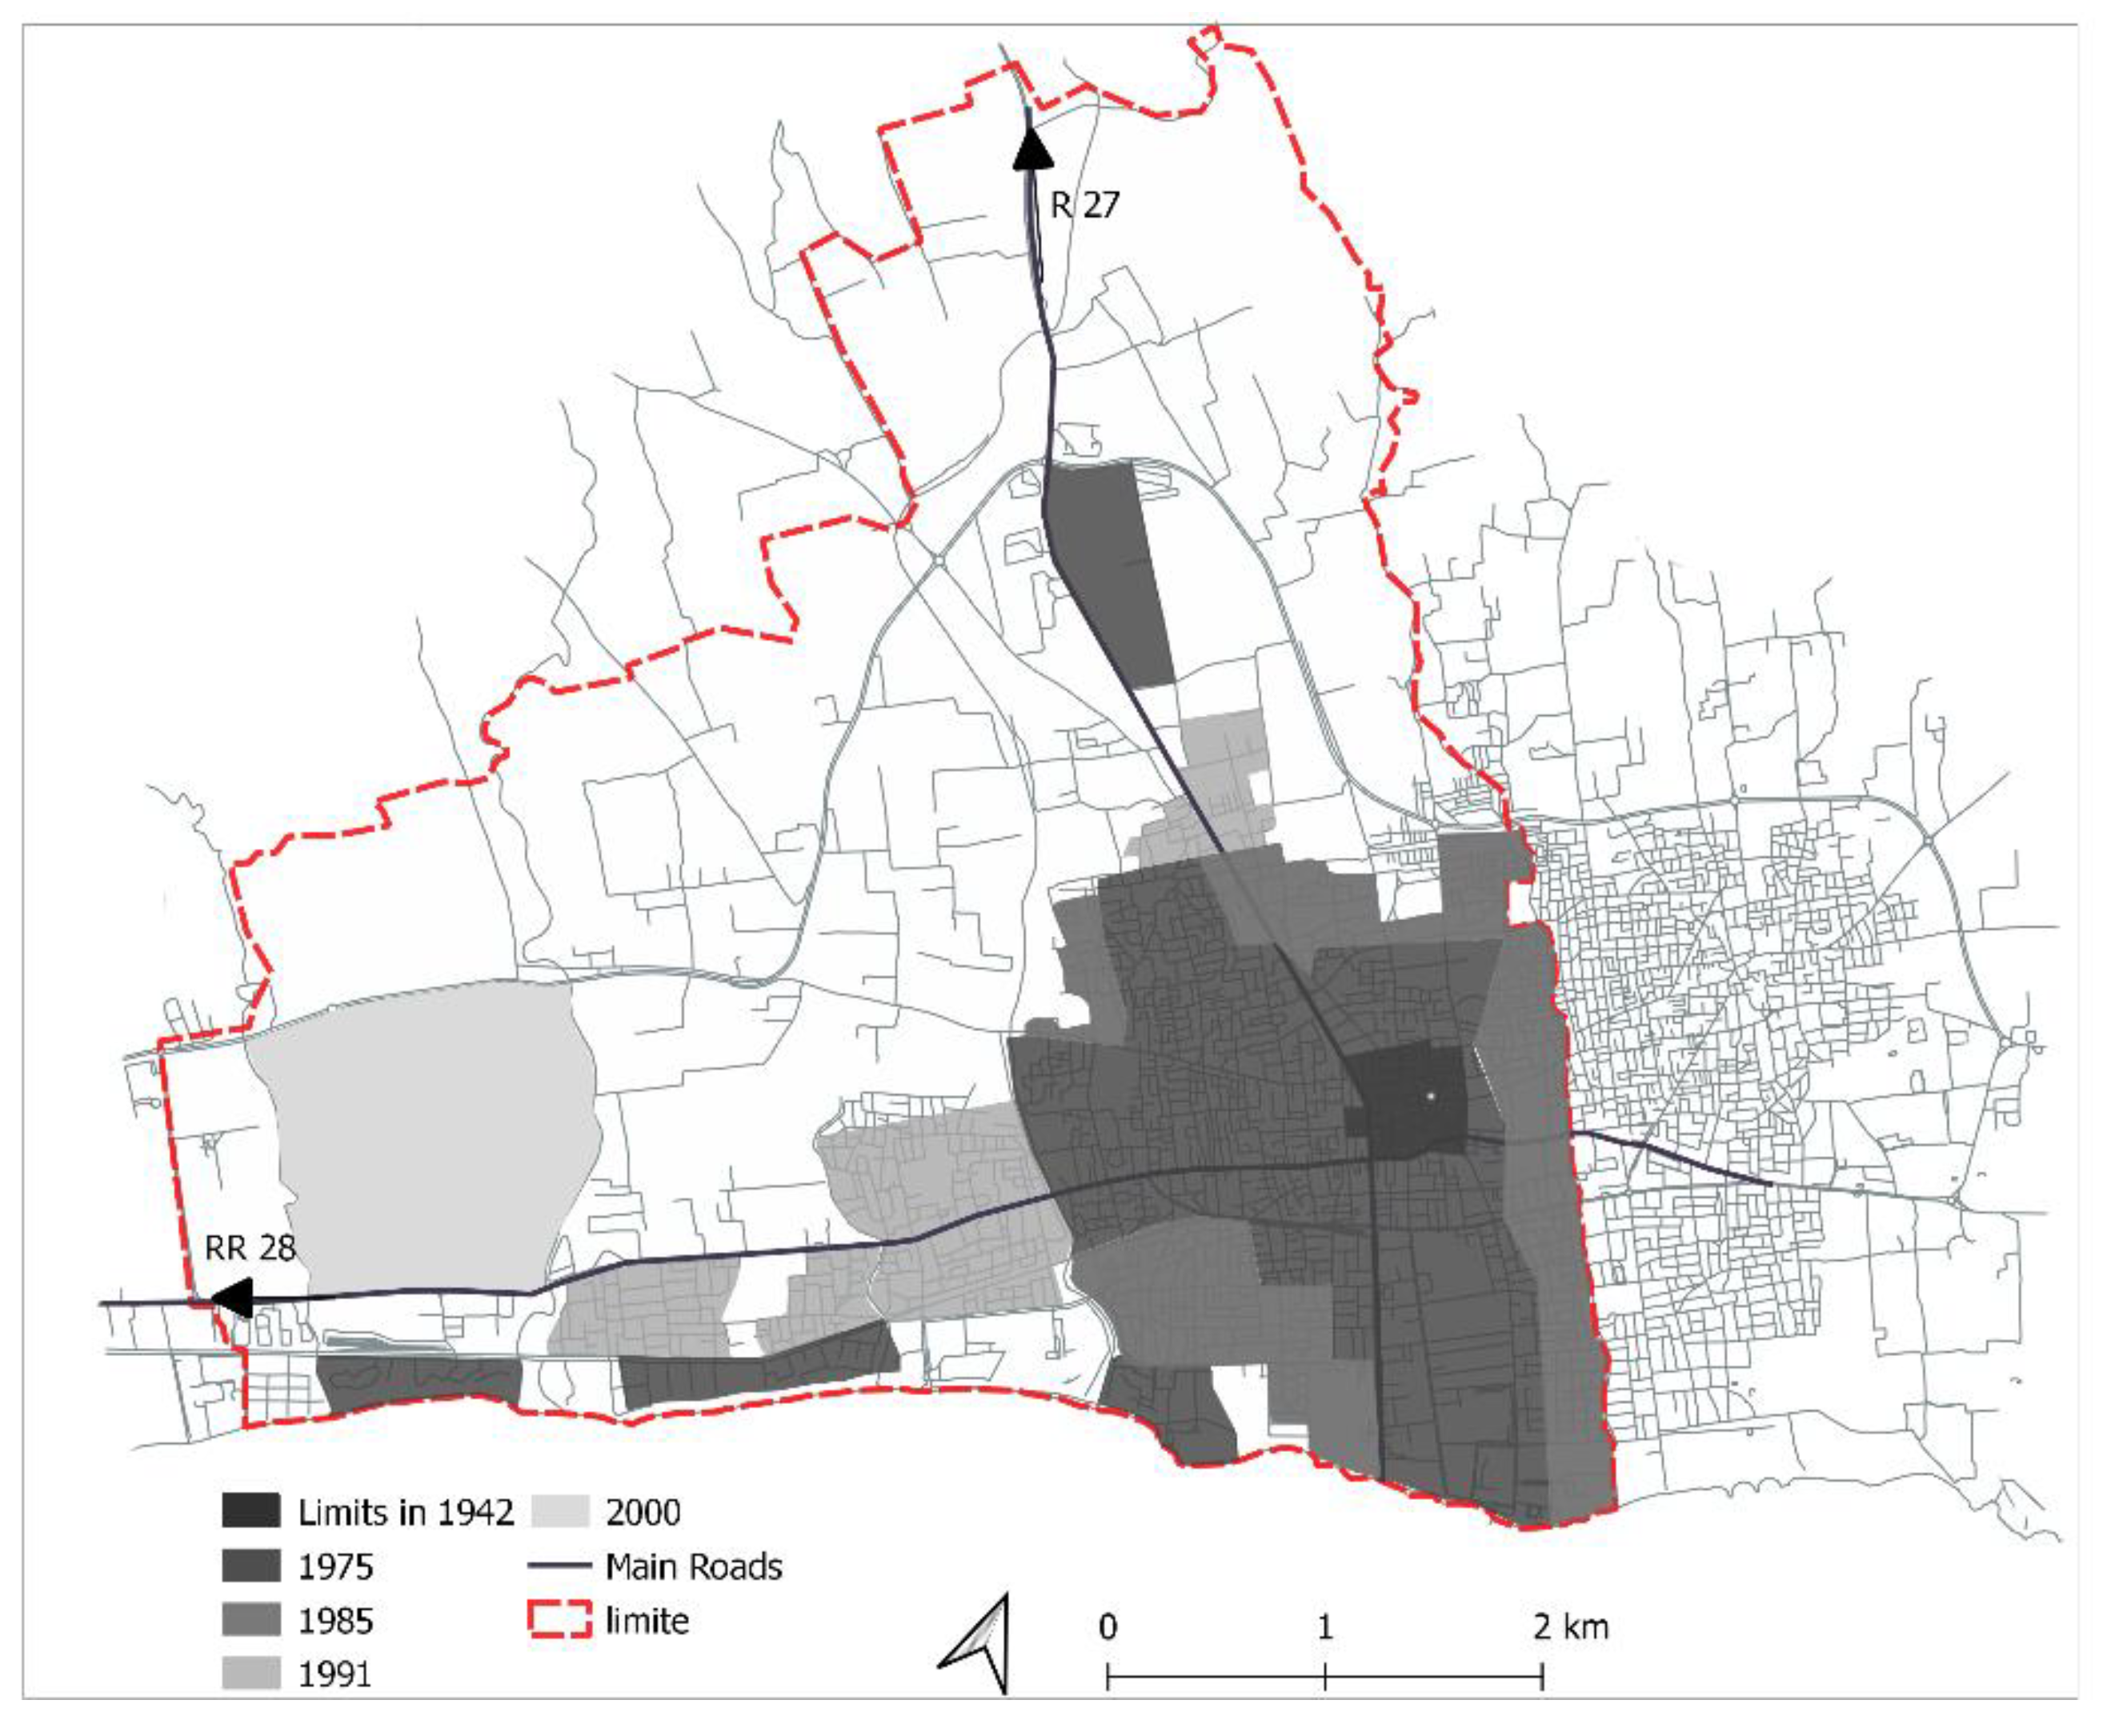
3.2. Urbanization Diffusion along West Axis
3.3. Accessibility and Integration
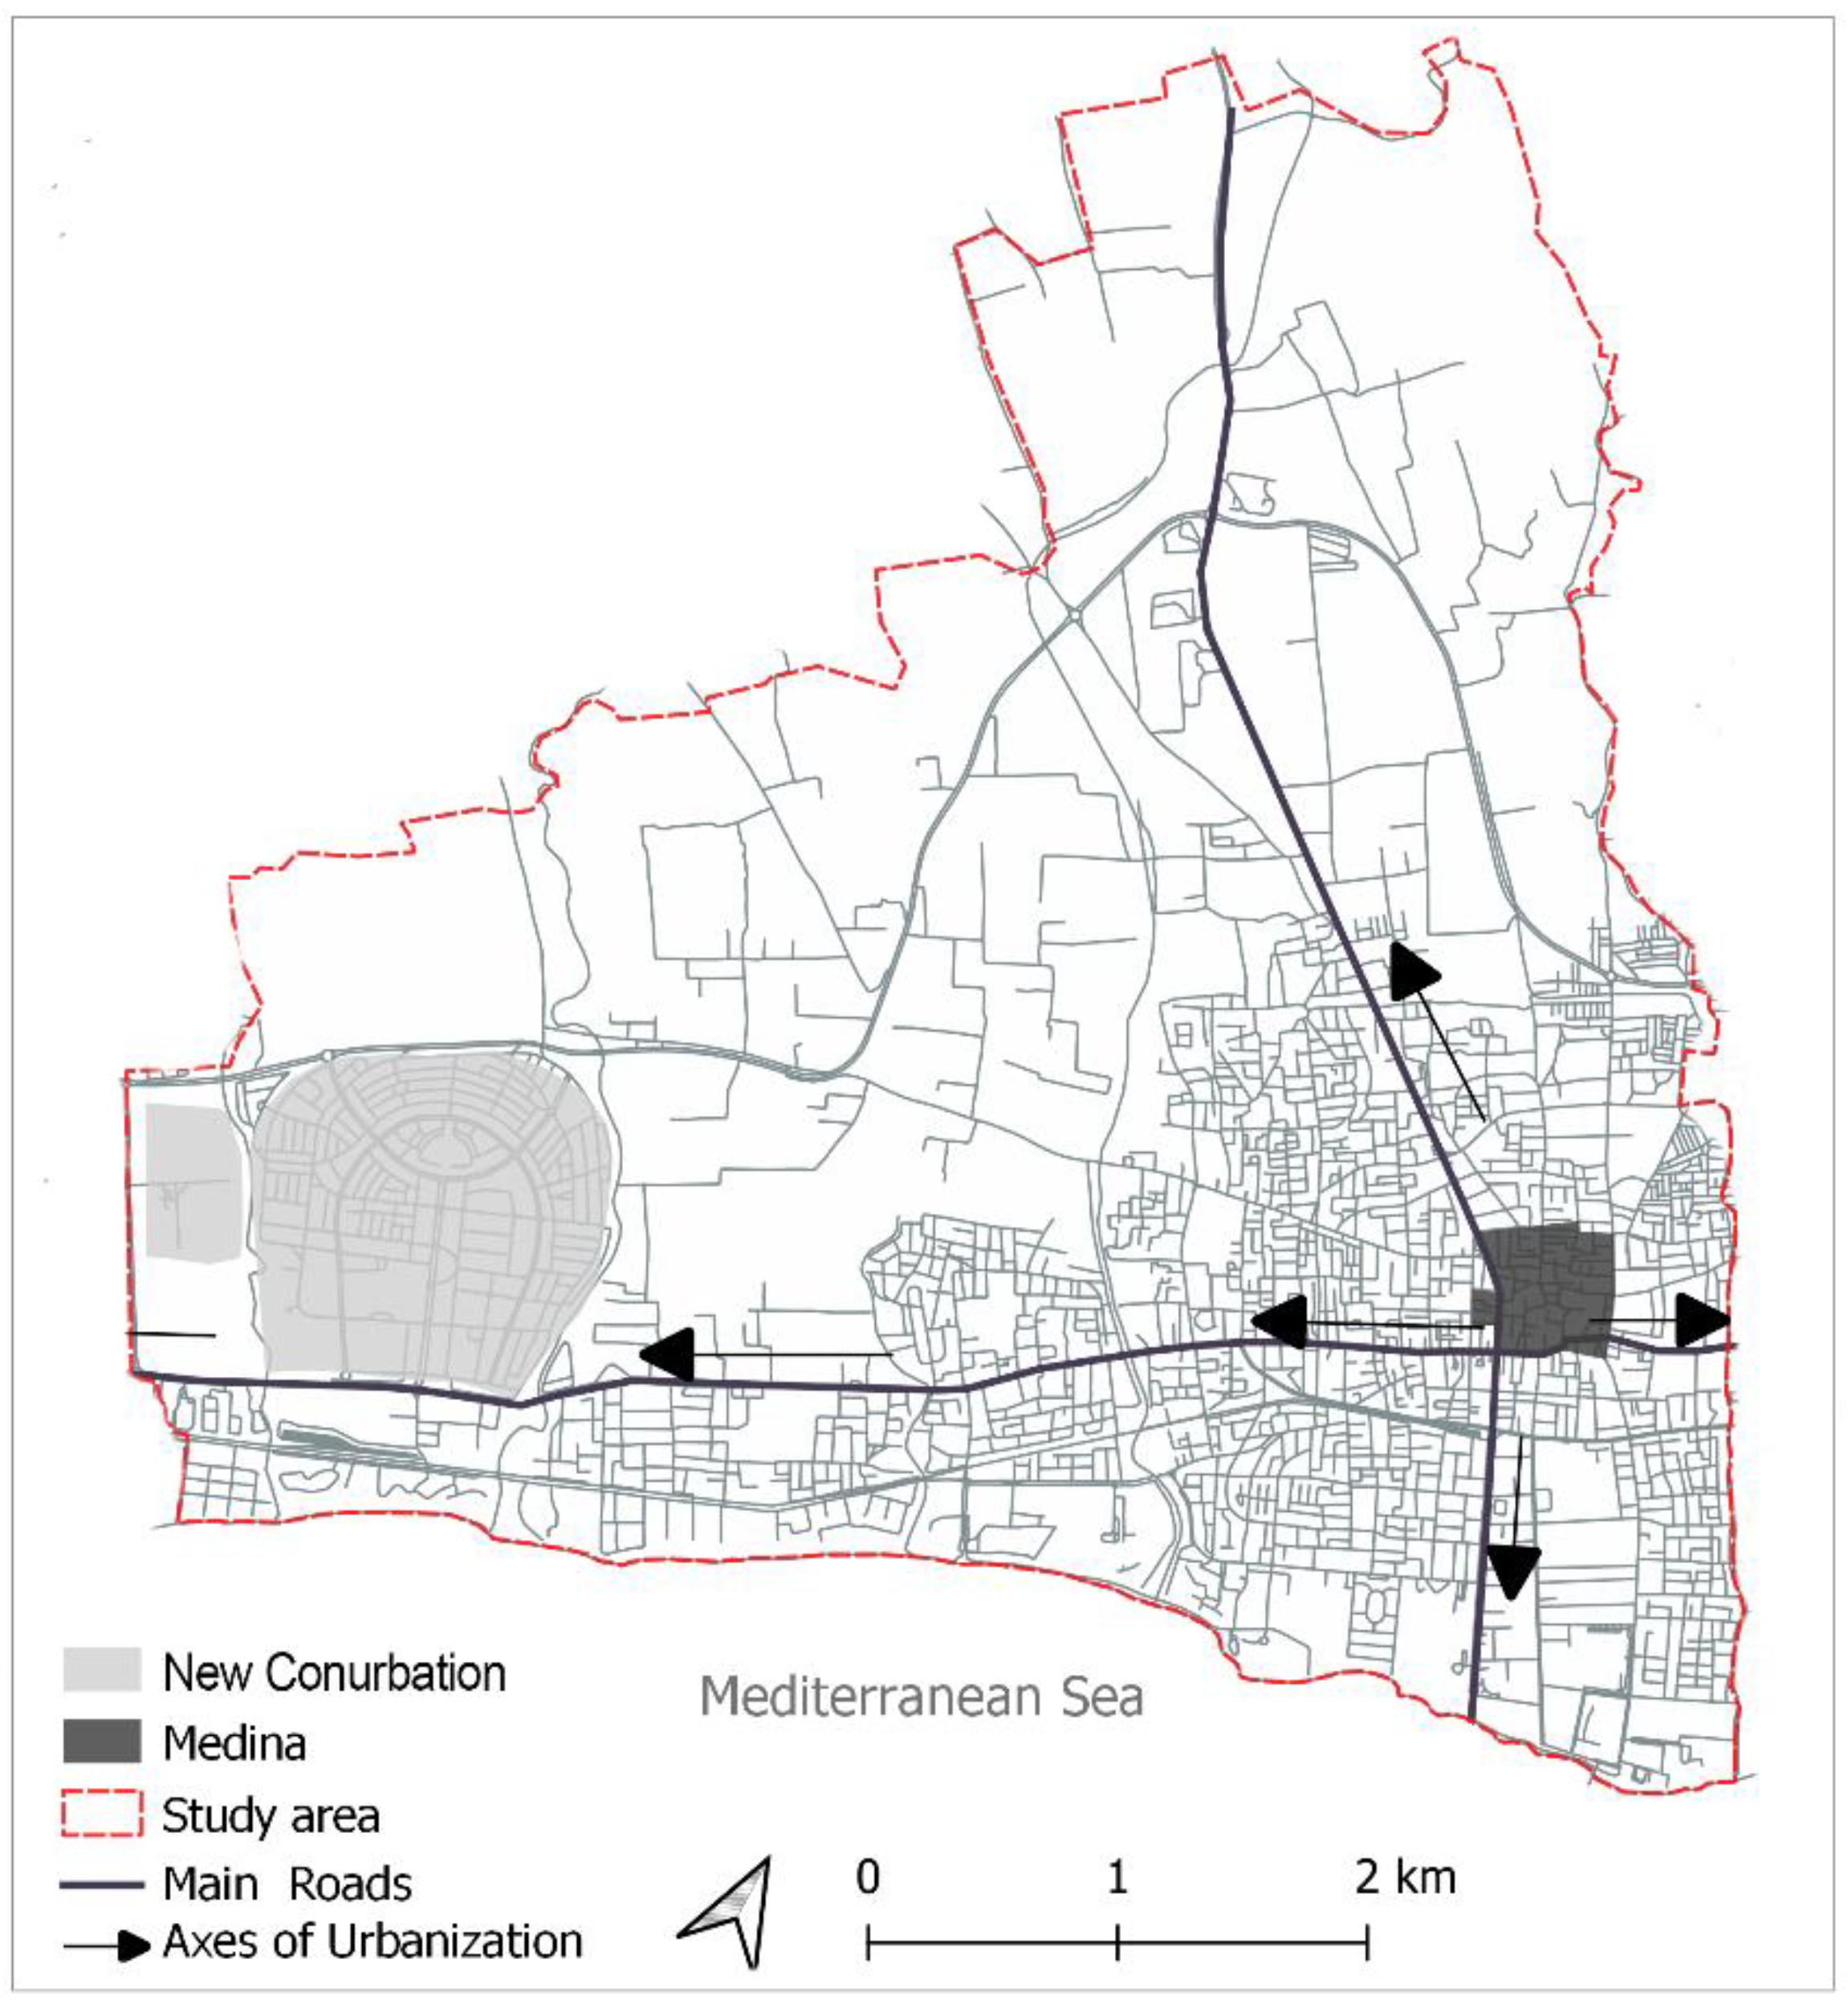
3.4. The Emergence of a Linear and Diffuse Spatial Configuration
3.5. Different Logics of Space Production
4. Discussion
5. Conclusions
Author Contributions
Funding
Institutional Review Board Statement
Informed Consent Statement
Data Availability Statement
Conflicts of Interest
References
- Rui, Y. Urban Growth Modeling Based on Land-Use Changes and Road Network Expansion; KTH Royal Institute of Technology: Stockholm, Sweden, 2013. [Google Scholar]
- United Nations. World Urbanization Prospects: The 2011 Revision United Nations (Population Division of the Department of Economic and Social Affairs); United Nations: New York, NY, USA, 2012. [Google Scholar]
- Pasquali, D.; Marucci, A. The Effects of Urban and Economic Development on Coastal Zone Management. Sustainability 2021, 13, 6071. [Google Scholar] [CrossRef]
- Liziard, S. Littoralization of the Latin Arc: Spatiotemporal Analysis of Population Distribution on a Fine Scale. Espace Populations Sociétés 2013, 21–40. [Google Scholar] [CrossRef]
- Virol, S.; Pouyanne, G.; Lyser, S.; Gaschet, F.; Dachary-Bernard, J. The Impact of Coastal Development on Land Markets: A Comparative Approach Basque Coast and Charente. Econ. Stat. 2011, 444, 127–154. [Google Scholar] [CrossRef] [Green Version]
- Urban Development Strategies in the Mediterranean: Context, Issues and Outlook, Conference, Barcelona. 2011. Available online: http://upfi-med.eib.org/wp-content/uploads/2016/08/urban-dev-strats.pdf (accessed on 18 March 2021).
- Gastly, B. Transformations of the Urban Landscape of Nabeul: New Practices and New Perceptions. Ph.D. Thesis, l’ISA-IRESA-Université de Sousse, Sousse, Tunisia, 2014; p. 273. [Google Scholar]
- Atik, M.; Atlan, T.; Artar, M. Land Use Changes in Relation to Coastal Tourism Developments in Turkish Mediterranean. Pol. J. Environ. Stud. 2010, 19, 21–33. [Google Scholar]
- Bal, W.; Czalczynska-Podolska, M. The Stages of the Cultural Landscape Transformation of Seaside Resorts in Poland against the Background of the Evolving Nature of Tourism. Land 2020, 9, 55. [Google Scholar] [CrossRef] [Green Version]
- Laborie, J.P.; Rejeb, H. Findings for Landscape Education in the Mediterranean. Notes d’Alerte du CIHEAM 2012, 88, 1–5. [Google Scholar]
- Carsjens, G.J.; van Lier, H.N. Fragmentation and Land-Use Planning—An Introduction. Landsc. Urban Plan. 2002, 58, 79–82. [Google Scholar] [CrossRef]
- Jimmy, E.N.; Martinez, J.; Verplanke, J. Spatial Patterns of Residential Fragmentation and Quality of Life in Nairobi City, Kenya. Appl. Res. Qual. Life 2020, 15, 1493–1517. [Google Scholar] [CrossRef] [Green Version]
- Teixeira, V.M.D.L. Urbanization around Araruama Lagoon, Rio de Janeiro State, Brazil: Spatial Dynamics and Environmental Concerns. Confins 2017, 33. [Google Scholar] [CrossRef]
- Audouit, C.; Robert, S.; Melin, H. Living on the Coast. Contemporary Challenges: 2016, Edition Espace et Développement, Presses Universitaires de Provence & Presses Universitaires d’Aix-Marseille, Aix-Marseille Université. Territ. En Mouv. Rev. Géographie Aménagement Territ. Mov. J. Geogr. Plan. 2018, 37, 471. [Google Scholar] [CrossRef]
- Voiron-Canicio, C. Urbanisation and Littoralisation in Mediterranean. In Les Méditerranées dans le Monde Artois; Presses Université: Arras, France, 1999; pp. 103–112. [Google Scholar]
- Yılmaz, M.; Terzi, F. Measuring the Patterns of Urban Spatial Growth of Coastal Cities in Developing Countries by Geospatial Metrics. Land Use Policy 2021, 107, 105487. [Google Scholar] [CrossRef]
- Audren, G. Geography of Urban Fragmentation and School Territories in Marseille. In Les Espaces de Construction Des Inégalités Educatives; Presses Universitaires de Rennes: Rennes, France, 2019; pp. 67–83. Available online: http://books.openedition.org/pur/150687 (accessed on 23 December 2021).
- Rejeb Bouzgarrou, A.; Claramunt, C.; Rejeb, H. Visualizing Urban Sprawl Effects of a Tunisian City: A New Urban Spatial Configuration of Monastir. Ann. GIS 2019, 25, 71–82. [Google Scholar] [CrossRef]
- Cheng, J.; Masser, I. Modelling Urban Growth Patterns: A Multiscale Perspective. Environ. Plan. A Econ. Space 2003, 35, 679–704. [Google Scholar] [CrossRef] [Green Version]
- Yamu, C.; van Nes, A. An Integrated Modeling Approach Combining Multifractal Urban Planning with a Space Syntax Perspective. Urban Sci. 2017, 1, 37. [Google Scholar] [CrossRef] [Green Version]
- Burgess, E.W. The Growth of the City: An Introduction to a Research Project. In The City Urban Ecology; Springer: Boston, MA, USA, 2008; pp. 71–78. [Google Scholar] [CrossRef]
- Adams, J.S.; Hoyt, H. 1939: The Structure and Growth of Residential Neighborhoods in American Cities. Washington, DC: Federal Housing Administration. Prog. Hum. Geogr. 2005, 29, 321–325. [Google Scholar] [CrossRef]
- Harris, C.D.; Ullman, E.L. The Nature of Cities. Ann. Am. Acad. Political Soc. Sci. 1945, 242, 7–17. [Google Scholar] [CrossRef]
- Getis, A.; Getis, J. Christaller’s Central Place Theory. J. Geogr. 1966, 65, 220–226. [Google Scholar] [CrossRef]
- Mozaffaree Pour, N.; Oja, T. Urban Expansion Simulated by Integrated Cellular Automata and Agent-Based Models; an Example of Tallinn, Estonia. Urban Sci. 2021, 5, 85. [Google Scholar] [CrossRef]
- Portugali, J. Self-Organization and the City; Springer: Berlin/Heidelberg, Germany, 2000. [Google Scholar] [CrossRef]
- Hillier, B.; Hanson, J. The Social Logic of Space, 1st ed.; Cambridge University Press: Cambridge, UK, 1984. [Google Scholar] [CrossRef]
- Narvaez, L.; Penn, A.; Griffiths, S. The spatial Dimensions of Trade: From the Geography of Uses to the Architecture of Local Economies. ITU J. Fac. Archit. 2014, 11, 209–230. [Google Scholar]
- Liu, P.; Xiao, X.; Zhang, J.; Wu, R.; Zhang, H. Spatial Configuration and Online Attention: A Space Syntax Perspective. Sustainability 2018, 10, 221. [Google Scholar] [CrossRef] [Green Version]
- van Nes, A.; Yamu, C. Introduction to Space Syntax in Urban Studies; Springer International Publishing: Cham, Switzerland, 2021. [Google Scholar] [CrossRef]
- Dalton, R.C. The Secret Is To Follow Your Nose: Route Path Selection and Angularity. Environ. Behav. 2003, 35, 107–131. [Google Scholar] [CrossRef] [Green Version]
- Dhanani, A.; Tarkhanyan, L.; Vaughan, L. Estimating Pedestrian Demand for Active Transport Evaluation and Planning. Transp. Res. Part Policy Pract. 2017, 103, 54–69. [Google Scholar] [CrossRef] [Green Version]
- Domingo, M.; Thibaud, R.; Claramunt, C. A Graph-Based Approach for the Structural Analysis of Road and Building Layouts. Geo. Spat. Inf. Sci. 2019, 22, 59–72. [Google Scholar] [CrossRef] [Green Version]
- Esposito, D.; Santoro, S.; Camarda, D. Agent-Based Analysis of Urban Spaces Using Space Syntax and Spatial Cognition Approaches: A Case Study in Bari, Italy. Sustainability 2020, 12, 4625. [Google Scholar] [CrossRef]
- Marcus, L.; Giusti, M.; Barthel, S. Cognitive Affordances in Sustainable Urbanism: Contributions of Space Syntax and Spatial Cognition. J. Urban Des. 2016, 21, 439–452. [Google Scholar] [CrossRef]
- Ye, Y.; Yeh, A.; Zhuang, Y.; van Nes, A.; Liu, J. “Form Syntax” as a Contribution to Geodesign: A Morphological Tool for Urbanity-Making in Urban Design. URBAN Des. Int. 2017, 22, 73–90. [Google Scholar] [CrossRef]
- Auvray, E.; Bouayad-Agha, S. Geographic concentration indices when the data are aggregated. Économie Prévision 2019, 216, 1–20. [Google Scholar] [CrossRef]
- Laouar, D.; Mazouz, S.; Teller, J. Spatial accessibility and urban fragmentation in colonial cities. The case of Annaba city. Cybergeo 2019. [Google Scholar] [CrossRef]
- Saeid, S.; Lahmar, K.; Rejeb, H. Think the Coastalization of Cap Bon (North-East Tunisia): Anthropic pressure and preservation of ecosystems. Revue Européenne du Droit Social Editura Bibliotheca 2021, LI, 75–97. [Google Scholar]
- Saad, T. Typology of Urban Space in a Developing Country: The Case of Nabeul (Tunisia). Espace Géographique 1982, 11, 134–142. [Google Scholar] [CrossRef]
- Sethom, H. Agriculture Intensive et Urbanisation Accélérée sur le Littoral Oriental du Cap Bon. Revue Tunisienne de Géographie 1980, 6, 153–165. [Google Scholar]
- Annual Report. Volume 1. Available online: http://www.ins.tn/publication/recensement-general-de-la-population-et-de-lhabitat-2014-volume-1 (accessed on 25 September 2019).
- Belhedi, A. Differentiation and Recomposition of Urban Space in Tunisia. Cah. GREMAMO 2005, 18, 21–46. [Google Scholar]
- Hellal, M. Evolution of the Tunisian Tourism System. Prospects of its Governance in a Context of Crisis. Études Caribéennes. 2020, 6. Available online: http://journals.openedition.org/etudescaribeennes/19397 (accessed on 21 April 2020). [CrossRef]
- Dhaher, N. Tunisian Spatial Planning: 50 Years of Policies in the Test of Globalization. EchoGéo. 2010, 13. Available online: http://journals.openedition.org/echogeo/12055 (accessed on 13 April 2020). [CrossRef] [Green Version]
- Panzera, D.; Cartone, A.; Postiglione, P. New Evidence on Measuring the Geographical Concentration of Economic Activities. Pap. Reg. Sci. 2022, 101, 59–79. [Google Scholar] [CrossRef]
- Bickenbach, F.; Bode, E. Disproportionality Measures of Concentration, Specialization, and Localization. Int. Reg. Sci. Rev. 2008, 31, 359–388. [Google Scholar] [CrossRef] [Green Version]
- Decoville, A. Urban Centrality in Luxembourg: Analysis and Perspectives. Report of the Space Development Observatory GEODE Research Unit, CEPS/INSTEAD. 2012. Available online: https://www.researchgate.net/publication/281819762_La_centralite_urbaine_au_Luxembourg_analyse_et_perspectives?channel=doi&linkId=55f9730408aeafc8ac24f808&showFulltext=true (accessed on 13 April 2020).
- Sanders, L. Models in Spatial Analysis: Introduction. Géographique et Aménagement du Territoire. 2001, pp. 17–29. Available online: https://halshs.archives-ouvertes.fr/halshs-00150146 (accessed on 2 April 2022).
- Navereau, B. Proximity Store in the Urban Center of Metropolitan Areas: The Example of Toulouse and Zaragoza. Ph.D. Thesis, Géography. University Toulouse le Mirail, Toulouse, France, 2011; p. 561. [Google Scholar]
- Benjedidi, S.; Bada, Y.; Meziani, R. Open Spaces: Spatial Configuration, Visibility Analysis and Use: Case Study of Mass Housing in Biskra, Algeria. Int. Rev. Spat. Plan. Sustain. Dev. 2019, 6, 93–109. [Google Scholar] [CrossRef] [Green Version]
- Jiang, B.; Claramunt, C.; Klarqvist, B. Integration of Space Syntax into GIS for Modelling Urban Spaces. Int. J. Appl. Earth Obs. Geoinf. 2000, 2, 161–171. [Google Scholar] [CrossRef]
- Hillier, B.; Burdett, R.; Peponis, J.; Penn, A. Creating Life: Or, Does Architecture Determine Anything? Archit. Comport./Archit. Behav. 1986, 3, 233–250. [Google Scholar]
- Klarqvist, B. A Space Syntax Glossary. Nord. J. Archit. Res. (NJAR) 1993, 2, 11–12. [Google Scholar]
- Dettlaff, W. Space Syntax Analysis—Methodology of Understanding the Space. PhD Interdiscip. J. 2014, 1, pp. 283–291. Available online: http://sdpg.pg.gda.pl/pij/wp-content/blogs.dir/133/files/2014/12/01_2014_30-dettlaff.pdf (accessed on 6 January 2022).
- Hillier, B.; Penn, A.; Hanson, J.; Grajewski, T.; Xu, J. Natural Movement: Or, Configuration and Attraction in Urban Pedestrian Movement. Environ. Plan. B Plan. Des. 1993, 20, 29–66. [Google Scholar] [CrossRef] [Green Version]
- Karimi, K. A Configurational Approach to Analytical Urban Design: “Space Syntax” Methodology. URBAN DESIGN Int. 2012, 17, 297–318. [Google Scholar] [CrossRef]
- Ye, Y.; Van Nes, A. Making Spatial Diagnosis in Combining Space Syntax, Spacematrix and MXI with GIS of new and old towns. In Proceedings of the EAAE/ISUF International Conference, Delft, The Netherlands, 10–13 October 2012. [Google Scholar]
- Atakara, C.; Allahmoradi, M. Investigating the Urban Spatial Growth by Using Space Syntax and GIS—A Case Study of Famagusta City. ISPRS Int. J. Geo-Inf. 2021, 10, 638. [Google Scholar] [CrossRef]
- Shpuza, E. Allometry in the Syntax of Street Networks: Evolution of Adriatic and Ionian Coastal Cities 1800–2010. Environ. Plan. B: Plan. Des. 2014, 41, 450–471. [Google Scholar] [CrossRef]
- Batty, M.; Xie, Y.; Sun, Z. Modeling Urban Dynamics through GIS-Based Cellular Automata. Computers. Environ. Urban Syst. 1999, 23, 205–233. [Google Scholar] [CrossRef] [Green Version]
- Barragán, J.M.; de Andrés, M. Analysis and Trends of the World’s Coastal Cities and Agglomerations. Ocean. Coast. Manag. 2015, 114, 11–20. [Google Scholar] [CrossRef]


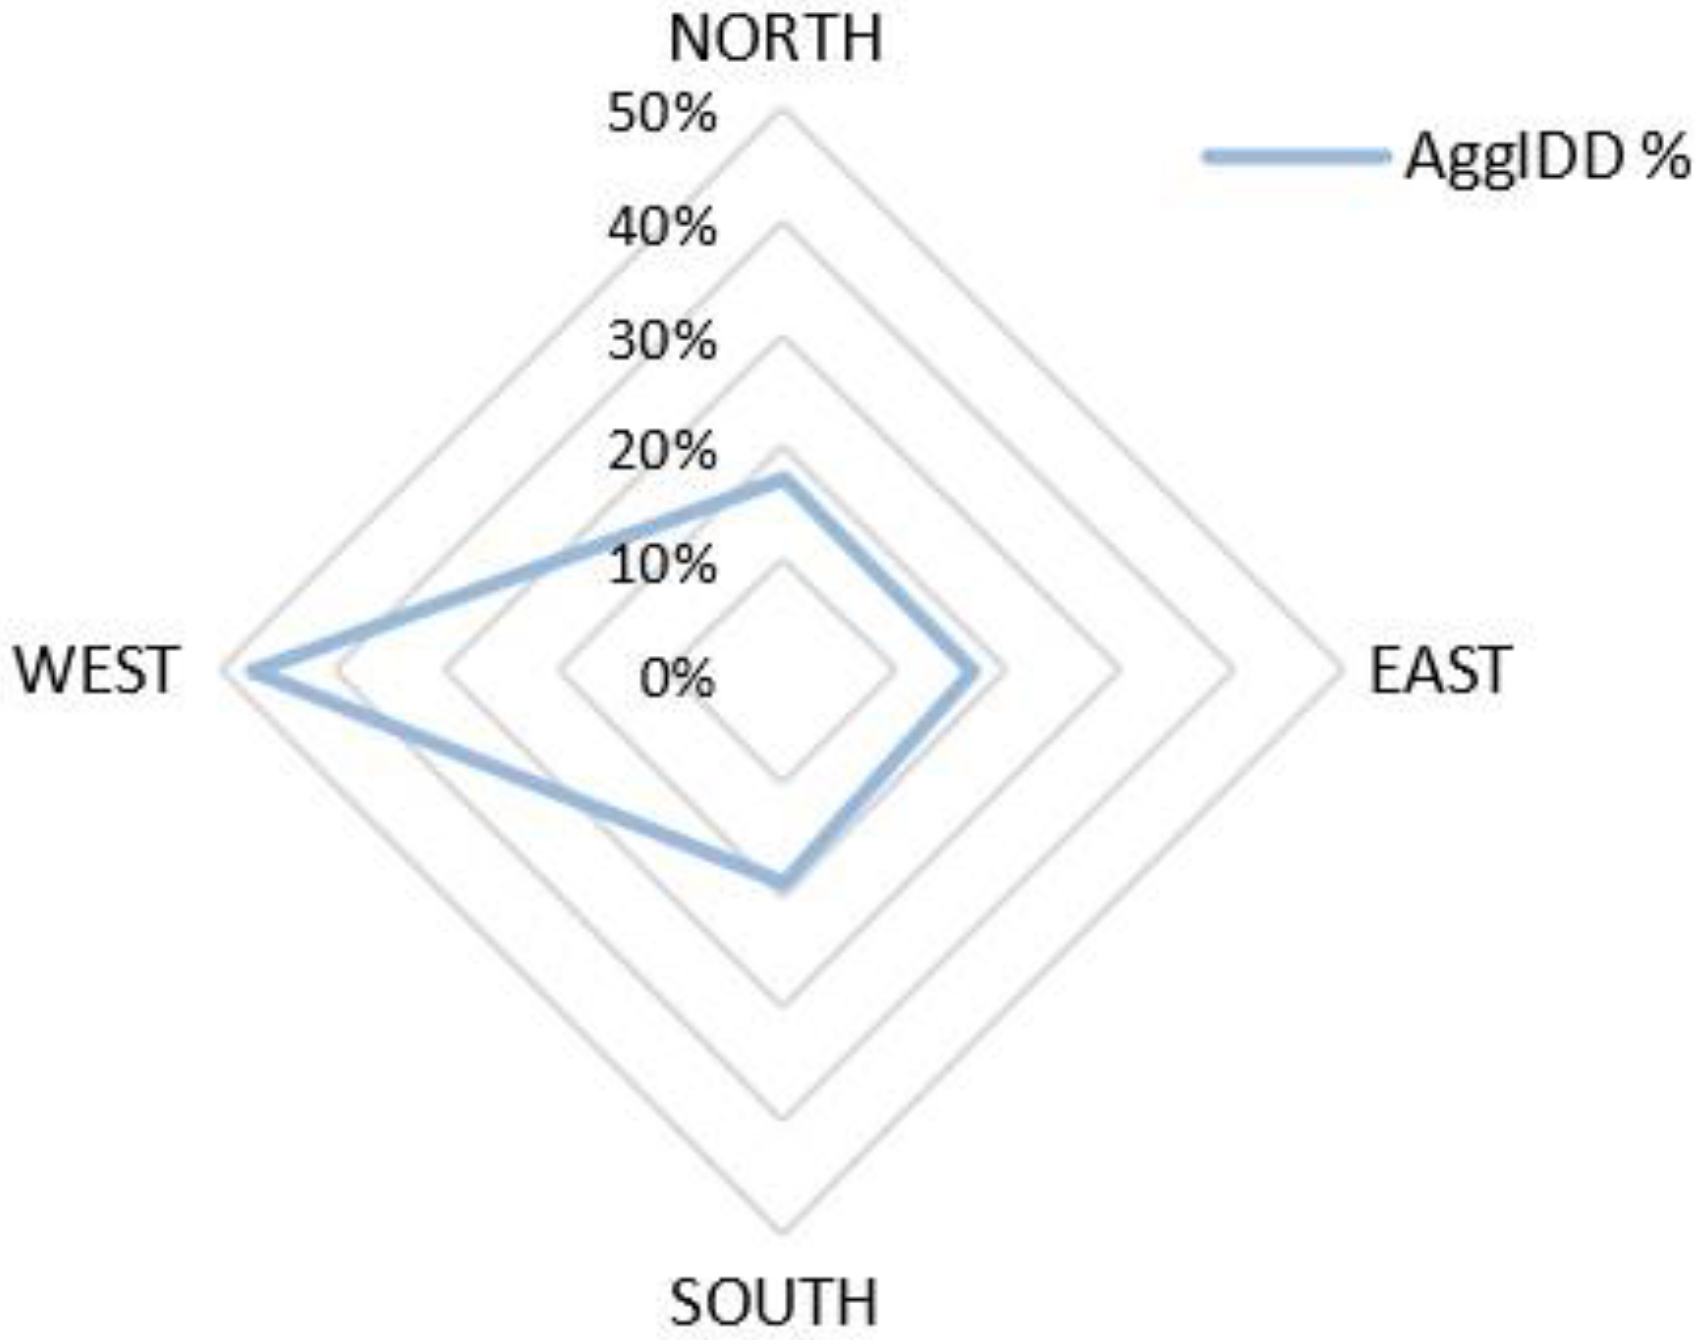
| IDD | AggIDD% | |
|---|---|---|
| North Axis | 8.27 | 17% |
| South Axis | 9.21 | 19% |
| East Axis | 8.46 | 17% |
| West Axis | 22.70 | 47% |
| IDD < 400 | AggIDD% | IDD > 400 | AggIDD% | |
|---|---|---|---|---|
| North Axis | 5.49 | 26% | 8.59 | 23% |
| South Axis | 5.24 | 24% | 5.20 | 14% |
| East Axis | 5.03 | 25% | 1.22 | 3% |
| West Axis | 5.60 | 26% | 22.2 | 60% |
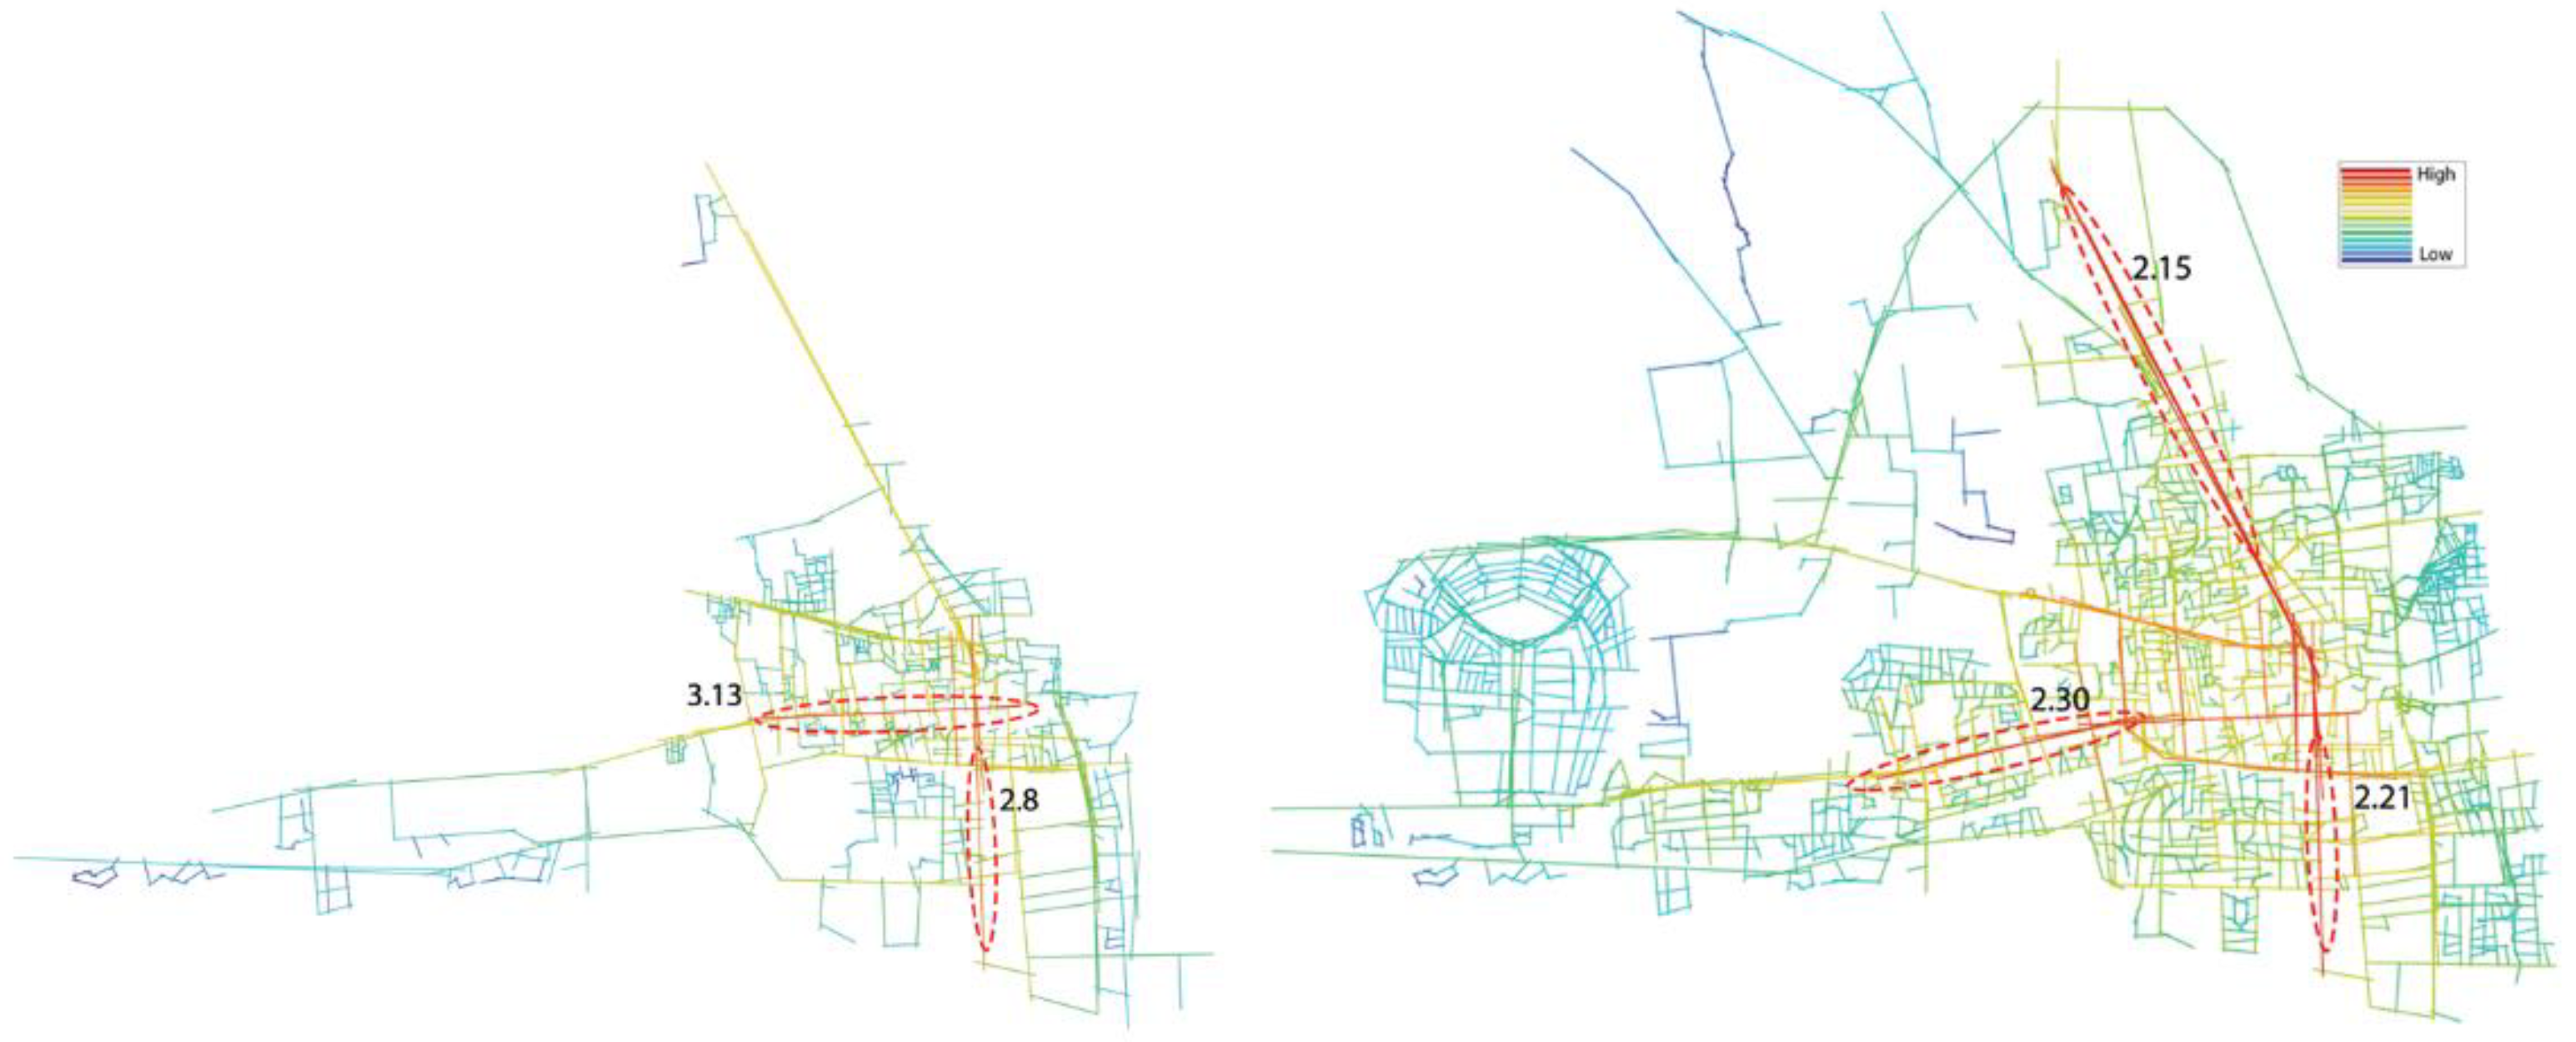
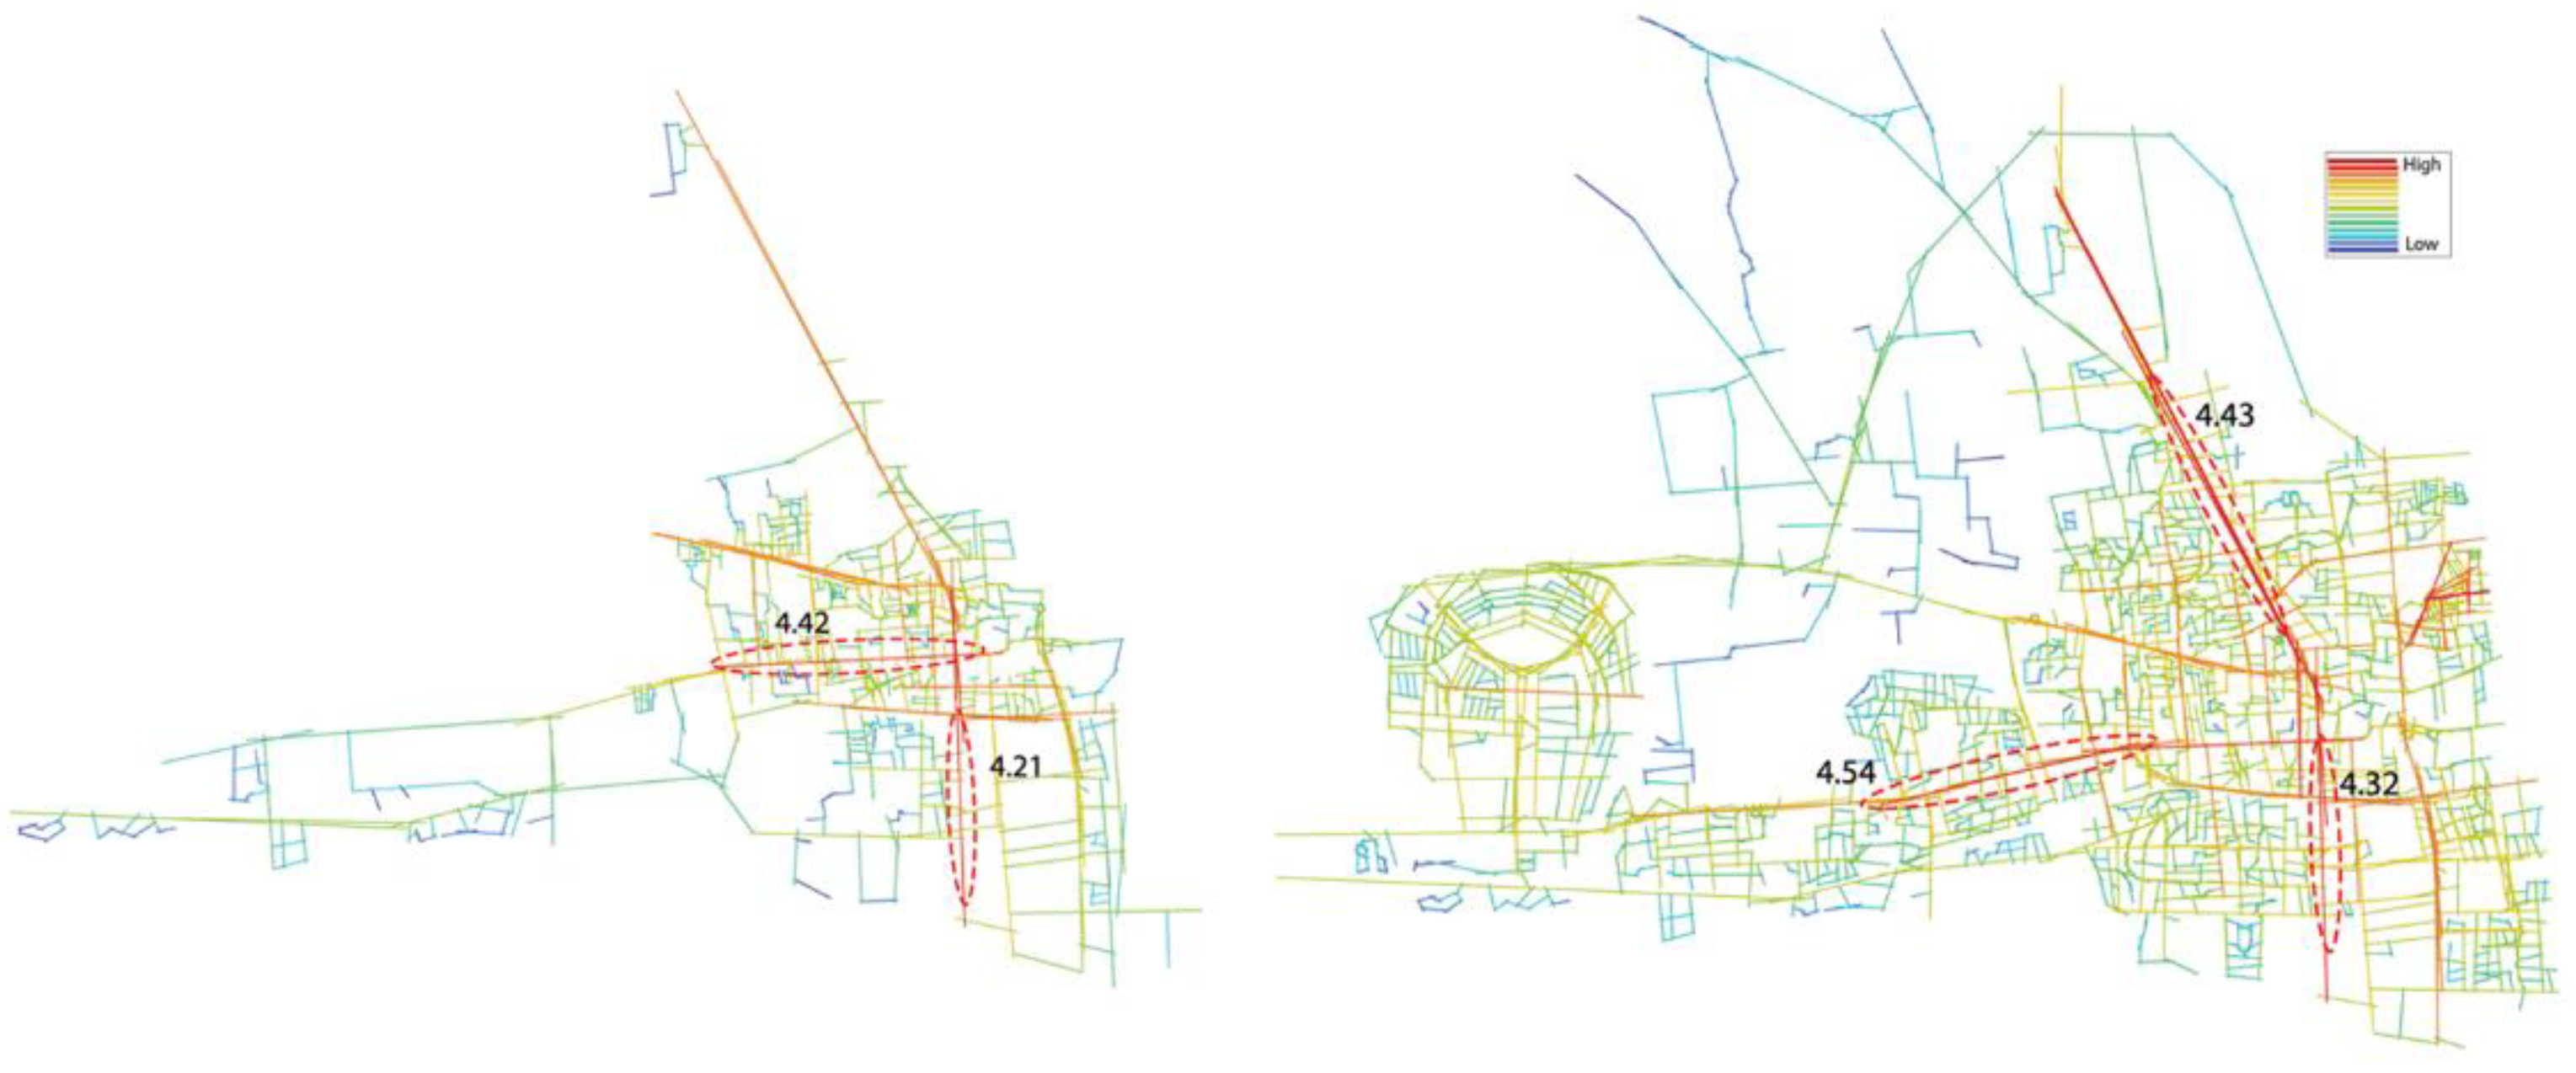
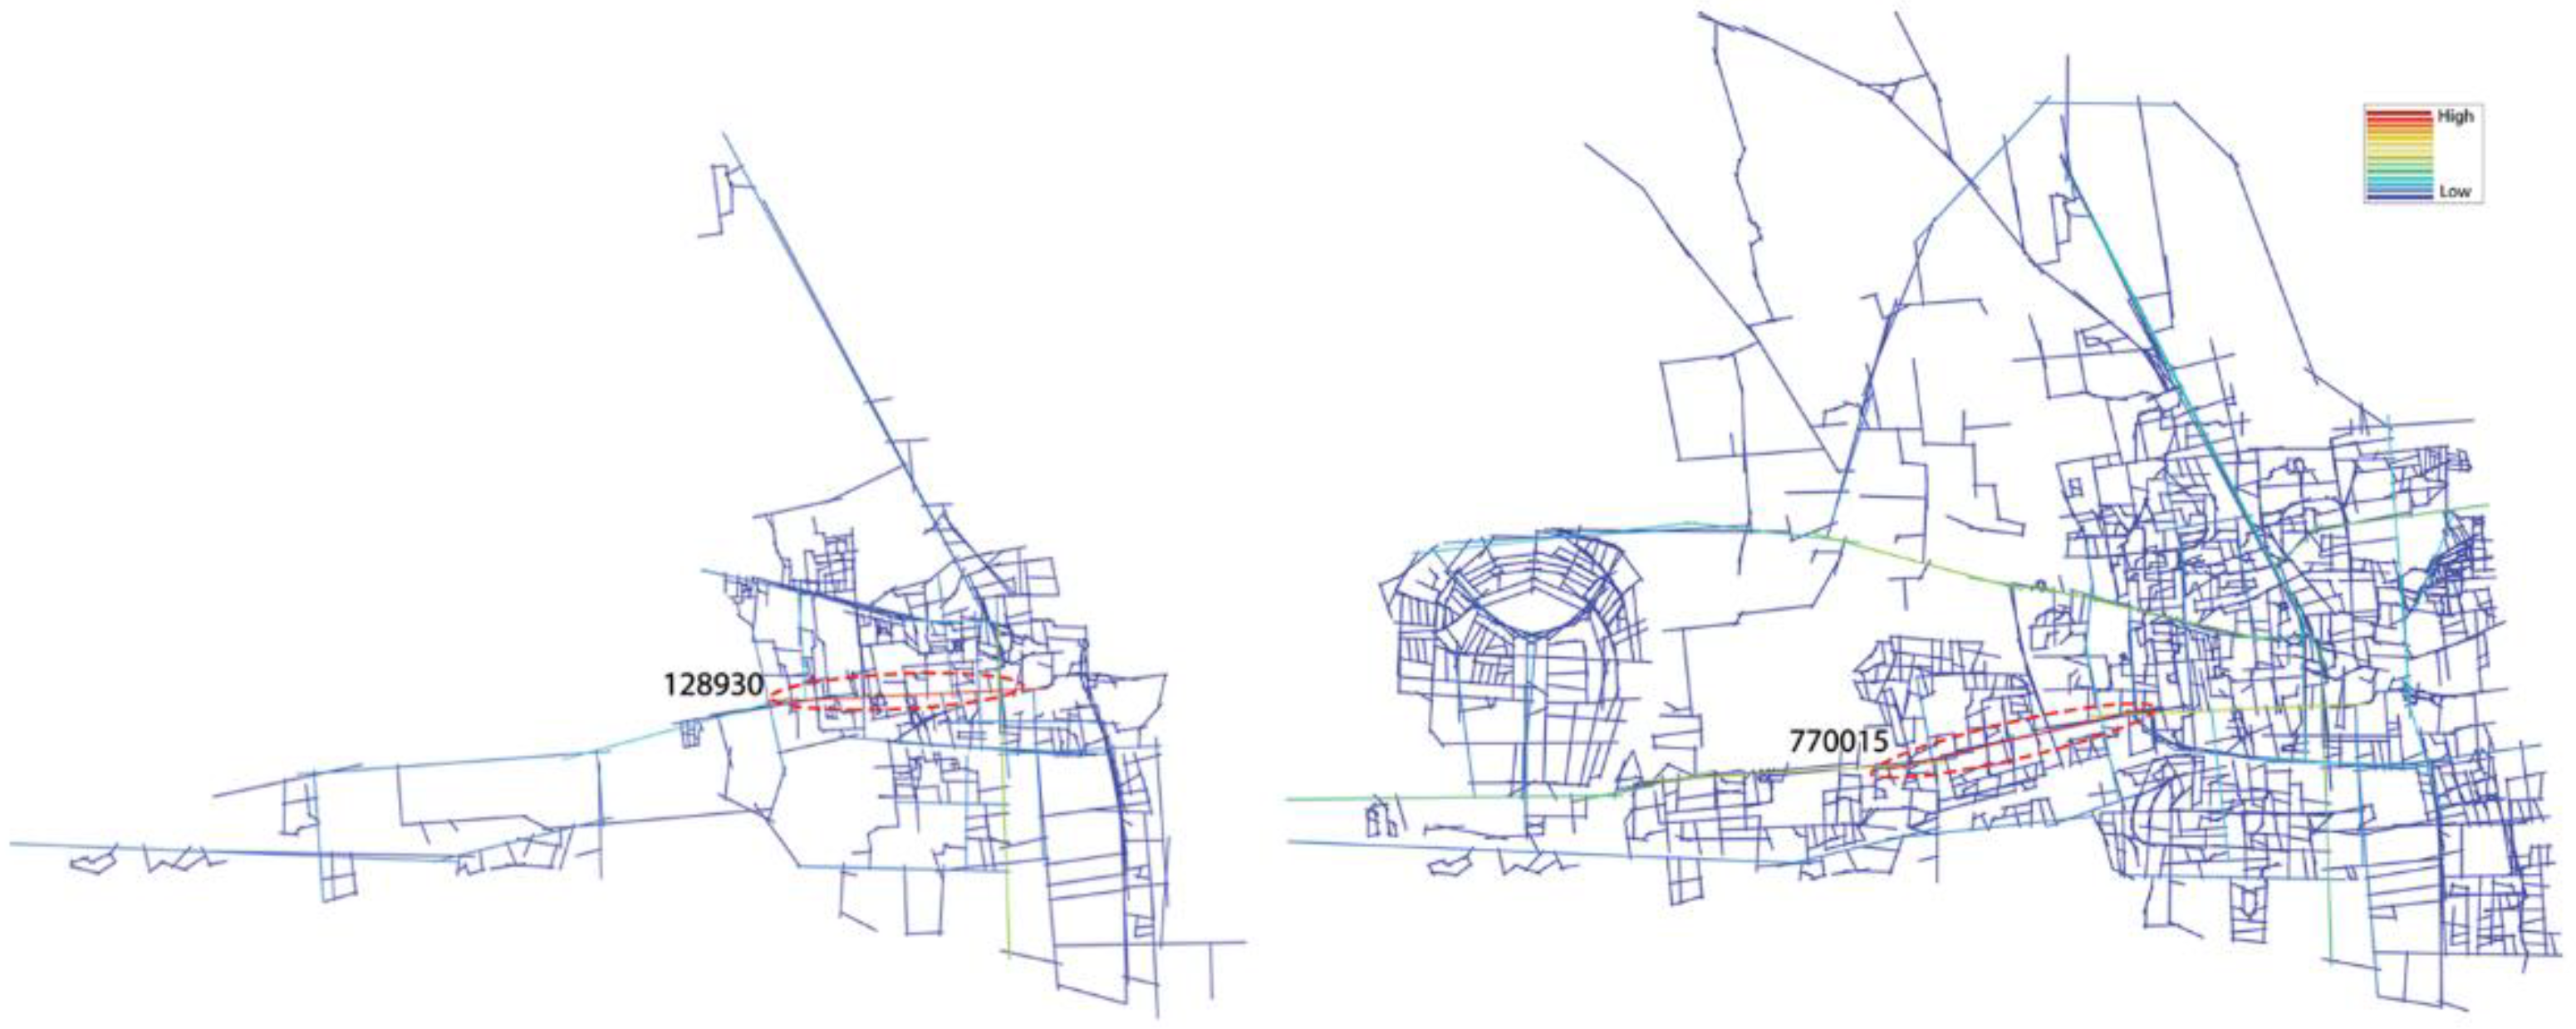
| Integration Rn | Integration R3 | Choice HH | |
|---|---|---|---|
| North Axis | 2.148 | 4.436 | 54,400 |
| South Axis | 2.216 | 4.326 | 86,540 |
| East Axis | 1.950 | 4.294 | 37,140 |
| West Axis | 2.193/2.308 | 4.326/4.544 | 37,140/770,015 |
Publisher’s Note: MDPI stays neutral with regard to jurisdictional claims in published maps and institutional affiliations. |
© 2022 by the authors. Licensee MDPI, Basel, Switzerland. This article is an open access article distributed under the terms and conditions of the Creative Commons Attribution (CC BY) license (https://creativecommons.org/licenses/by/4.0/).
Share and Cite
Bakhtyari, N.; Rejeb Bouzgarrou, A.; Claramunt, C.; Rejeb, H. A Dispersion Index for the Analysis of the Distribution of Activities in the Tunisian Coastal City of Nabeul. Geomatics 2022, 2, 161-180. https://doi.org/10.3390/geomatics2020010
Bakhtyari N, Rejeb Bouzgarrou A, Claramunt C, Rejeb H. A Dispersion Index for the Analysis of the Distribution of Activities in the Tunisian Coastal City of Nabeul. Geomatics. 2022; 2(2):161-180. https://doi.org/10.3390/geomatics2020010
Chicago/Turabian StyleBakhtyari, Narjiss, Asma Rejeb Bouzgarrou, Christophe Claramunt, and Hichem Rejeb. 2022. "A Dispersion Index for the Analysis of the Distribution of Activities in the Tunisian Coastal City of Nabeul" Geomatics 2, no. 2: 161-180. https://doi.org/10.3390/geomatics2020010