
Validating Hourly Satellite Based and Reanalysis Based Global Horizontal Irradiance Datasets over South Africa


Abstract
:1. Introduction
2. Literature Review
3. Materials and Methods
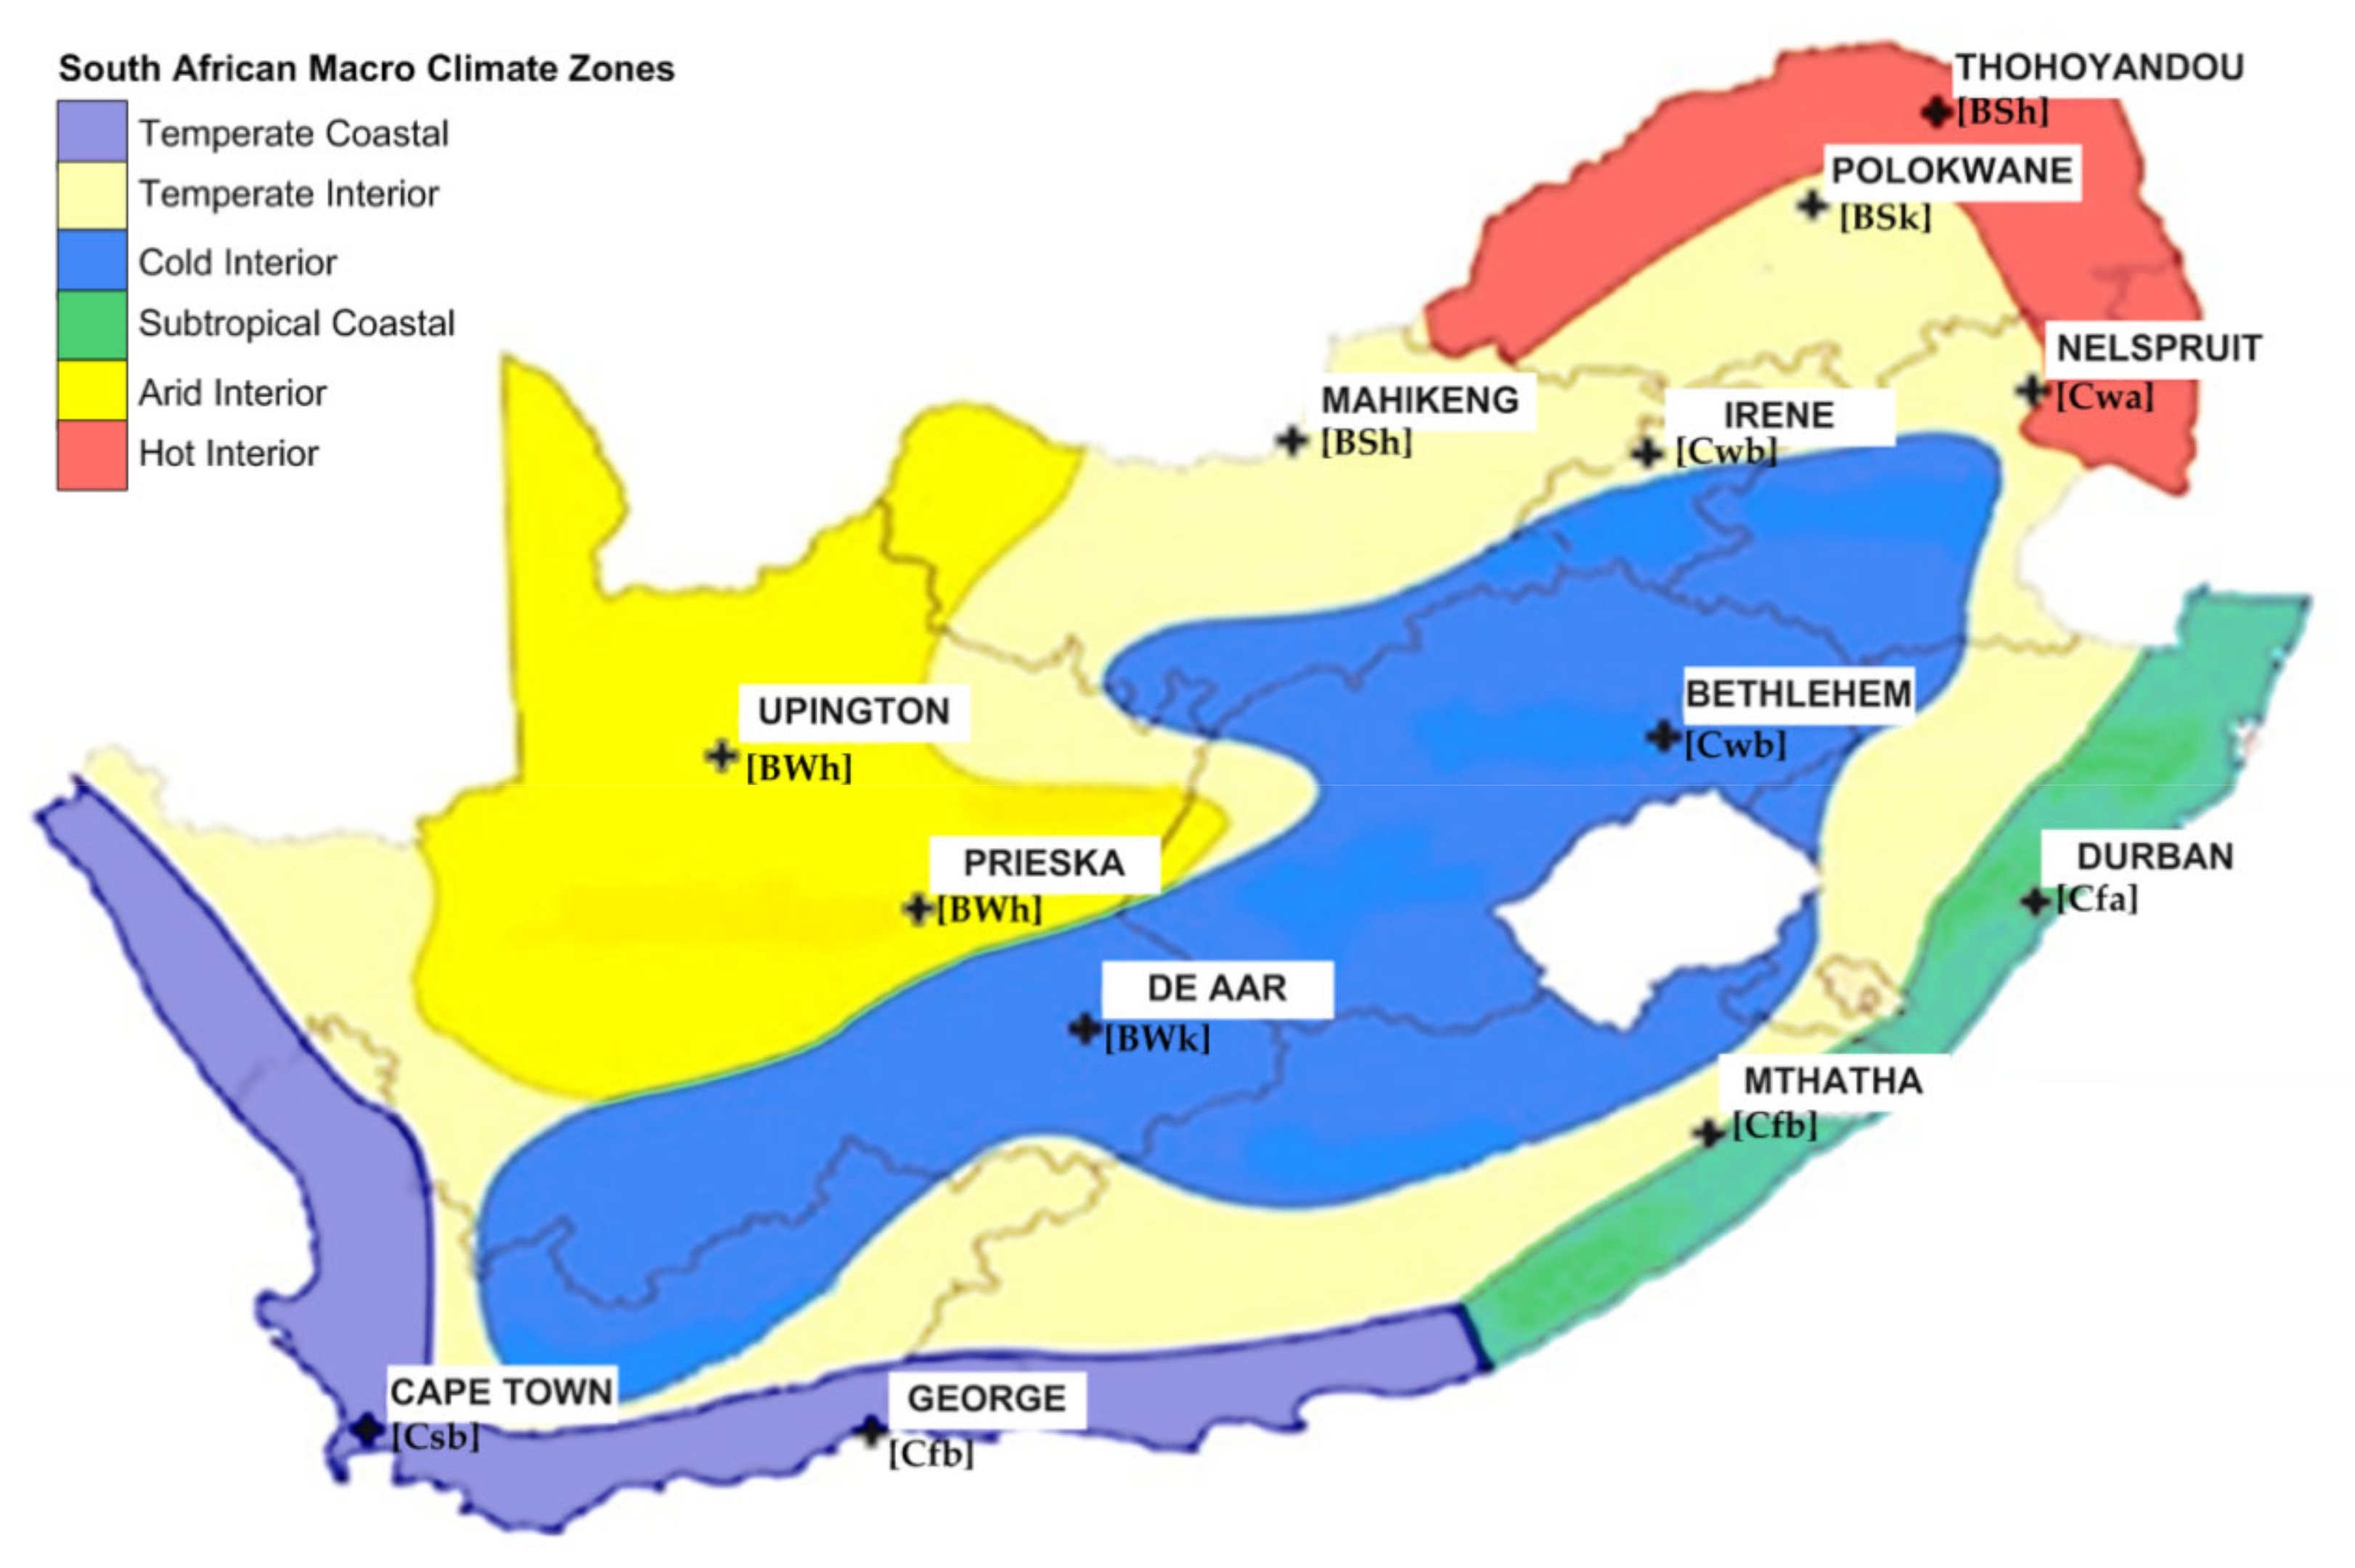
3.1. Observation or Reference GHI Data
3.2. Reanalysis Data
3.3. Satellite-Based Datasets

| Data | Data Derived from | Time Period | Spatial Resolution | Temporal Resolution | Data Availability | Region Available |
|---|---|---|---|---|---|---|
| SOLCAST [40] | satellite | 2007 to present | 1–2 km | 1 h | Not free | Almost Global (except Polar regions and oceans) |
| CMSAF SARAH [37] | satellite | 1983 to present | 0.05° × 0.05° (5 km) | ½ h, 1 day | Free | Europe, Africa, and a small part of South America |
| CAMS [39] | satellite | 2004 to (current day—2 days) | * Interpolated to a point of interest | 1 min, 15 min, 1 h, 1 day, 1 month | Free | Europe, Africa, Middle East, Eastern part of South America and Atlantic Ocean |
| ERA5 [35] | reanalysis | 1979 to present | 0.25° × 0.25° (31 km) | 1 h | Free | Global |
| MERRA2 [36] | reanalysis | 1980 to (present—2 months) | 0.625° × 0.5° (50 km) | 1 h | Free | Global |
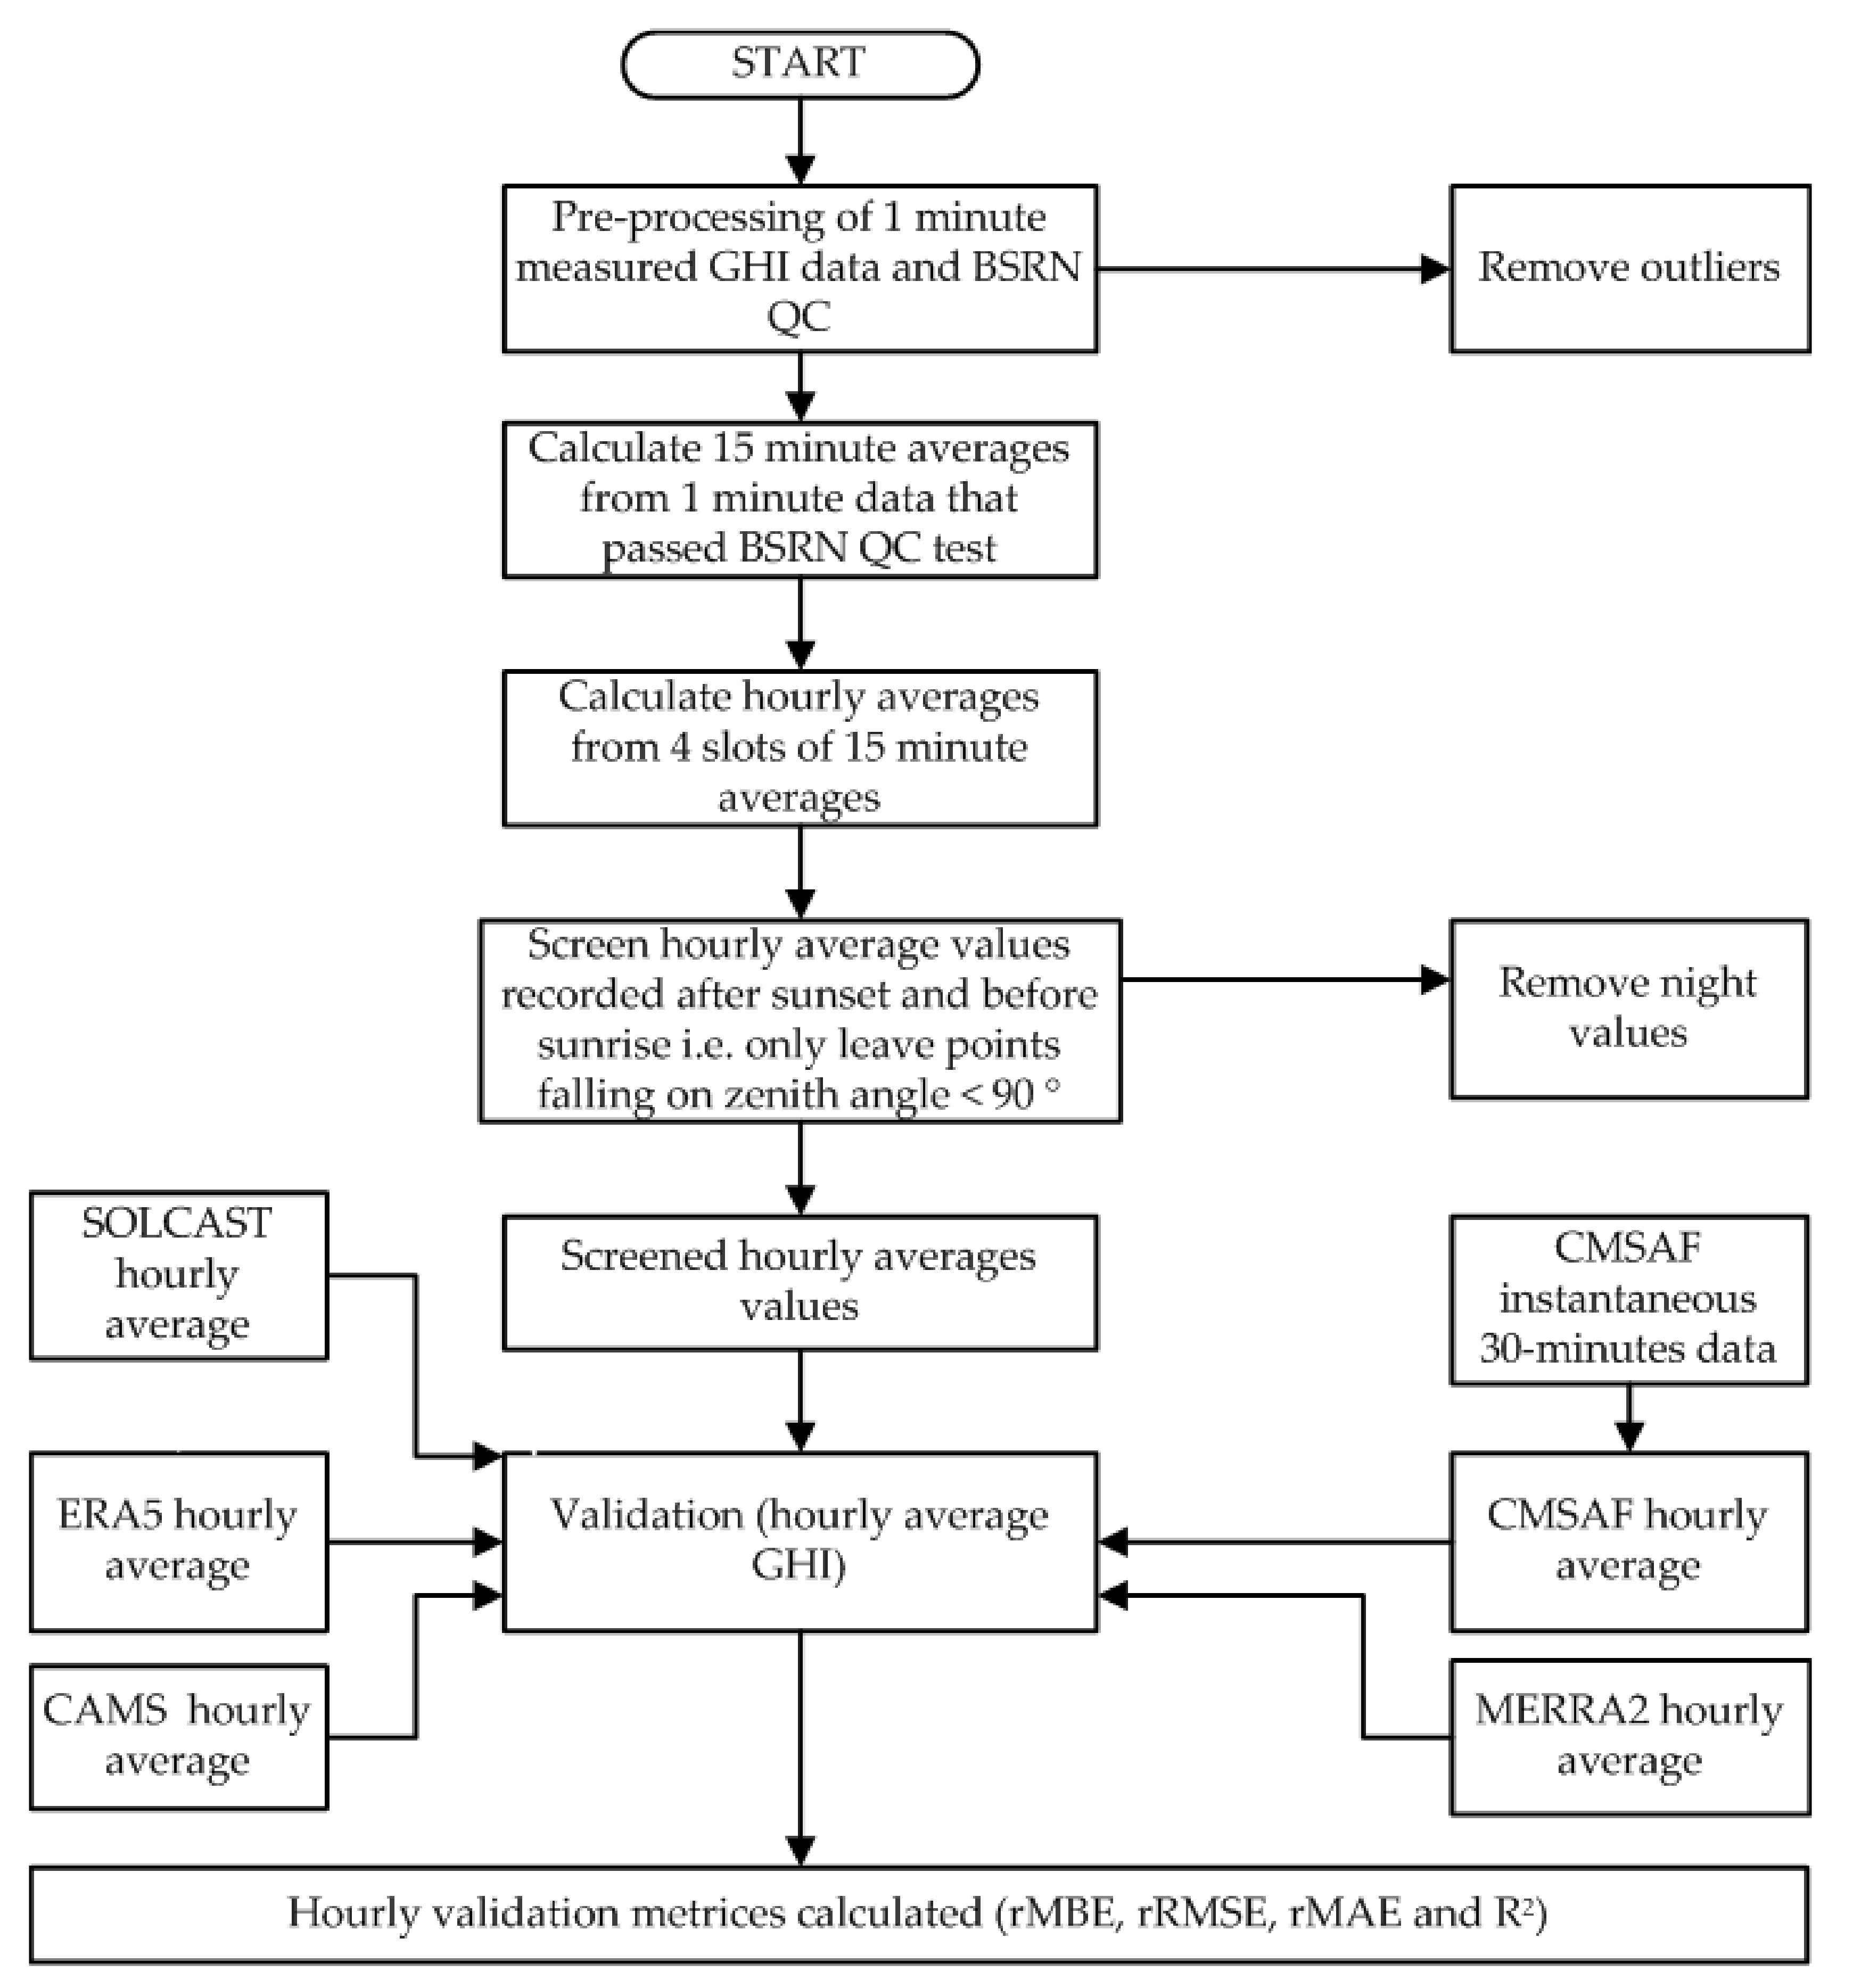
3.4. Methodology
3.5. Pre-Processing of Observation Data and Validation Process
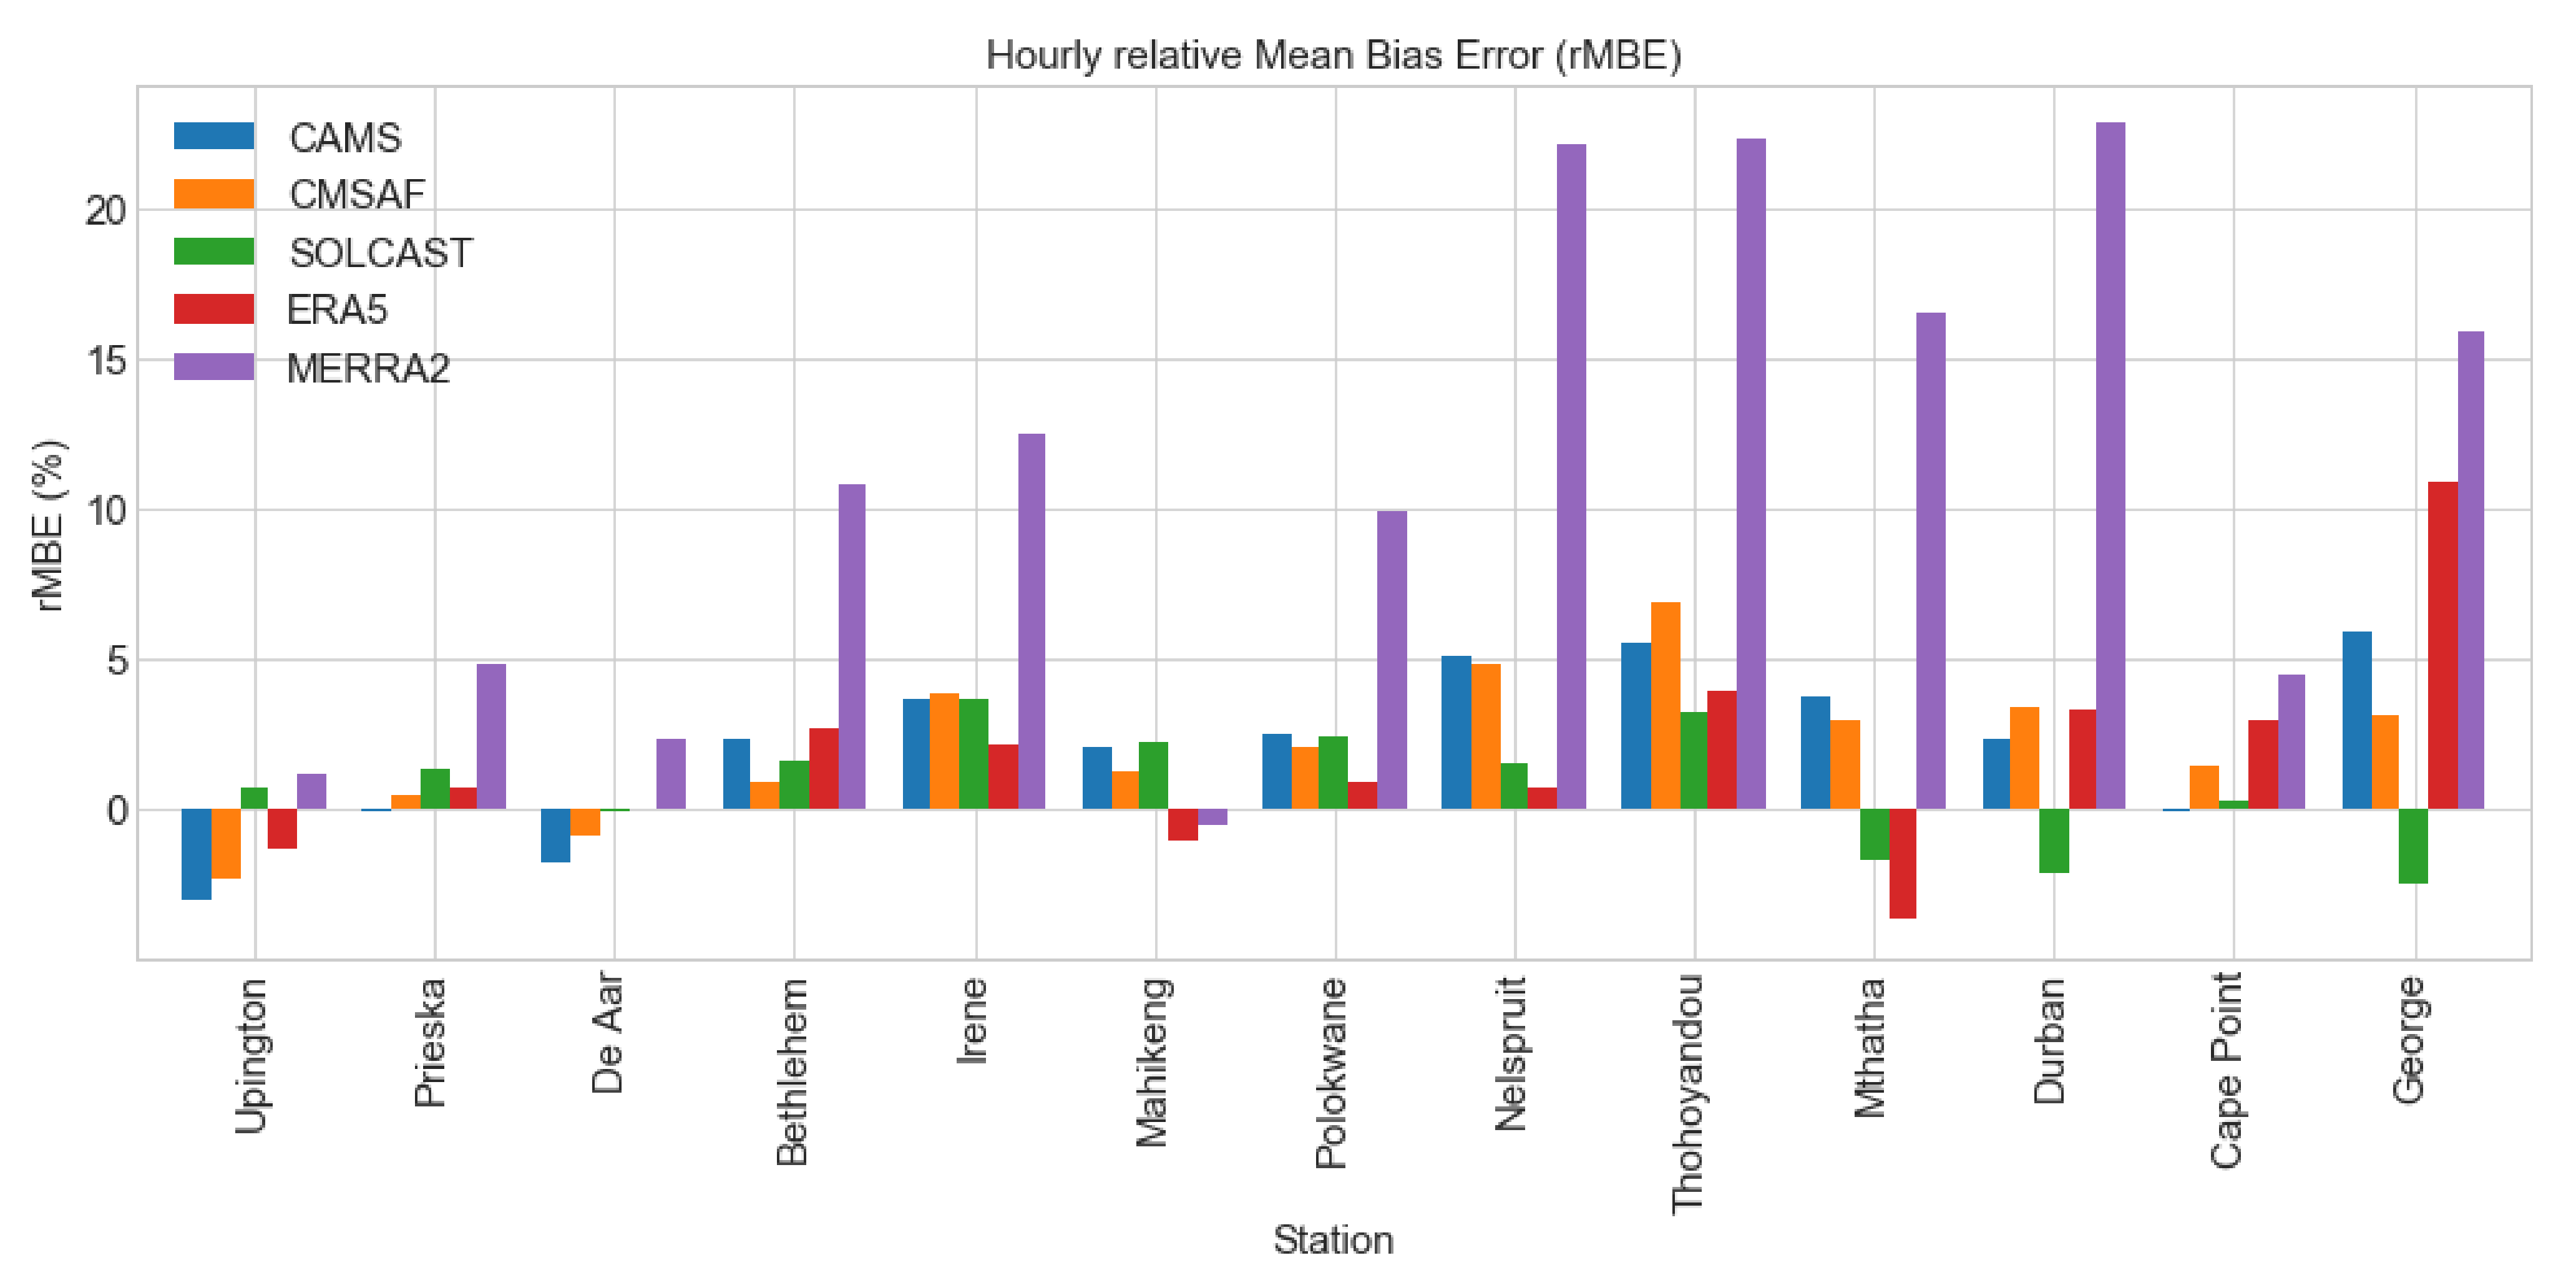
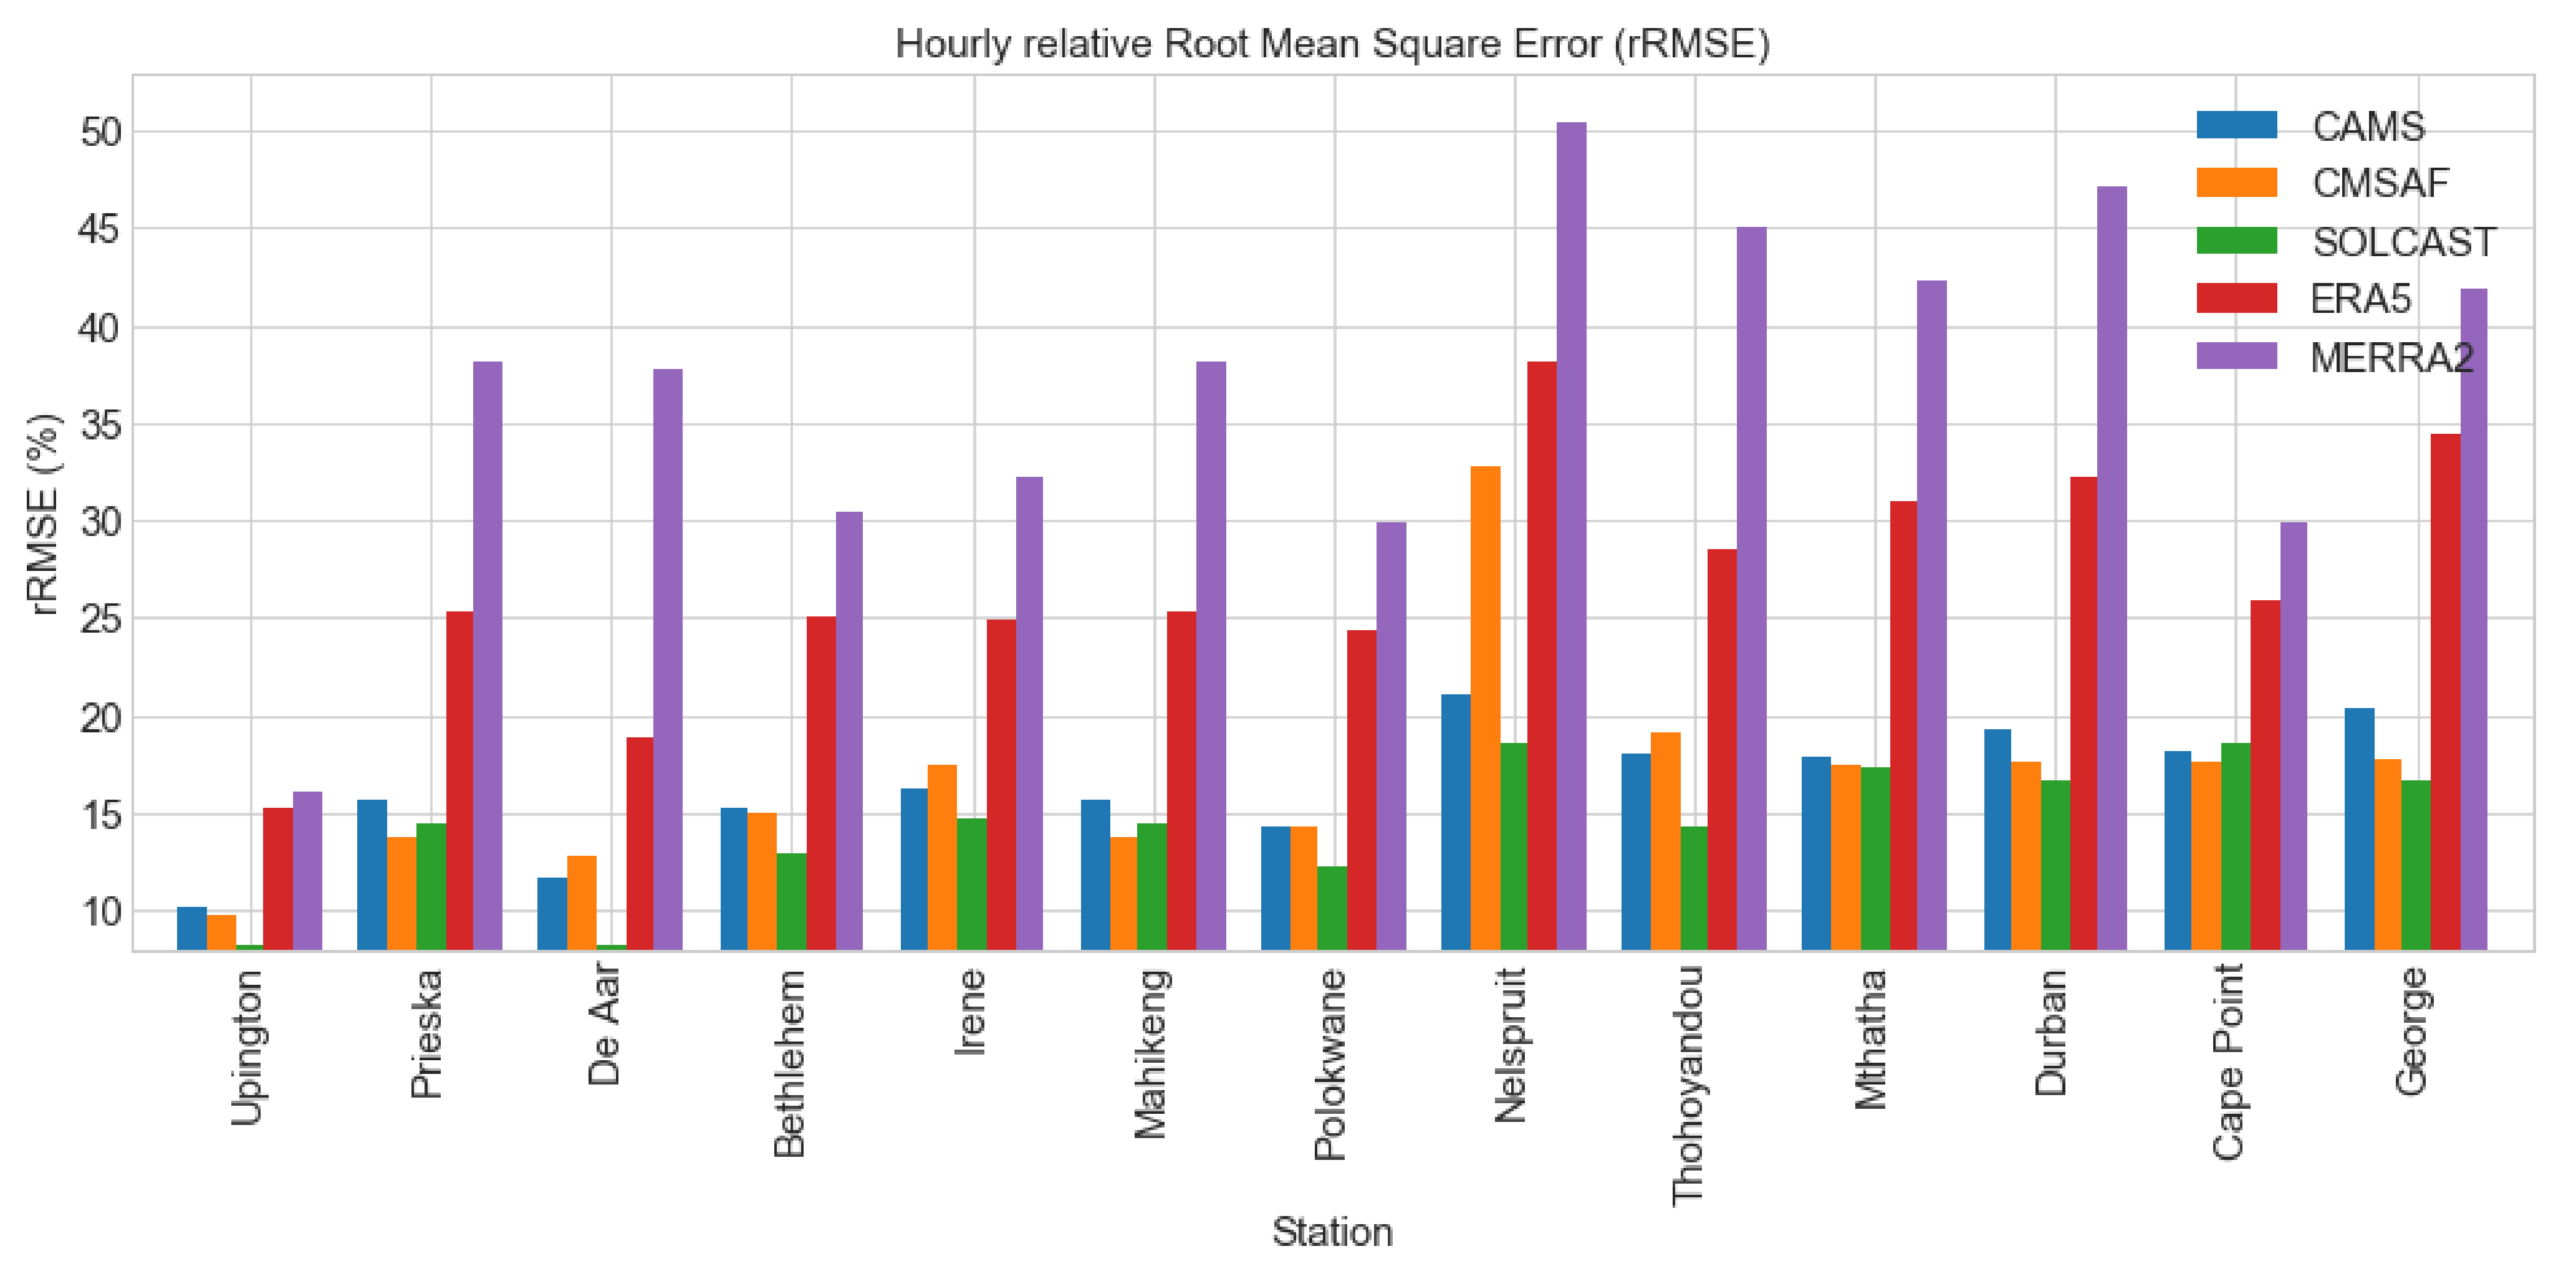
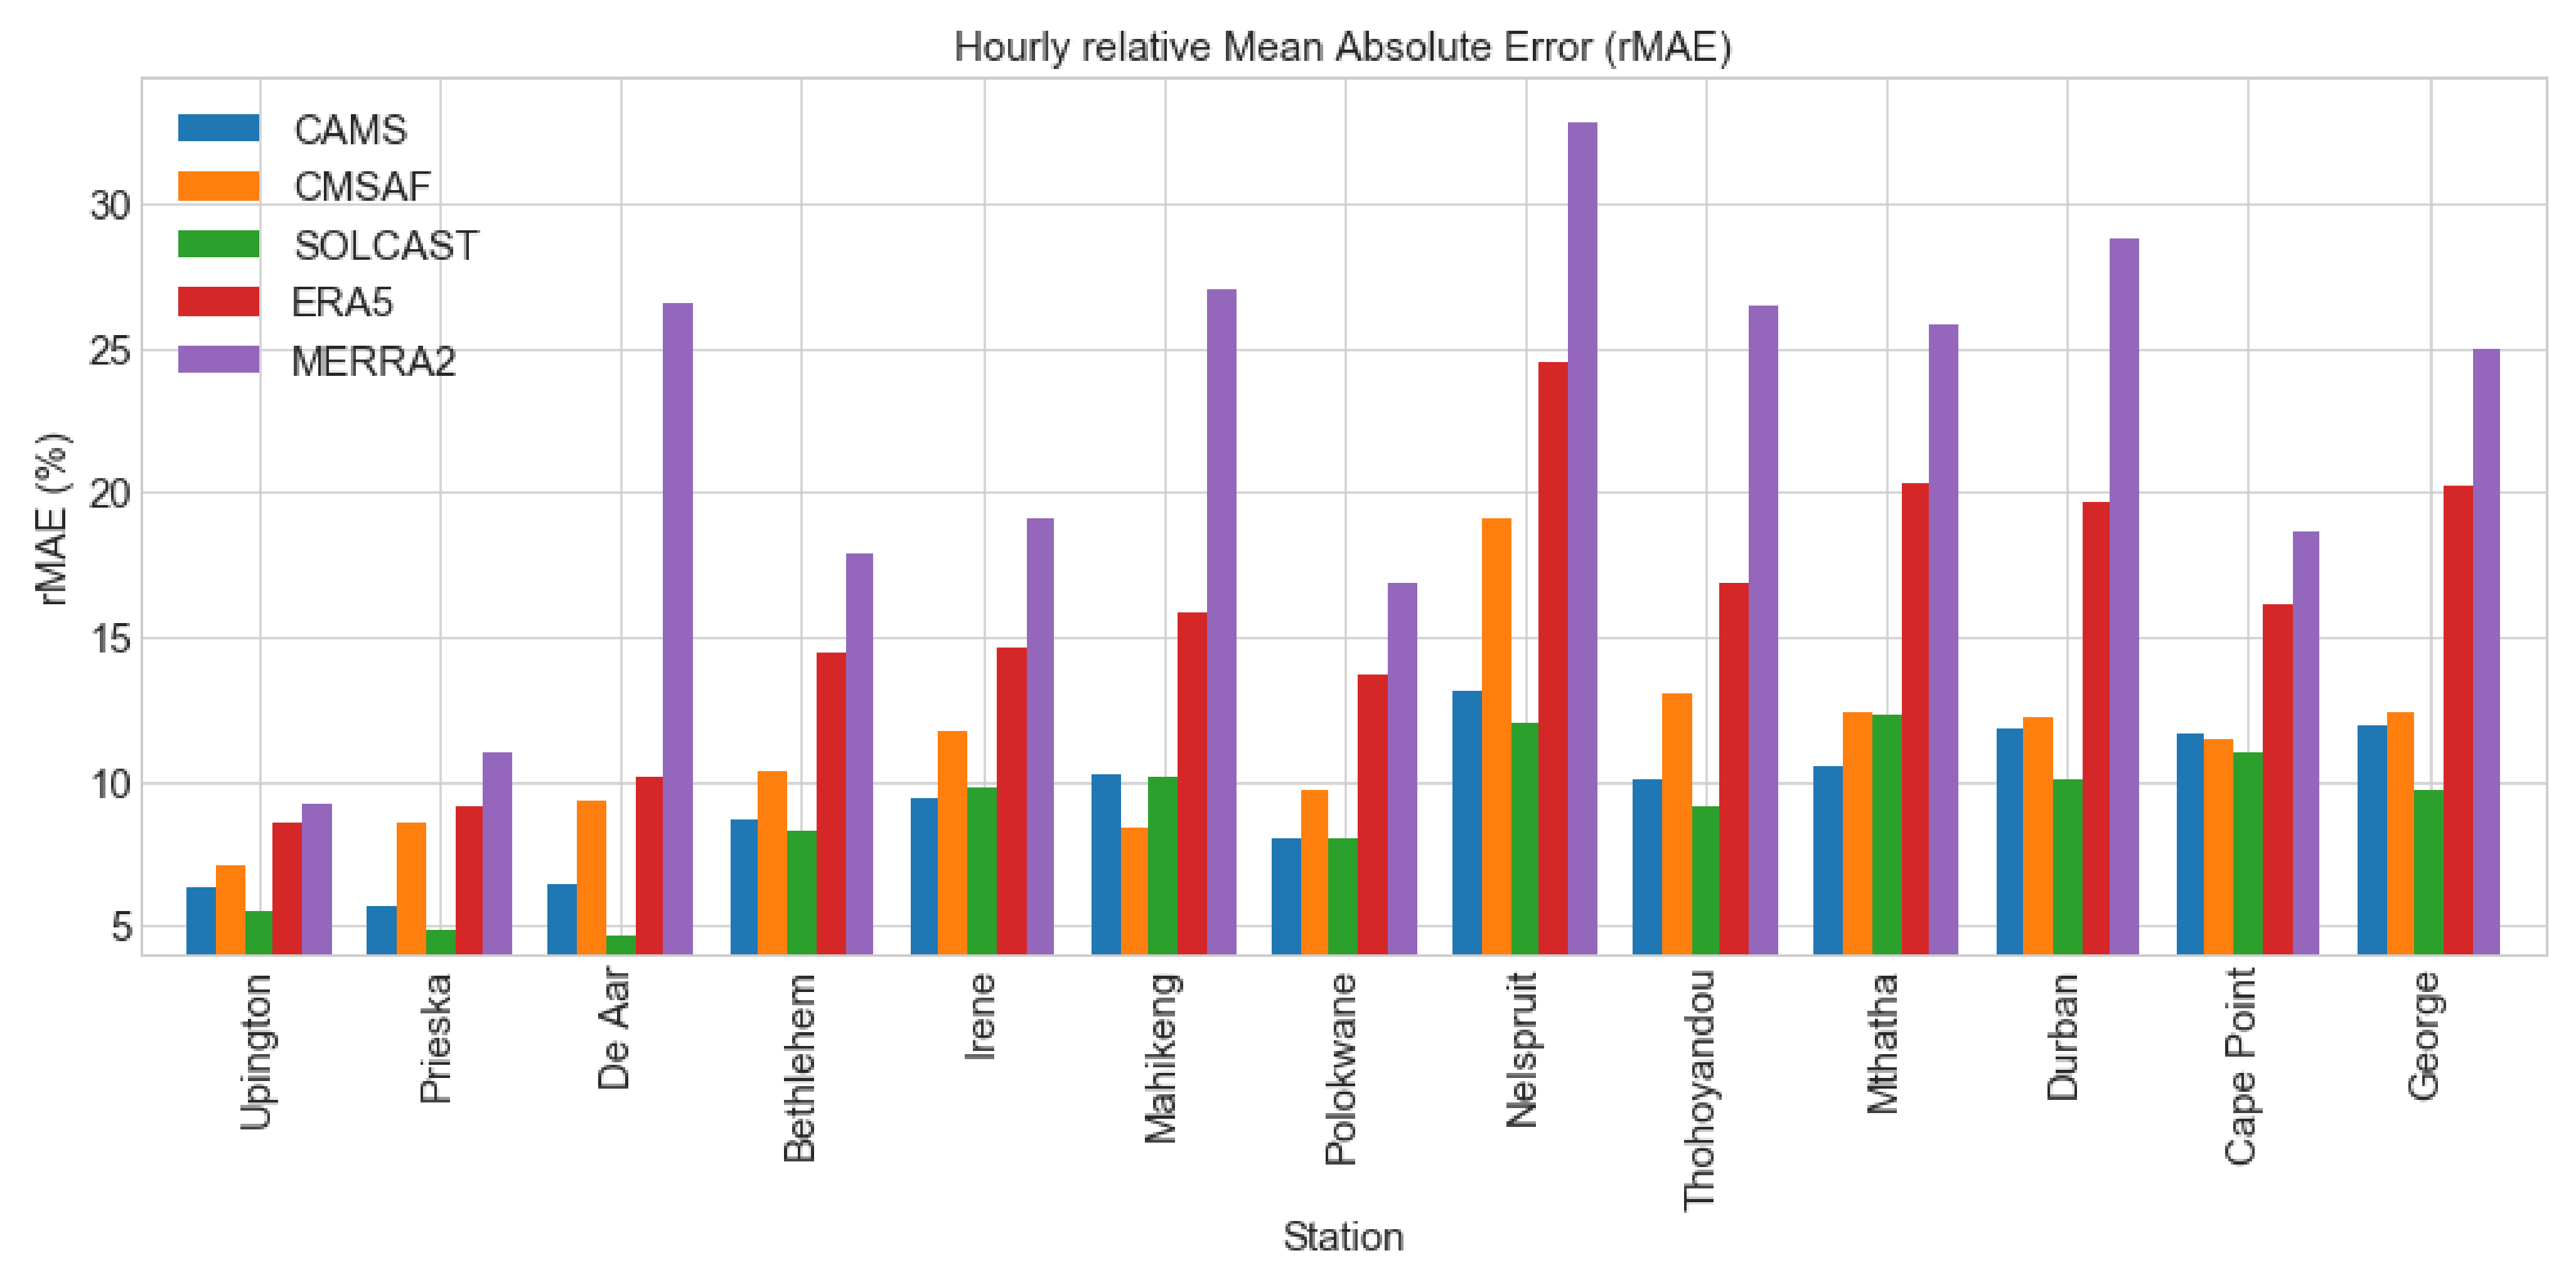
3.6. Statistical Metrics
3.7. Most Feasible Gridded Dataset
4. Results
4.1. CAMS
- ;
- ;
- ; and
- .
4.2. CMSAF
- .
4.3. SOLCAST
- ;
4.4. ERA5
- ;
- ;
- ;
4.5. MERRA2
- ;
- ;
- ; and
- .
5. Discussion
5.1. CAMS
5.2. CMSAF
5.3. SOLCAST
5.4. ERA5
5.5. MERRA2
6. Conclusions
Supplementary Materials
Author Contributions
Funding
Institutional Review Board Statement
Informed Consent Statement
Data Availability Statement
Acknowledgments
Conflicts of Interest
References
- Liou, K.N. An Introduction to Atmospheric Radiation; Elsevier: Amsterdam, The Netherlands, 2002. [Google Scholar]
- Dal Pai, A.; Escobedo, J.F.; Martins, D.; Teramoto, É.T. Analysis of hourly global, direct and diffuse solar radiations attenuation as a function of optical air mass. Energy Procedia 2014, 57, 1060–1069. [Google Scholar] [CrossRef] [Green Version]
- Schwandt, M.; Chhatbar, K.; Meyer, R.; Mitra, I.; Vashistha, R.; Giridhar, G.; Gomathinayagam, S.; Kumar, A. Quality check procedures and statistics for the Indian SRRA solar radiation measurement network. Energy Procedia 2014, 57, 1227–1236. [Google Scholar] [CrossRef] [Green Version]
- Zawilska, E.; Brooks, M. An assessment of the solar resource for Durban, South Africa. Renew. Energy 2011, 36, 3433–3438. [Google Scholar] [CrossRef]
- Urraca, R.; Gracia-Amillo, A.M.; Huld, T.; Martinez-De-Pison, F.J.; Trentmann, J.; Lindfors, A.V.; Riihelä, A.; Sanz-Garcia, A. Quality control of global solar radiation data with satellite-based products. Sol. Energy 2017, 158, 49–62. [Google Scholar] [CrossRef]
- Zawilska, E.; Brooks, M.J.; Meyer, A.J. A review of solar resource assessment initiatives in South Africa: The case for a national network. In Proceedings of the World Renewable Energy Forum, Denver, CO, USA, 13–17 May 2012. [Google Scholar]
- Jiang, H.; Yang, Y.; Bai, Y.; Wang, H. Evaluation of the total, direct, and diffuse solar radiations from the ERA5 reanalysis data in China. IEEE Geosci. Remote Sens. Lett. 2020, 17, 47–51. [Google Scholar] [CrossRef]
- Sianturi, Y.; Marjuki; Sartika, K. Evaluation of ERA5 and MERRA2 reanalyses to estimate solar irradiance using ground observations over Indonesia region. AIP Conf. Proc. 2020, 2223, 020002. [Google Scholar] [CrossRef]
- Marchand, M.; Ghennioui, A.; Wey, E.; Wald, L. Comparison of several satellite-derived databases of surface solar radiation against ground measurement in Morocco. Adv. Sci. Res. 2018, 15, 21–29. [Google Scholar] [CrossRef]
- Martín-Pomares, L.; Romeo, M.G.; Polo, J.; Frías-Paredes, L.; Fernández-Peruchena, C.M. Sampling design optimization of ground radiometric stations. In Solar Resources Mapping; Springer International Publishing: Cham, Switzerland, 2019; pp. 253–281. [Google Scholar]
- Wilbert, S.; Stoffel, T.; Myers, D.; Wilcox, S.; Habte, A.; Vignola, F.; Wood, J.; Pomares, L.M. Measuring solar radiation and relevant atmospheric parameters. In Best Practices Handbook for the Collection and Use of Solar Resource Data for Solar Energy Applications; National Renewable Energy Laboratory: Golden, CO, USA, 2017; Available online: https://hal-mines-paristech.archives-ouvertes.fr/hal-01184753 (accessed on 12 March 2020).
- Moradi, I. Quality control of global solar radiation using sunshine duration hours. Energy 2009, 34, 1–6. [Google Scholar] [CrossRef]
- Angstrom, A. Solar and terrestrial radiation. Report to the international commission for solar research on actinometric investigations of solar and atmospheric radiation. Q. J. R. Meteorol. Soc. 1924, 50, 121–126. [Google Scholar] [CrossRef]
- Prescott, J.A. Evaporation from a water surface in relation to solar radiation. Trans. R. Soc. S. Aust. 1940, 46, 114–118. [Google Scholar]
- Mabasa, B.; Lysko, M.D.; Tazvinga, H.; Mulaudzi, S.T.; Zwane, N.; Moloi, S.J. The ångström–prescott regression coefficients for six climatic zones in South Africa. Energies 2020, 13, 5418. [Google Scholar] [CrossRef]
- Žák, M.; Mikšovský, J.; Pišoft, P. CMSAF radiation data: New possibilities for climatological applications in the Czech Republic. Remote Sens. 2015, 7, 14445–14457. [Google Scholar] [CrossRef] [Green Version]
- Yang, D.; Bright, J.M. Worldwide validation of 8 satellite-derived and reanalysis solar radiation products: A preliminary evaluation and overall metrics for hourly data over 27 years. Sol. Energy 2020, 210, 3–19. [Google Scholar] [CrossRef]
- Esterhuyse, D.J. Establishment of the South African Baseline Surface Radiation Network Station at De Aar. Ph.D. Thesis, University of Pretoria, Pretoria, South Africa, 2006. Available online: https://repository.up.ac.za/handle/2263/23761 (accessed on 10 May 2020).
- Yang, D.; Perez, R. Can we gauge forecasts using satellite-derived solar irradiance? J. Renew. Sustain. Energy 2019, 11, 023704. [Google Scholar] [CrossRef]
- Ameen, B.; Balzter, H.; Jarvis, C.; Wey, E.; Thomas, C.; Marchand, M. Validation of hourly global horizontal irradiance for two satellite-derived datasets in Northeast Iraq. Remote Sens. 2018, 10, 1651. [Google Scholar] [CrossRef] [Green Version]
- Sancho, J.M. Comparison of global irradiance measurements of the official Spanish radiometric network for 2006 with satellite estimated data. J. Mediterr. Meteteorol. Climatol. Tethys 2011, 8, 43–52. [Google Scholar] [CrossRef]
- Slater, A. Surface solar radiation in North America: A comparison of observations, reanalyses, satellite, and derived products. J. Hydrometeorol. 2015, 17, 401–420. [Google Scholar] [CrossRef]
- Driemel, A.; Augustine, J.; Behrens, K.; Colle, S.; Cox, C.; Cuevas-Agulló, E.; Denn, F.M.; Duprat, T.; Fukuda, M.; Grobe, H.; et al. Baseline surface radiation network (BSRN): Structure and data description (1992–2017). Earth Syst. Sci. Data 2018, 10, 1491–1501. [Google Scholar] [CrossRef] [Green Version]
- Journée, M.; Bertrand, C. Geostatistical merging of ground-based and satellite-derived data of surface solar radiation. Adv. Sci. Res. 2011, 6, 1–5. [Google Scholar] [CrossRef] [Green Version]
- Dirksen, M.; Meirink, J.F.; Sluiter, R. Quality assessment of high-resolution climate records of satellite derived solar irradiance. Energy Procedia 2017, 125, 221–229. [Google Scholar] [CrossRef]
- Bright, J.M. Solcast: Validation of a satellite-derived solar irradiance dataset. Sol. Energy 2019, 189, 435–449. [Google Scholar] [CrossRef]
- Marchand, M.; Lefèvre, M.; Saboret, L.; Wey, E.; Wald, L. Verifying the spatial consistency of the CAMS radiation service and HelioClim-3 satellite-derived databases of solar radiation using a dense network of measuring stations: The case of The Netherlands. Adv. Sci. Res. 2019, 16, 103–111. [Google Scholar] [CrossRef] [Green Version]
- Lefèvre, M.; Oumbe, A.; Blanc, P.; Espinar, B.; Gschwind, B.; Qu, Z.; Wald, L.; Schroedter-Homscheidt, M.; Hoyer-Klick, C.; Arola, A.; et al. McClear: A new model estimating downwelling solar radiation at ground level in clear-sky conditions. Atmos. Meas. Tech. 2013, 6, 2403–2418. [Google Scholar] [CrossRef] [Green Version]
- Qu, Z.; Oumbe, A.; Blanc, P.; Espinar, B.; Gesell, G.; Gschwind, B.; Klüser, L.; Lefèvre, M.; Saboret, L.; Schroedter-Homscheidt, M.; et al. Fast radiative transfer parameterisation for assessing the surface solar irradiance: The Heliosat-4 method. Meteorol. Z. 2017, 26, 33–57. [Google Scholar] [CrossRef]
- Thomas, C.; Wey, E.; Blanc, P.; Wald, L. Validation of three satellite-derived databases of surface solar radiation using measurements performed at 42 stations in Brazil. Adv. Sci. Res. 2016, 13, 81–86. [Google Scholar] [CrossRef] [Green Version]
- Trolliet, M.; Walawender, J.P.; Bourlès, B.; Boilley, A.; Trentmann, J.; Blanc, P.; Lefèvre, M.; Wald, L. Downwelling surface solar irradiance in the tropical Atlantic Ocean: A comparison of re-analyses and satellite-derived data sets to PIRATA measurements. Ocean Sci. 2018, 14, 1021–1056. [Google Scholar] [CrossRef] [Green Version]
- PIRATA Network. Available online: https://www.pmel.noaa.gov/gtmba/pmel-theme/atlantic-ocean-pirata (accessed on 15 May 2021).
- Conradie, D. Köppen-Geiger Climate Classification. Available online: https://stepsa.org/climate_koppen_geiger.html#Development (accessed on 8 May 2021).
- Mabasa, B.; Lysko, M.; Tazvinga, H.; Zwane, N.; Moloi, S. The performance assessment of six global horizontal irradiance clear sky models in six climatological regions in South Africa. Energies 2021, 14, 2583. [Google Scholar] [CrossRef]
- Mabasa, M.B.; Botai, J.; Ntsangwane, M.L. Update on the re-establishment of the south african weather services (SAWS) radiometric network in all six climatological regions and the quality of the data. In Proceedings of the South African Solar Energy Conference (SASEC), Blue Waters Hotel, KwaZulu-Natal, South Africa, 25–27 June 2018; Available online: https://www.sasec.org.za/full_papers/68.pdf (accessed on 20 January 2020).
- Peng, X.; She, J.; Zhang, S.; Tan, J.; Li, Y. Evaluation of multi-reanalysis solar radiation products using global surface observations. Atmosphere 2019, 10, 42. [Google Scholar] [CrossRef] [Green Version]
- Hersbach, H.; Bell, B.; Berrisford, P.; Hirahara, S.; Horanyi, A.; Muñoz-Sabater, J.; Nicolas, J.; Peubey, C.; Radu, R.; Schepers, D.; et al. The ERA5 global reanalysis. Q. J. R. Meteorol. Soc. 2020, 146, 1999–2049. [Google Scholar] [CrossRef]
- Gelaro, R.; McCarty, W.; Suárez, M.J.; Todling, R.; Molod, A.; Takacs, L.; Randles, C.A.; Darmenov, A.; Bosilovich, M.G.; Reichle, R.; et al. The modern-era retrospective analysis for research and applications, version 2 (MERRA-2). J. Clim. 2017, 30, 5419–5454. [Google Scholar] [CrossRef]
- Pfeifroth, U.; Kothe, S.; Trentmann, J.; Hollmann, R.; Fuchs, P.; Kaiser, J.; Werscheck, M. Surface Radiation Data Set—Heliosat (SARAH), 2nd ed.; Satellite Application Facility on Climate Monitoring: Offenbach, Germany, 2019. [Google Scholar] [CrossRef]
- Pfeifroth, U.; Kothe, S.; Trentmann, J. EUMETSAT Satellite Application Facility on Climate Monitoring, Validation Report. Meteosat Solar Surface Sarah 2. Available online: https://www.cmsaf.eu/SharedDocs/Literatur/document/2016/saf_cm_dwd_val_meteosat_hel_2_1_pdf.pdf?__blob=publicationFile (accessed on 17 January 2020).
- Copernicus Portal. Available online: https://atmosphere.copernicus.eu/data (accessed on 16 March 2020).
- Solar Radiation Data (SoDa) Service. Available online: http://solar.atmosphere.copernicus.eu/cams-radiation-service (accessed on 2 March 2020).
- CAMS Validation. Available online: https://atmosphere.copernicus.eu/sites/default/files/custom-uploads/EQC-solar/CAMS72_2018SC2_D72.1.3.1-2021Q2_RAD_validation_report_SON2020_v1.pdf (accessed on 18 January 2021).
- SOLCAST. Available online: https://solcast.com (accessed on 15 April 2020).
- Gueymard, C.A. REST2: High-performance solar radiation model for cloudless-sky irradiance, illuminance, and photosynthetically active radiation—Validation with a benchmark dataset. Sol. Energy 2008, 82, 272–285. [Google Scholar] [CrossRef]
- SOLCAST Historical Data Validation. Available online: https://solcast.com/historical-and-tmy/validation-and-accuracy (accessed on 15 April 2020).
- Long, C.N.; Dutton, E.G. BSRN Global Network Recommended QC Tests, V2. 2010. Available online: https://epic.awi.de/30083/1/BSRN_recommended_QC_tests_V2.pdf (accessed on 11 December 2019).
- Roesch, A.; Wild, M.; Ohmura, A.; Dutton, E.G.; Long, C.N.; Zhang, T. Assessment of BSRN radiation records for the computation of monthly means. Atmos. Meas. Tech. 2011, 4, 339–354. [Google Scholar] [CrossRef] [Green Version]
- Riihelä, A.; Kallio, V.; Devraj, S.; Sharma, A.; Lindfors, A.V. Validation of the SARAH-E satellite-based surface solar radiation estimates over India. Remote Sens. 2018, 10, 392. [Google Scholar] [CrossRef] [Green Version]
- Geiger, M.; Diabaté, L.; Ménard, L.; Wald, L. A web service for controlling the quality of measurements of global solar irradiation. Sol. Energy 2002, 73, 475–480. [Google Scholar] [CrossRef] [Green Version]
- Reda, I.; Andreas, A. Solar position algorithm for solar radiation applications. Sol. Energy 2004, 76, 577–589. [Google Scholar] [CrossRef]
- Holmgren, W.F.; Hansen, C.W.; Mikofski, M.A. Pvlib python: A python package for modeling solar energy systems. J. Open Source Softw. 2018, 3, 884. [Google Scholar] [CrossRef] [Green Version]
- Gueymard, C.A. A review of validation methodologies and statistical performance indicators for modeled solar radiation data: Towards a better bankability of solar projects. Renew. Sustain. Energy Rev. 2014, 39, 1024–1034. [Google Scholar] [CrossRef]
- Fernández-Peruchena, C.M.; Gastón, M. A simple and efficient procedure for increasing the temporal resolution of global horizontal solar irradiance series. Renew. Energy 2016, 86, 375–383. [Google Scholar] [CrossRef]
- Mueller, R.; Behrendt, T.; Hammer, A.; Kemper, A. A new algorithm for the satellite-based retrieval of solar surface irradiance in spectral bands. Remote Sens. 2012, 4, 622–647. [Google Scholar] [CrossRef] [Green Version]
- Sun, X.; Bright, J.M.; Gueymard, C.A.; Acord, B.; Wang, P.; Engerer, N.A. Worldwide performance assessment of 75 global clear-sky irradiance models using principal component analysis. Renew. Sustain. Energy Rev. 2019, 111, 550–570. [Google Scholar] [CrossRef]


| Study | Dataset | rMBE | rRMSE | R2 |
|---|---|---|---|---|
| Bright [26] | SOLCAST (climates) | −0.1% to 1% | - | - |
| SOLCAST (individual stations) | −18% to 6% | 6% to 44% | 0.42 to 0.97 | |
| Yang and Bright [17] | SOLCAST | −5% to 3% | 9% to 30% | - |
| CAMS | −14% to 30% | 9% to 45% | - | |
| CMSAF | 27% to 40% | 10% to 80% | - | |
| ERA5 | 15% to 72% | 8% to 120% | - | |
| MERRA2 | 20% to 76% | 10% to 128% | - | |
| Merchand et al. [27] | CAMS | −4% to 10% | 20% to 28% | 0.94 to 0.97 |
| CAMS (inland) | 1% to 10% | 20% to 28% | 0.94 to 0.97 | |
| CAMS (southern coast) | −4% to −3% | 23% to 24% | 0.96 | |
| Thomas et al. [30] | CAMS | 2% to 16% | 17% to 35% | 0.89 to 0.97 |
| Ameen et al. [20] | CAMS (all sky conditions) | −5% to 5.3% | 14% to 20% | 0.92 to 0.96 |
| Marchand et al. [9] | CAMS | −4% to 7% | 11% and 21% | 0.92 to 0.98 |
| Trolliet et al. [31] | CMSAF SARAH | 2% to 12% | - | 0.92 to 0.98 |
| CAMS | 2% to 8% | - | 0.93 to 0.97 | |
| ERA5 | −2% and 5% | - | 0.88 to 0.93 | |
| MERRA2 | −10% to 4% | - | 0.83 to 0.91 |
| Station | KGCC | Altitude (m) | Latitude (°) | GHI Observation Period | Clear Sky Days | Diffuse Fraction | Humidity | Outliers (%) |
|---|---|---|---|---|---|---|---|---|
| Upington | BWh | 848 | −28.48 | 1 February 2014 to 30 November 2019 | 97 (27) | 0.18 | 35.4 | 4.47 |
| Prieska | BWh | 989 | −29.68 | 1 September 2013 to 31 August 2019 | 78 (21) | 0.18 | 38 | 3.88 |
| De Aar | BWk | 1284 | −30.67 | 1 May 2014 to 31 December 2019 | 58 (16) | 0.2 | 44.5 | 4.23 |
| Bethlehem | Cwb | 1688 | −28.25 | 1 January 2015 to 31 December 2019 | 43 (12) | 0.31 | 59.1 | 6.57 |
| Irene | Cwb | 1524 | −25.91 | 1 March 2014 to 31 December 2019 | 62 (17) | 0.3 | 54.9 | 2.99 |
| Mahikeng | BSh | 1289 | −25.81 | 1 January 2016 to 31 December 2019 | 77 (21) | 0.24 | 43.9 | 6.4 |
| Polokwane | BSk | 1233 | −23.86 | 1 March 2015 to 31 December 2019 | 49 (13) | 0.31 | 58.2 | 5.12 |
| Nelspruit | Cwa | 870 | −25.39 | 1 February 2014 to 31 December 2019 | 39 (11) | 0.4 | 62 | 5.85 |
| Thohoyandou | BSh | 619 | −23.08 | 1 March 2015 to 31 October 2017 | 50 (14) | 0.34 | 60.8 | 4.06 |
| Mthatha | Cfb | 744 | −31.55 | 1 July 2014 to 31 December 2019 | 19 (5) | 0.33 | 68.1 | 4.98 |
| Durban | Cfa | 91 | −29.61 | 1 March 2015 to 31 December 2019 | 20 (5) | 0.39 | 72.8 | 5.34 |
| Cape Point | Csb | 86 | −34.35 | 1 February 2015 to 31 December 2019 | 12 (3) | 0.34 | 77.2 | 4.96 |
| George | Cfb | 192 | −34.01 | 1 January 2015 to 31 December 2019 | 11 (3) | 0.36 | 79.2 | 2.75 |
| Parameter/Colour | Humidity (H) | Clear Sky Days (CL) | Diffuse Fraction (DF) |
|---|---|---|---|
| Green | |||
| Yellow | |||
| Blue | |||
| Orange |
| Skill | rMBE | rRMSE | rMAE | R2 |
|---|---|---|---|---|
| Poor | ||||
| Good | ||||
| Excellent |
| Station | Mean GHI (W/m2) | CAMS | CMSAF | SOLCAST | ERA5 | MERRA2 |
|---|---|---|---|---|---|---|
| Upington | 522.86 | 0.995 | 0.995 | 0.996 | 0.987 | 0.985 |
| Prieska | 490.95 | 0.986 | 0.983 | 0.991 | 0.962 | 0.955 |
| DeAar | 497.67 | 0.984 | 0.981 | 0.992 | 0.958 | 0.833 |
| Bethlehem | 459.50 | 0.976 | 0.976 | 0.983 | 0.932 | 0.914 |
| Irene | 458.15 | 0.973 | 0.969 | 0.979 | 0.932 | 0.907 |
| Mahikeng | 492.13 | 0.972 | 0.978 | 0.977 | 0.923 | 0.826 |
| Polokwane | 466.63 | 0.978 | 0.977 | 0.985 | 0.932 | 0.910 |
| Nelspruit | 404.24 | 0.962 | 0.908 | 0.970 | 0.868 | 0.823 |
| Thohoyandou | 408.46 | 0.972 | 0.970 | 0.983 | 0.922 | 0.856 |
| Mthatha | 382.77 | 0.975 | 0.976 | 0.975 | 0.915 | 0.873 |
| Durban | 364.64 | 0.972 | 0.977 | 0.979 | 0.919 | 0.871 |
| Cape Point | 415.41 | 0.970 | 0.972 | 0.969 | 0.938 | 0.920 |
| George | 387.46 | 0.968 | 0.974 | 0.977 | 0.909 | 0.875 |
| Hourly | Minimum rMBE | Minimum rRMSE | Minimum rMAE | Maximum R2 | Most Feasible | Rating |
|---|---|---|---|---|---|---|
| Upington | SOLCAST | SOLCAST | SOLCAST | SOLCAST | SOLCAST | 4/4 |
| Prieska | CAMS | CMSAF | SOLCAST | SOLCAST | SOLCAST | 2/4 |
| De Aar | ERA5 | SOLCAST | SOLCAST | SOLCAST | SOLCAST | 3/4 |
| Bethlehem | CMSAF | SOLCAST | SOLCAST | SOLCAST | SOLCAST | 3/4 |
| Irene | ERA5 | SOLCAST | CAMS | SOLCAST | SOLCAST | 2/4 |
| Mahikeng | MERRA2 | CMSAF | CMSAF | CMSAF | CMSAF | 3/4 |
| Polokwane | ERA5 | SOLCAST | SOLCAST | SOLCAST | SOLCAST | 3/4 |
| Nelspruit | ERA5 | SOLCAST | SOLCAST | SOLCAST | SOLCAST | 3/4 |
| Thohoyandou | SOLCAST | SOLCAST | SOLCAST | SOLCAST | SOLCAST | 4/4 |
| Mthatha | SOLCAST | SOLCAST | CAMS | CMSAF | SOLCAST | 2/4 |
| Durban | SOLCAST | SOLCAST | SOLCAST | SOLCAST | SOLCAST | 4/4 |
| Cape Point | CAMS | CMSAF | SOLCAST | CMSAF | CMSAF | 2/4 |
| George | SOLCAST | SOLCAST | SOLCAST | SOLCAST | SOLCAST | 4/4 |
| Dataset | rMBE | rRMSE | rMAE | R2 |
|---|---|---|---|---|
| SOLCAST | −3% to 4% | 8% to 19% | 5% to 12% | 0.969 to 0.996 |
| CAMS | −3% to 6% | 10% to 21% | 6% to 13% | 0.962 to 0.995 |
| CMSAF | −2% to 7% | 10% to 33% | 7% to 19% | 0.908 to 0.995 |
| ERA5 | −4% to 11% | 15% to 38% | 9% to 25% | 0.868 to 0.987 |
| MERRA2 | −1% to 23% | 16% to 50% | 9% to 32% | 0.823 to 0.985 |
Publisher’s Note: MDPI stays neutral with regard to jurisdictional claims in published maps and institutional affiliations. |
© 2021 by the authors. Licensee MDPI, Basel, Switzerland. This article is an open access article distributed under the terms and conditions of the Creative Commons Attribution (CC BY) license (https://creativecommons.org/licenses/by/4.0/).
Share and Cite
Mabasa, B.; Lysko, M.D.; Moloi, S.J. Validating Hourly Satellite Based and Reanalysis Based Global Horizontal Irradiance Datasets over South Africa. Geomatics 2021, 1, 429-449. https://doi.org/10.3390/geomatics1040025
Mabasa B, Lysko MD, Moloi SJ. Validating Hourly Satellite Based and Reanalysis Based Global Horizontal Irradiance Datasets over South Africa. Geomatics. 2021; 1(4):429-449. https://doi.org/10.3390/geomatics1040025
Chicago/Turabian StyleMabasa, Brighton, Meena D. Lysko, and Sabata J. Moloi. 2021. "Validating Hourly Satellite Based and Reanalysis Based Global Horizontal Irradiance Datasets over South Africa" Geomatics 1, no. 4: 429-449. https://doi.org/10.3390/geomatics1040025