1. Introduction
Adults with intellectual and developmental disabilities (IDD) often have poorer nutrition habits compared to individuals without IDD [
1,
2,
3]. Barriers can include lack of resources (e.g., location and financial), lack of knowledge and skills, and low comfort levels with a variety of foods [
4]. Finding effective practices to improve health habits for individuals with IDD is critical as dietary habits have strong modifiable risk factors for chronic diseases such as diabetes and cardiovascular disease [
5].
While there is a larger body of literature on interventions focused on physical health behaviors such as exercise for this population (e.g., [
6,
7,
8,
9]), interventions to support healthier nutrition habits is lacking. When compared to individuals without IDD, fewer people with IDD meet recommended guidelines for each food group, except for sugar and fat [
10]. This suggests a need for research on effective supports that can lead to individuals with IDD making healthier nutrition choices if they indicate a desire to do so.
Technology such as mobile health applications (apps) may increase exposure and support for adults with IDD to engage in healthier nutrition habits. While the use of mobile health technologies has increased, little is known about adults with disabilities’ use of such health apps [
11]. Users with disabilities who use mobile health apps have described challenges and concerns about universal design and the need for additional support [
11]. For adults with IDD, technology use with the addition of self-management strategies like goal setting, self-monitoring, and visual support interventions has been promising in promoting behavior change in other behaviors such as academic, exercise, and work-related tasks [
12,
13,
14,
15].
The purpose of this study was to examine the use of a mobile nutrition app called Fooducate with self-monitoring, goal setting, and self-reinforcement on making healthier nutrition choices when shopping for groceries. We determined if the self-management intervention supported a change in the number of food and drink items participants bought that received a score of an A through B− on the Fooducate app. We also explored participants’ experiences and perspectives on the Fooducate app including feasibility and usability in identifying and buying healthier nutrition choices. This study addressed the following research question: Is there a functional relation between the use of a nutrition app with self-management intervention and the number of A/B-grade food and drink items adults with IDD buy?
2. Materials and Methods
2.1. Participants
Approval from the institutional review board and consent were obtained before beginning the study. Participants were recruited through an approved study flyer posted on social media. Participation in the study was open to adults who: (a) were 18 years or older, (b) had ID, (c) had access to a smartphone or tablet, (d) reported wanting to make healthier nutrition choices, (e) made independent grocery choices, and (f) made at least one grocery trip per week. Specific details on eligibility criteria are listed in the eligibility visit procedures. We recruited three adults with IDD to participate. We wanted to recruit participants who reported wanting to change and make healthier nutrition choices, to increase the likelihood they were ready for an intervention. For this pilot, it was also important that participants were shopping independently for themselves and had control over the items they chose to buy each week.
Participants with IDD
All names used in this manuscript are pseudonyms. Melinda was a 28-year-old who identified as a Black female with autism and ID, Olivia was a 34-year-old who identified as a Hispanic female with ID and Down syndrome, and Elliot was a 24-year-old who identified as a Caucasian male with ID and Down syndrome. All participants lived independently or with a roommate. All participants reported wanting to eat healthier or drink more water. Melinda, Olivia, and Elliot all reported
a little awareness of healthy food and drink items or some awareness of healthy food and drink items. Melinda and Olivia reported eating healthy
every once in a while, and Elliot reported eating healthy
about half of the time. Participants reported drinking about 1–2 cups of water per day and all reported their favorite drink choice as soda. Elliot was the only participant that reported experience with a health app (Fitbit
®), and no participant had prior experience with the Fooducate app specifically. All participants reported they were
comfortable or
very comfortable with technology and used technology to help them with other tasks. All participants reported going to a grocery store between 1–2 times per week. Refer to
Table 1 for participant demographics.
2.2. Setting
The study took place in each participant’s home and their local and preferred grocery store in the south-central region of the United States. Study visits and goal-setting sessions took place in each participant’s home. Participants were instructed to shop at least once per week and were not limited to shopping at any specific store or on the number of times they wanted to grocery shop. For intervention, participants were instructed to find a quiet place in their home where they could fill out their goal-setting sheet.
2.3. Materials
2.3.1. Mobile Device
Each participant had access to a mobile device that was compatible with the Fooducate app. We did not need to access data from the device itself, so we decided personal devices were appropriate for this study. During the eligibility visit, we provided pictorial task-analytic instructions for participants to download the Fooducate app directly, and provided verbal prompts when needed. In addition, for fidelity purposes, participants needed access to the mobile device to record themselves during some intervention goal-setting sessions. We required a mobile device for eligibility to encourage continued use of the Fooducate app after study completion.
2.3.2. Fooducate App
The Fooducate App is a health app designed by © Maple Media, LLC [
17] to support individuals in achieving their diet, health, and fitness goals. Users can track their food, water, and fitness, as well as search nutrition levels of food and drink items, search for recipes and diet tips, listen to Fooducate podcasts, and post within the community blog. The Fooducate app also allows users to scan bar codes on food and drink items using their phone camera or search for items that they eat or drink, and shows the user a nutrition grade for that food item. There are 10 grades food items can earn between the highest nutrition grade A and lowest grade D (A, A−, B+, B, B−, C+, C, C−, D+, and D). The higher the grade of a food or drink item, the healthier and more natural the food or drink item. We had access to each participant’s Fooducate account to pull data throughout the study. We created individual email accounts for each participant and linked those emails to their Fooducate app. Only participants and the research team had access to their accounts. After the study was completed, Fooducate accounts were transitioned to each participant’s personal email address (i.e., research team members could no longer access their accounts).
2.4. Dependent Variable
We examined the use of the Fooducate app with self-monitoring, goal setting, and self-reinforcement on the number of grade A through B− scanned food and drink items they bought each week. The dependent variable was the number of items they bought in a week that received a score in the Fooducate app of an A through B−. For this study, we focused on participants identifying food and drink items included in the food pyramid and food and drink items with less processing (i.e., items that often receive a nutrition grade of A through B− in the Fooducate app; [
18]). If participants made multiple grocery trips in one week, items were added together from those trips. Data were accessed through the Fooducate app, confirmed with pictures and receipts, and graphed each week.
2.5. Experimental Design
We used a changing criterion single-case research design [
19,
20]. Changing criterion is appropriate when gradual behavior change is intended, and participants are already familiar with the behavior [
20]. Due to feasibility of study length and retention concerns (we only had one data point per week), we decided a priori to gather a minimum of four baseline data points (i.e., we could only meet the What Works Clearinghouse (WWC, [
21]) single-case research design standards with reservations) and added more depending on stability and trend. Intervention phases occurred in a stepwise fashion, with one phase of lowering criterion as an opportunity to control for maturation threats, strengthening the demonstration of experimental control [
20]. For the phase in which we lowered criterion, we wanted to continue promoting making healthy choices, so we used a mini-reversal, returning to each participant’s individualized first intervention phase criterion (i.e., did not implement a full reversal). The timing of the mini-reversal phase was randomized for each participant (i.e., the mini-reversal phase could potentially take place at different time points within the intervention phases for participants), with the exception that it could not occur until after the first two intervention phases. Criterion increased incrementally across intervention phases and included reaching a predetermined goal for three cumulative grocery-shopping weeks. Participants had the opportunity to meet their final goal and performance was unconstrained (i.e., participants were not prevented from exceeding their goal) during shopping weeks. Criterion changes were determined a priori. Participants’ criterion increased by two A/B items bought for each intervention phase. Smaller criterion changes were necessary and recommended for behaviors resistant to change such as nutrition habits [
19]. The study lasted 5–6 months for baseline and intervention sessions, and additional maintenance sessions occurred starting four weeks after the last intervention week. The total length of the study was 6–7.1 months.
2.6. Procedures
Procedures for this study included an eligibility visit, baseline sessions, intervention training, intervention sessions, maintenance sessions, and an exit visit. Each procedure is described in the following procedures’ subsections. Refer to
Table 2 for a snapshot of procedure activities, including who were present, locations, and timeframes.
2.6.1. Eligibility Visit
At the eligibility visit, participants consented to the study and filled out a demographics and social validity questionnaire. A member of the research team also administered the Leiter International Performance Scale, Third Edition (Leiter-3; [
16]) to confirm intellectual disability. Participants downloaded the Fooducate app and practiced using the scanner to scan food and drink items in their home. The session concluded with practice sending pictures to the research team. The eligibility visit lasted approximately 75 min.
Demographics Questionnaire
Participants with IDD that consented completed a questionnaire via Qualtrics to gather demographics and determine if they wanted to learn more about nutrition and change their habits. If participants answered probably yes or definitely yes to the nutrition question Do you want to make healthier nutrition choices?, they met the eligibility criteria for wanting to make healthier nutrition choices. A researcher was available to read questions and responses to participants if they indicated they needed support and participants answered the questions directly on a tablet (i.e., no proxies were used). After the demographics questionnaire, participants also completed the social validity measure to gather perspectives on nutrition and intervention components before being introduced to the study. Refer to the social validity section in this manuscript for additional information about social validity.
Confirm ID Diagnosis
During the eligibility visit, we also confirmed ID diagnosis using the Leiter-3 [
16]. Participants were presented with tasks in four sections including figure-ground, form completion, classification and analogies, and sequential order to test nonverbal intelligence and cognitive abilities. A nonverbal intelligence score below 70 was needed to be eligible for the study.
Fooducate App Training
Next, each potential participant was provided a pictorial task-analytic instruction sheet and account details (i.e., username and password) to (a) download the Fooducate app from their app store and (b) log in to the app. We reviewed the app with each participant including (a) how to scan or search for food/drink items and (b) what each nutrition grade meant on the food/drink scanner (e.g., A versus D). We also provided visual supports of example food items that would score A or B like pears and plain bagels, and non-examples including Doritos® and cake. After watching the researcher, participants practiced using the Fooducate app to scan items available in their home. Once participants used the app to scan items independently two times, they practiced taking a picture of a sample receipt and sent the picture to the research team. The eligibility session ended after they took and sent two pictures independently.
2.6.2. Baseline Sessions
Baseline sessions began the first full day after the screening. Participants each had access to the Fooducate app, as well as instructions and visual supports to support app navigation, and examples and nonexamples. The participants were instructed to (a) scan items during their grocery-shopping trips, (b) take a picture of their cart before checking out/bagging groceries, and (c) upload that picture as well as a picture of their receipt to the research team. We recognized the novelty of scanning items on grocery shelves was possible, as well as scanning items and making choices between those scanned items for their purchase, and wanted to capture what they were physically buying from the store for consumption. The app shows every item scanned each day, with the only deletion option being to clear the entire scanning history. Participants submitted a picture and their receipt so items scanned that were not purchased could be removed from their scan count. Baseline lasted 4–5 weeks.
2.6.3. Intervention Training
Before starting the intervention, participants met in their home with a member of the research team to be introduced to the goal-setting sheets and procedures for recording goal-setting sessions. Participants also worked with the researcher to identify potential reinforcers to access after reaching their goal for three cumulative shopping weeks. After instructions were provided, each participant watched the researcher (a) start recording the session, (b) fill out the goal-setting sheet with self-monitoring checklist, (c) take a picture of the goal setting sheet, (d) stop the recording, and (e) upload the picture and video to the research team via Microsoft Teams. Next, each participant with IDD had an opportunity to practice the same steps. We provided feedback as well as behavior-specific praise and ended the training session after each participant with IDD practiced two times. While we did not require a specific criterion to move forward, fidelity was measured using video observation from goal-setting sessions and booster training was provided by a research team member if fidelity fell below 90%. Intervention training lasted 45–70 min for each participant.
2.6.4. Intervention
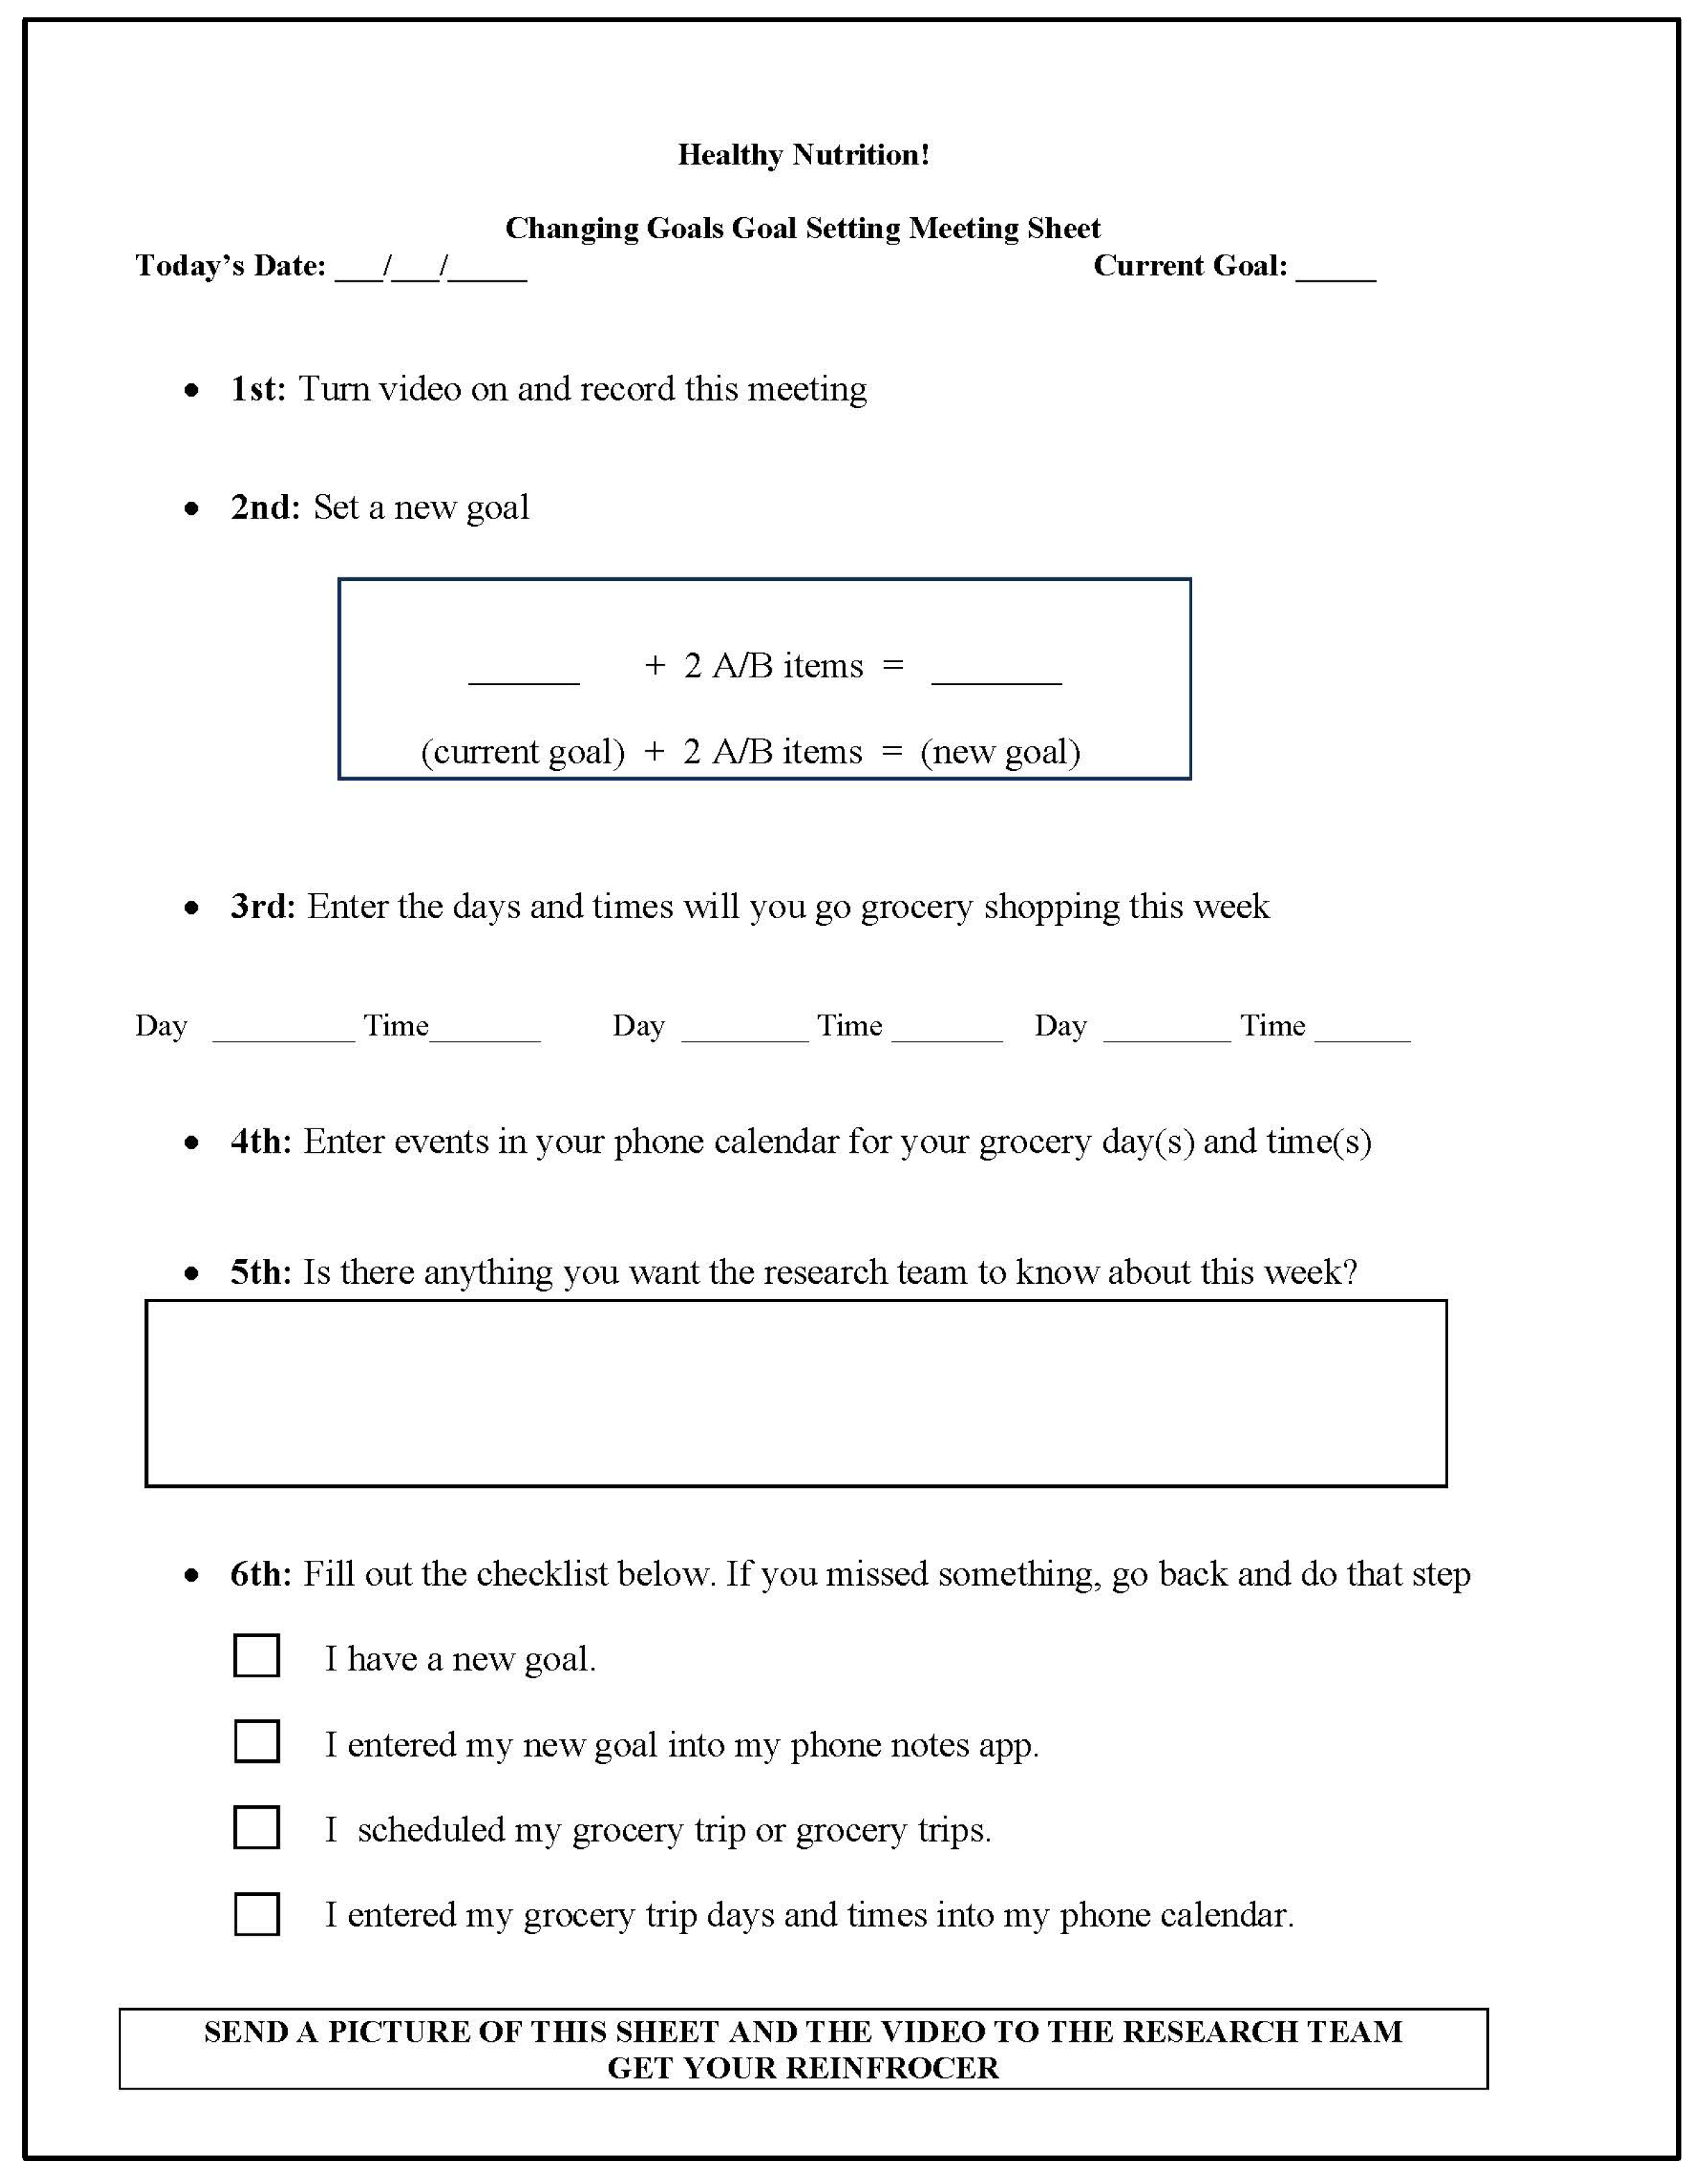
Intervention procedures for grocery shopping remained the same as baseline. The first author graphed data continuously and contacted the participant when it was time for them to increase their goal at a goal-setting session (i.e., each time they were ready to change phases after meeting the phase criterion for three cumulative shopping weeks). During goal-setting sessions, participants filled out a goal-setting sheet (flow chart with goal-setting tasks with an embedded self-monitoring checklist). Refer to
Figure 1 for a sample goal-setting sheet for phase criterion change weeks. Participants had a modified goal sheet for weeks they remained in the same phase criterion.
The goal-setting meeting phase change sheet walked participants through setting a new goal, entering their new goal into their mobile device notes, identifying day(s) and time(s) in the upcoming week to go grocery shopping, adding those day(s) and time(s) into their mobile device calendar, and taking note of questions they had about the study. The goal-setting session concluded with participants using the self-monitoring checklist at the footer of each goal-setting sheet to indicate they completed each meeting task. The self-monitoring checklist included (a) I have a new goal, (b) I entered my new goal into my phone, (c) I scheduled my grocery trip or grocery trips, and (d) I entered my grocery-shopping trip(s) into my phone calendar. At the end, there was a reminder to send the video to the research team and access their potential reinforcer. For fidelity, participants video-recorded some goal-setting meetings. After participants finished the goal-setting tasks and the self-monitoring checklist, they sent the video recording and a picture of the goal-setting sheet to the research team and accessed their potential reinforcer. Goal-setting sessions took 10–15 min for each participant. Intervention lasted 19–23 weeks.
2.6.5. Maintenance
Five weeks after the last intervention session, the research team logged into each participant’s Fooducate account and reviewed their Fooducate history for the prior week (i.e., four weeks post-intervention). Maintenance sessions were designed to measure the participants’ ability to utilize the Fooducate app while removing the self-management supports. During maintenance, we counted the number of food and drink items with a score of A through B− that were scanned for three weeks. Consistent with prior phases, participants submitted their receipts, so items scanned that were not purchased were not counted in the total items. Maintenance lasted three weeks.
2.6.6. Reliability
Interobserver agreement (IOA) was calculated for 100% of sessions across baseline, intervention, and maintenance phases, exceeding WWC [
21] standards for single-case research designs, and was considered reliable if IOA was 80% or higher. Two independent researchers logged into each participant’s Fooducate account and compared the scanned item list in the Fooducate app to items that were purchased (using picture and receipt), and calculated the number of grade A through B− items out of total items purchased for each week. We calculated IOA using an item-by-item method of dividing the number of agreed individual data points by the total number of agreements plus disagreements and multiplying by 100. IOA was 100% across each phase.
2.6.7. Procedural Fidelity
Procedural fidelity was measured during all study conditions (baseline, intervention, and maintenance) to determine if the methods were carried out as intended, including different steps in each condition. For 25–40% of sessions in each phase, researchers directly observed each participant during grocery-shopping trips. Researchers used a checklist to determine if participants were reminding themselves of their goal before and/or during shopping, scanning items themselves, taking a picture of their cart, taking a picture of their receipt, and sending it to the research team. During intervention sessions, participants video-recorded themselves during goal-setting meetings and sent the video to the research team. We used video observation and a checklist to measure fidelity steps during goal-setting sessions. A checklist was used for the following procedures: participant accurately set a new goal, participant entered their new goal in their mobile device’s notes, participant identified day(s) and time(s) to grocery shop, participant entered those day(s) and time(s) into their mobile device’s calendars, and participant completed the self-monitoring checklist. Overall procedural fidelity was 91.7%. Procedural fidelity was 92.2% for Melinda, 83% for Olivia, and 100% for Elliot. The most-missed procedural fidelity step was taking a picture of their grocery cart before checking out.
2.7. Social Validity
We gathered participants’ perspectives on nutrition as well as intervention components both before the study and after the study. The questionnaire consisted of a 3-point Likert visual scale as well as open-ended questions. Melinda and Elliot read the questionnaire on their own, and the questionnaire was read to Olivia. No additional visuals were needed. Questions included their feelings on eating healthy food, feelings around drinking more water, and perceived ability to set goals and use a mobile app to help reach goals. Open-ended questions asked participants to list things they buy regularly at the grocery store, their favorite things to eat and drink, and least favorite things to eat and drink.
An additional feasibility and usability questionnaire was completed by participants after the study to gather perspectives and experiences with the Fooducate app and intervention components. The questionnaire consisted of a 3-point Likert visual scale as well as yes/no questions covering the feasibility (i.e., appropriateness of the materials from each participant’s perspective) and usability (i.e., the user experience of the Fooducate app and intervention components).
2.8. Data Analysis
Visual analysis was used to analyze data. We assessed data within each phase (i.e., level, trend, and variability), compared data between adjacent phases (i.e., changes in data patterns, overlap, and consistency in data patterns across similar conditions), and ensured there was an opportunity for at least three demonstrations of an effect at three different points in time. Gradual change was expected. The first intervention criterion was set at one A/B grocery item above the baseline median to set the participant up for success, and each following intervention phase criterion increased by two A/B grocery items bought. Data were considered stable within a phase if 80% of the data points fell within 20% of the median (i.e., stability envelope).
3. Results
3.1. Melinda
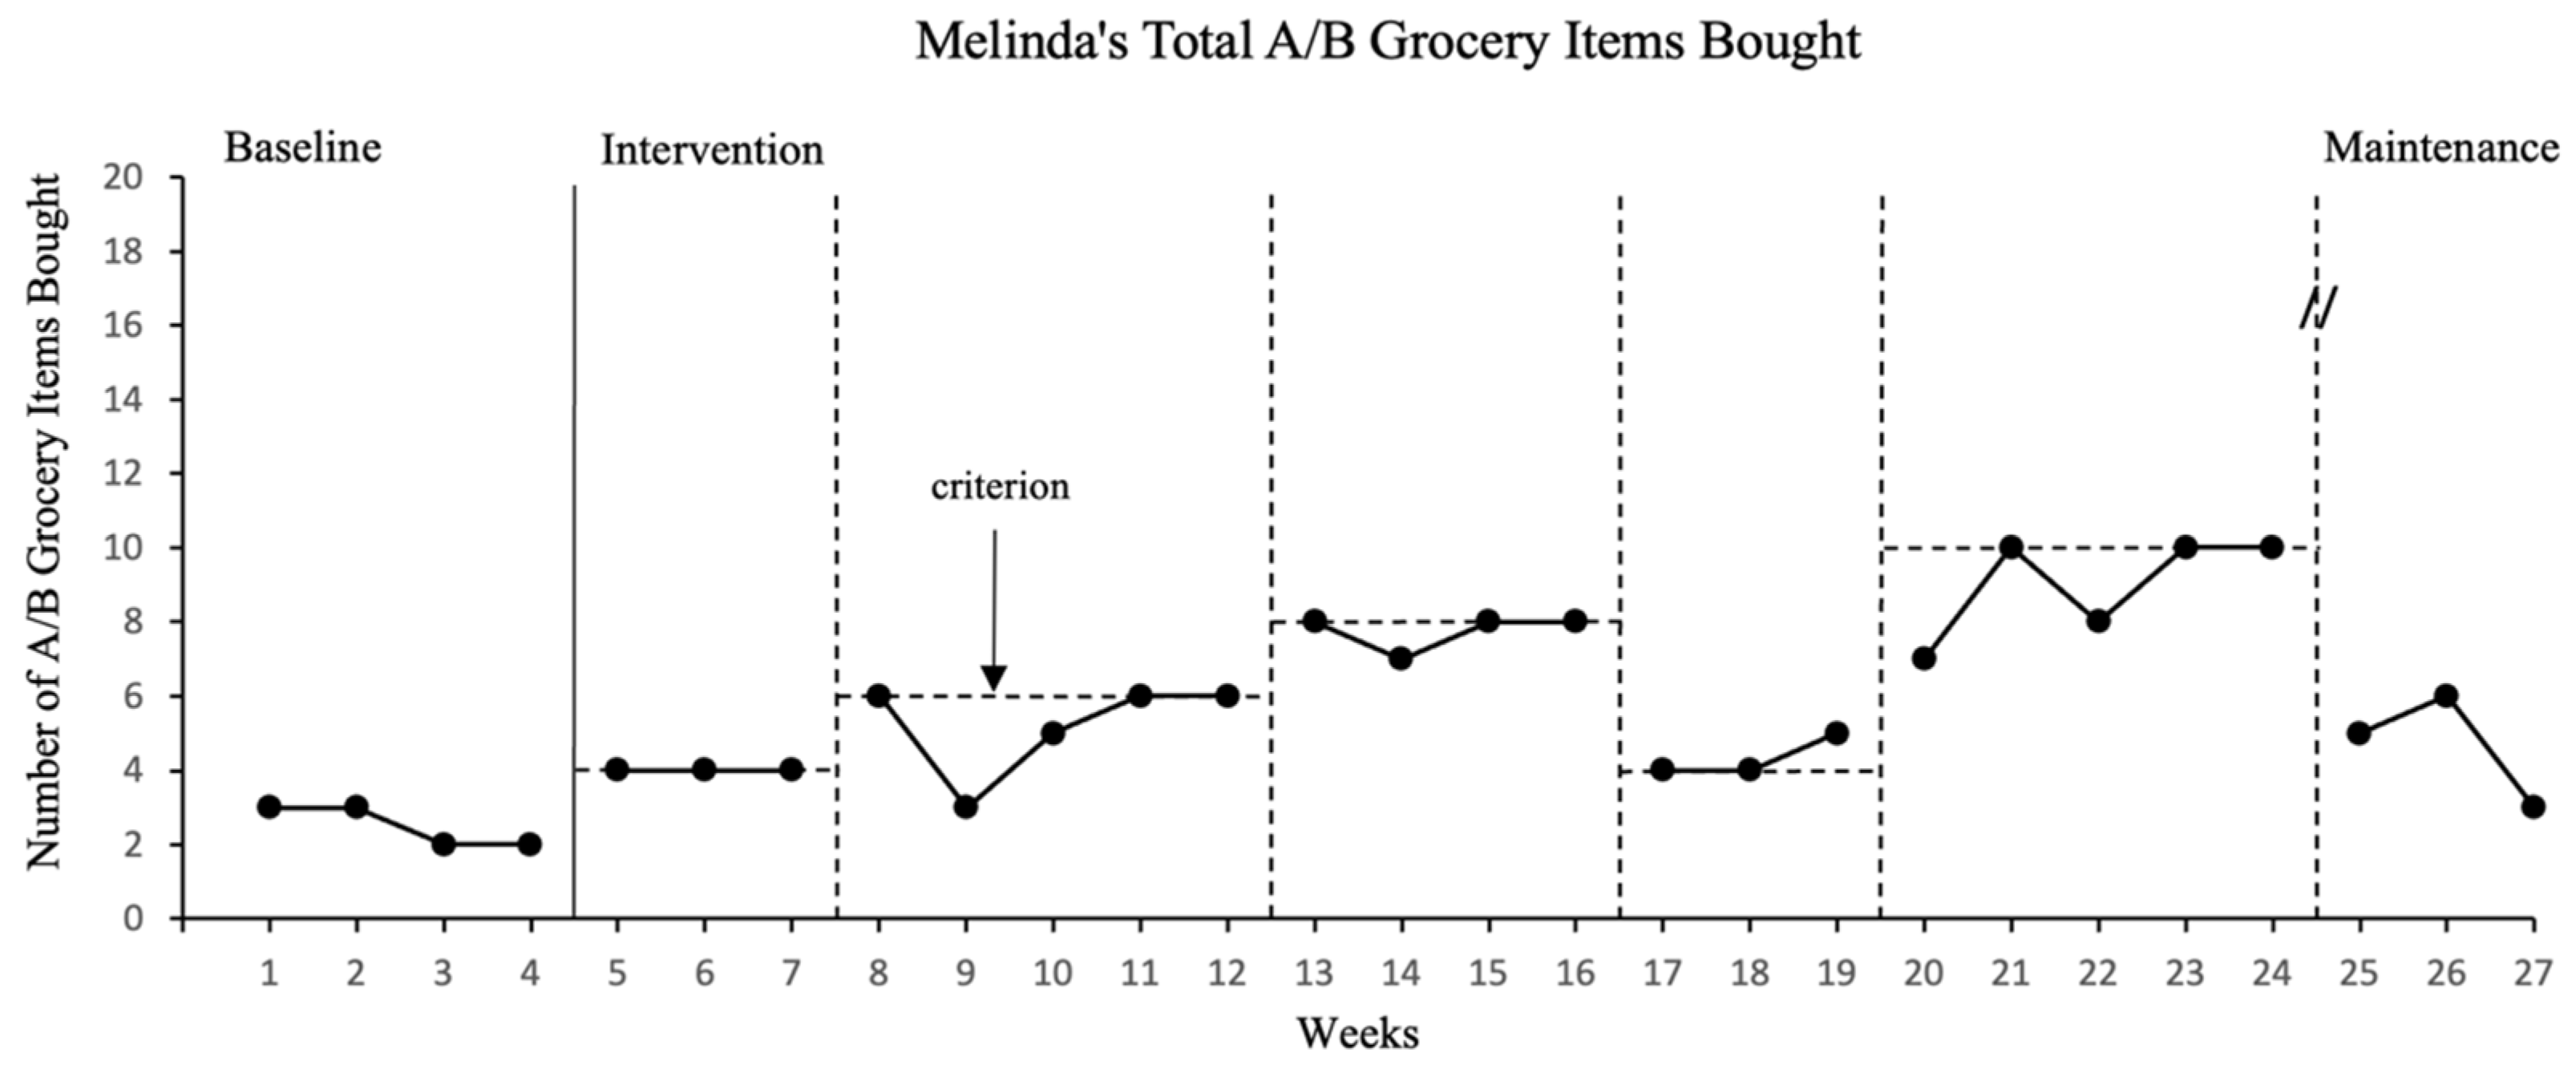
Melinda bought an average of two and a half A though B− grocery items per week during baseline sessions (range 2–3). Intervention phase goals started at buying four A/B grocery items per week for the first intervention phase and increased to six and eight A/B items for the second and third intervention phases, respectively. For the fourth intervention phase, the goal was reduced back to Melinda’s criterion for the first intervention phase (4 A/B items) and raised back up to 10 A/B grocery items for the fifth intervention phase. Melinda met intervention goals within 3–5 weeks for each intervention phase.
Figure 2 includes a graph of the number of A/B grocery items Melinda bought each week across all study sessions. Also, refer to
Table 3 for Melinda’s frequency counts of grocery items bought each week, categorized by nutrition grades.
Levels for weekly A/B grocery items bought ranged from 2–3 items in baseline, 4 items in the first intervention phase, 3–6 items in the next phase, 7–8 items in the third intervention phase, 4–5 items when the criterion was back down to a goal of buying 4 A/B items, and 7–10 items in the last intervention phase. Maintenance data for Melinda fell from the last intervention phase with a range of 3–6 A/B items bought across each of the three weeks. There was a decelerating trend in baseline sessions and either a zero-celerating or accelerating trend within all intervention phases. The data were stable for the baseline and within all intervention phases. The data were not stable for maintenance, with levels at 66.7%. There were no overlapping data points between baseline and intervention, and one overlapping data point between the first and second intervention phases. From a visual analysis of the data in
Figure 2, we determined there was a functional relation between the intervention (using a mobile health app with self-management) and the number of A/B grocery items Melinda bought each week.
3.2. Olivia
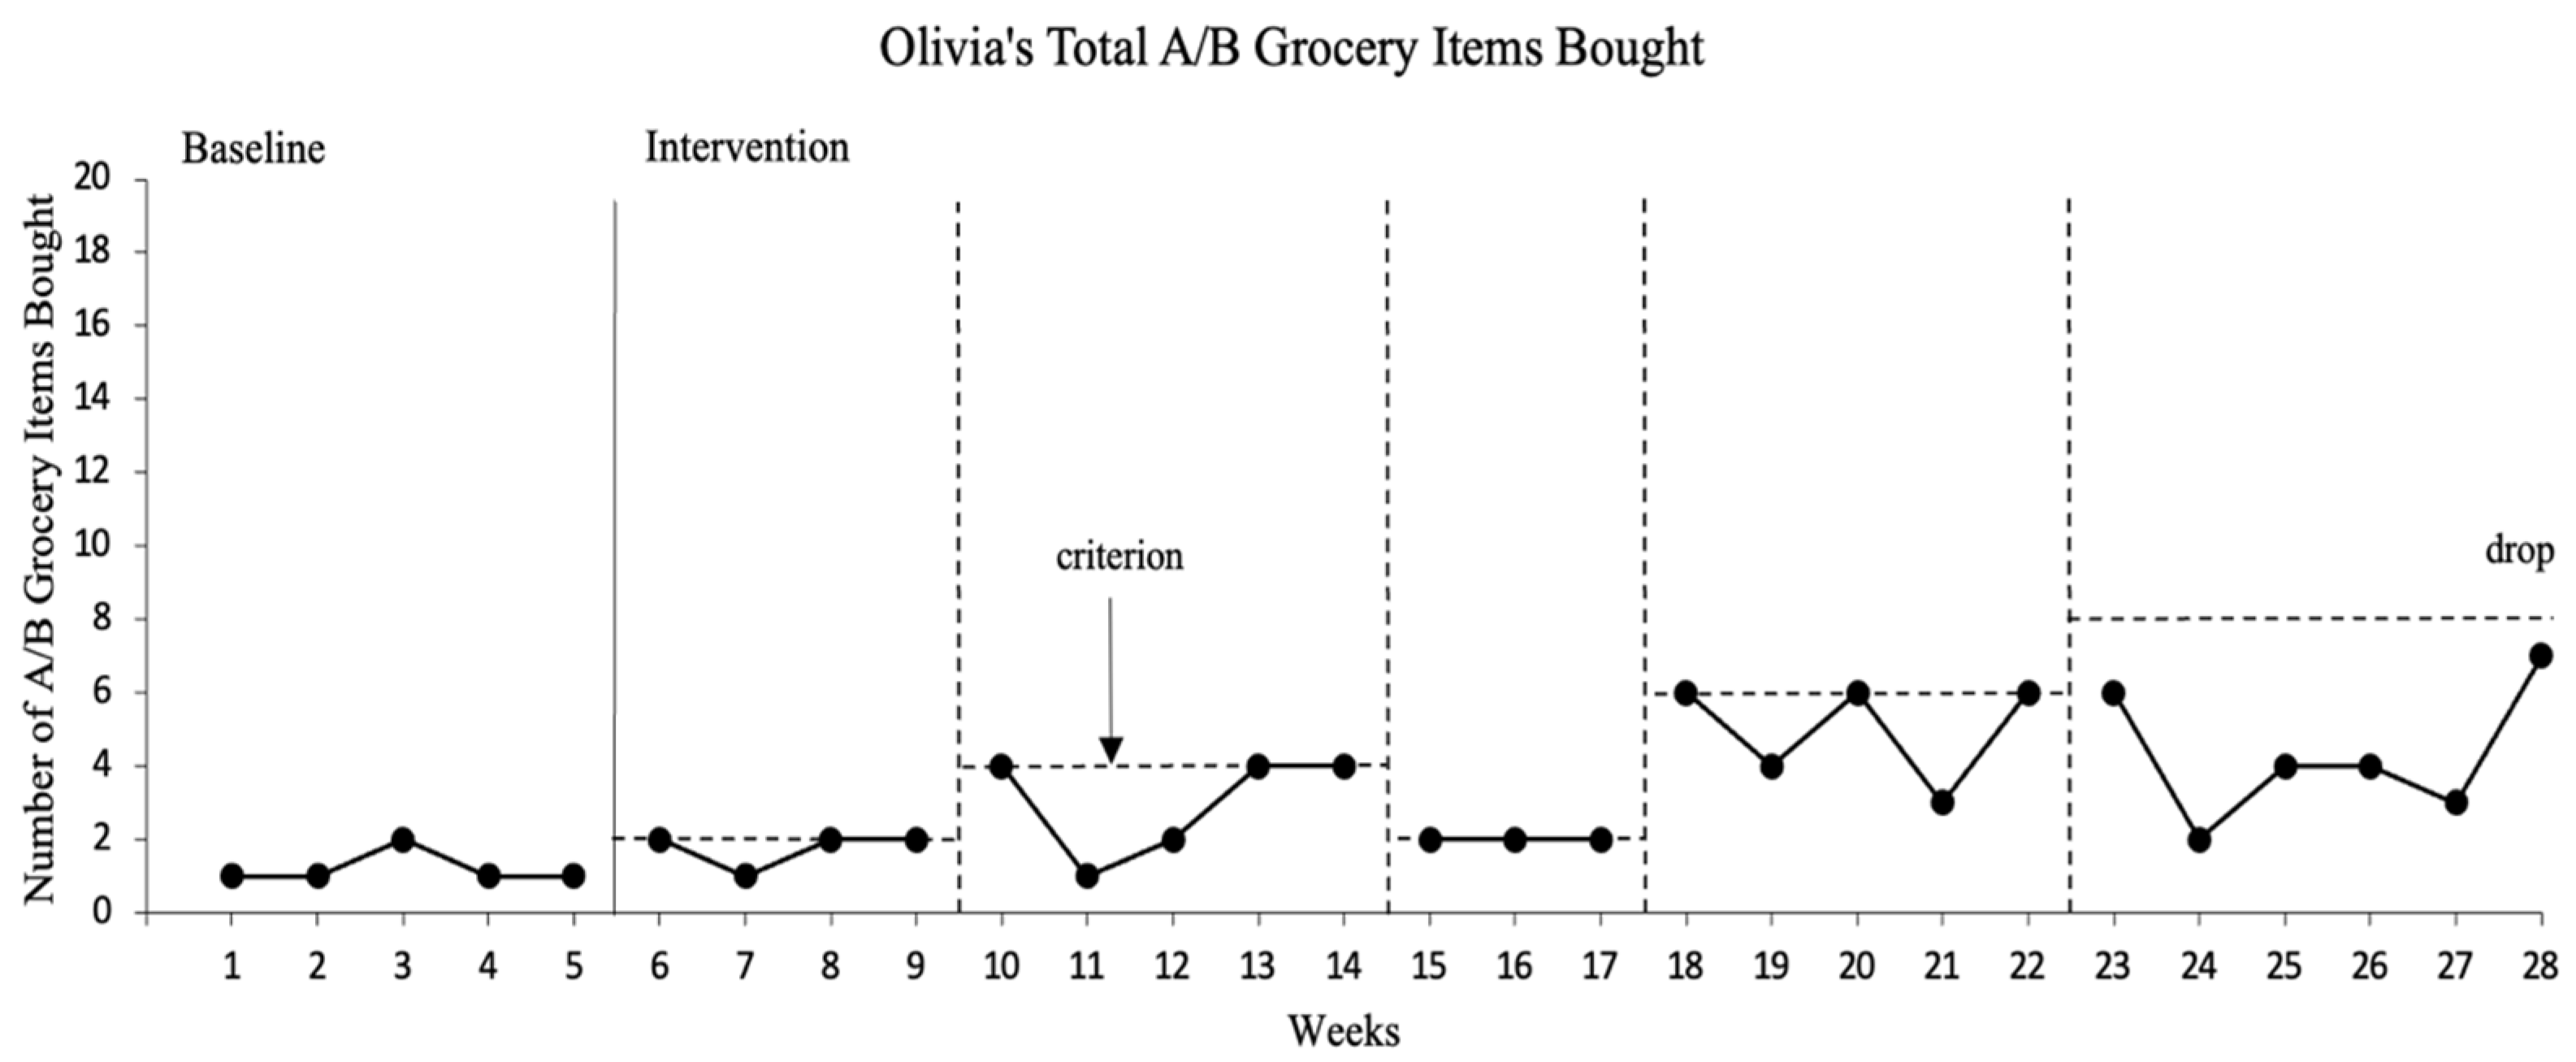
Olivia bought an average of one A/B grocery item per week during baseline sessions (range 1–2). Intervention phase goals started at buying two A/B grocery items per week for the first intervention phase and increased to four A/B items for the second intervention phase. For the third intervention phase, the goal was reduced back to Olivia’s criterion for the first intervention phase (two A/B items) and raised up to six and eight A/B grocery items for the fourth and fifth intervention phases, respectively. Olivia met intervention goals within 3–5 weeks for each intervention phase, except for the fifth intervention phase. Olivia did not meet her goal during the fifth intervention phase and asked to stop the study. Olivia stated she wanted to eat what she liked and was not ready for all the change. No maintenance data were collected for Olivia.
Figure 3 includes a graph of the number of A/B grocery items Olivia bought each week across all study sessions. Also, refer to
Table 4 for Olivia’s frequency counts of grocery items bought each week, categorized by nutrition grades.
Levels for weekly A/B grocery items bought ranged from 1–2 items in baseline, 1–2 items in the first intervention phase, 1–4 items in the next phase, 2 items when the criterion was back down to a goal of buying 2 A/B items, and 3–6 items in the fourth intervention phase. For the fifth intervention phase, levels for A/B items ranged from 2–7 items. There was a zero-celerating trend in the baseline and trends were zero-celerating or accelerating for all intervention phases except for the fourth intervention phase, which had a decelerating trend. The data within phases were variable. The data were stable for the baseline and the first and third intervention phases, but not stable for the second, fourth, and fifth intervention levels at 60%, 60%, and 33.3% respectively. There were overlapping data points between baseline and intervention as well as overlapping data between most intervention phases. From a visual analysis of the data in
Figure 3, we determined there was no functional relation between the intervention (using a mobile health app with self-management) and the number of A/B grocery items Olivia bought each week.
3.3. Elliot
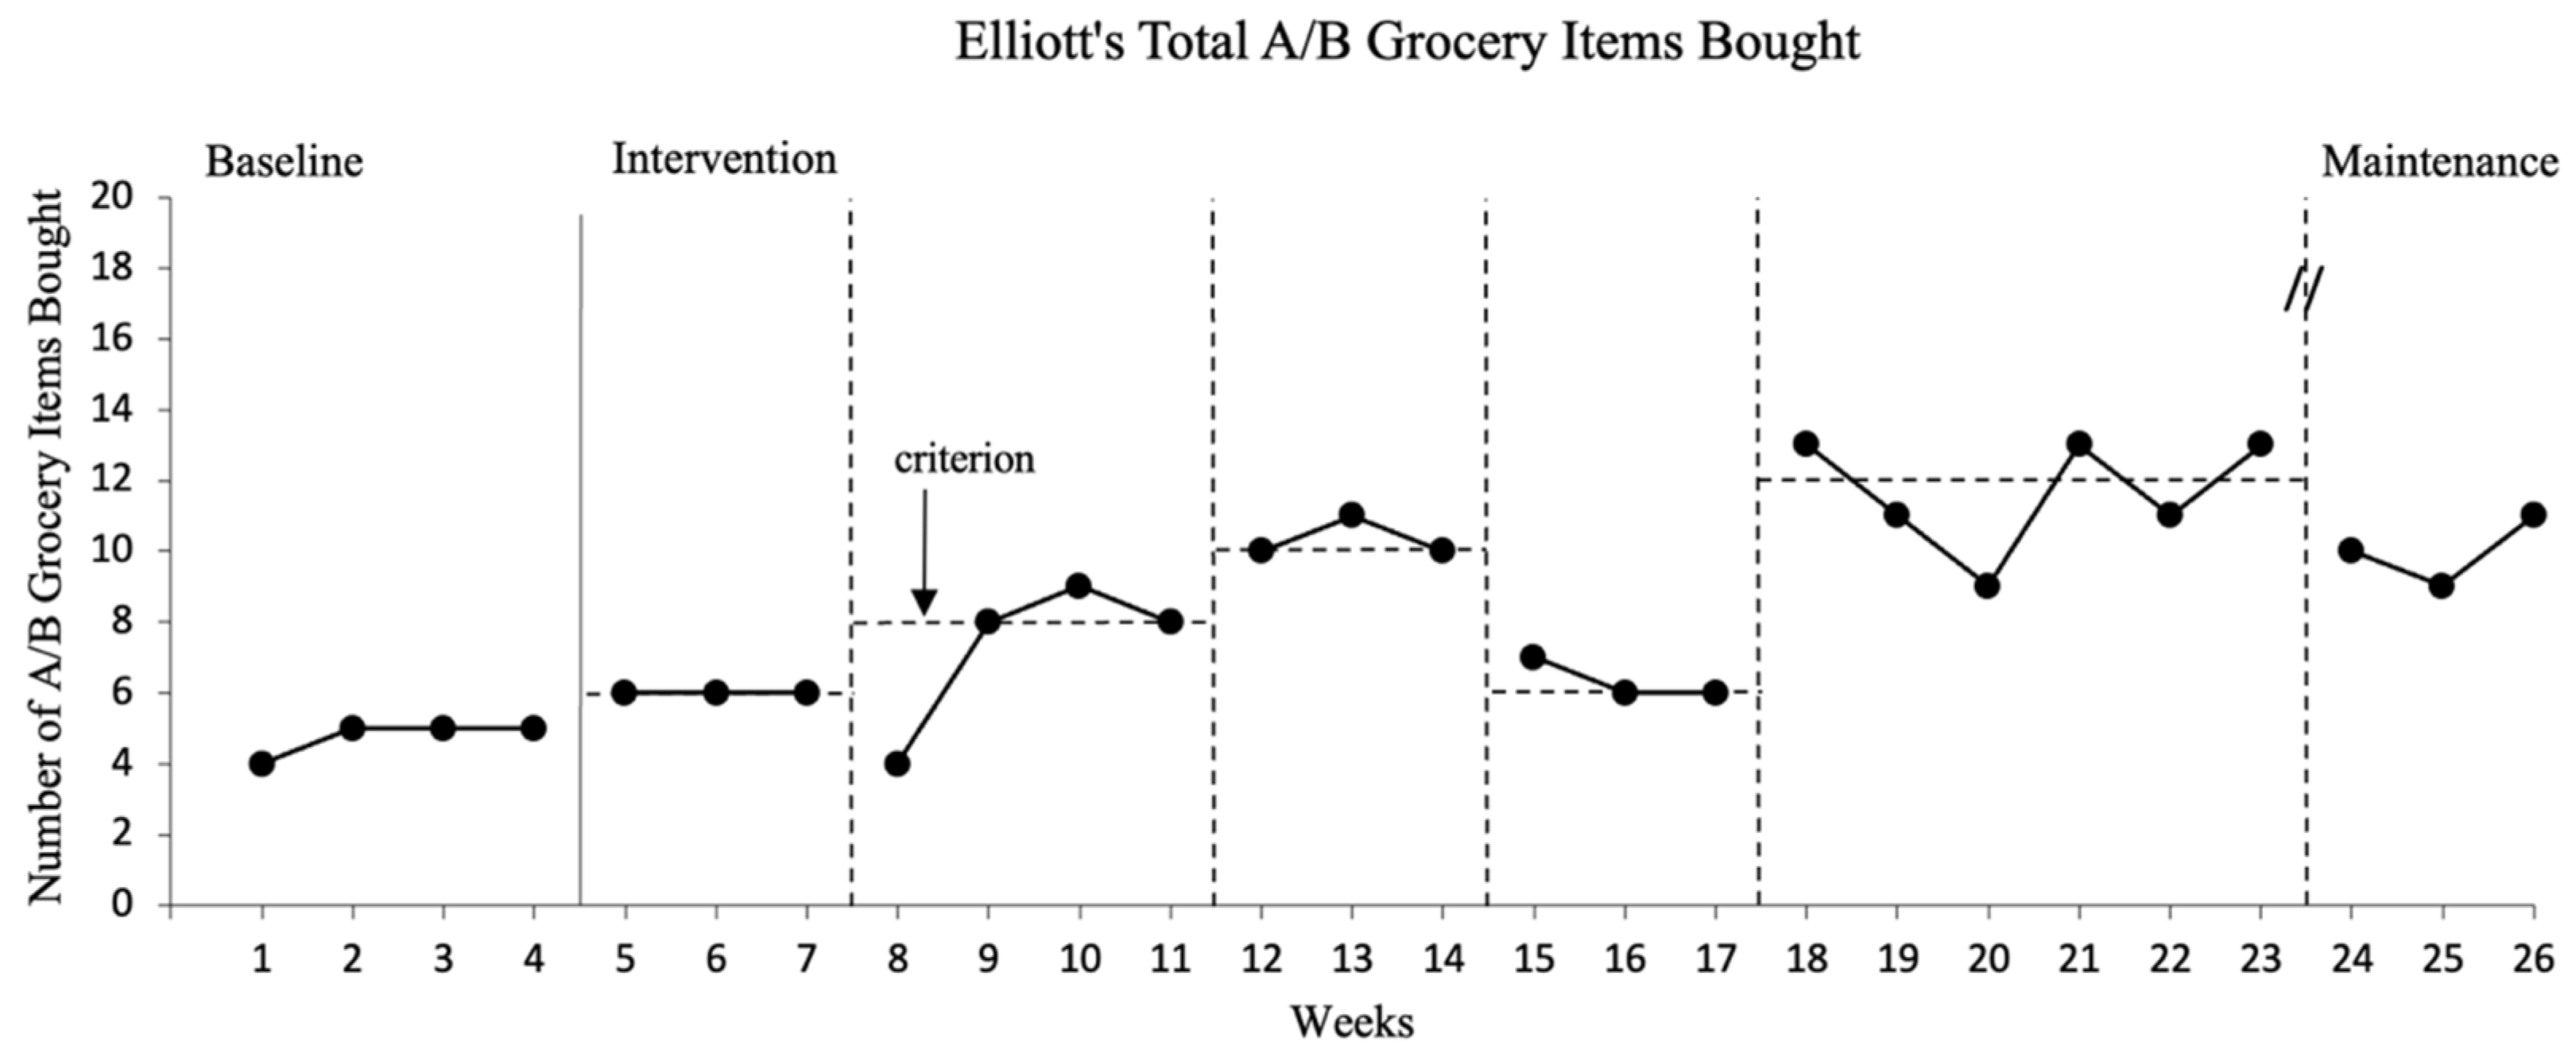
Elliot bought an average of five A/B grocery items per week during baseline sessions (range 4–5). Intervention phase goals started at buying six A/B grocery items per week for the first intervention phase and increased to eight and ten A/B items for the second and third intervention phases, respectively. For the fourth intervention phase, the goal was reduced back to Elliot’s criterion for the first intervention phase (six A/B items) and raised up to twelve A/B grocery items for the fifth intervention phase. Elliot met intervention goals within 3–6 weeks for each intervention phase.
Figure 4 includes a graph of the number of A/B grocery items Elliot bought each week across all study sessions. Also, refer to
Table 5 for Elliot’s frequency counts of grocery items bought each week, categorized by nutrition grades.
Levels for weekly A/B grocery items bought ranged from 4–5 items in baseline, 6 items in the first intervention phase, 4–9 items in the next phase, 10–11 items in the third intervention phase, 6–7 items when criterion back down to a goal of buying 6 A/B items, and 9–13 items in the last intervention phase. The maintenance data for Elliot were promising with a range of 9–11 A/B items bought across each of the three weeks. There was a zero-celerating trend in the last three baseline sessions and either a zero-celerating or accelerating trend within the first three and last intervention phases. There was a decelerating trend during the fourth intervention phase. The data were stable for the baseline and all intervention phases, except the second intervention phase when stability was 75%. There were no overlapping data points between baseline and intervention and one overlapping data point between the first and second intervention phase. From a visual analysis of the data in
Figure 4, we determined there was a functional relation between the intervention (using a mobile health app with self-management) and the number of A/B grocery items Elliot bought each week.
3.4. Social Validity
All three participants filled out the social validity questionnaire before the study began, and Melinda and Elliot filled out the social validity and feasibility/usability questionnaires at the end of the study. Before the study, all participants reported they did not believe they could set their own goals to increase nutrition awareness and/or choices. They did think they would like to use an app on their phone to help them with their goals, but had never done so before this study. At the end of the study, Melinda and Elliot reported they believed they could set their own goals at the end of the study. Food and drink they reported buying regularly included macaroni and cheese, cereal, Doritos®, hot dogs, deli meat, frozen dinners, pizza, candy, and Dr. Pepper®. These items were repeated when asked their favorite food and drink items. Least favorite food and drink items reported were mashed potatoes, green vegetables, water, and coffee. One participant also indicated things hard to make under least favorites.
Melinda and Elliot agreed that (a) they liked the Fooducate app, (b) they felt the app helped them keep track of their health, (c) the app helped them want to make healthier nutrition choices, (d) the app gave them information to help them be healthier, (e) the app could help others make healthier choices, and (f) they wanted to keep using the app after the project was over. Participants did not explore app features outside of the scanning feature. Melinda and Elliot agreed the goal-setting sheets and self-monitoring checklists were easy to understand, and felt they learned something from the intervention and felt the intervention helped them make healthier choices. Melinda stated that she liked the self-monitoring checklist and felt it was the most helpful part of the intervention. Olivia did not complete the post-study social validity questionnaire or the feasibility/usability questionnaire.
4. Discussion
The current study used a nutrition app with a self-management intervention to support adults with IDD in making healthier nutrition choices when shopping for groceries. Components of the self-management intervention included goal setting, self-monitoring, and self-reinforcement. Data were gathered on the effectiveness of the intervention, as well as participant perception of the intervention, including feasibility and usability. The combination of the Fooducate app with the self-management intervention was an effective and feasible intervention for Melinda and Elliot. Olivia stated that she liked the intervention, but was not ready to make bigger changes in her grocery shopping. Olivia stated she was okay with the changes in the beginning, but when the goal was eight A/B grocery items, she preferred less and was not ready for that change.
Before the study started, participants reported a little or some awareness of healthy nutrition and clearly favored unhealthy food and drink options. When listing their favorite food and drink items, participants did not list any food or drink item that would score an A through B− on the Fooducate app. This is similar to previous findings with adults with IDD favoring foods high in sugar and saturated fats [
22,
23,
24]. Participants in this study had full autonomy in their grocery-shopping decisions, so it is not surprising that baseline levels were low based on the participant report of regularly purchased and favorite food and drink items that were high in saturated fats, refined sugars, and sodium. While participants preferred unhealthy food and drink items, they did report wanting to change their nutrition habits. We wanted to work with participants who acknowledged wanting to make healthier nutrition choices because we wanted (a) them to decide for themselves they were ready to try something new to help their nutrition habits, and (b) to increase the likelihood that they were ready for change and that they would stick to potentially changed habits after study completion [
25]. When Olivia exited the study, she was purchasing up to seven A/B food and drink items per week and her baseline average was one A/B item. While there was a lot of variability and overlap in Olivia’s data, she was making some progress. Future research should investigate providing addition supports in similar situations such as a support coach or a peer group who are working towards similar goals.
This study focused on an area where research is limited for adults with IDD. While increasing engagement in physical health behaviors such as exercise has received increased focus in recent years (e.g., [
9,
26,
27]), research on nutrition habits is limited [
5]. This study expands the literature on the use of mobile health apps with additional support for individuals with IDD. Previous researchers have used mobile apps, along with additional strategies such as video modeling and visual schedules to increase engagement in exercise [
6,
27,
28]. Access to the mobile health app, resources on how to use the app, and examples/nonexamples did not support the participant in buying healthier grocery items. During baseline, participants had access to the Fooducate app, visual supports to navigate the app, and examples and nonexamples of healthy items; however, level changes were not present until intervention sessions, when self-management strategies were introduced. This result is similar to findings in previous physical health research (e.g., [
29]). Participants consistently navigated the app appropriately during all phases and filled out the goal sheet, including the self-monitoring checklist, accurately and independently during intervention. Melinda stated the self-monitoring steps on the goal sheet helped remind her to do everything. They all reported they enjoyed using the app and that scanning food and drink items was easy and the grades were easy to understand.
4.1. Implications for Practice and Research
When teaching nutrition, educators and families should consider building skills and additional learning opportunities that go beyond building knowledge. During the initial social validity questionnaires, participants reported that they were aware of healthy nutrition choices and gave examples, but also reported they were not making healthy food and drink choices in their daily lives. This suggests that adults with IDD may need additional opportunities to practice making healthy nutrition choices during childhood to increase exposure to healthier options (e.g., trying different foods, family water-drinking goals, and cooking with a larger variety of foods).
In this study, we used small criterion changes which are suggested for behaviors resistant to change [
19]. In addition to nutrition habits being resistant to change, considerations for small criterion changes also included cost. While participants reported that the small changes over six months did not impact their spending, larger changes needed to follow nutrition recommendations would likely impact what individuals are spending for groceries and only be feasible with higher earnings, more favorable market prices, and nutrition assistance for low-income households [
30].
4.2. Limitations and Future Directions
There were several limitations in this study that warrant attention. First, the intervention incorporated various practices to promote behavior change (goal setting, self-monitoring, and self-reinforcement). Since the practices were not isolated, the most critical component of the intervention is unknown. While we did not perform a component analysis, participants did have preferences for intervention components. For example, Melinda felt the self-monitoring component was the most helpful. In the future, researchers should continue to explore participant preferences when interventions have multiple components as well as isolate those preferences during the study.
Next, only two of the three participants completed all study procedures. While Olivia reported she was ready to make healthier nutrition choices, as the study continued, Olivia reported not being ready for bigger changes. Olivia was able to meet initial goals, but struggled when the goal increased to eight A/B items. Future research should consider taking a more personalized approach for goal setting, including the level of goal change between phases, as well as individual needs based on body mass index, anthropodemetric data (e.g., weight and body shape), biochemical data (e.g., blood sample to measure glucose), and nutrigenetic data.
Next, we do not know if the change in grocery-shopping habits led to eating those healthier items. The purpose of this study was to increase the number of healthier food and drink items bought and we did not observe if participants consumed those items. While we did not observe consumed nutrition habits, having healthier food and drink items in their home may be a good first step to potential change in consumed nutrition habits. Future researchers should examine the effects of interventions on changes in consumed nutrition habits.
Finally, while it was beneficial that this study was conducted in real-world contexts, this study did not formally evaluate generalization to other health behaviors or tasks within the Fooducate app or other mobile health apps. The nutrition tracker allowed users to track water, food, and exercise. While the Fooducate app supports users in other behaviors (e.g., food tracker), we only piloted the scanner feature of this app and the results are related to this feature of the app specifically and should not be generalized to other Fooducate app features. In the future, researchers should explore additional app features before engaging in a larger study requiring their use.


