Article

Impacts of Charge Air Parameters on Combustion and Emission Characteristics of a Diesel Marine Engine

1
Maritime Academy, Ho Chi Minh City University of Transport, Ho Chi Minh 717400, Vietnam
2
Board of Directors, Ho Chi Minh City University of Transport, Ho Chi Minh 717400, Vietnam
*
Authors to whom correspondence should be addressed.
Thermo 2023, 3(3), 494-514; https://doi.org/10.3390/thermo3030030
Submission received: 28 July 2023 / Revised: 7 September 2023 / Accepted: 12 September 2023 / Published: 19 September 2023

Abstract

:
In this study, the operating processes of a four-stroke diesel marine engine from the intake valve closing (IVC) to the exhaust valve opening (EVO) at numerous different charge air conditions were simulated with the AVL FIRE code. The CFD models were validated with engine shop-test technical data. The results showed that increasing the charge air pressure without cooling decreased the actual amount of air supplied to the cylinder. As a result, the combustion process was suboptimal, resulting in a reduction in engine power and an increase in specific fuel oil consumption (SFOC). In addition, less air to cool the combustion chamber coupled with elevated charge air temperatures increased the in-cylinder peak temperature, leading to a significant increase in thermal nitric oxide (NO) emissions. In contrast, by cooling the charge air after turbocharging, the actual amount of air entering the engine cylinders was increased. The abundant charge air helped to cool the combustion chamber better, significantly reducing the in-cylinder peak temperature and then the thermal NO formation. Better combustion also increased engine power, which, in turn, reduced SFOC. In addition, carbon dioxide (CO2) and soot emissions were also reduced.

1. Introduction

To protect human health and the living environment, the International Maritime Organization (IMO) has recently introduced stringent emission regulations for ships. In addition, many countries and regions have also released their own stricter local emission regulations (Emission Control Areas (ECAs), for instance) [1,2].
Internal combustion engines (ICEs) convert the chemical energy of fuels into thermal energy through the combustion of the fuel–air mixture in the engine cylinders. This thermal energy is then converted into mechanical work on the engine shaft through the piston, connecting rod, and crankshaft movements. In this process, the combustion of fuel releases pollutants into the environment. Therefore, the power and emission characteristics of an engine are directly affected by the combustion of fuel [3,4,5].
For a given fuel, its combustion is strongly influenced by the charge air parameters, i.e., charge air pressure, temperature, density, etc. [6,7,8]. This effect becomes greater in turbocharged engines. Turbocharged engines increase the pressure of the charge air to increase the weight (or density) of the air introduced into the engine cylinder, which enables a greater weight of fuel to be burned. This thus increases the power output of the engine [9,10,11]. The increase in charge air density is, however, fractionally offset by the increase in air temperature caused by adiabatic compression in the turbocharger [3].
The combustion of fuels inside the cylinders of ICEs is influenced by a series of factors, such as engine type, fuel type, fuel injector, fuel injection strategy, combustion chamber shape, etc. [4,12,13,14,15,16]. The authors carried out a series of research studies on the effects of these factors on the combustion, emissions, and performance of marine engines. In [17], the combustion and emission characteristics of a dual-fuel natural gas (NG)–diesel marine engine were investigated. The results showed a significant benefit in the environmental protection aspect when using NG as the primary fuel in diesel engines. The effects of various alternative fuels on the combustion and emission formation inside the cylinder of marine engines were studied in [18]. The research results showed better combustion, emission performance, and reduction trends in exhaust gas pollutants when using cleaner alternative fuels to partly substitute diesel fuel in marine engines. Regarding the influence of fuel injection on the combustion and emissions of engines, an optimization of fuel injection angle and position was investigated in [19]. The effects of piston bowl shape on the combustion and emission characteristics of engines were studied in [20]. In that study, we recommended using the re-entrant piston bowl design for direct-injection (DI) diesel engines to reduce NO emissions while improving fuel oil consumption and engine performance. Meanwhile, the benefits of using hydrogen (H2), a carbon-free fuel, as an alternative fuel in two-stroke diesel engines to reduce exhaust gas emissions, especially CO2, was demonstrated in [21,22,23,24,25]. In these studies, the effect of scavenging air temperature on the combustion and emission of the engine was also studied. In another area of research, the effect of engine speed on engine performance and emissions was investigated in [26].
This study investigates the impacts of charge air parameters on the combustion and emission characteristics of a direct-injection (DI) diesel marine engine. The research object is a high-speed V-type 12-cylinder turbocharged marine diesel engine. The engine has a cylinder bore of 128 mm and a piston stroke of 142 mm with a rated speed of 1800 rpm. It produces 530 kW rated power at the rated speed. The combustion and emission characteristics of the engine were analyzed with CFD analysis. The engine’s operating processes from the IVC to the EVO at numerous different charge air pressures and temperatures were simulated with the AVL FIRE code [27]. The CFD models were validated by the engine testing data reported in the engine shop-test technical file.
The research results show that, when increasing the charge air pressure without cooling the charge air after turbocharging, the increase in air density during turbocharging does not compensate for the decrease in air density due to the increase in temperature at the end of the turbocharging. This causes the actual amount of air supplied to the cylinder to decrease. As a result, although the in-cylinder peak pressure increases, the combustion process is suboptimal, leading to a reduction in the power of the engine. Reduced engine power increases specific fuel oil consumption (SFOC). Less air to cool the combustion chamber, coupled with elevated charge air temperatures, increases the in-cylinder peak temperature, resulting in a significant increase in thermal NO emissions. The TKE of the fluid flow in the engine cylinder also decreases as the charge air pressure increases.
In contrast, by cooling the charge air after turbocharging, the density of the air can be significantly increased because the charge air pressure is increased while the temperature remains constant. The increased air density increases the actual amount of air entering the engine cylinders. The abundant charge air helps to cool the combustion chamber better, causing the peak temperature in the engine cylinder to decrease significantly. The reduced peak temperature reduces the formation of thermal NO. Better combustion increases engine power, which, in turn, reduces specific fuel oil consumption. In addition, better combustion also reduces CO2 and soot emissions.
This article not only studies the influence of intake air parameters on engine combustion and emissions but also proposes a useful solution to increase engine power while reducing gas emissions. Our research highlighted that if the charge air after being turbocharged was not cooled, the turbocharging would not bring energy and economic benefits. When cooling the charge air after turbocharging, not only is the engine power enhanced, but the specific fuel oil consumption and engine emissions are also significantly reduced.

2. Computational Fluid Dynamic (CFD) Analysis

2.1. Major Specifications of the Engine

The research object of this work is a high-speed V-type 12-cylinder turbocharged marine diesel engine. The engine produces 530 kW rated power at a rated speed of 1800 rpm. The combustion and emission characteristics of the research engine were investigated by means of CFD analysis. The compression, combustion, and expansion processes of the engine from the IVC to the EVO were simulated with the AVL FIRE code. Numerous simulations with different charge air pressures and temperatures were carried out. The specifications of the research engine are presented in Table 1.

2.2. CFD Models

The AVL FIRE R2022 software with advanced CFD models has been shown to be suitable for modeling the combustion of various types of fuels and formation of emissions in the cylinders of ICEs with very high accuracy [28]. In this study, the ESE Diesel platform (engine simulation environment) provided by AVL FIRE was employed to simulate the compression, combustion, and expansion processes from the IVC to the EVO of the engine.
Developed from the k-ε turbulence model, the k-ζ-f model was utilized to calculate the turbulence intensity of the fluid (air, fuel, combustion gas) flow in the engine cylinder. This is a four-equation turbulence model, so it has better stability and higher prediction accuracy than the original k–ε two-equation model [29]. The Three-Zone Extended Coherent Flame Model (ECFM-3Z) [30,31] was used to simulate the combustion process of the engine. This model is an improvement of the Coherent Flame Model (CFM). As a result, it contains not only all the good features but also enhancements of the CFM. It was successfully utilized in many previous studies with high prediction accuracy [17,18,32]. This model was presented and can be found in Appendix B of our previous publication [17]. The DI process of fuel was simulated with the Diesel Nozzle Flow Model [31,33]. Meanwhile, the evaporation process and breakup phenomena of the injected fuel droplets were calculated with the Dukowicz and WAVE models [31,33], respectively.
The formation of thermal NO during the combustion process of the engine was calculated with the extended Zeldovich mechanism [31,34]. This is a seven-species and three-reaction mechanism, which was proven to be able to accurately predict the thermal NO formation in ICEs over a wide range of fuel-to-air equivalence ratios with high accuracy in many works [19,21,35,36,37,38]. Soot formation inside the cylinder during the combustion and expansion processes of the engine was calculated using the kinetic soot mechanism [31,34]. These mechanisms are presented and can be found in Appendices C and D of our previous study, respectively [17]. The interaction phenomena between injected fuel droplets and combustion chamber walls were calculated with the Walljet1 model [31,33], which was developed from the Naber and Reitz spray/wall impingement model [39]. Other CFD models employed in this research can be found in [31,33,34]. Table 2 summarizes the CFD models utilized in this study.

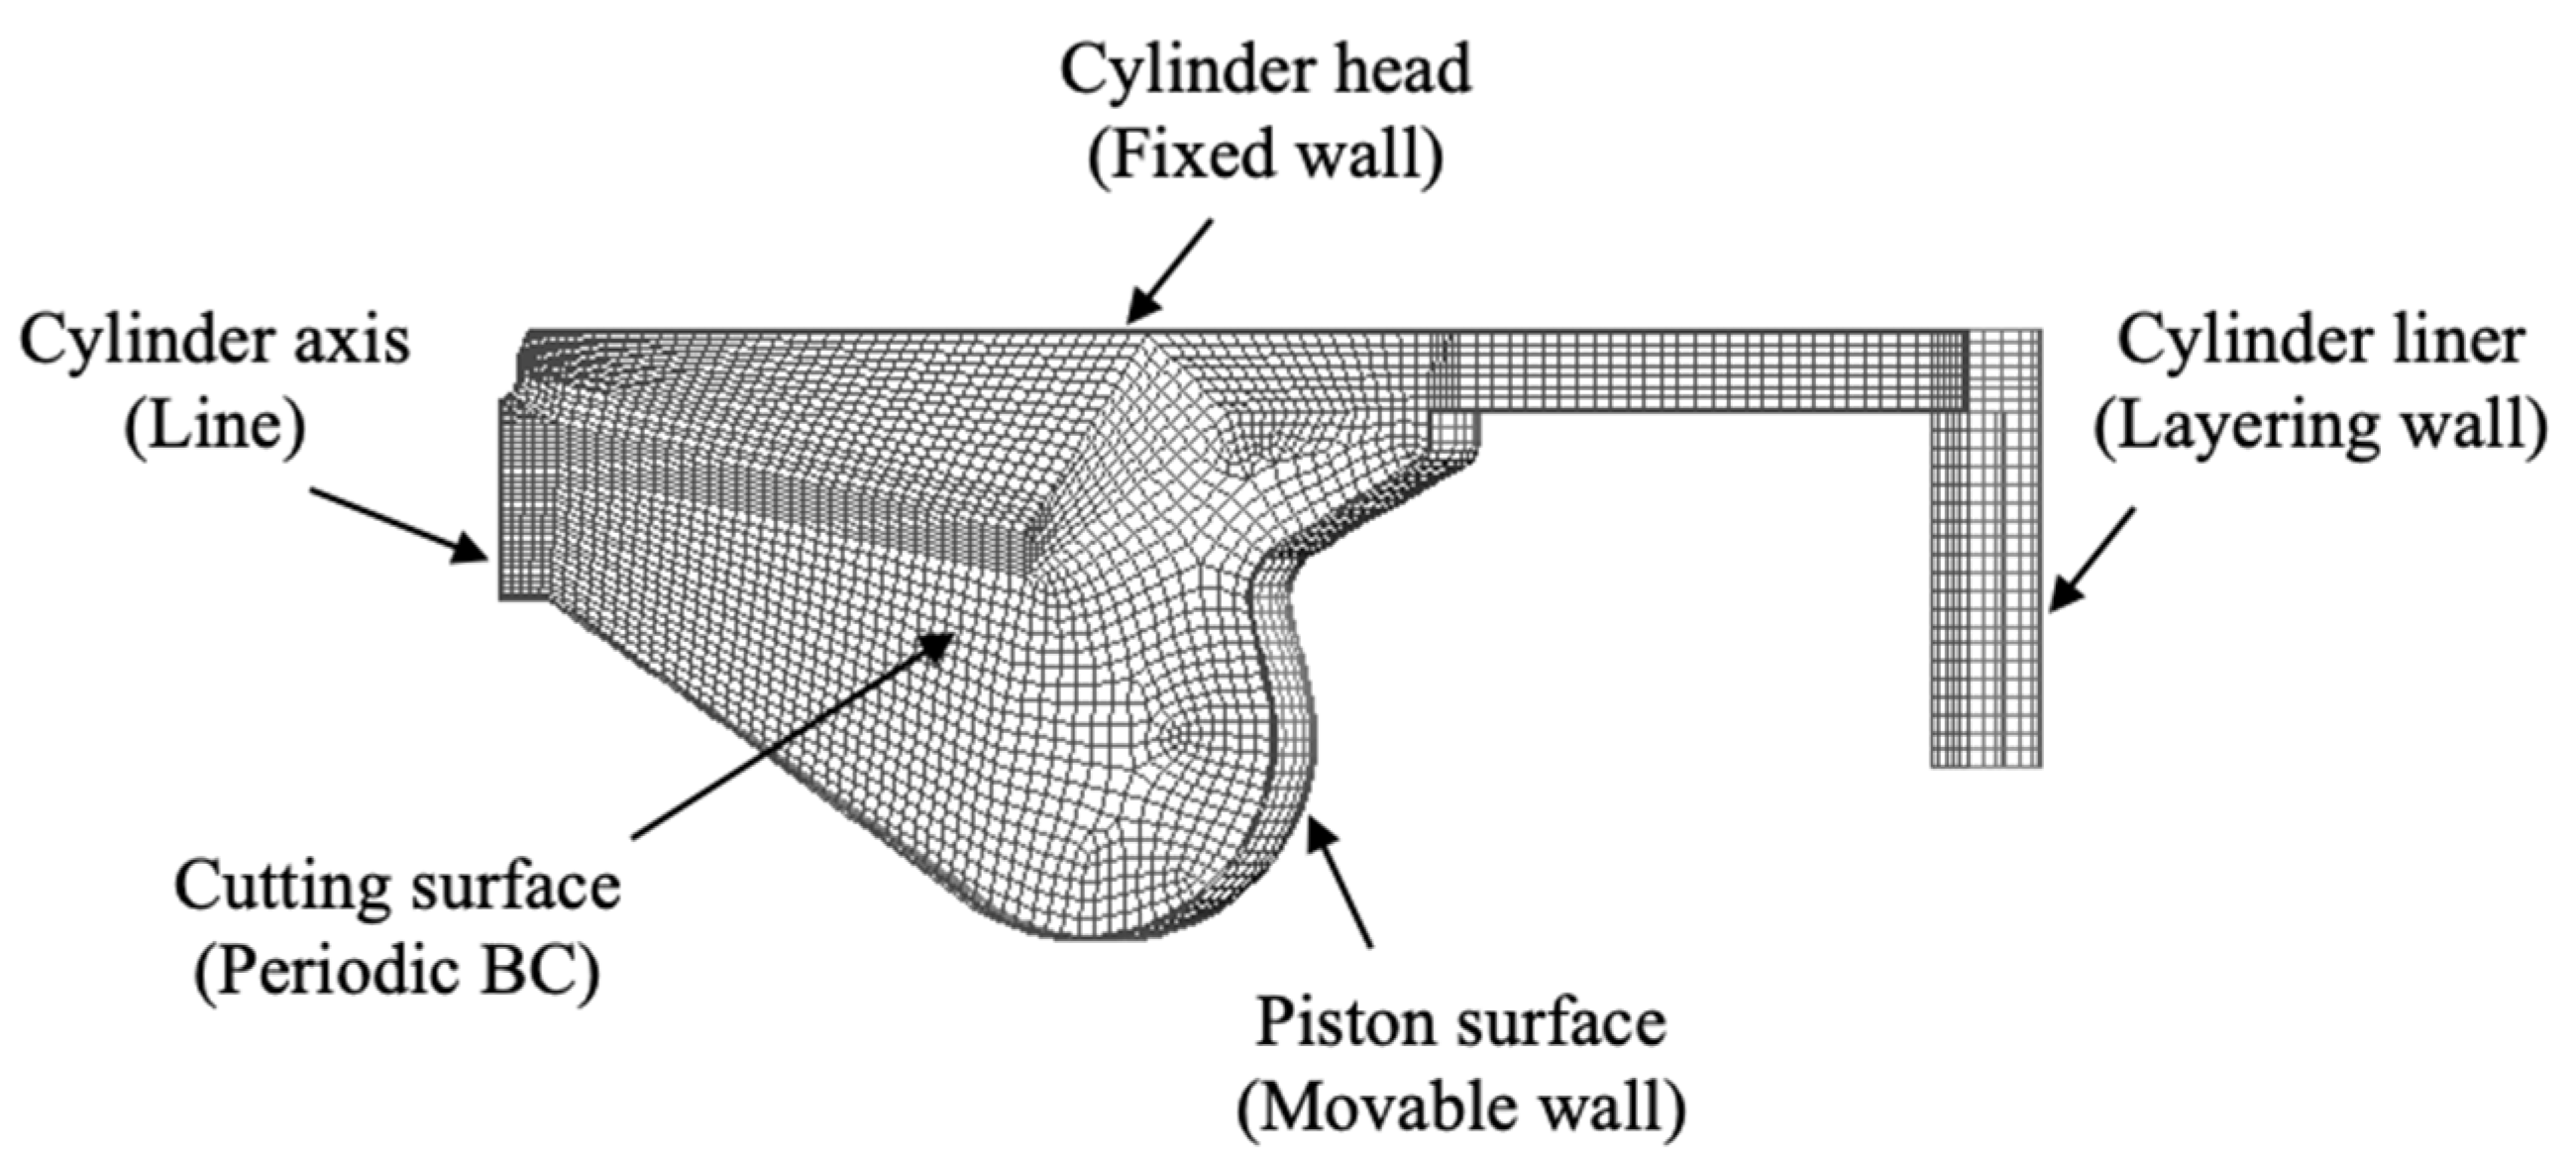
2.3. Computational Mesh, Boundary, and Initial Conditions

The three-dimensional (3D) mesh of the combustion chamber for CFD simulation was created in the ESE-Diesel platform of the AVL FIRE 2022. Owing to the engine cylinder being axially symmetrical, the nozzle of the fuel injector has 10 identical holes, and to reduce the calculation time, only a one-tenth portion of the entire combustion chamber of the engine was meshed. The simulation began at the IVC and ended at the EVC of the engine. The simulation was performed in parallel with a 12-core AMD Ryzen 7 5800H processor and took approximately 20 h of CPU time. The 3D computational mesh at the TDC of the engine is presented in Figure 1.
Regarding the boundary type of the computational domain, the impermeable wall type was assigned to the piston surface, cylinder liner, and cylinder head. The piston surface was a movable wall, the cylinder head surface comprised fixed walls, and the cylinder liner surface was a layering wall. Because the cylinder geometry is axially symmetrical, the two cutting surfaces of the computational domain were assigned as periodic (cyclic) boundary conditions (BCs). The fuel was injected directly into the engine combustion chamber at 12 CADs (crank angle degrees) BTDC (before the top dead center) with an injection duration of 30 CADs. The movement of the piston surface was modeled with the layering dynamic mesh method. Using this method, the mesh’s aspect ratio, orthogonal, and skewness qualities are kept almost unchanged during the calculation. In addition, three inflation (boundary) layers with a thickness of 1.2 mm were created on the cylinder liner and piston surfaces to eliminate their near-wall effects. The mesh properties and qualities are presented in Table 3.
The BCs and initial conditions for the simulations in this research were obtained from the engine test technical data of the research engine. Diesel oil (fuel) was represented by C13H23. All physical properties of fuel were set as temperature-dependent to measure the real response of diesel oil to the temperature change during the combustion of the engine. The main properties of diesel oil were presented in detail and can be found in our previous publication [18]. Table 4 lists the BCs and initial conditions for the CFD simulations in this research.

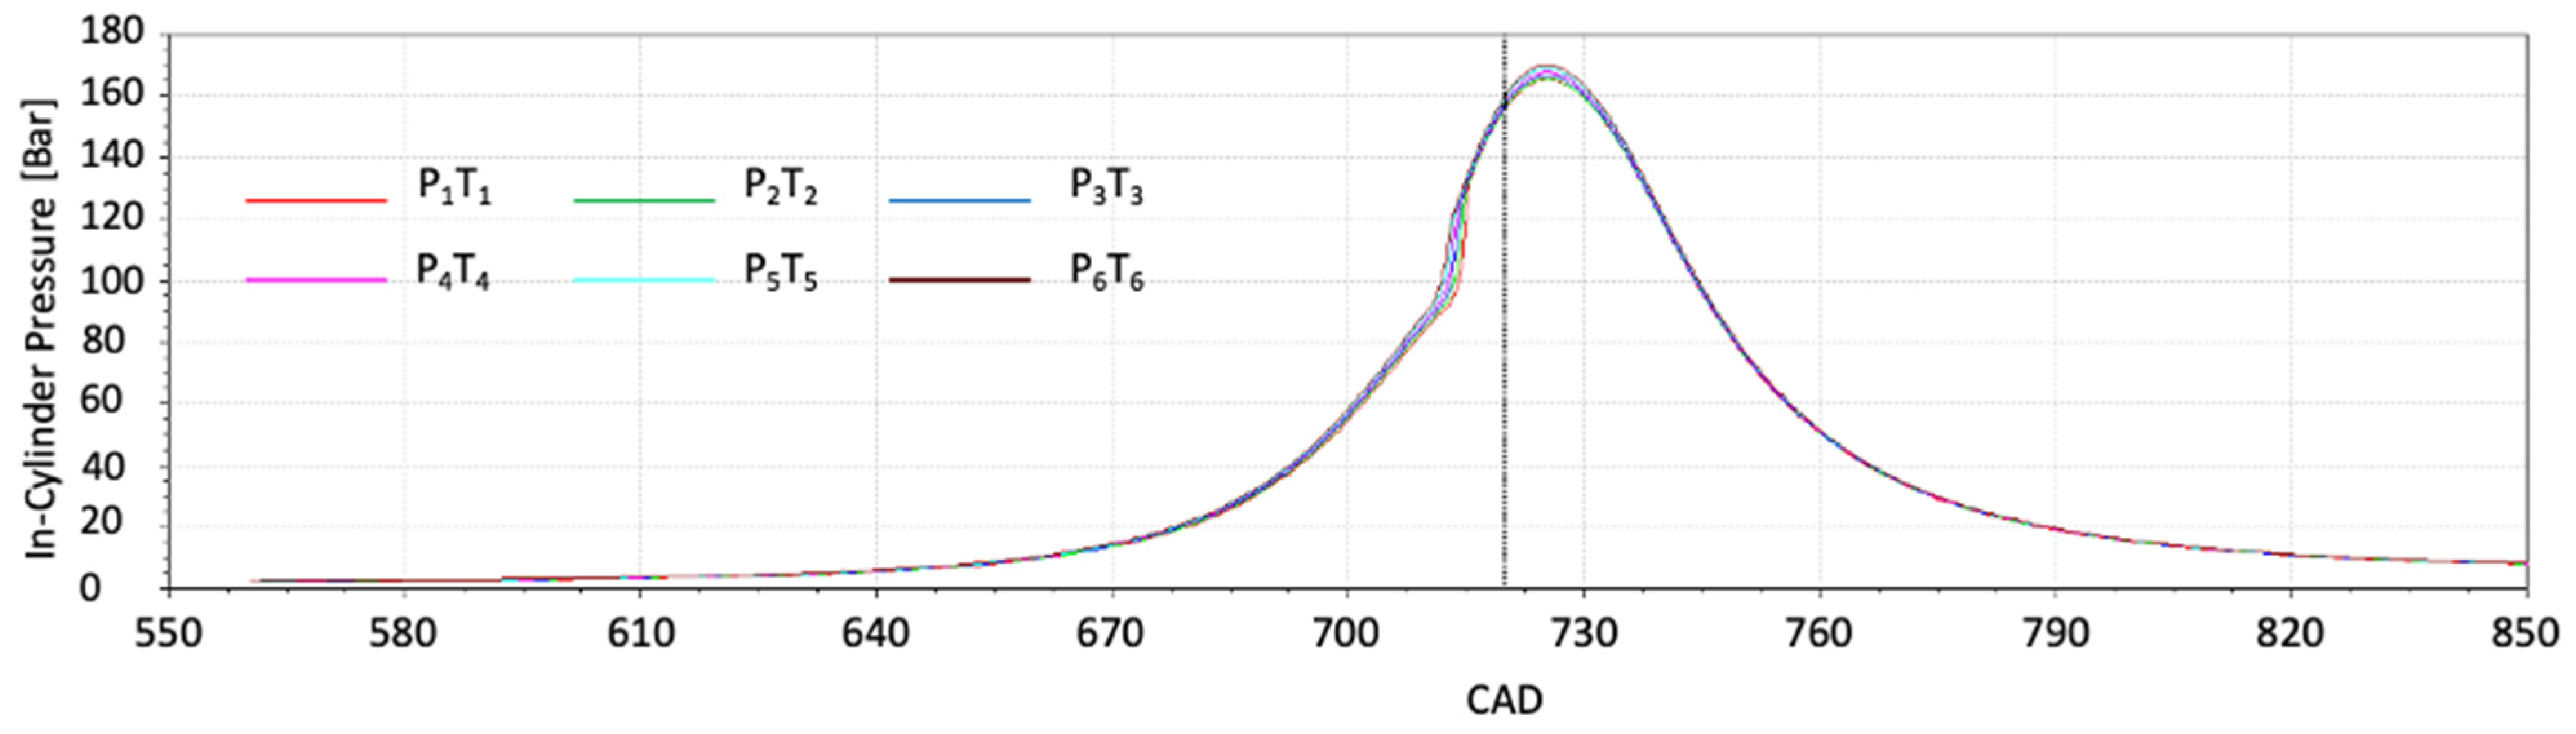
2.4. Simulation Cases

In this study, a total of 12 simulations were performed. These simulations were divided into two categories according to the change in temperature and/or pressure of the charge air. Each category included six simulations, which are presented in Table 5. P1T1 is the baseline for both study categories: (1) changing both scavenging air pressure and temperature, and (2) changing scavenging air pressure while keeping its temperature.
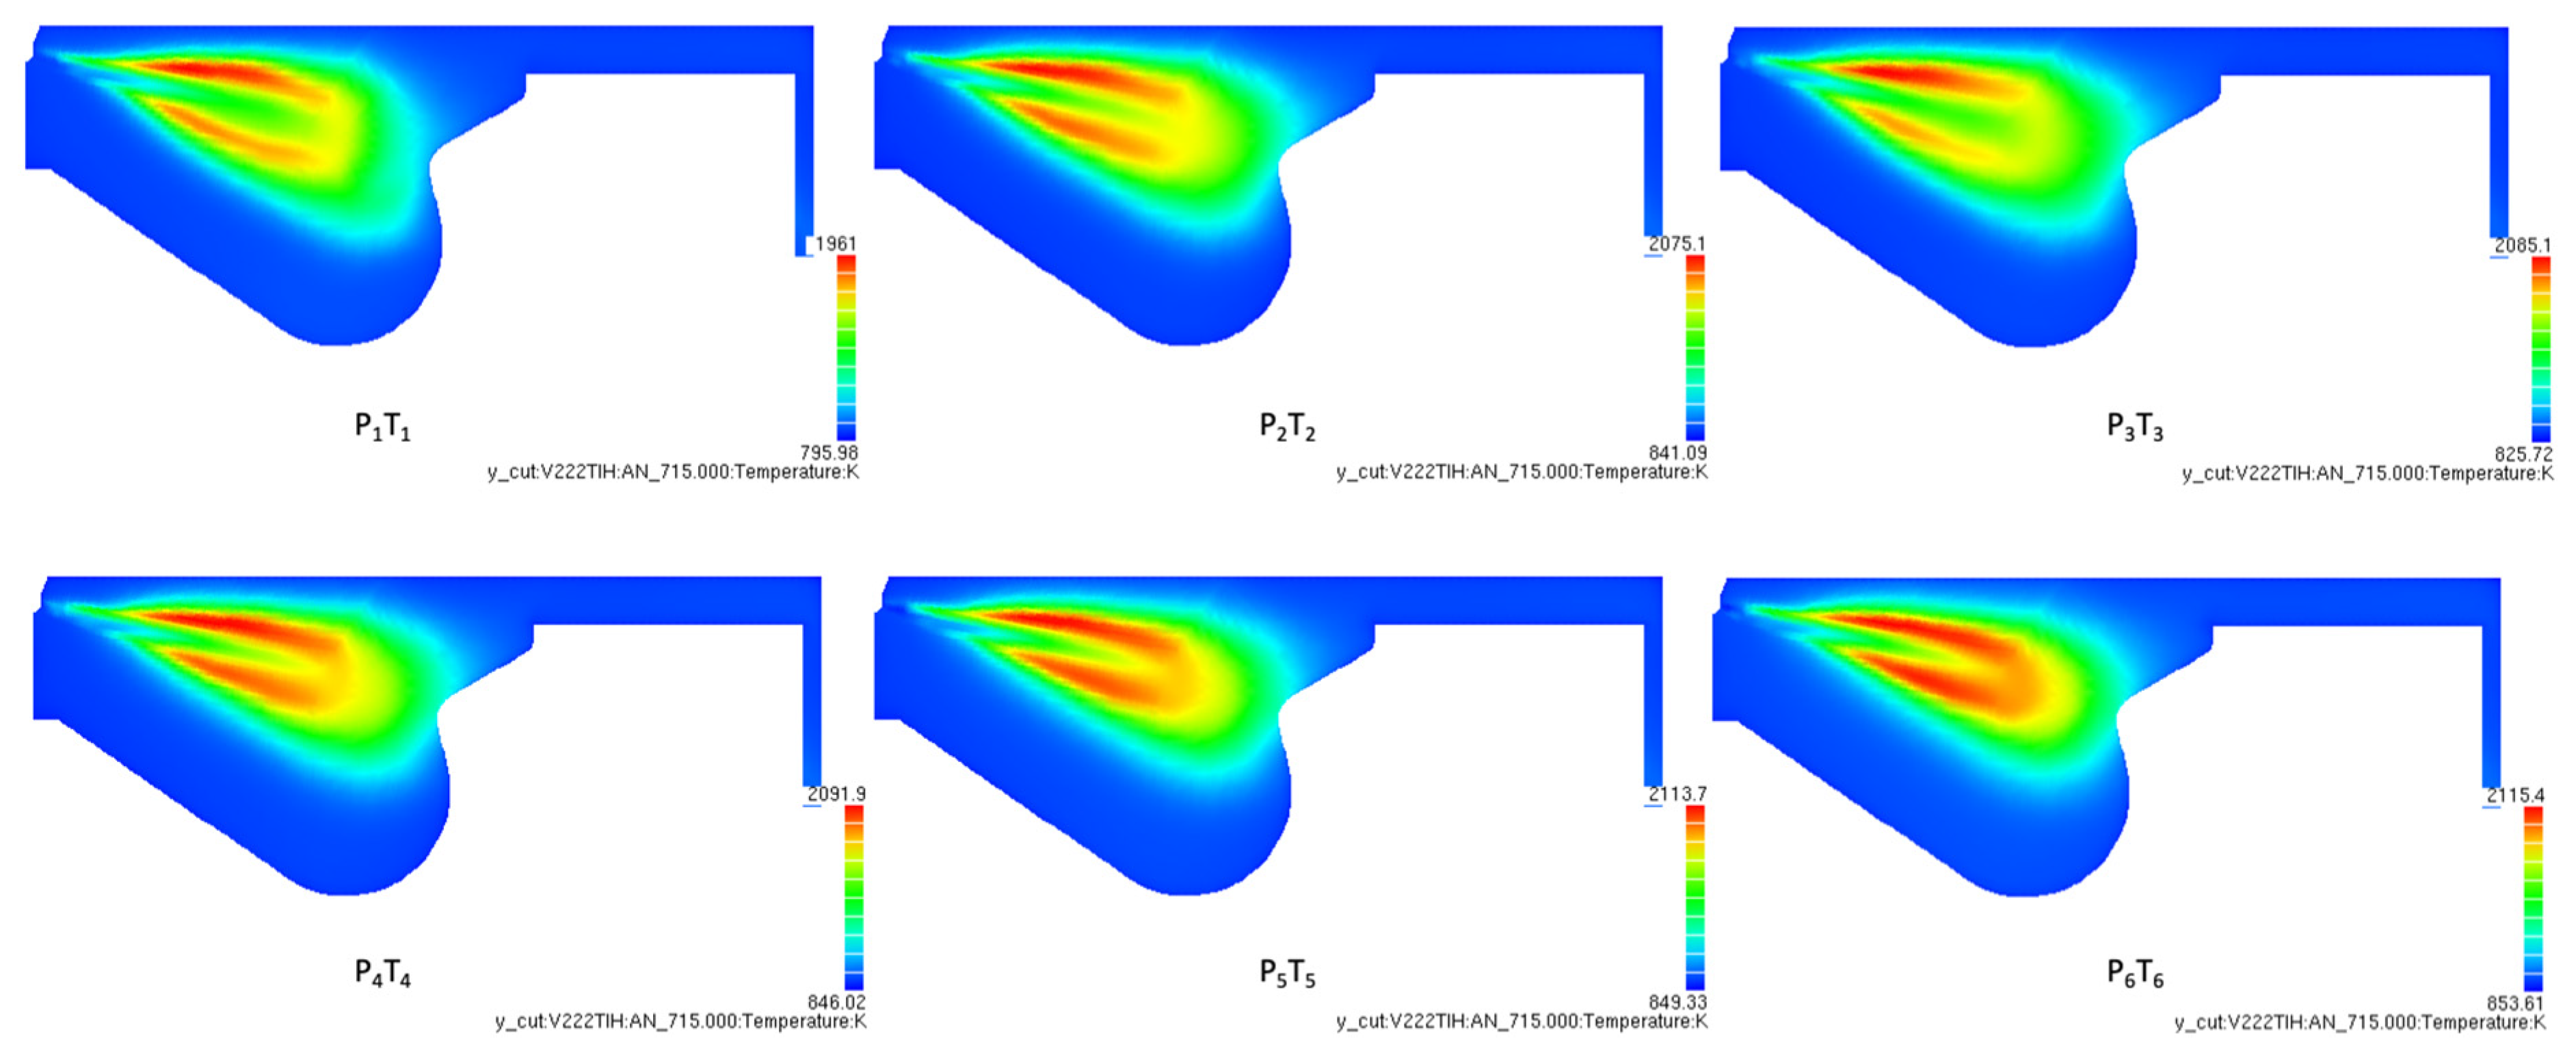
In Category 1, including cases P1T1, P2T2, P3T3, P4T4, P5T5, and P6T6, both the pressure and temperature of the charge air were changed. The relationship between temperature and pressure of the charge (fresh) air is expressed by the ideal gas equation ( P . V = n . R . T ), in which P [N/m2], V [m3], n [mol], R [J/mol.K], and T [K] are pressure, volume, the number of moles of the air, the universal (or perfect) gas constant, and temperature of the air, respectively. This category implies that the charge air was not cooled after turbocharging.
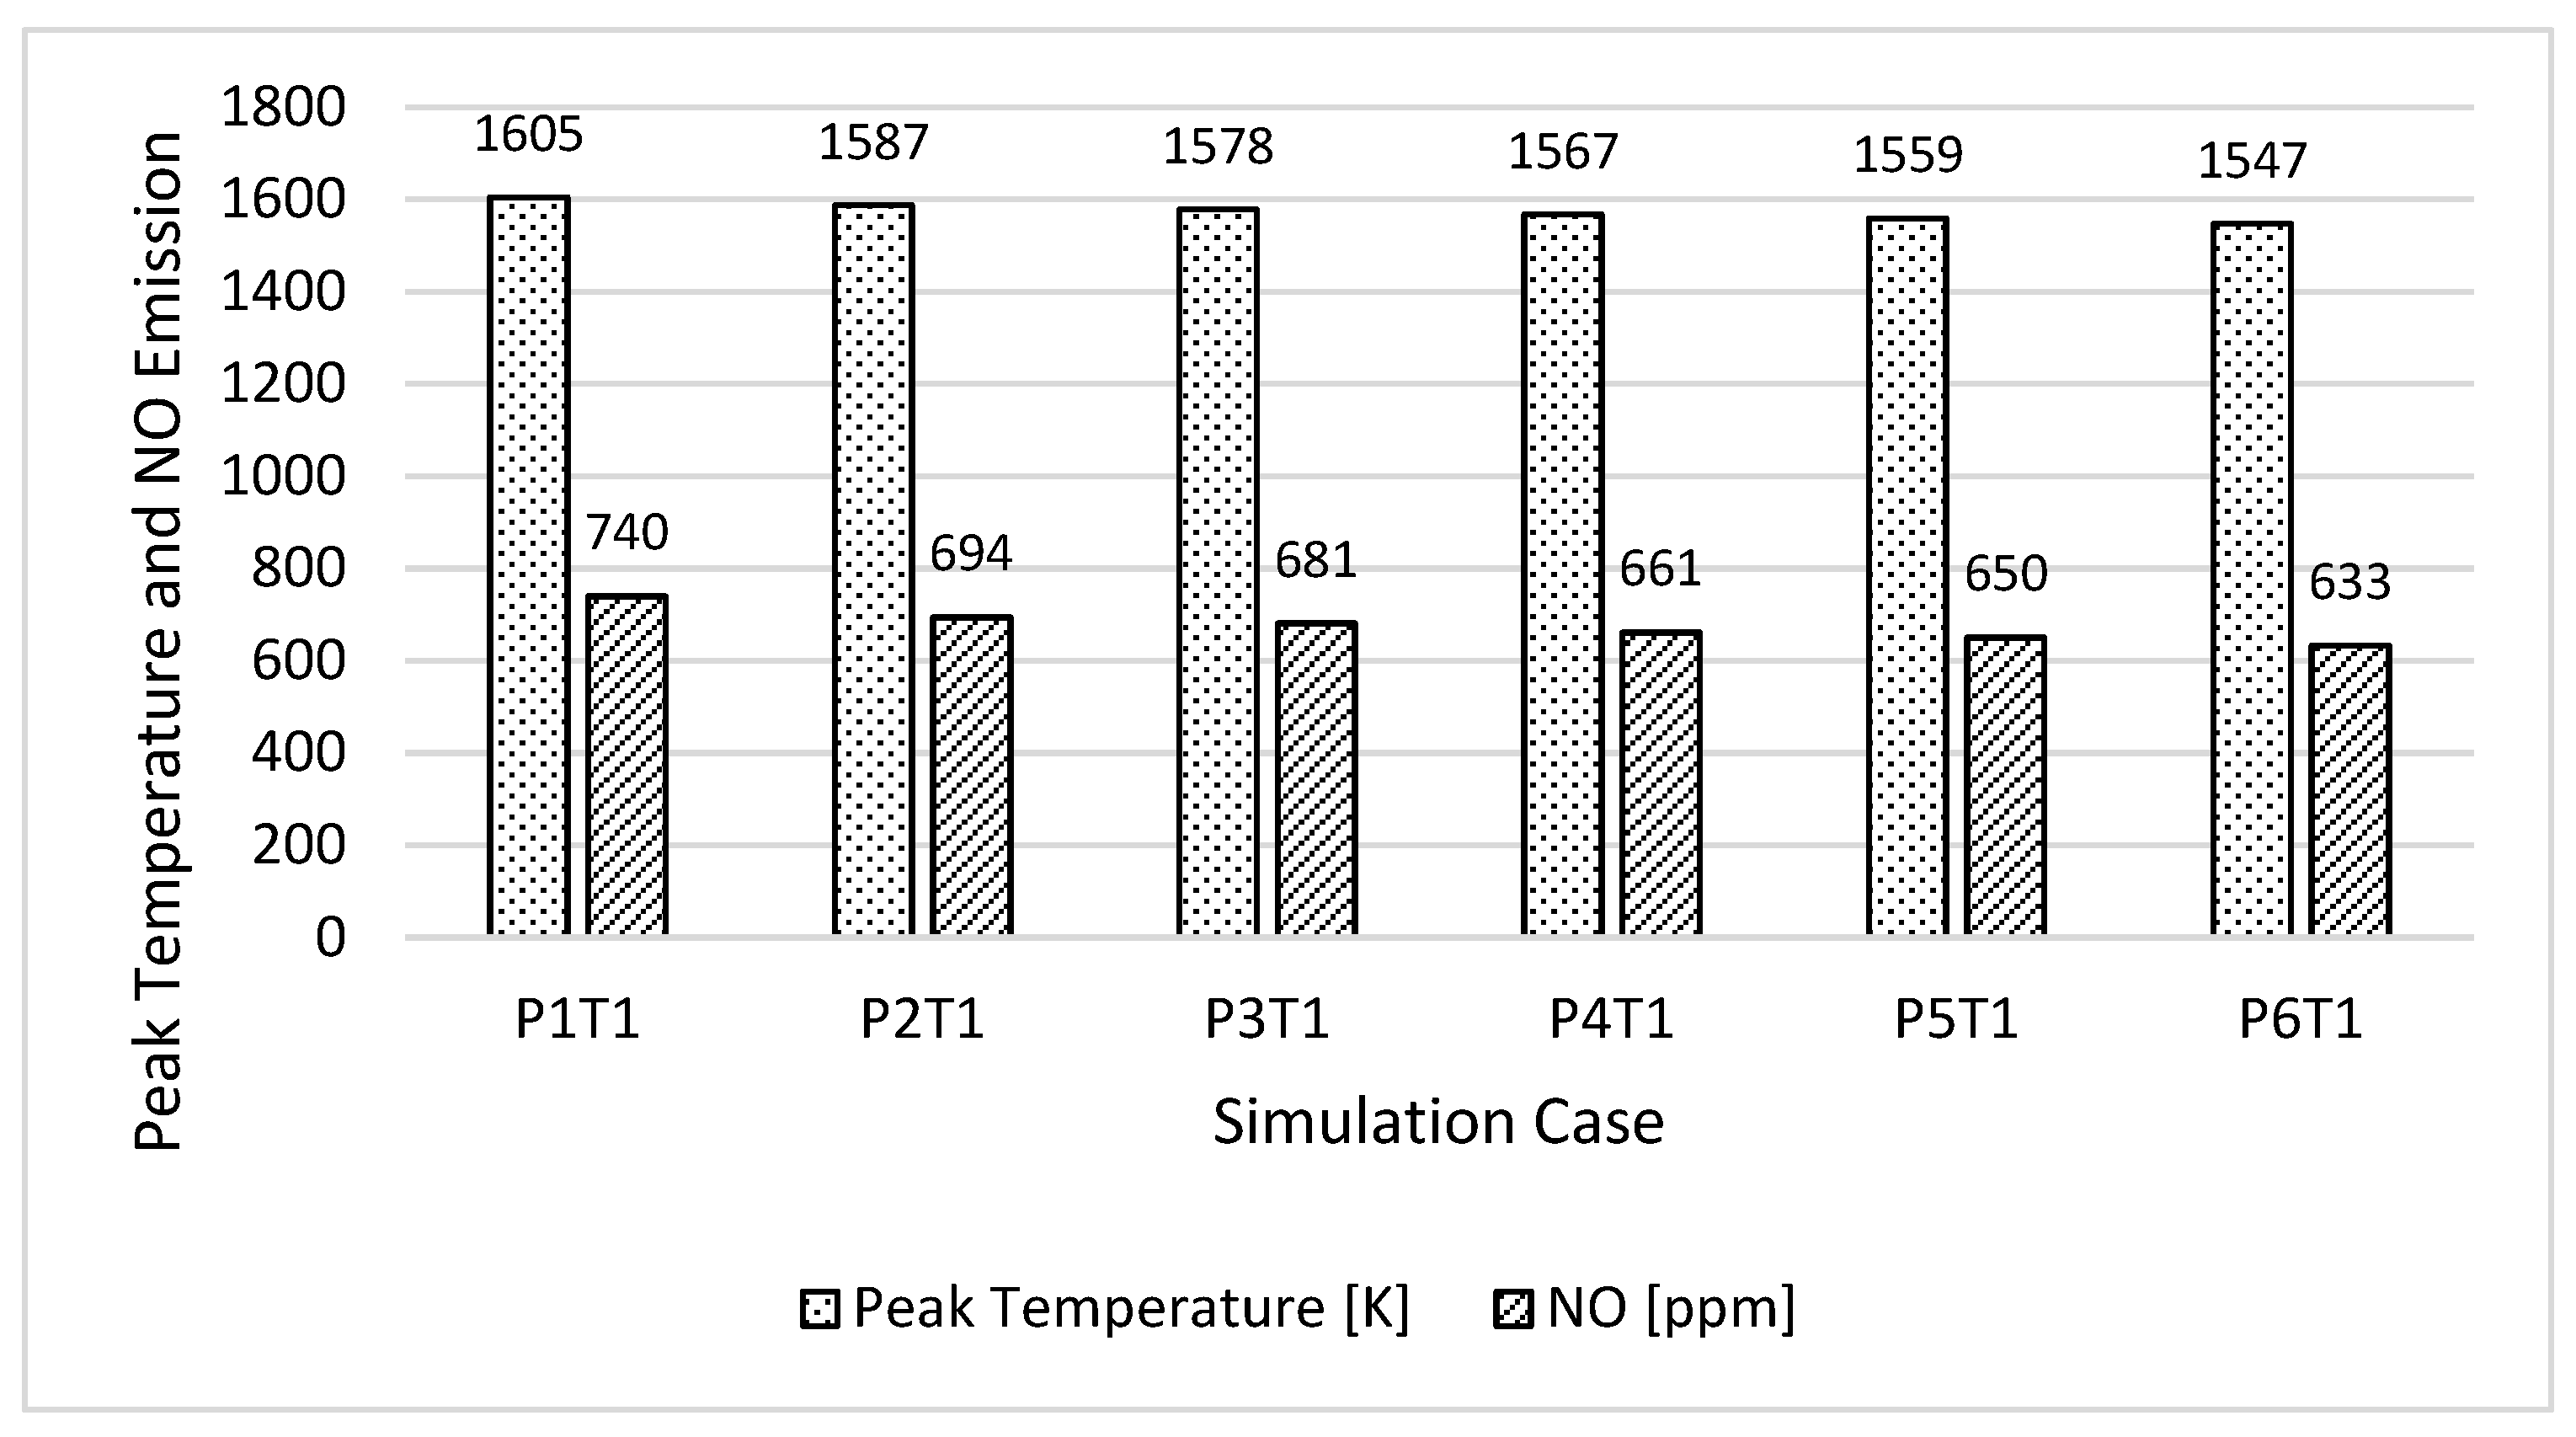
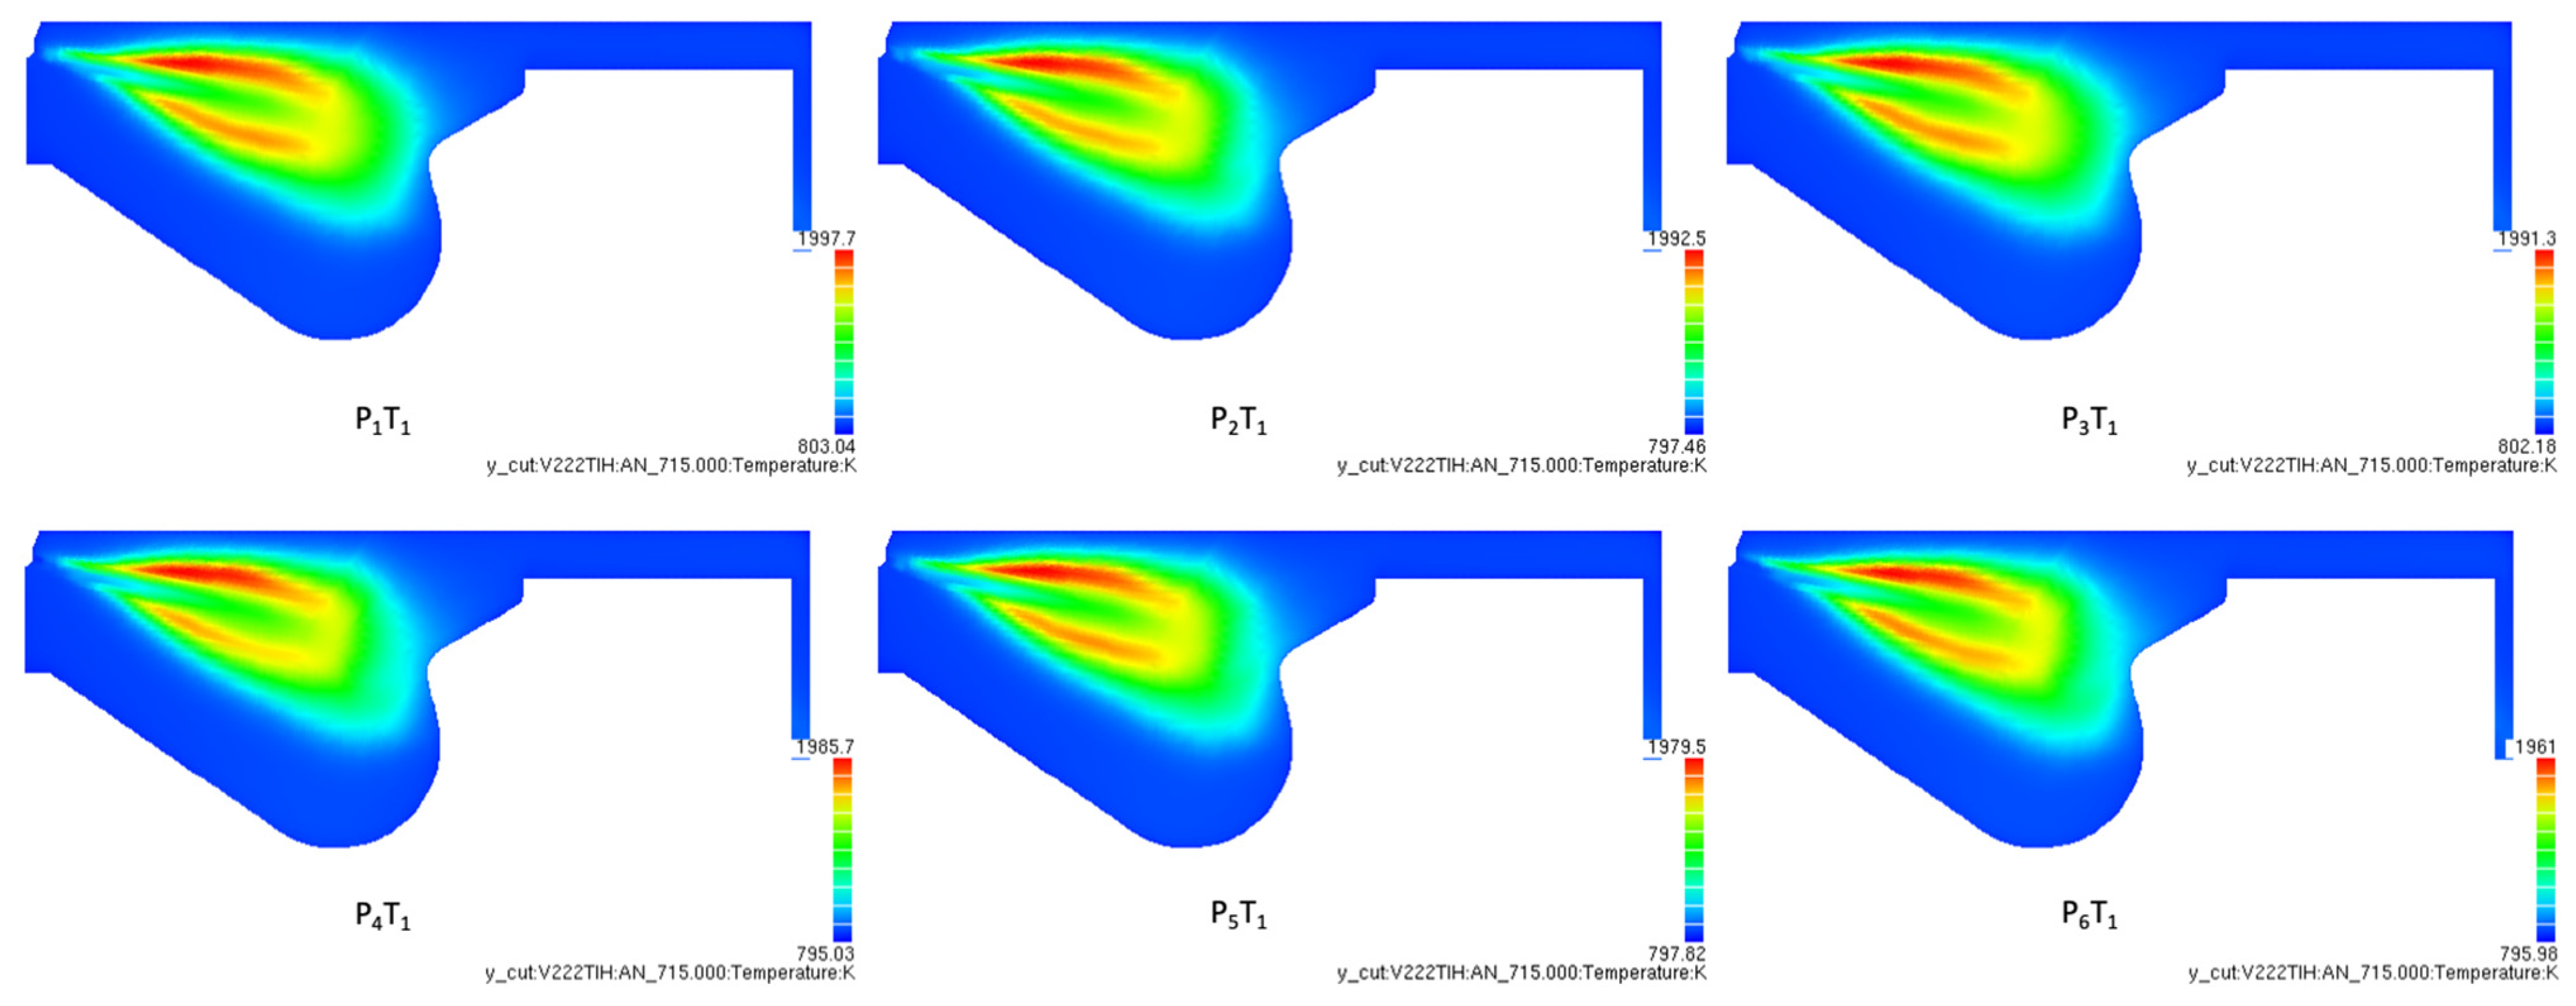
Conversely, in Category 2, including cases P1T1, P2T1, P3T1, P4T1, P5T1, and P6T1, only charge air pressure was changed, while its temperature was kept unchanged by an intercooler. This category implies that the charge air was cooled after turbocharging. By analyzing the simulation results in these two categories, the effect of charge air parameters on the combustion and emissions characteristics of the engine was investigated.

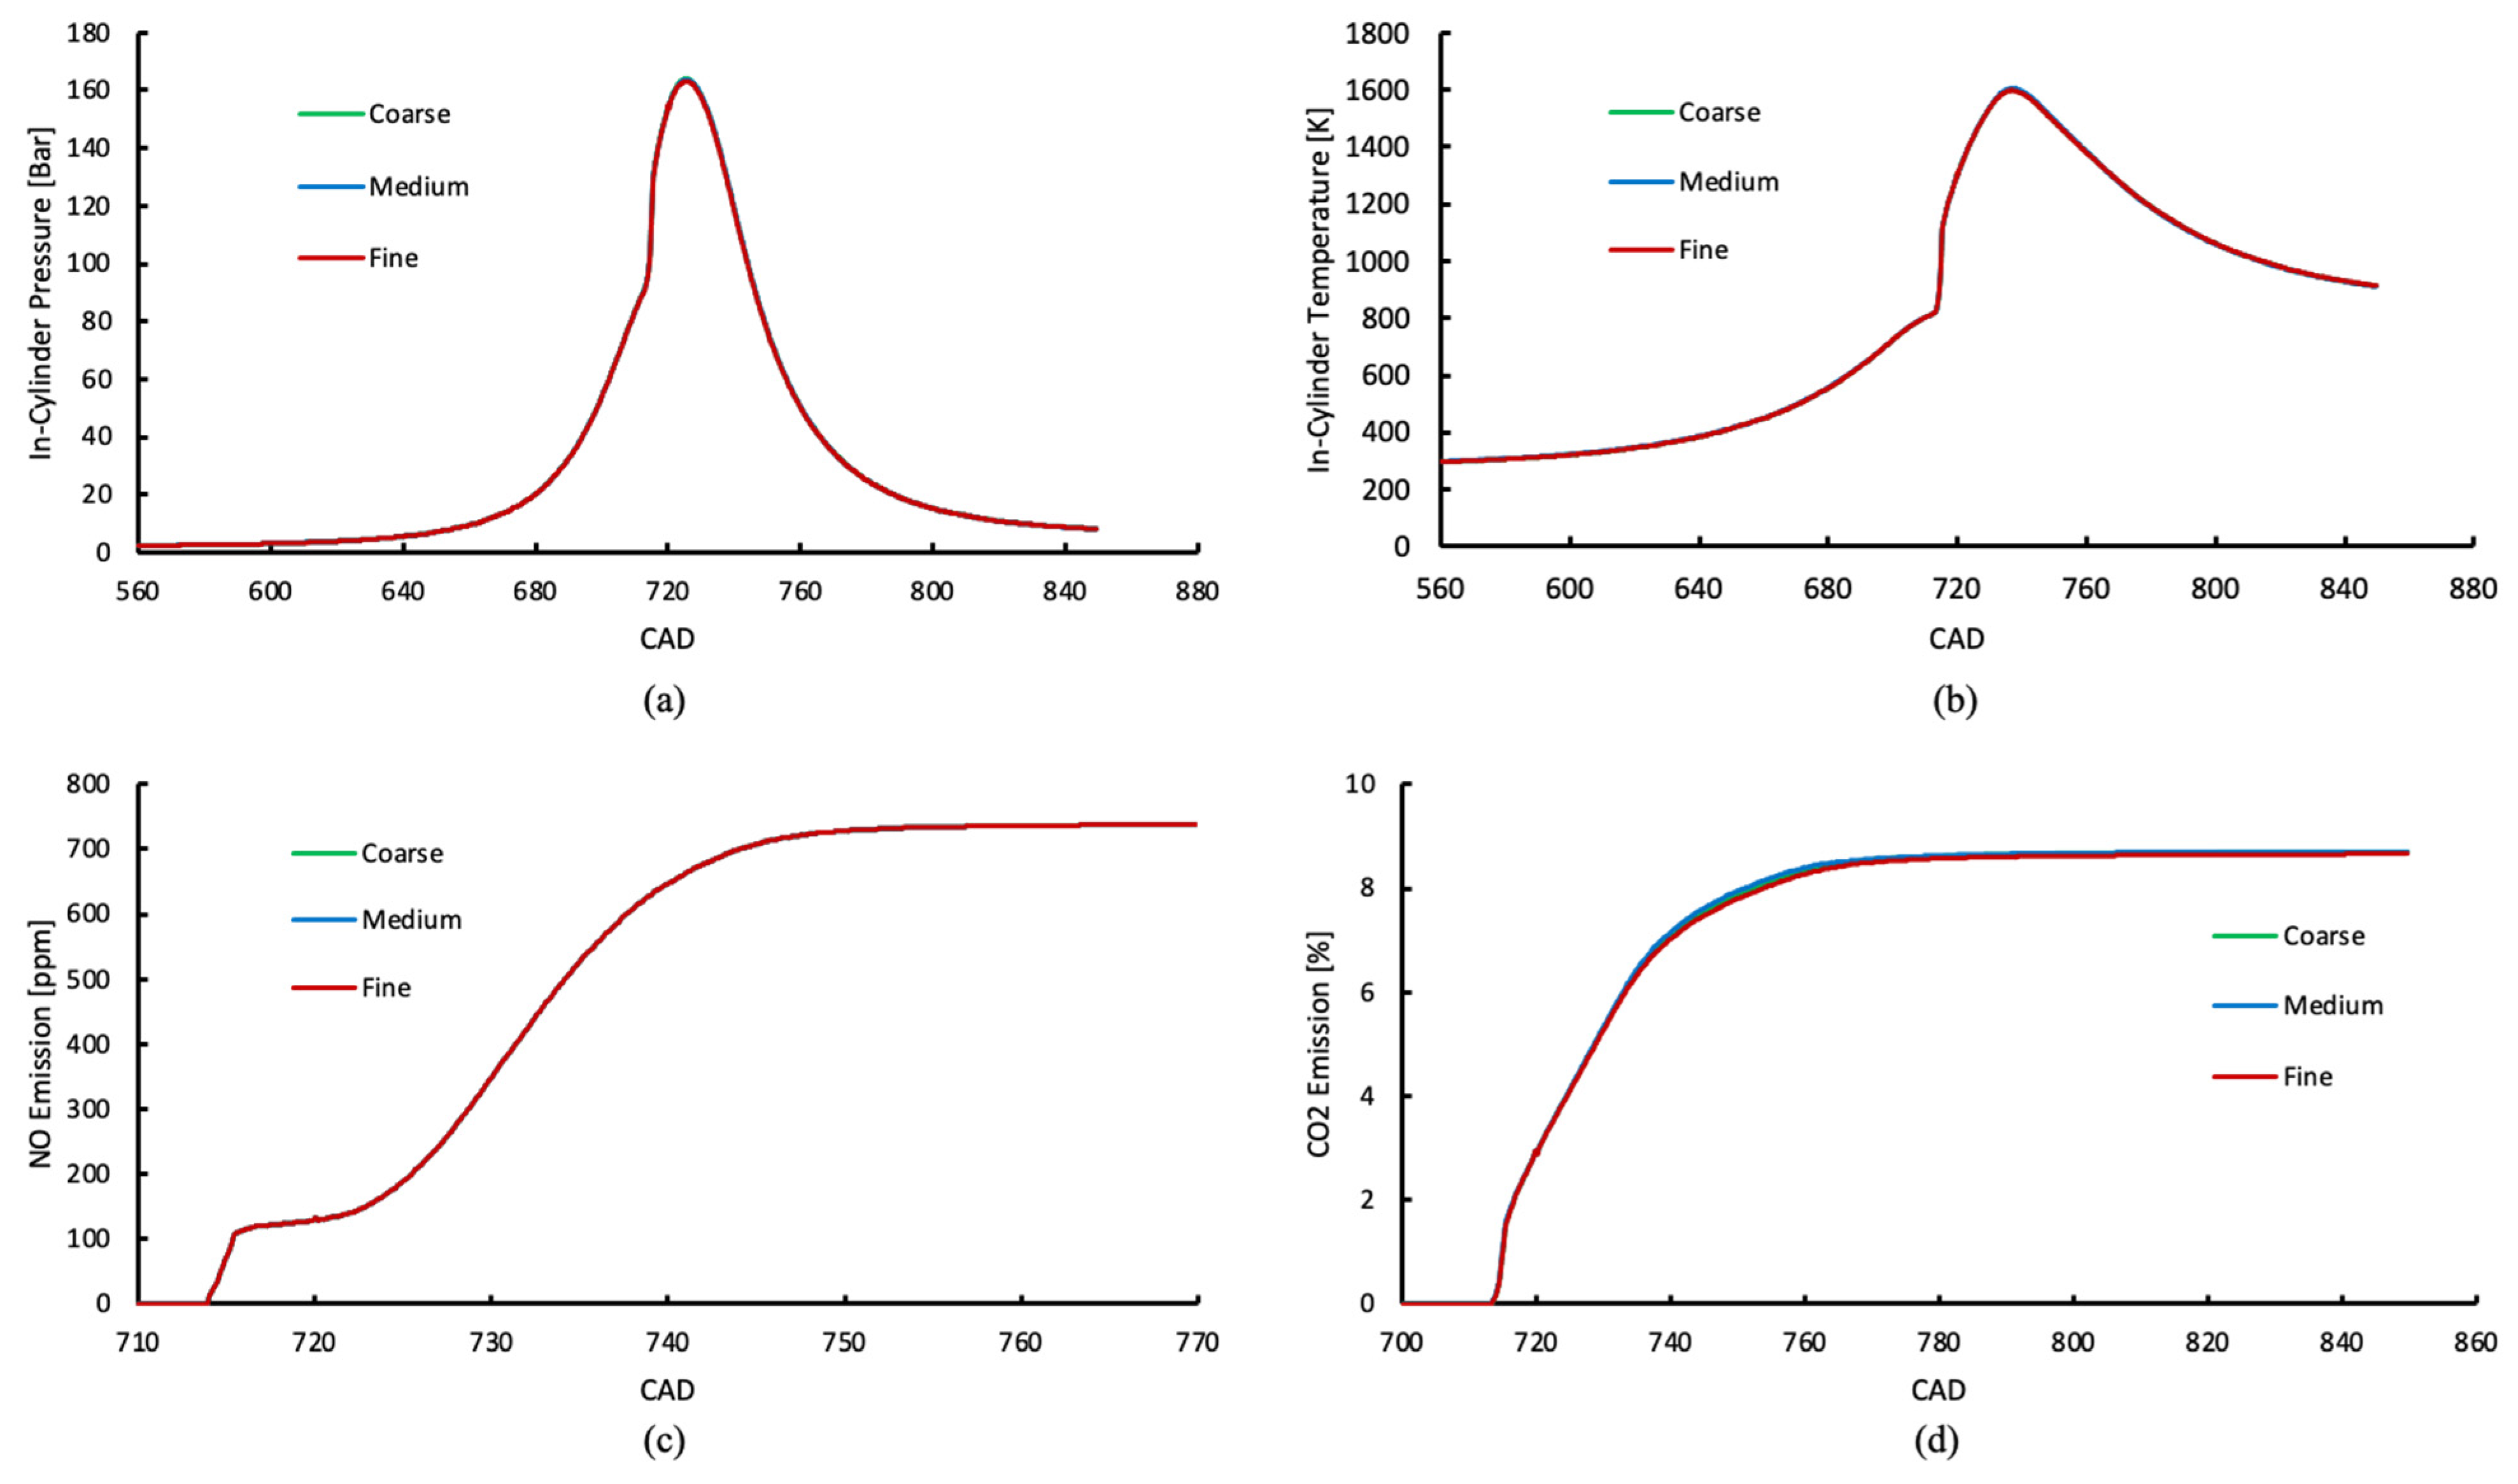
2.5. Mesh Sensitivity (Independence) Analysis

Mesh resolution or density strongly affects the quality of the mesh and the accuracy of CFD calculation results. Furthermore, mesh density affects calculation time. To minimize calculation time while ensuring the accuracy of calculation results, an analysis of mesh sensitivity was performed. Three calculations using three different mesh densities, coarse, medium, and fine meshes, were carried out. The calculation results were then compared to evaluate whether the results had meshing independence or not. The calculations were carried out on a 32 GB RAM Windows workstation with an Intel Xeon CPU X5690 @ 3.47 GHz, 16-core, 32-thread processor. Table 6 lists the mesh metrics of the three meshes corresponding to their respective calculation times. Figure 2 presents a comparison of the calculation results using these three mesh resolutions.
The comparison results show that there are no significant variations in the calculation results for these three different mesh densities. Therefore, these three mesh densities are technically suitable to be used for numerical calculations. The medium-density mesh was chosen for the calculations in this study because this mesh gave CFD results as accurate as those of the fine mesh but in a shorter calculation time.

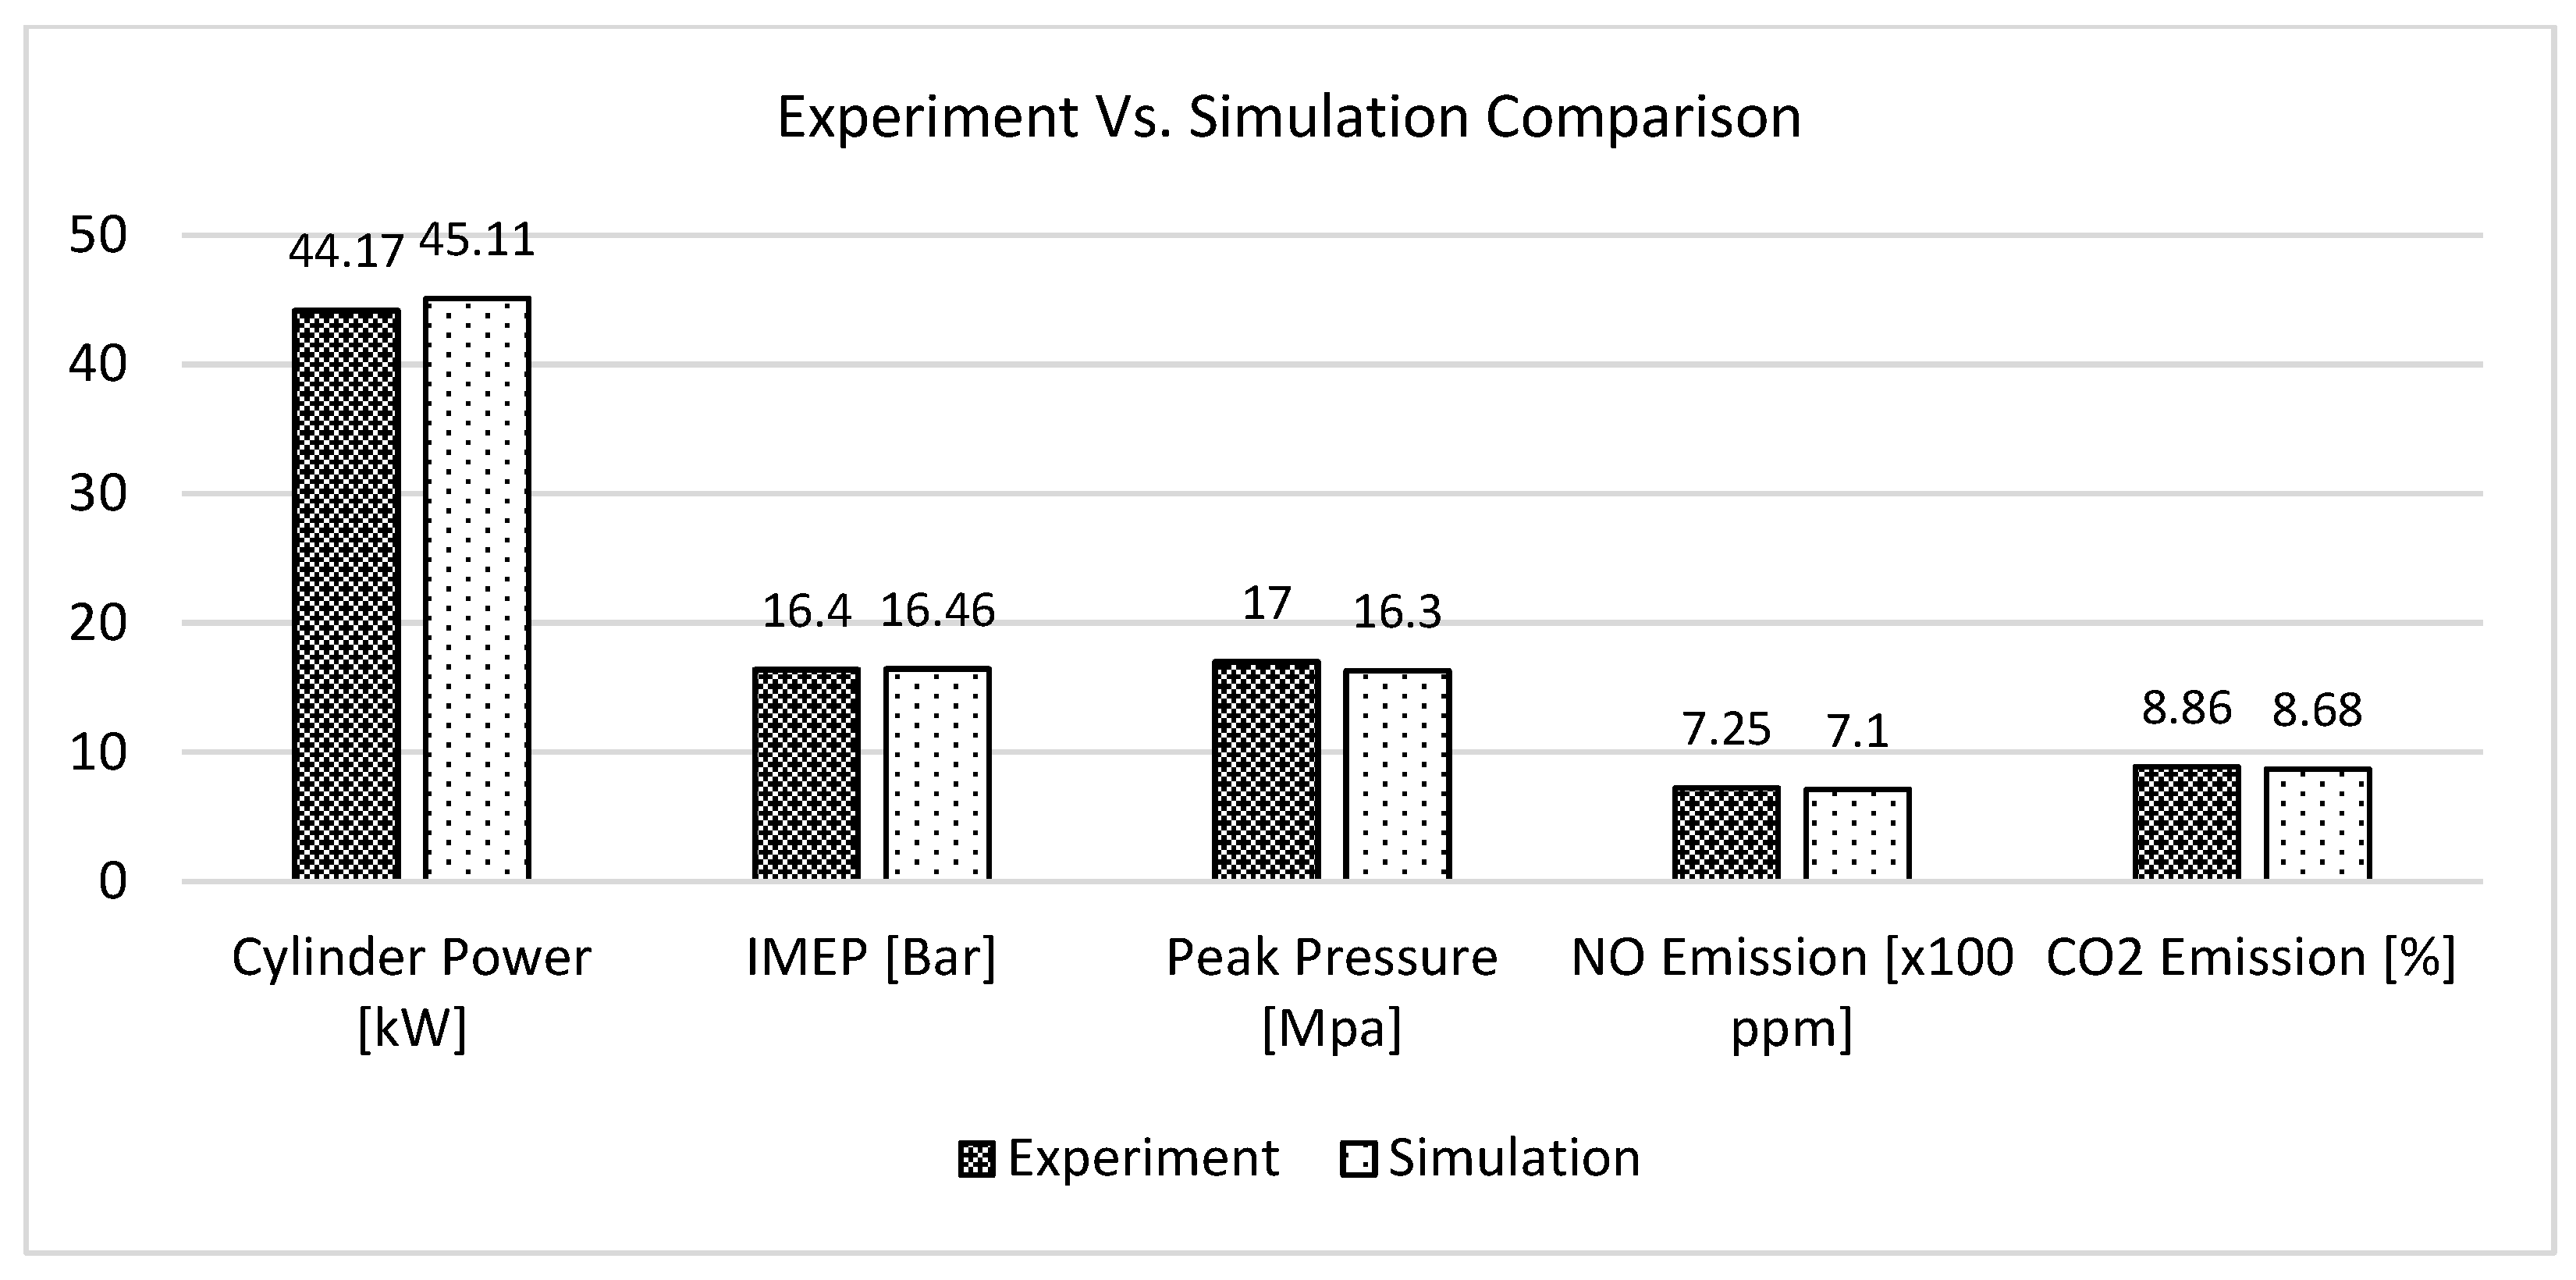
2.6. CFD Model Validations

After the solution achieved convergence and the calculation was complete, the energy balance and sum of species mass fractions in the combustion system were checked to confirm that mass and energy were conserved. The examination specified that the energy balance of the system at the end of all calculations was almost zero. Meanwhile, the sum of species mass fractions in the system was unity (1). These checks confirmed that both the energy and mass of the combustion system were conserved.
In the next step, the CFD simulation models were validated with the experimental engine test technical data. A comparison between the experimental and simulated results is presented in Figure 3. When testing the engine in the workshop, the engine power was recorded with the FUCHINO CFSR-28 dynamometer. The pressure and temperature inside the engine cylinder were recorded with the KISTLER 6215 and RUEGER sensors, respectively. The mass fraction of species in the exhaust gas emissions was analyzed with the HORIBA MEXA-7100D flue gas analyzer.
In Figure 3, it is revealed that the measured (experimental) and simulated results are in good agreement. The deviations between the simulation and experimental results in terms of cylinder power, NO, and CO2 emissions are only around 2%. The deviation between the simulation and experimental results in terms of in-cylinder peak pressure is approximately 4.12% while the deviation between the simulated and experimental indicated mean effective pressure (IMEP) is only 0.37%. These deviations are within the 10% limit, which is widely accepted in CFD analyses [40,41]. After validating the CFD models, the validated models were then utilized for the simulations in this research.

3. Results

3.1. Impacts of Turbocharging the Charge Air without Cooling

3.1.1. Cylinder Pressure and Engine Performance

The in-cylinder pressure data of all simulations in Category 1 (both the charge air pressure and temperature were changed) are presented in Figure 4. Meanwhile, Figure 5 shows the peak pressure in all simulations in this simulation category. The simulation results showed that in-cylinder peak pressure increased while ignition delay (ID) time decreased as charge air pressure increased. This can be explained as when increasing the pressure of the charge air without cooling it, not only the pressure but also the temperature of the air will increase. The increase in the charge air pressure led to an increase in the compression pressure, as can be seen in Figure 4. Higher compression pressure increased the peak pressure, as shown in Figure 4 and Figure 5.
Regarding ID time, this parameter is strongly influenced by the compression temperature (temperature inside the engine cylinder at the end of the compression process) of the engine. As mentioned above, the compression temperature increased as the charge air pressure increased, making the combustion occur earlier. This means the ID time was decreased as the charge air pressure increased.
Physically, the useful work generated by the engine cylinder is equal to the work generated during the combustion and expansion of the cylinder minus the work consumed during the compression of the cylinder. Although the peak pressure in the engine cylinder increased because the compression work also increased as the intake air pressure increased, eventually the cylinder power and the engine’s indicated mean effective pressure (IMEP) decreased, as shown in Figure 6.
The useful work of the cylinder in each working cycle is calculated with the following equation:
W c = v c v a P d v v a v c P d v   ( J )
where W c   J ,   P   ( N / m 2 ) ,   v ( m 3 ) , and v c   a n d   v a   ( m 3 ) are the useful work that the cylinder carries out in a cycle, pressure, specific volume, and cylinder volumes when the piston is at TDC and BDC of the engine, respectively. In Equation (1), v c v a P d v is the combustion and expansion work. That is the work generated when the piston moves from the TDC to the BDC during the combustion and expansion processes. Meanwhile, v a v c P d v is the required work to force the piston to move from the BDC to the TDC in the compression process. In Equation (1), the engine power depends on the combustion, expansion, and compression processes. Generally, higher peak pressures increase combustion and expansion work. However, if the compression process (pump stroke) requires a higher energy, the useful work of the cycle might remain unchanged or even be reduced. In Category 1, the in-cylinder peak pressure increased as the charge air pressure and temperature increased, leading to an increase in combustion and expansion work. However, the pressure inside the engine cylinder at the TDC, which causes resistance forces to the piston, was also increased. This increased the compression (pump) work. Unfortunately, the increase in the combustion and expansion work was lower than the compression work. As a result, the useful work (or net IMEP) of the engine was decreased, as shown in Figure 6.
The increase in peak pressure in the cylinder while the engine power decreases is undesirable. With the same amount of fuel supplied, the engine’s power decreases, meaning the engine’s fuel consumption increases. This reduces the economic performance of the engine. Meanwhile, increased maximum pressure in the cylinder will increase the mechanical stresses acting on the engine’s combustion chamber, reducing the engine’s lifespan.

3.1.2. Specific Fuel Oil Consumption (SFOC)

The SFOC of the engine in the cases of changing both the pressure and temperature of the charge air is presented in Figure 7. The SFOC of an engine is the amount of fuel needed to be supplied so that the engine generates one kilowatt of power in one hour. In this study, to clarify the effect of charge air parameters on the combustion and emissions of the engine, only pressure and temperature of the charge air were changed. The fuel mass supplied to the engine was kept unchanged in all simulation cases. As shown in Figure 6, engine power decreased as charge air pressure and temperature increased. The fuel supplied to the engine remained unchanged while the engine power was reduced, increasing the engine’s SFOC, as shown in Figure 7.

3.1.3. Cylinder Temperature and NO Emissions

The mean temperatures inside the cylinder of the engine in all the simulation cases are shown in Figure 8. Figure 9 presents the peak temperature and NO emissions of the engine according to the changing of charge air parameters. The simulation results showed that the in-cylinder peak temperature increased as the charge air pressure increased. As mentioned in Section 3.1.1, when increasing the pressure of the charge air without cooling it, not only the pressure but also the temperature of the air will increase. The increase in the charge air temperature leads to an increase in the peak temperature, as shown in Figure 8 and summarized in Figure 9.
NO is the main component and accounts for more than 90% of NOx emissions in ICE cylinders. The combustion in ICE cylinders does not emit NO emissions because hydrocarbon fuel does not contain nitrogen (N2). Instead, NO is formed from N2 in the charged air. Zeldovich presents this phenomenon through a thermal NO mechanism which is called the Zeldovich mechanism [18]. According to this mechanism, NO formation is strongly influenced by the local temperature in the cylinder, chemical reaction residence time, and oxygen (O2) concentration inside engine combustion chambers. Inside ICE cylinders, NO is mainly formed in regions with temperatures of 1800 K or above. In this high-temperature condition, N2 in the charged air dissociates into nitrogen radicals (N) and reacts with O2 to form NO. In addition, some formed NO maybe then converted to NO2 if there is enough time for further reactions to occur in engine combustion chambers [4,38]. Since NO formation characteristics and cylinder temperature are closely related, they are presented together in this subsection.
The simulation results showed an increasing trend of thermal NO emissions as the charge air pressure and temperature increased. This was a natural result of the temperature rise in the engine cylinders when turbocharging the intake air without cooling it.
Figure 10 shows the in-cylinder local temperature contours for all simulation cases. The color bars in Figure 10 show that the maximum local temperature inside the engine combustion chamber increased as the pressure and temperature of charge air increased. In addition, the high-temperature local zones ( > 1800   K ) inside the engine cylinder (red color zones) expanded as the charge air pressure and temperature increased. The increase in high-temperature local zones increased thermal NO formations, as shown in Figure 9.

3.1.4. Soot Formation

In ICE, soot is the main component of particulate matter (PM) contained in engine exhaust gas emissions [42,43,44]. Soot is promoted to form under a high-equivalence ratio (fuel-rich) and high-temperature conditions, which are typically found in the combustion chamber of DI diesel engines (diffusion combustion engines). The most important factors that impact soot formation in ICE cylinders are the local equivalence ratio (ϕ), C/O and C/H ratios of fuels, in-cylinder temperature, pressure, and chemical reaction residence time. Soot particles are typically formed in the early stage of the diffusion combustion of the engine. This involves the dissociation of fuel at high temperatures in the combustion chamber of an engine. Most of the soot is then burnt in the late combustion stage of the engine. In other words, the soot characteristics of an engine are mainly determined by soot formation in the early stages of diffusion combustion and by soot oxidation at the late stages of combustion in the engine cylinder [20].
Tree et al. mentioned in [45] that fuel pyrolysis also plays an important role in soot formation in ICE cylinders. Pyrolysis is a chemical process that changes the molecular structure of a fuel under very high temperatures without oxidation even in the presence of O2. All fuels undergo the pyrolysis process under high-temperature conditions to produce species that are building blocks or precursors of soot. The pyrolysis process required to form soot precursors increases with temperature. In other words, soot formation increases as the temperature increases.
Figure 11 shows the maximum soot formed inside the engine cylinder in all the simulation cases. The simulation results showed that the maximum soot formed in the engine cylinder increased as the pressure and temperature of the charge air increased and then tended to decrease if the pressure and temperature of the charge air continued to increase.
In this study, when the intake air temperature was increased, the density of the air was reduced, reducing the amount of air supplied to the engine cylinder. The reduced charge air amount reduces the air-to-fuel ratio. The reduced air–fuel equivalent ratio increases the formation of soot inside the engine cylinder. However, the increase in charge air temperature increases the temperature in the engine cylinders in the late combustion stage of the engine, as shown in Figure 8. The high temperature in the late combustion stage promotes the soot oxidation process, which reduces the amount of soot eventually formed. In short, the formation of soot in the engine cylinder in this study is mainly influenced by the air–fuel equivalent ratio and the temperature in the cylinder. The combined effect of these two factors means the largest amount of soot is formed when the engine is working under P3T3 pressure and temperature conditions.

3.1.5. Carbon Dioxide (CO2) Emissions

The CO2 emissions formed inside the engine cylinder for all simulation cases are shown in Figure 12. The simulation results showed that although the process of fuel oxidation to form CO2 emissions in the engine cylinder tended to take place earlier when the pressure and temperature of the charge air were increased, the final amount of CO2 emissions generated was almost unchanged.
Fuel oxidation (CO2 formation) takes place earlier when the charge air temperature increases, related to the ID time, as explained in Section 3.1.1. Specifically, the engine’s combustion process takes place earlier (fuel combustion ID time is shorter) when the charge air temperature increases, causing the formation of CO2 inside the cylinder to take place earlier.

3.2. Impacts of Charge Air Cooling after Turbocharging

Realizing that turbocharging the charge air without cooling did not bring energy and economic effectiveness to the engine, the effectiveness of the charge air cooling after turbocharging the engine was analyzed. This section describes the impact of charge air cooling on engine combustion and emissions.

3.2.1. Cylinder Pressure and Engine Performance

The mean pressure inside the engine cylinder in all simulations in Category 2 (only the charge air pressure was increased while its temperature was kept unchanged with a cooling process) is presented in Figure 13. Meanwhile, Figure 14 shows the peak pressure in all simulations in this category. The simulation results showed that in-cylinder peak pressure increased as charge air pressure increased. In this simulation category, after being compressed through the turbocharger, the charge air was cooled by the intercooler. Even though the charge air temperature was kept unchanged in all simulations, the increase in the pressure at the start of compression increased the pressure of the charge air at the end of the compression (compression pressure). The increase in the compression pressure increased the peak pressure, as shown in Figure 13 and Figure 14.
Figure 15 presents the engine performance in all simulations in Category 2. As can be seen, an increase in peak pressure in the engine cylinder does not imply an increase in engine power. The power of the engine is determined by the power that the engine produces during combustion and expansion after TDC minus the power required to compress charge air and push the piston past the TDC.
In general, cooling to maintain the charge air temperature when turbocharging the engine has the effect of slightly increasing engine power although the amount of fuel supplied to the engine remains unchanged. This can be explained by the fact that combustion, and, therefore, the thermal efficiency of the engine, is increased as more air is supplied to the engine by supercharging the engine while cooling the charge air.

3.2.2. Specific Fuel Oil Consumption (SFOC)

The SFOC of the engine in the cases of increasing the pressure while keeping the temperature of the charge air is presented in Figure 16. As mentioned above, in Category 2, to clarify the effect of charge air cooling on the combustion and emissions of the engine, only pressure of the charge air was changed. The charge air temperature and fuel mass supplied to the engine were kept unchanged in all simulation cases. The fuel supplied was constant while the engine power increased (except in the P2T1 case) as the charge air pressure increased, reducing the engine’s SFOC, as shown in Figure 16.

3.2.3. Cylinder Temperature and NO Emissions

The mean temperatures in the engine cylinder in all the simulation cases are shown in Figure 17. Figure 18 presents the peak temperature and NO emissions of the engine according to the changing charge air pressure. The simulation results showed that the in-cylinder peak temperature decreased as the charge air pressure increased. This is because, when turbocharges charge air while its temperature is constant, the charge air density increases. An increase in charge air density leads to an increase in the charge air amount supplied to the engine cylinder. More fresh air inside the engine cylinder helps to reduce the combustion chamber temperature. As a result, the in-cylinder peak temperature was reduced, as shown in Figure 17 and Figure 18. Importantly, the reduction in peak temperature reduced thermal NO formation, as shown in Figure 18. The reduction in NO emissions when the SAT decreased was also reported by Sajovaara et al. in [6]. Furthermore, the same tendency was reported by [8,46].
Figure 19 shows the in-cylinder local temperature contours for all simulation cases. The color bars in Figure 19 show that the maximum local temperature inside the engine combustion chamber decreased as the pressure of charge air increased. The increase in local temperature inside the engine cylinder increased thermal NO formations, as shown in Figure 18.

3.2.4. Soot Formation

Figure 20 shows the maximum soot formed in the engine cylinder in all the simulation cases. The simulation results showed that the maximum soot formed in the engine cylinder increased as the pressure of the charge air increased from P1 to P2 and then tended to decrease if the pressure of the charge air continued to increase.
In this simulation category, when the charge air pressure increased while its temperature was kept unchanged, the charge air’s density was increased. An increase in air density increases the amount of air supplied to the engine cylinders. Increasing intake air increases the air–fuel ratio, resulting in a decrease in soot formation inside the engine cylinders, as shown in Figure 20.

3.2.5. Carbon Dioxide (CO2) Emissions

CO2 emissions formed in the engine cylinder in all simulation cases are shown in Figure 21. The simulation results showed a reduction tendency in CO2 emissions when the charge air pressure increased.
Chemically, complete combustion of HC (hydrocarbon) fuels produces CO2 emissions and H2O vapor. Firstly, HC fuels react with O2 in the charge air to form CO. CO is then oxidized by residual O2 to form CO2 sequentially. The required condition for this mechanism is that the temperature in the engine combustion chamber is sufficiently high and there is sufficient O2 for chemical reactions. This means that for a certain fuel, CO2 emissions emitted from an engine are strongly influenced by the temperature and O2 concentration inside the engine cylinder. As mentioned above, if increasing the charge air pressure while keeping its temperature, then the amount of air supplied to the engine cylinder is increased accordingly. As a result, the combustion of fuel improves and becomes more complete due to the abundance of O2 in the engine combustion chamber. A better combustion process reduces CO2 emissions emitted to the environment.
From the above analysis, it is interesting to note that when increasing the charge air pressure from 2.33 bar to 2.53 bar while keeping the charge air temperature unchanged by cooling, engine power was increased by 0.46% while fuel oil consumption was reduced by approximately 0.56%. Specifically, increasing the charge air pressure reduced NO, CO2, and soot emissions by 14.46, 7.84, and 8.9%, respectively.

4. Conclusions and Suggestions

This research numerically investigated the impacts of charge air parameters on the combustion and emission characteristics of a four-stroke V-type direct-injection diesel marine engine. The combustion of fuel and the formation of emissions inside the engine cylinder were simulated with the AVL FIRE program.
The major results of this study are summarized as follows:
1
Turbocharging the charge air without cooling
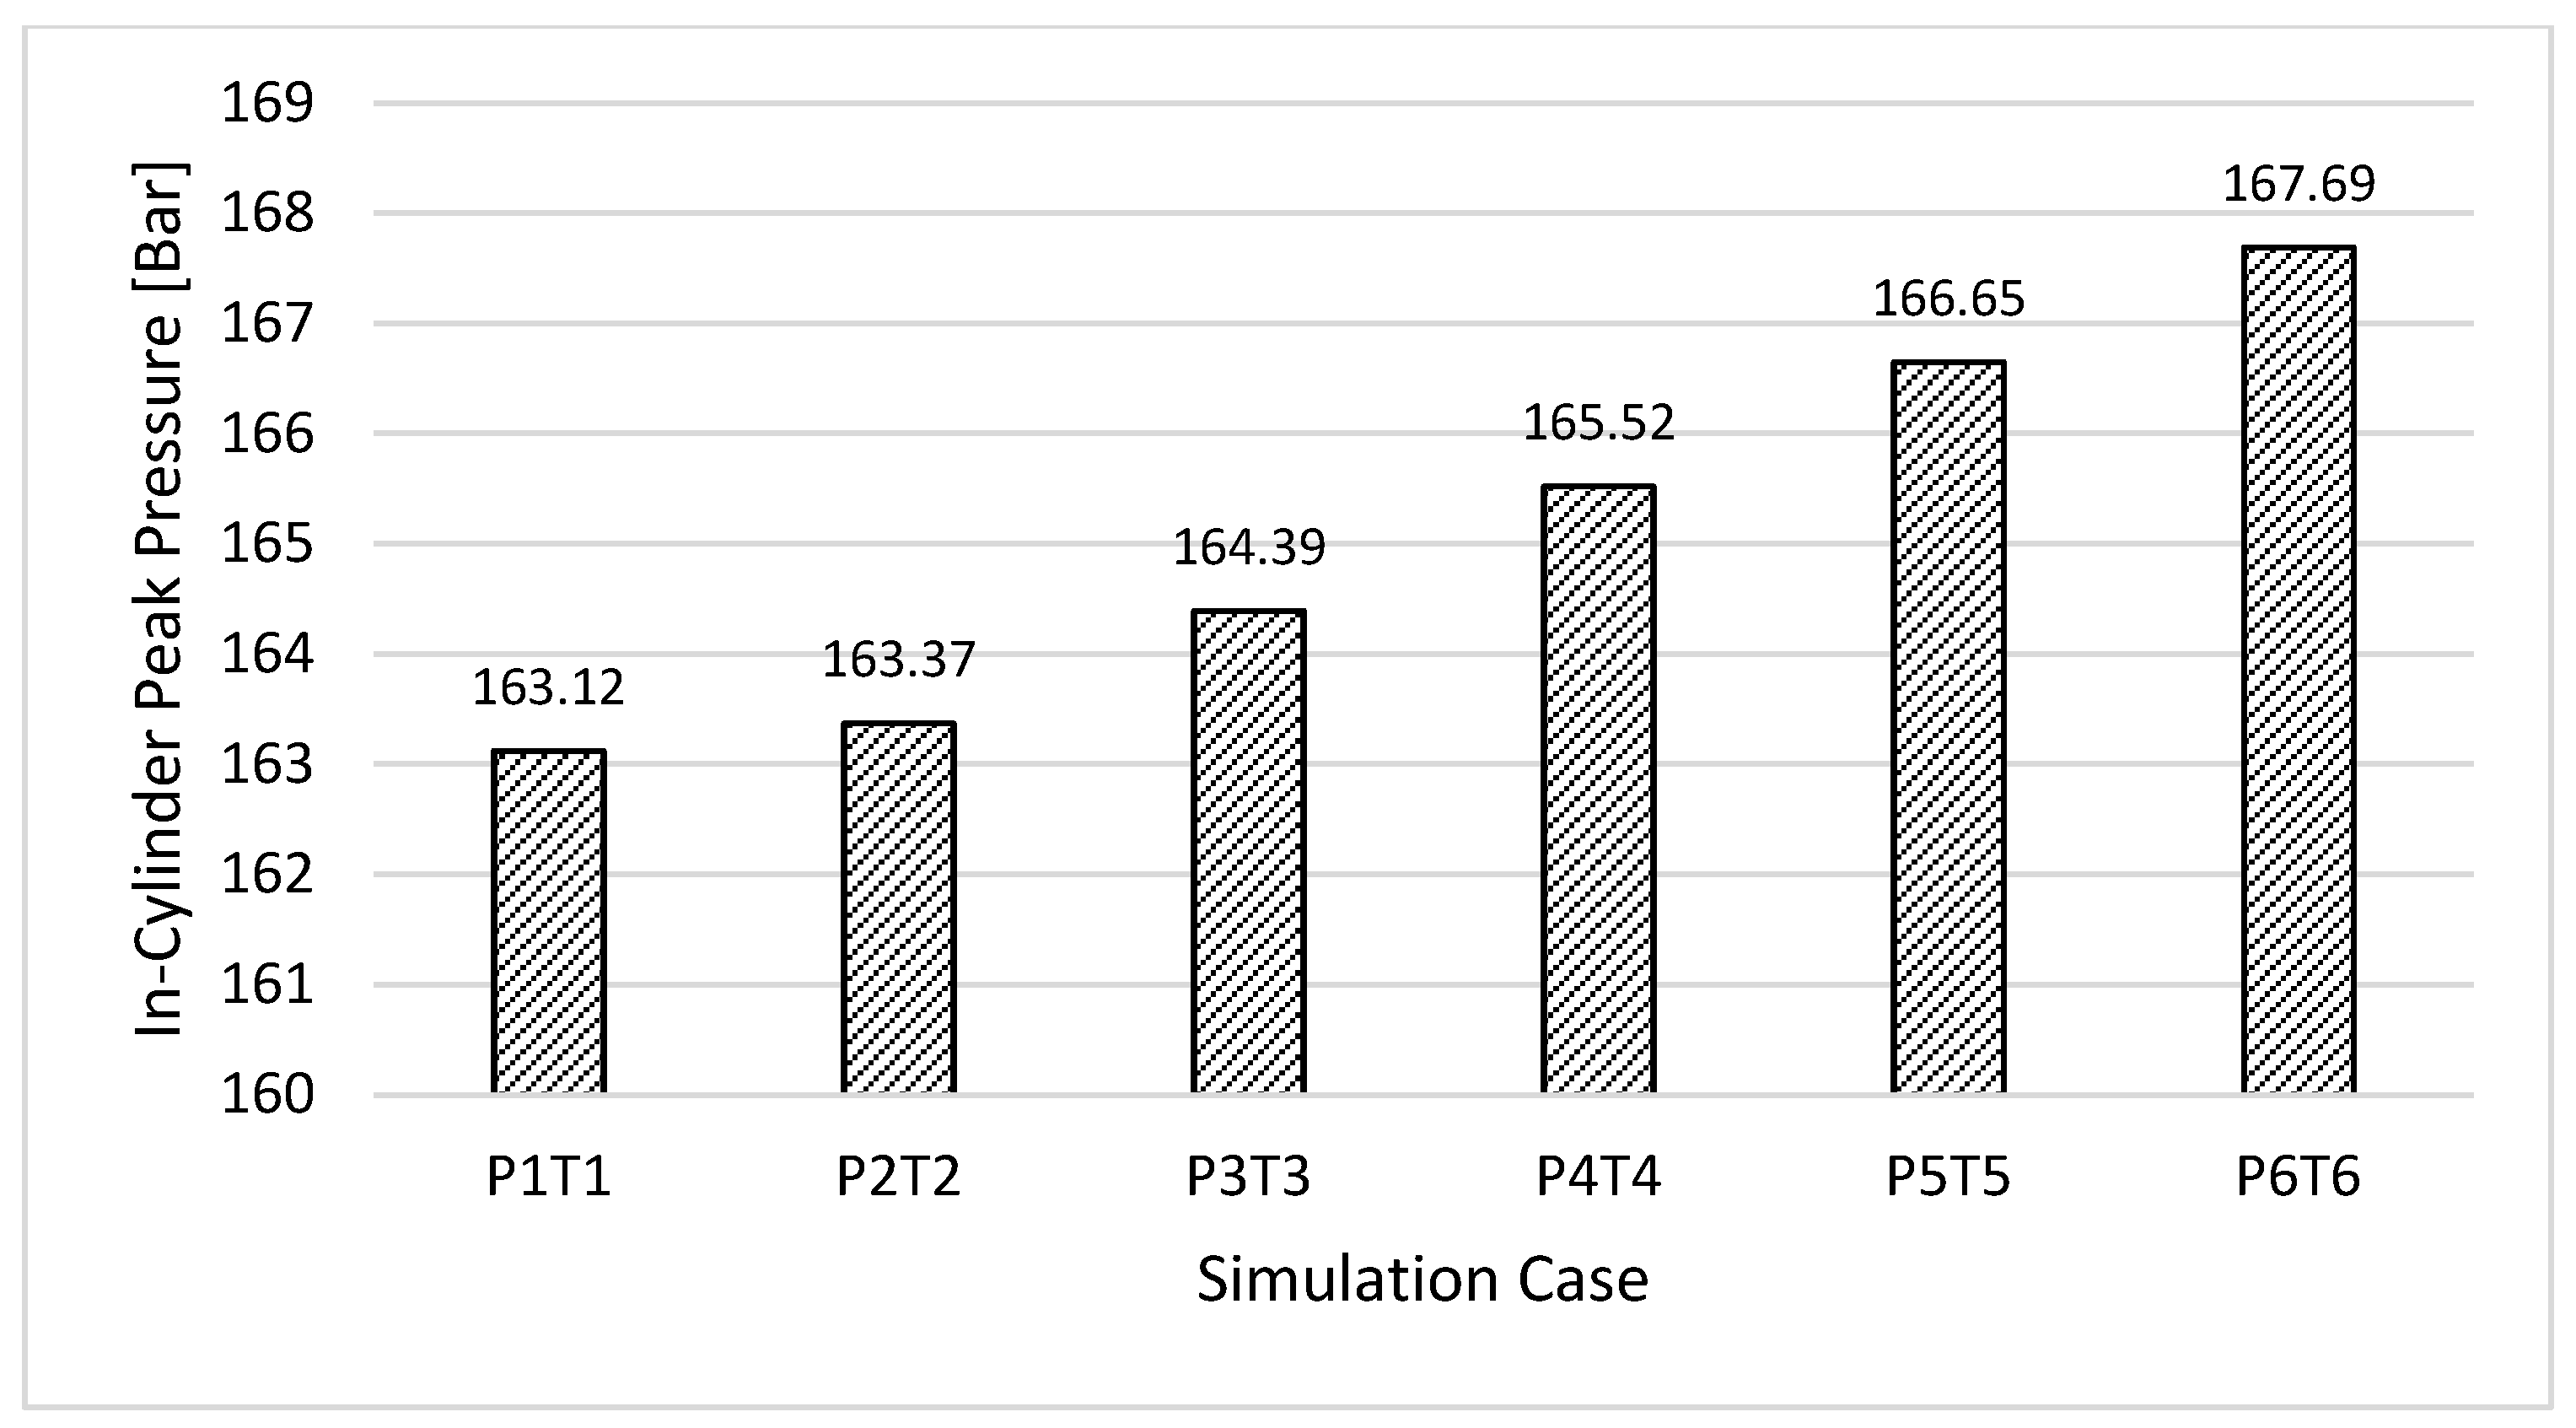
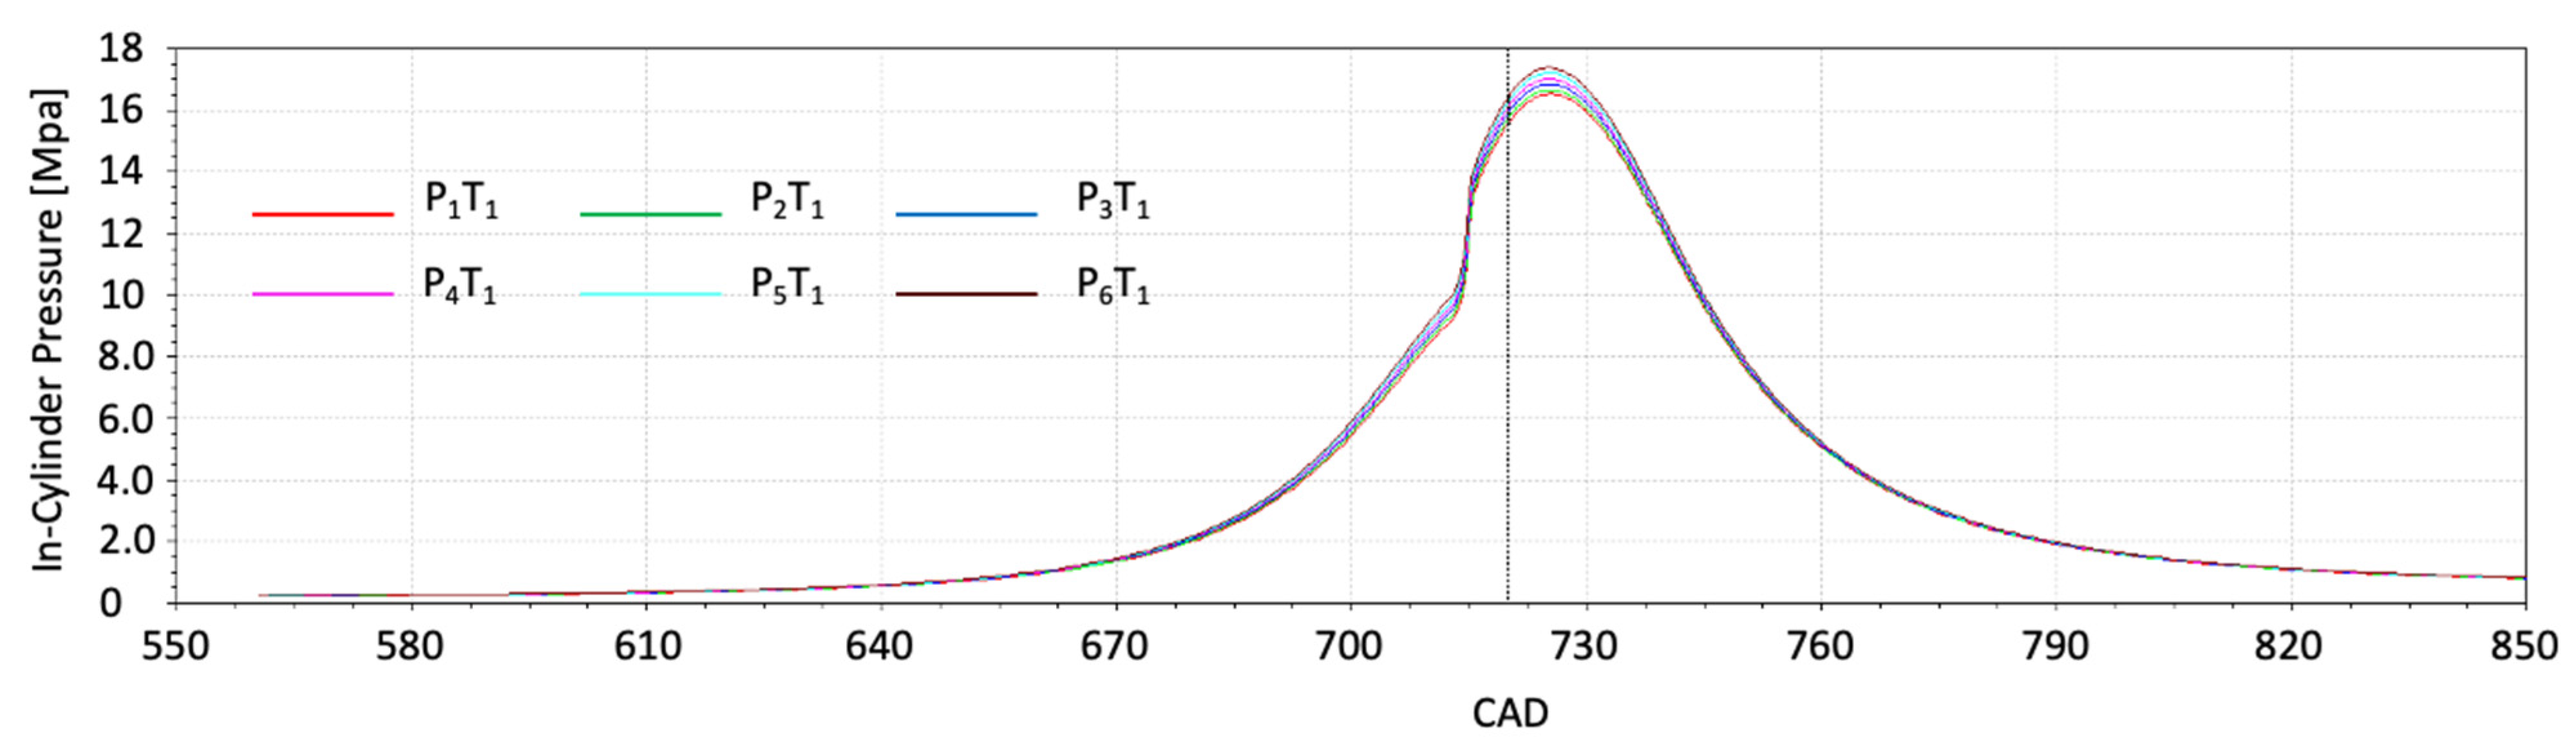
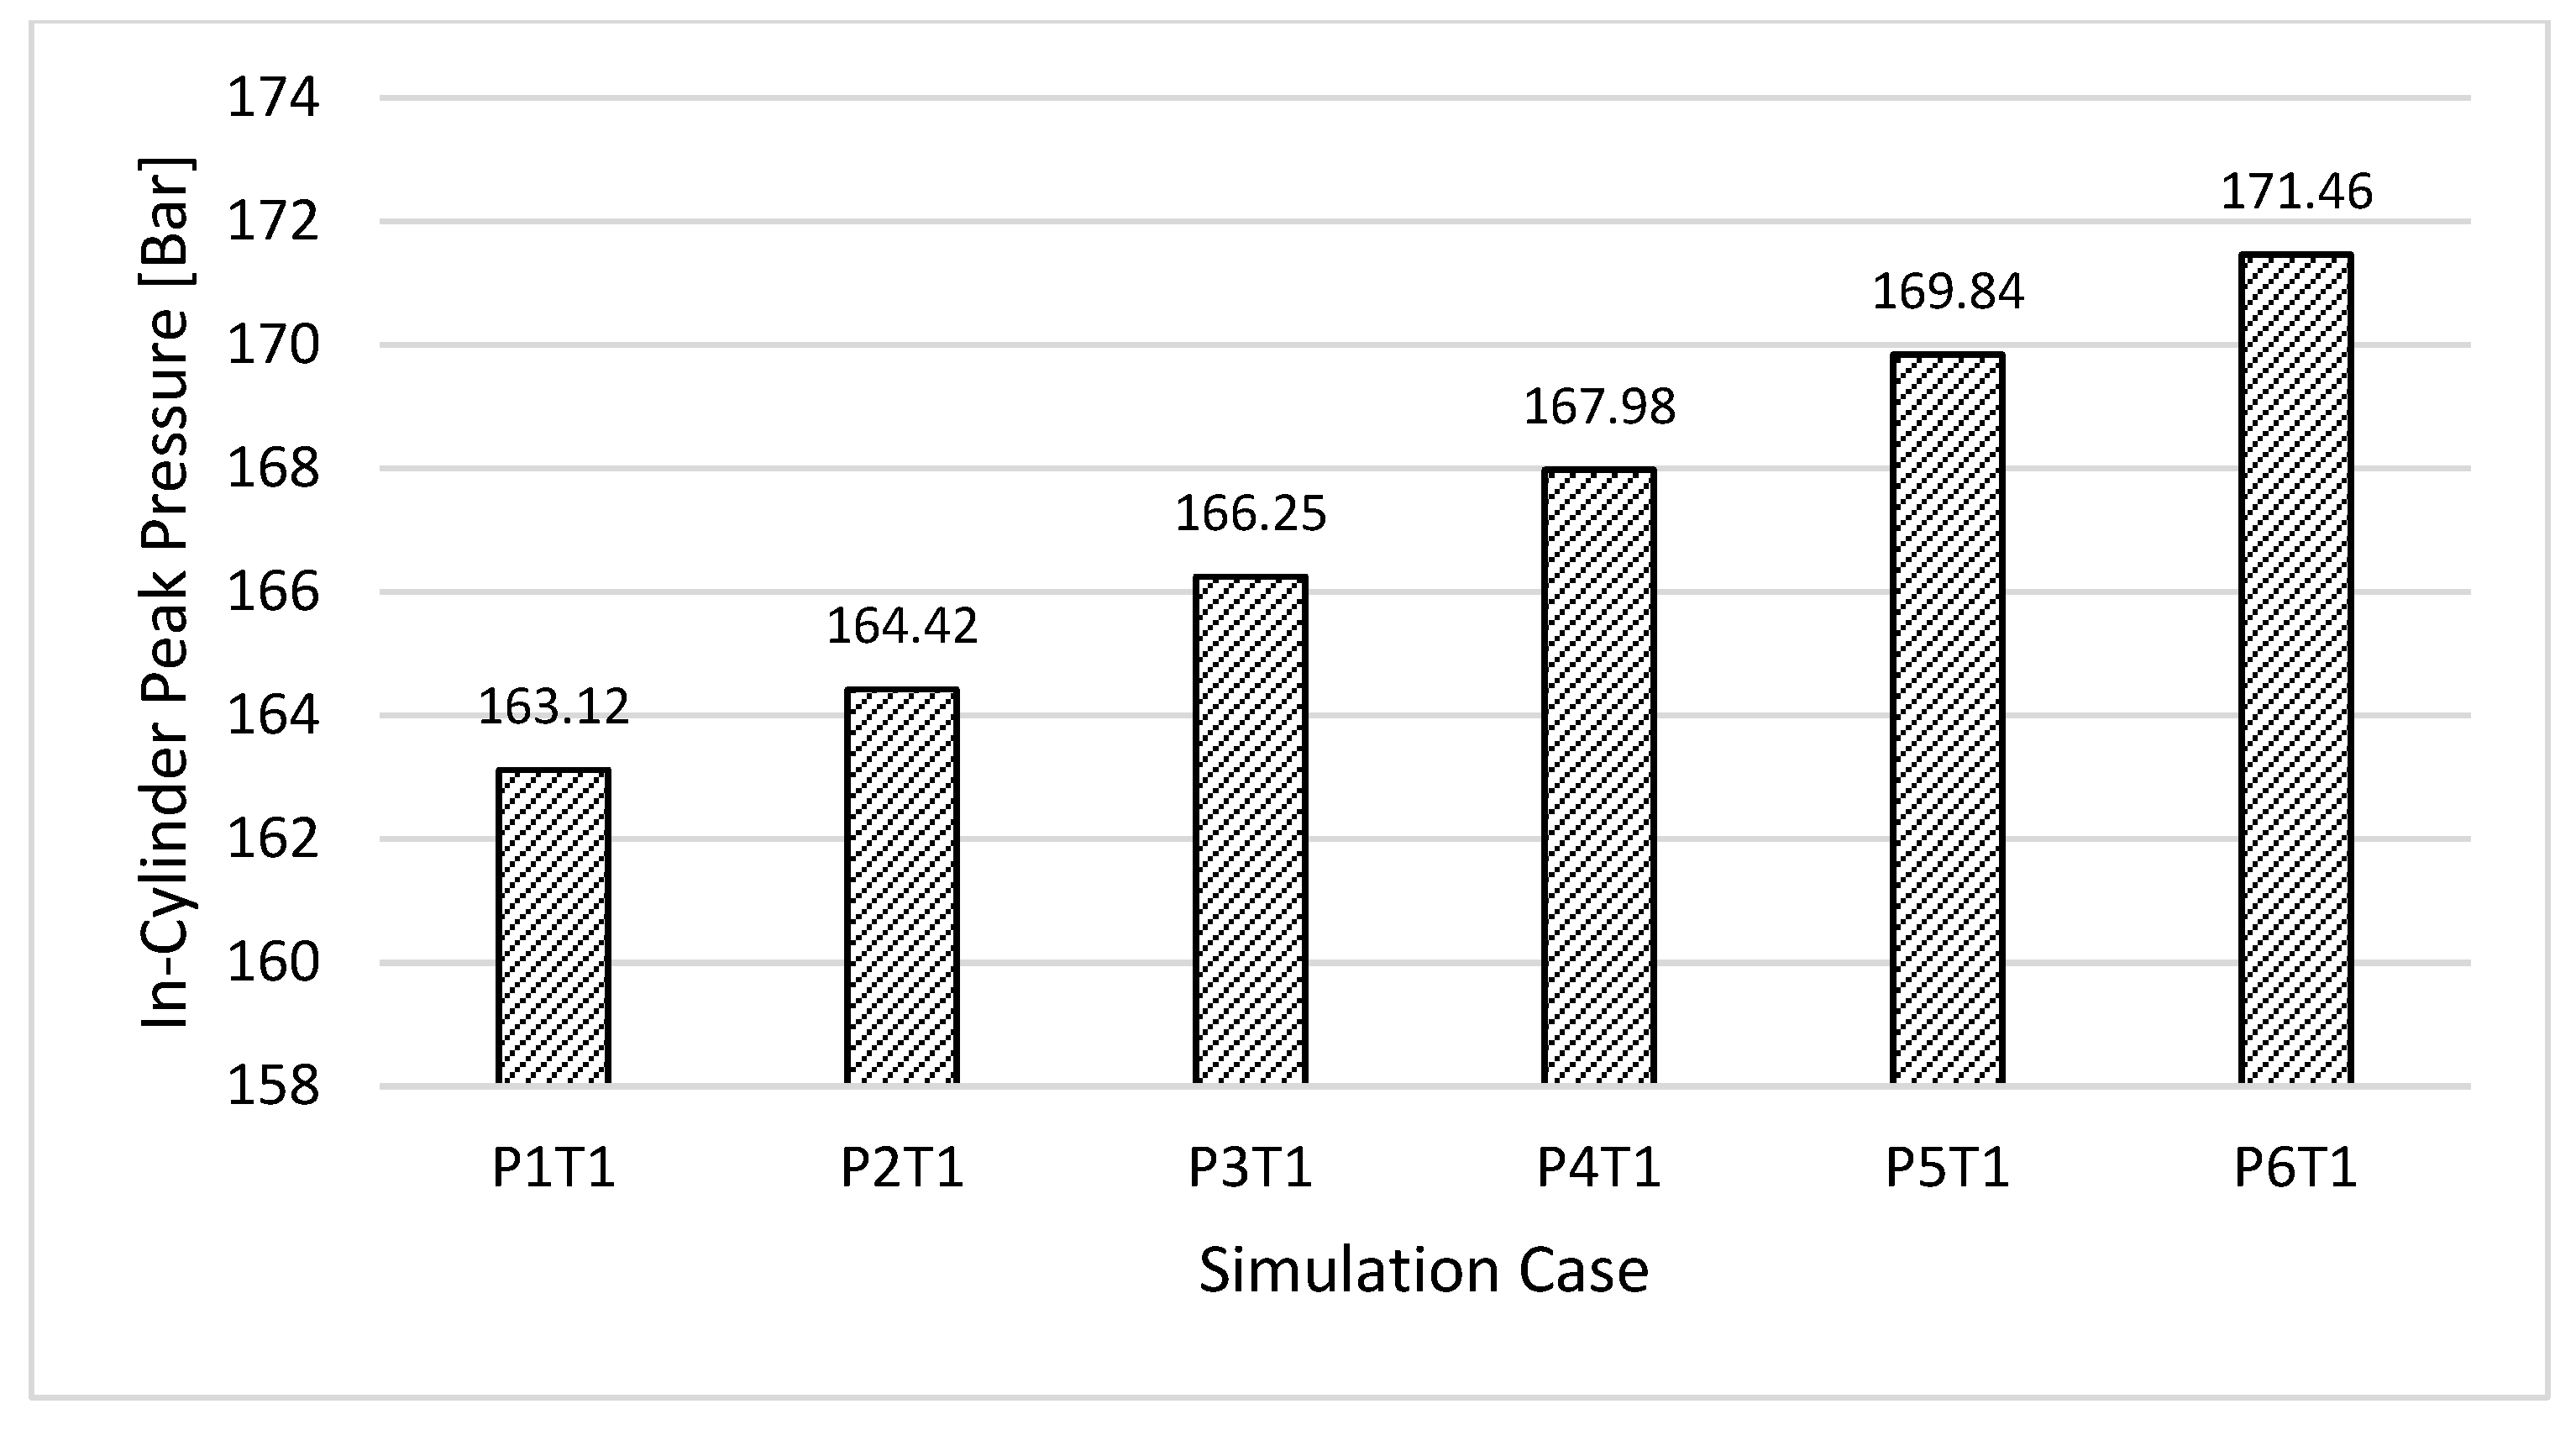
  • In-cylinder peak pressure increased while ID time decreased as the charge air pressure increased.
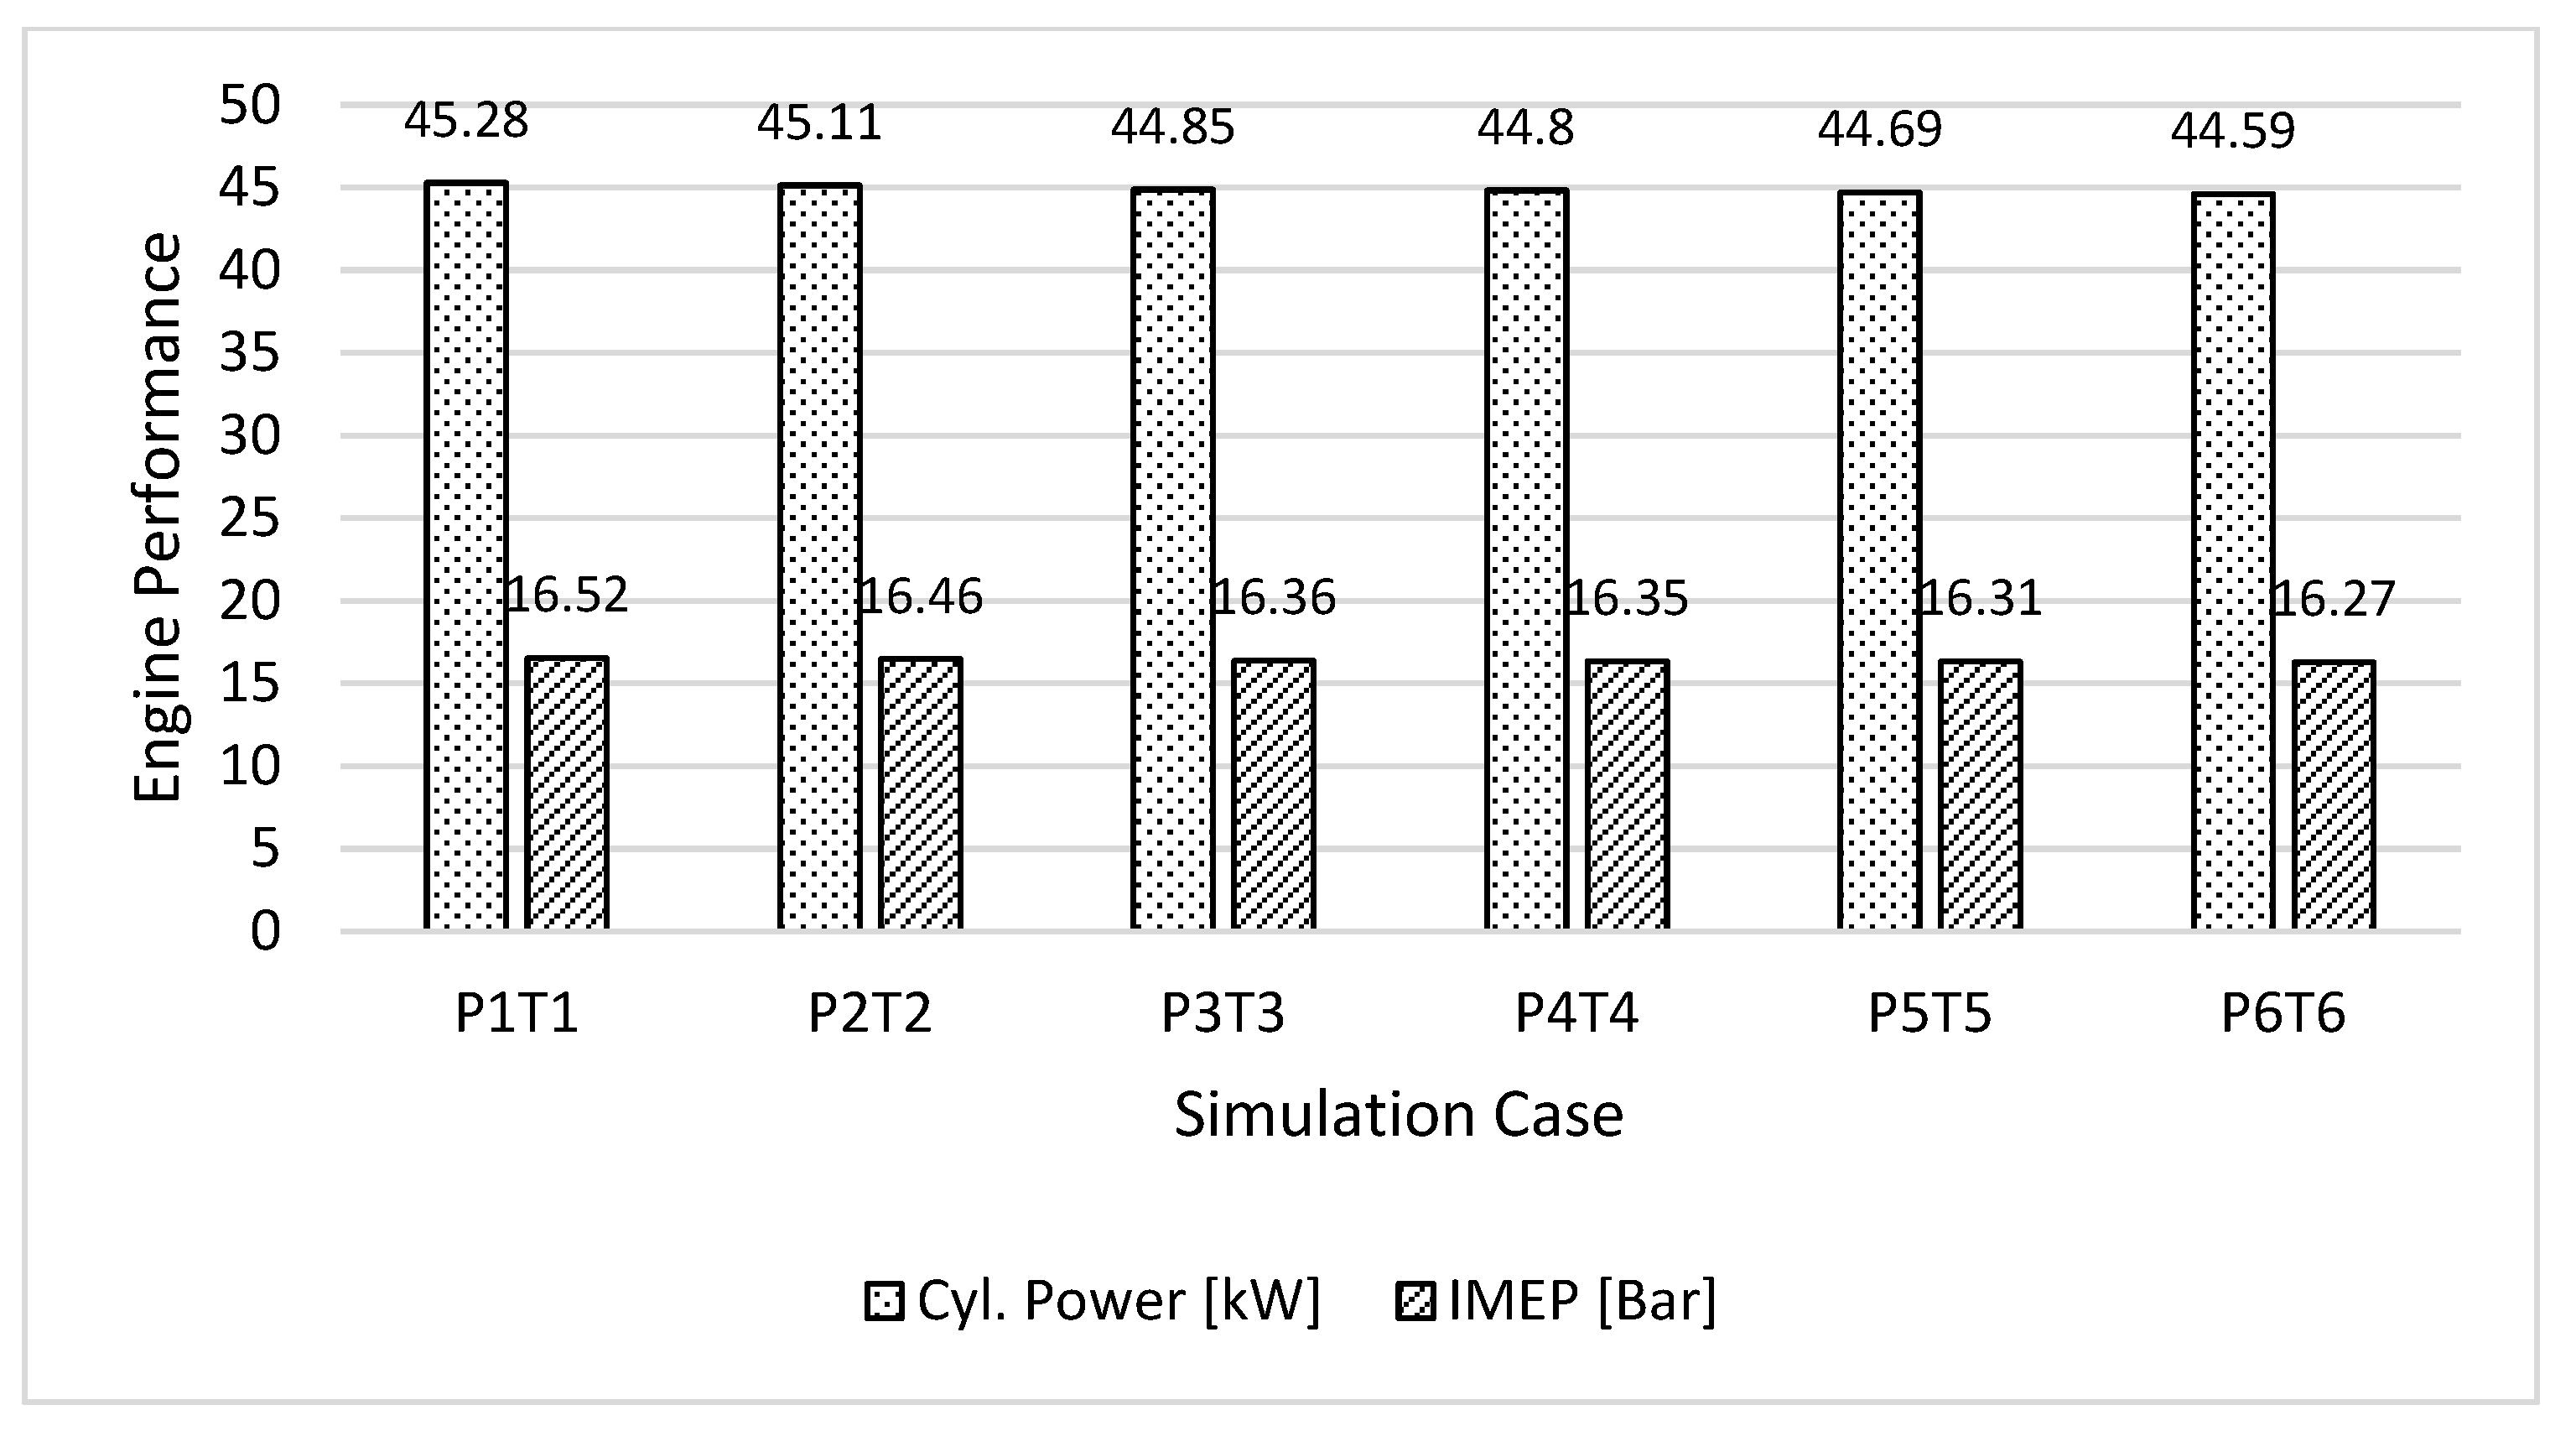
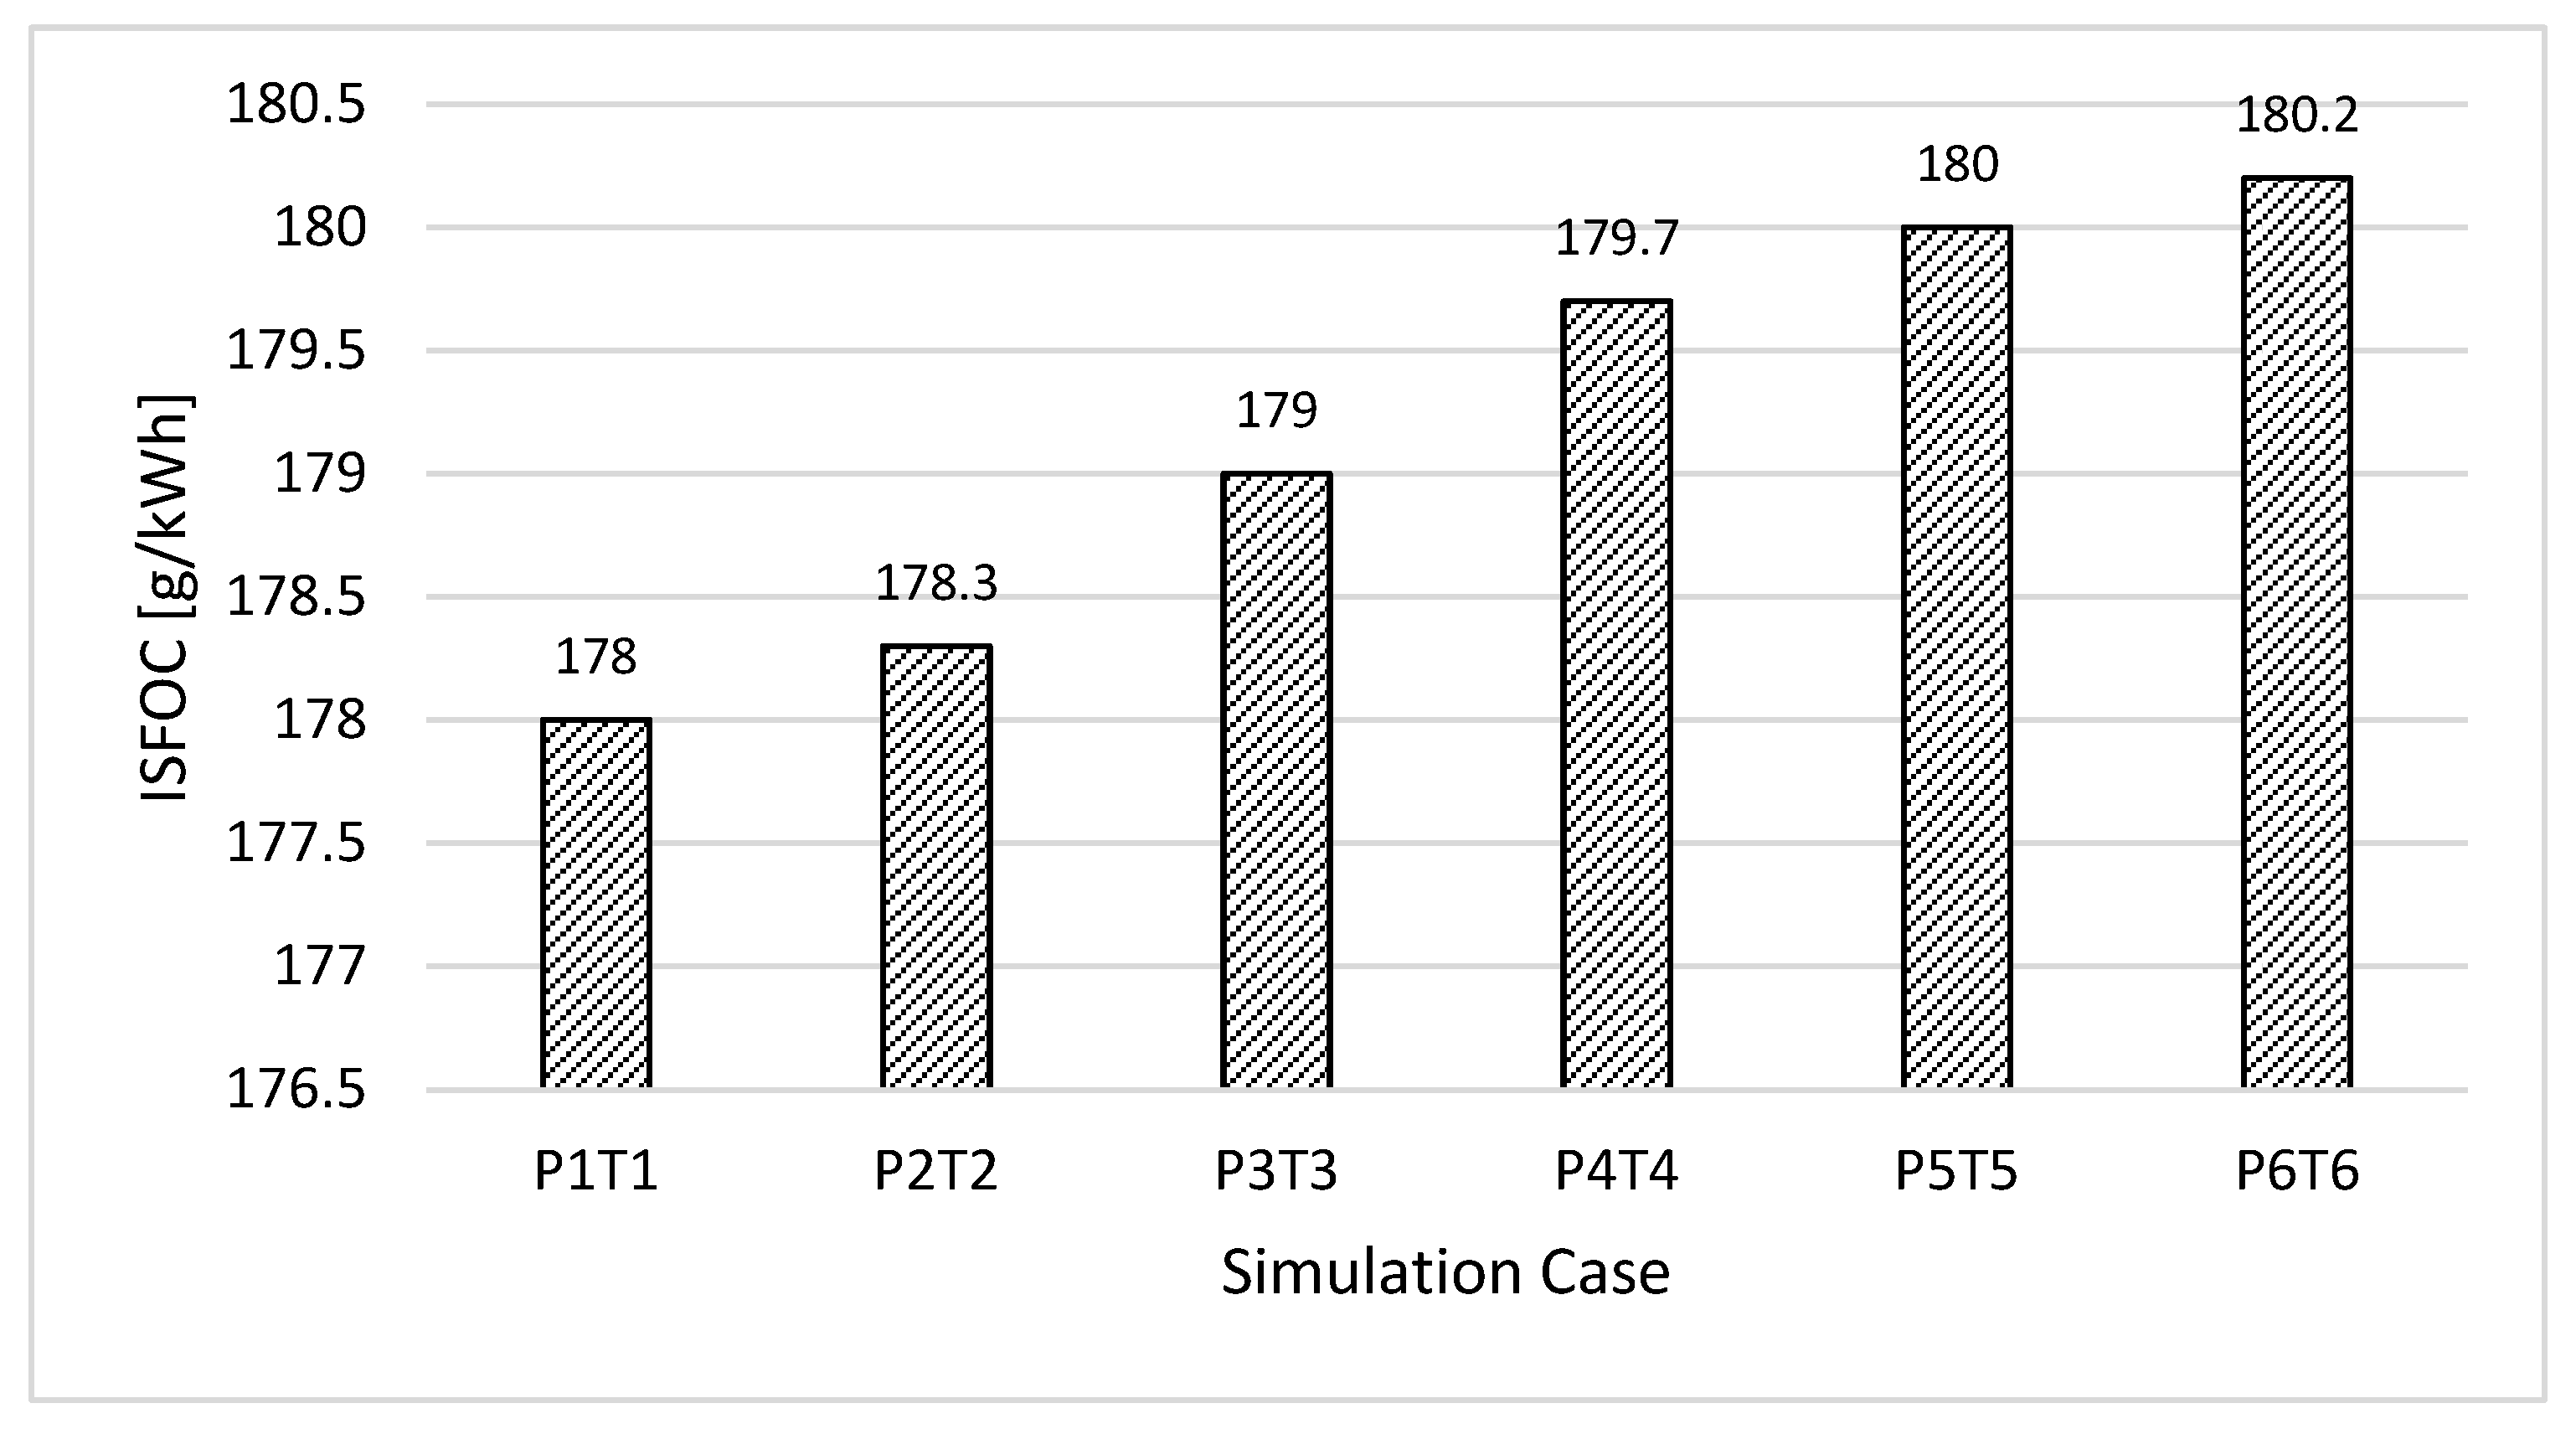
  • Cylinder power and IMEP of the engine decreased while the engine’s SFOC increased as the charge air pressure increased.
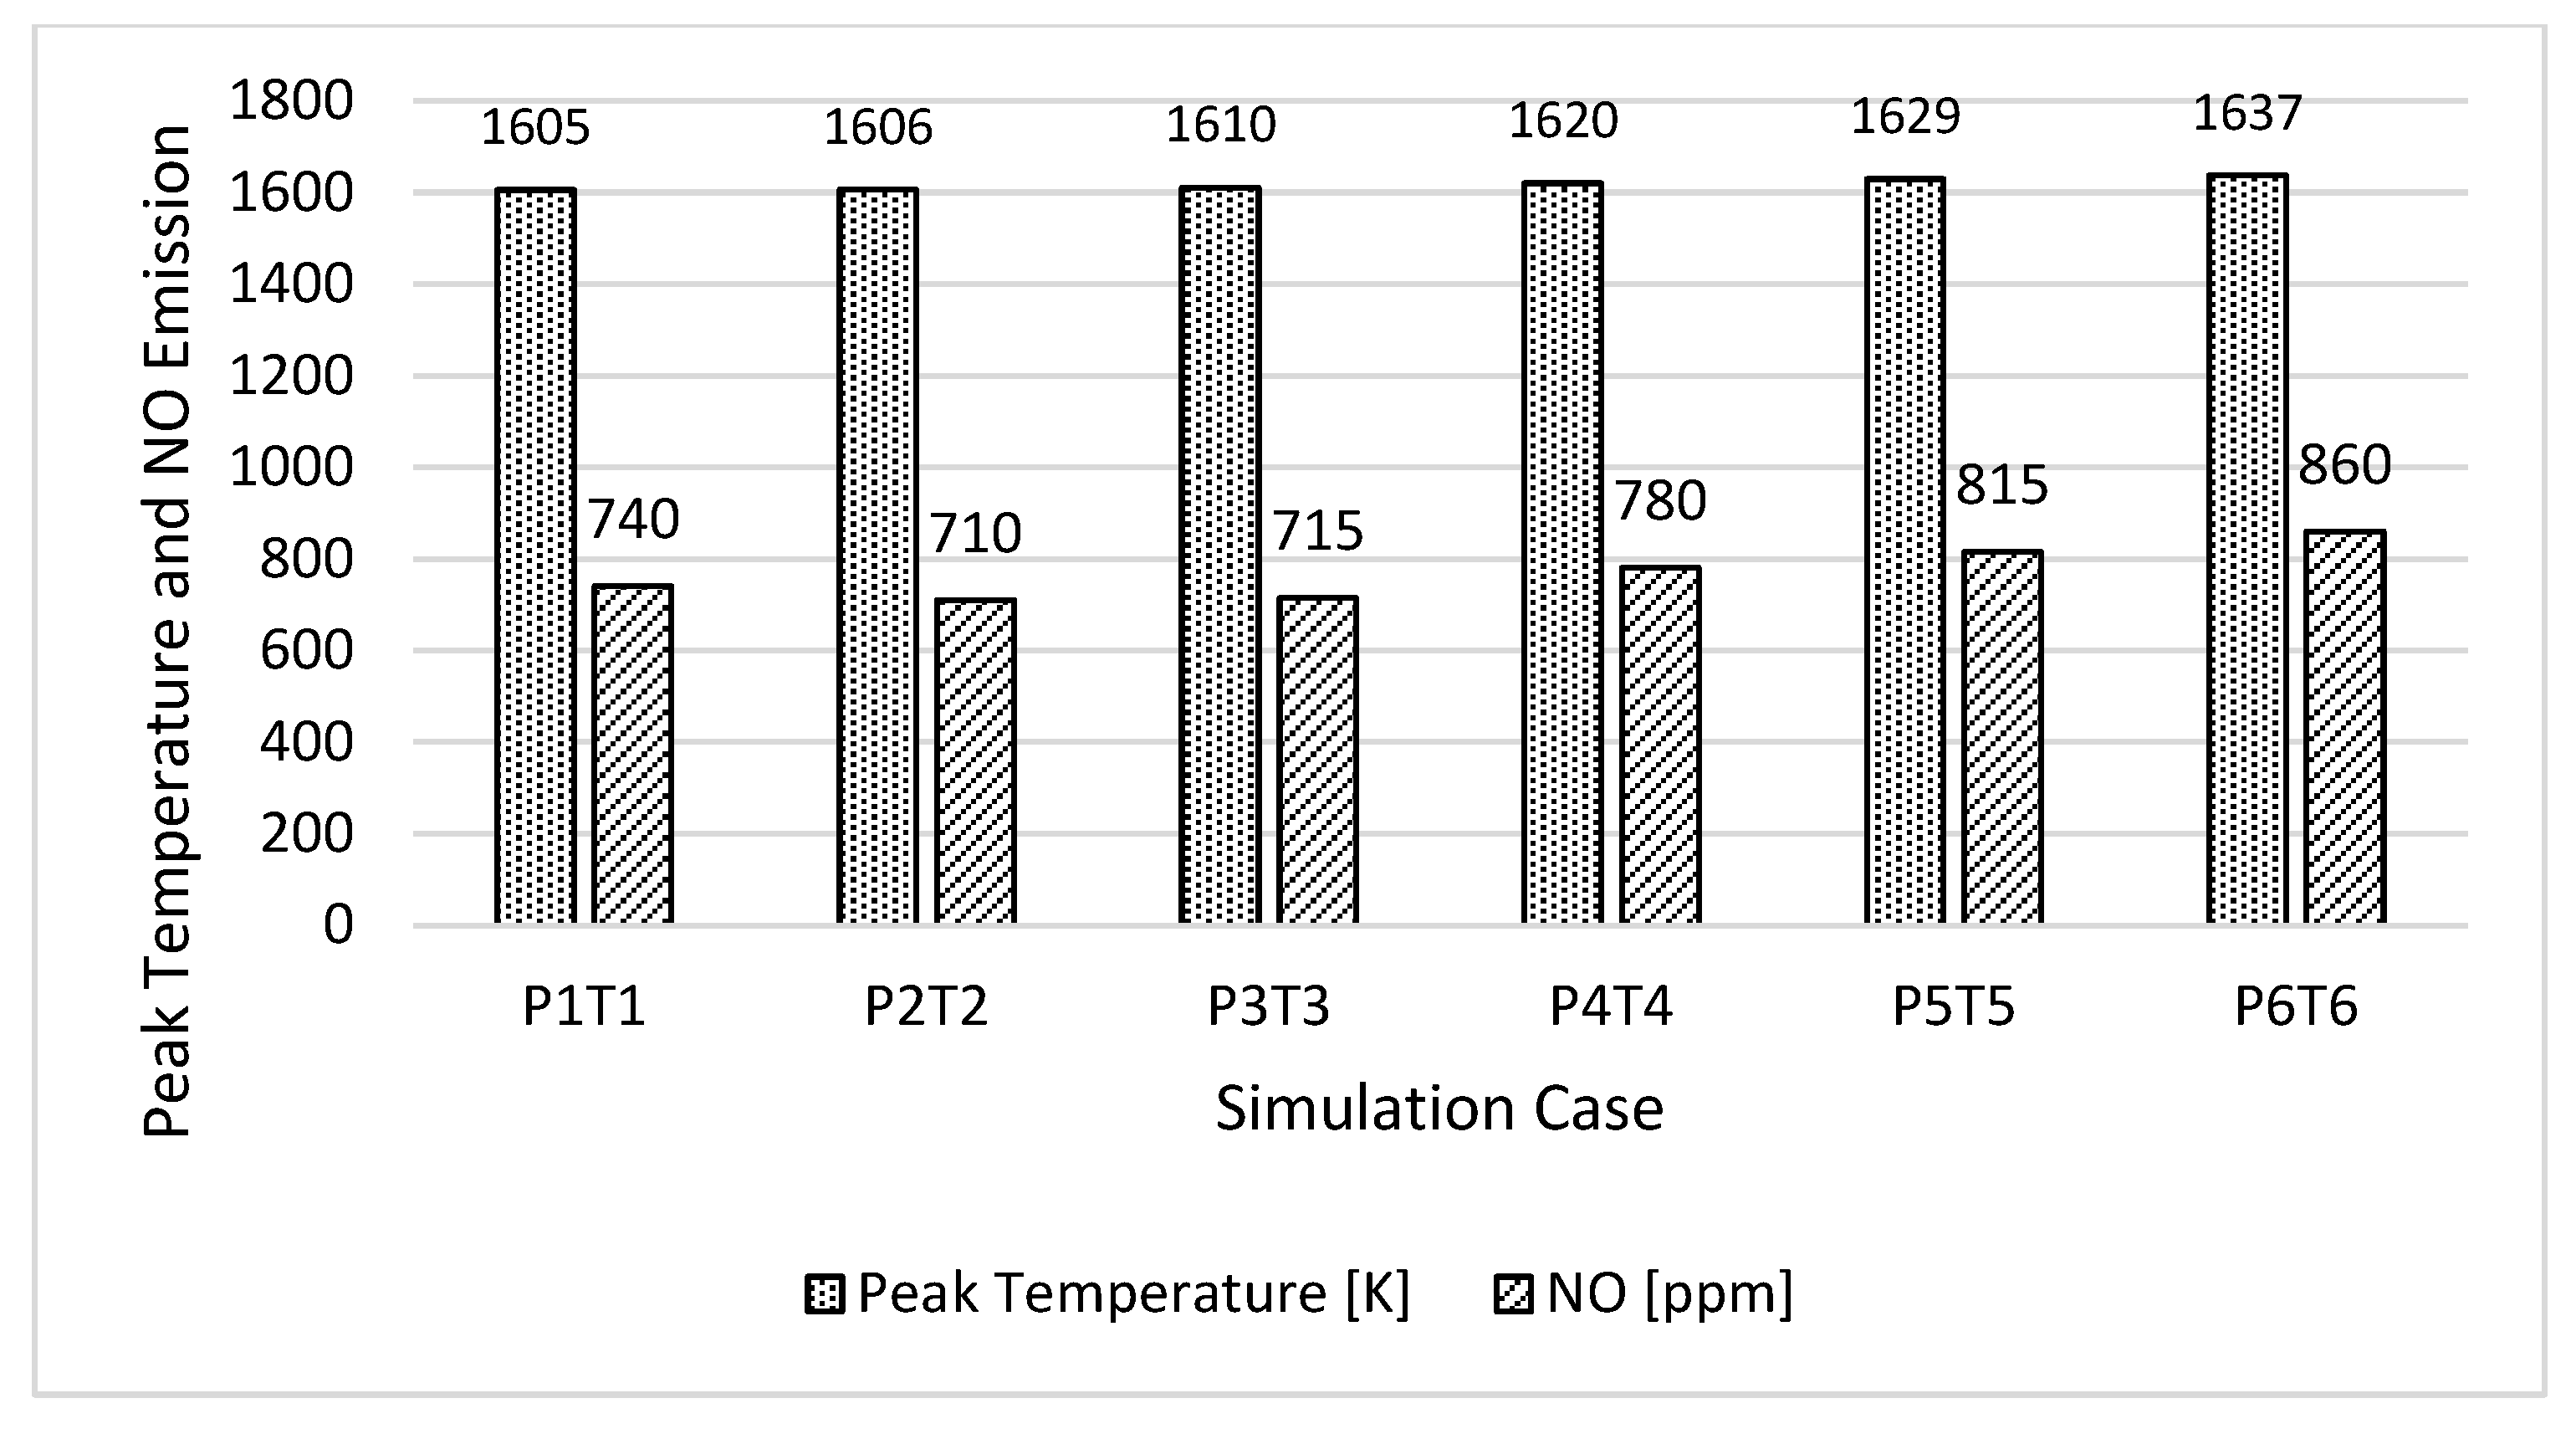
  • In-cylinder peak temperature increased, leading to an increase in thermal NO emissions as the charge air pressure increased.
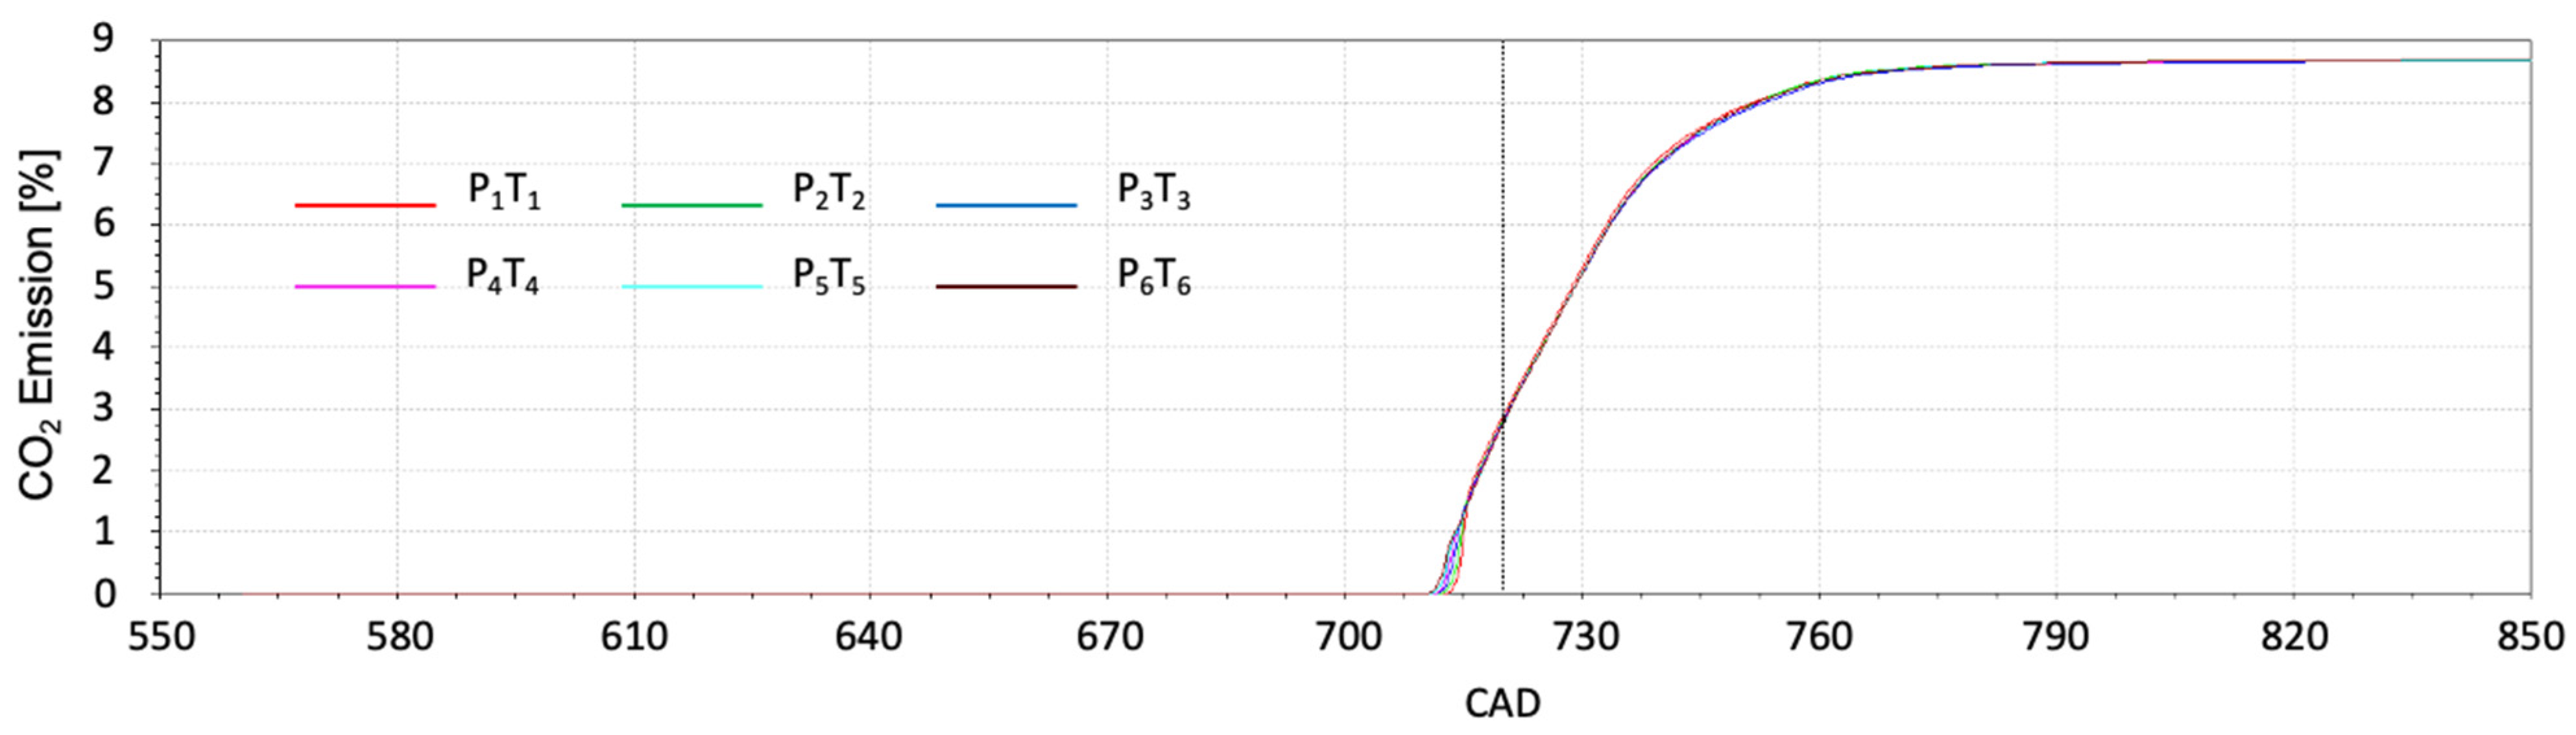
  • The fuel oxidation (combustion) to form CO2 emissions in the engine tended to take place earlier as the pressure and temperature of the charge air increased. However, the final CO2 emissions generated were almost unchanged.
2
Cooling the charge air after turbocharging
  • In-cylinder peak pressure increased as charge air pressure increased.
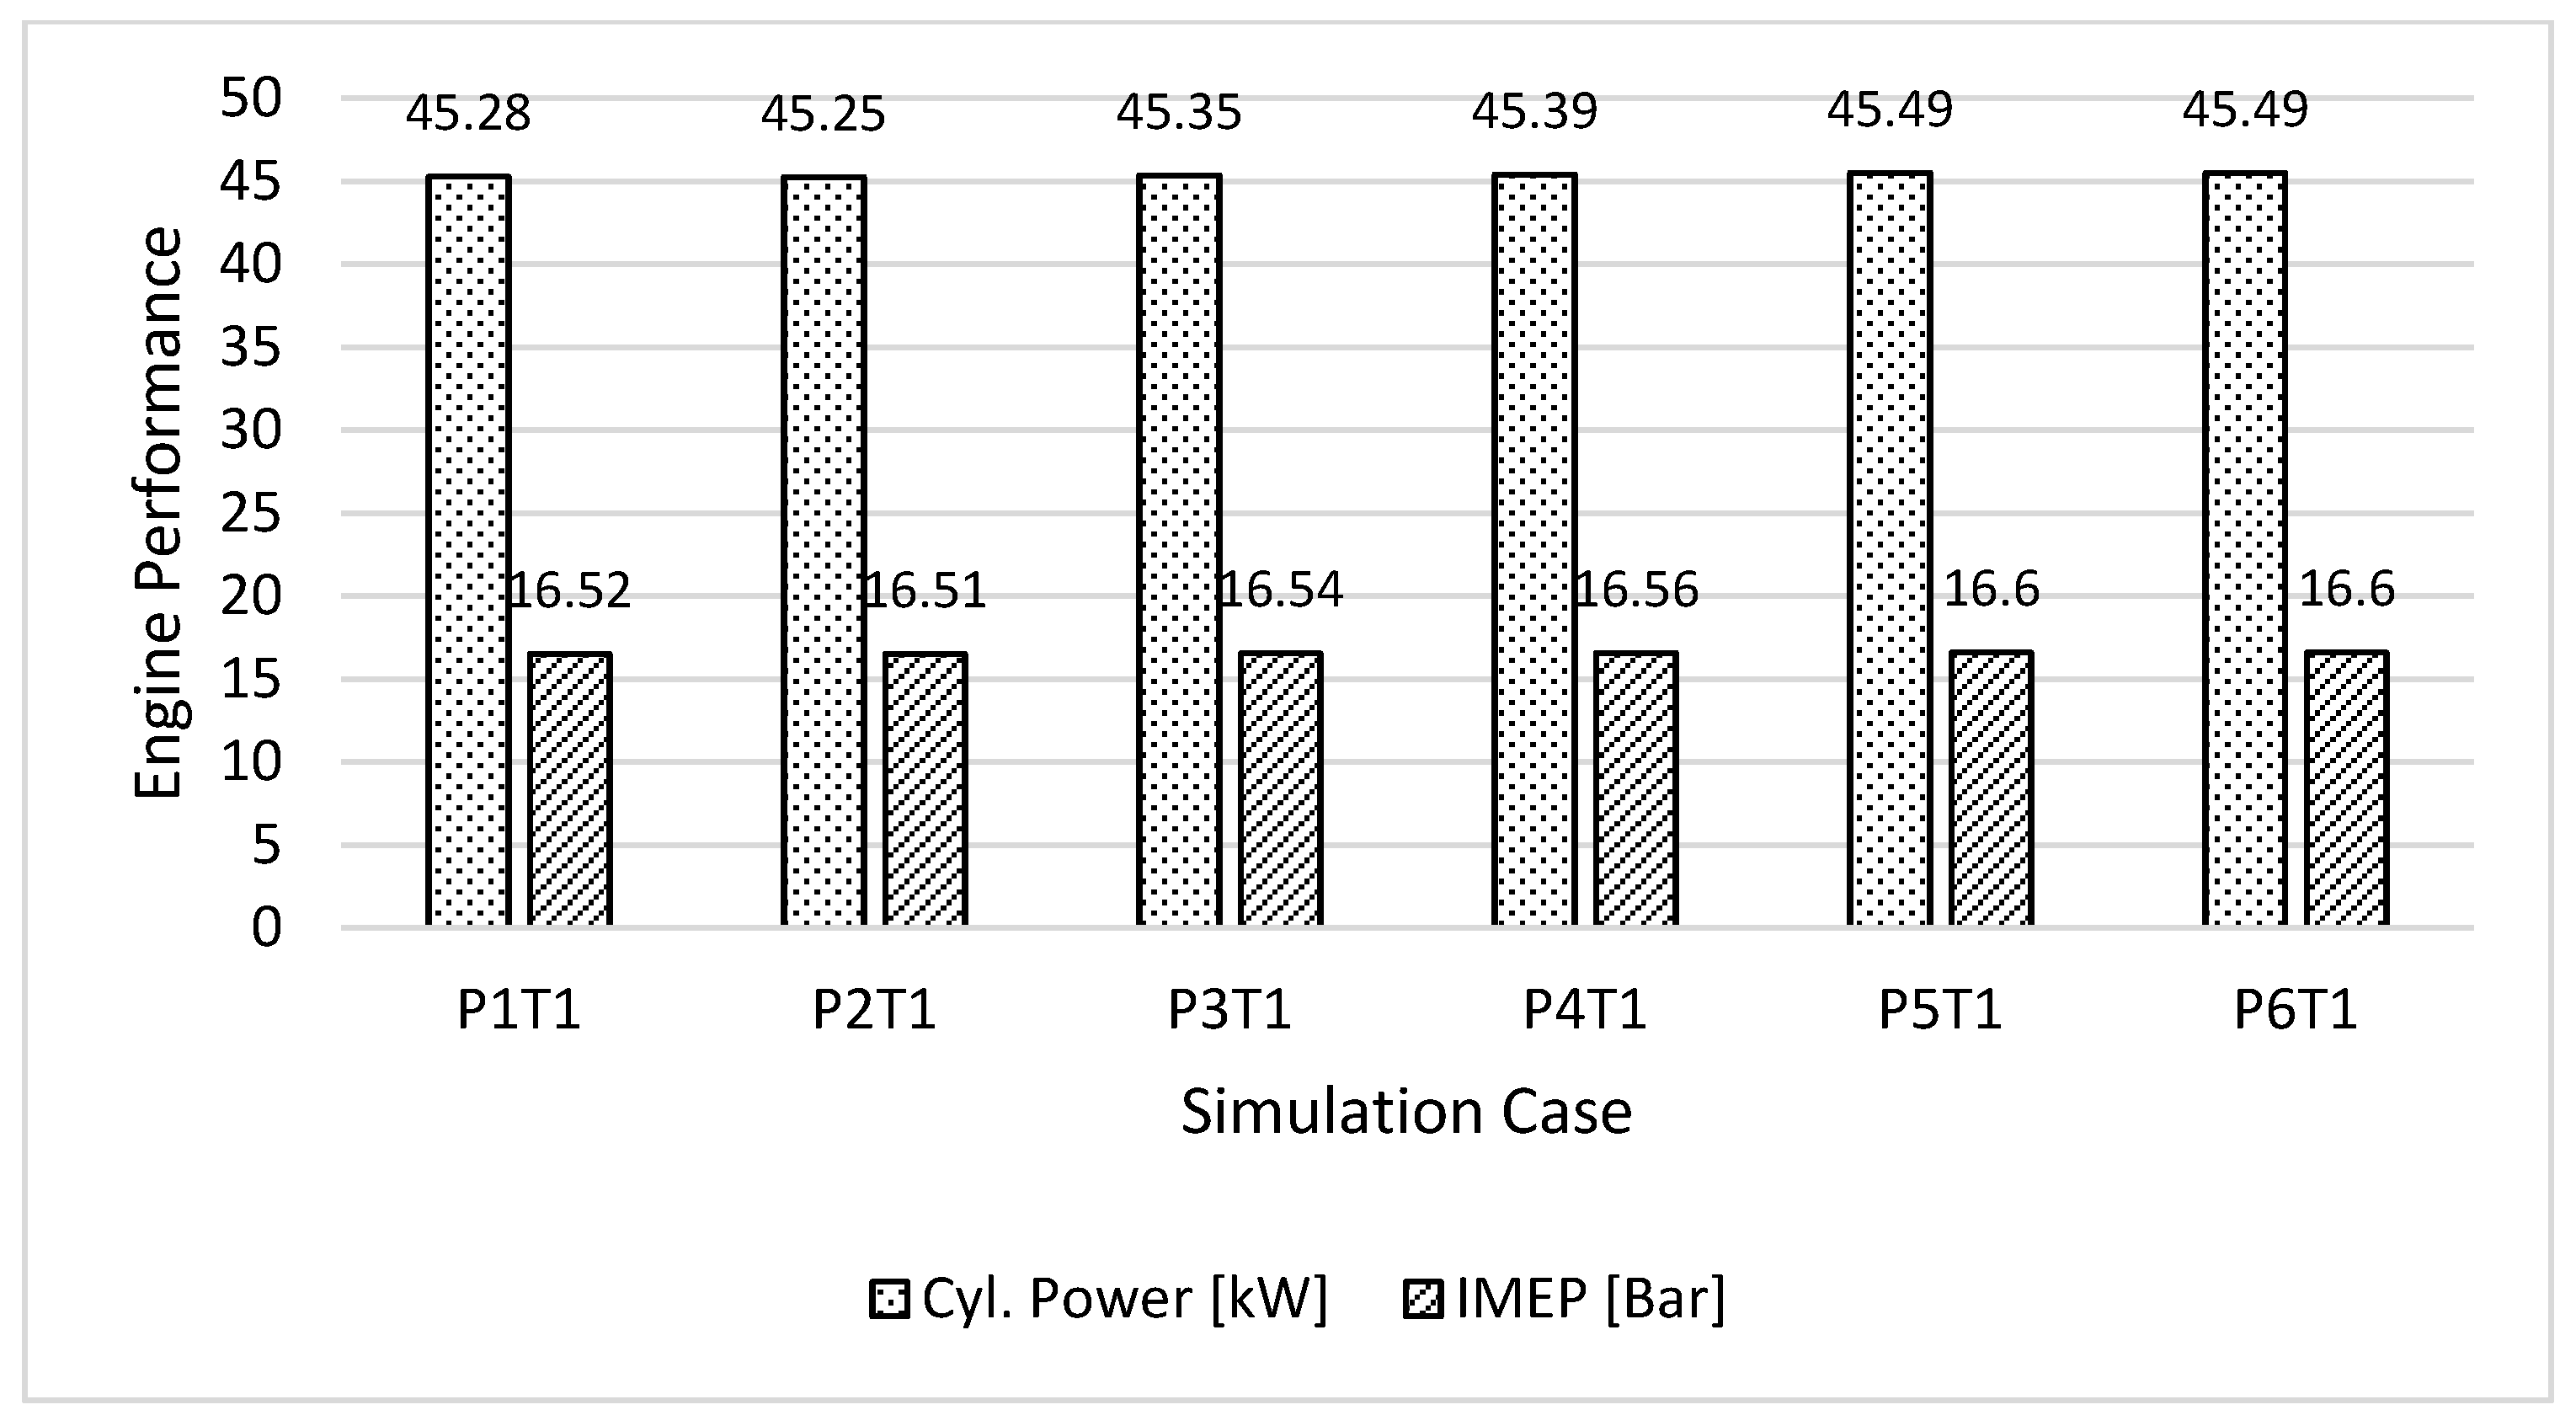
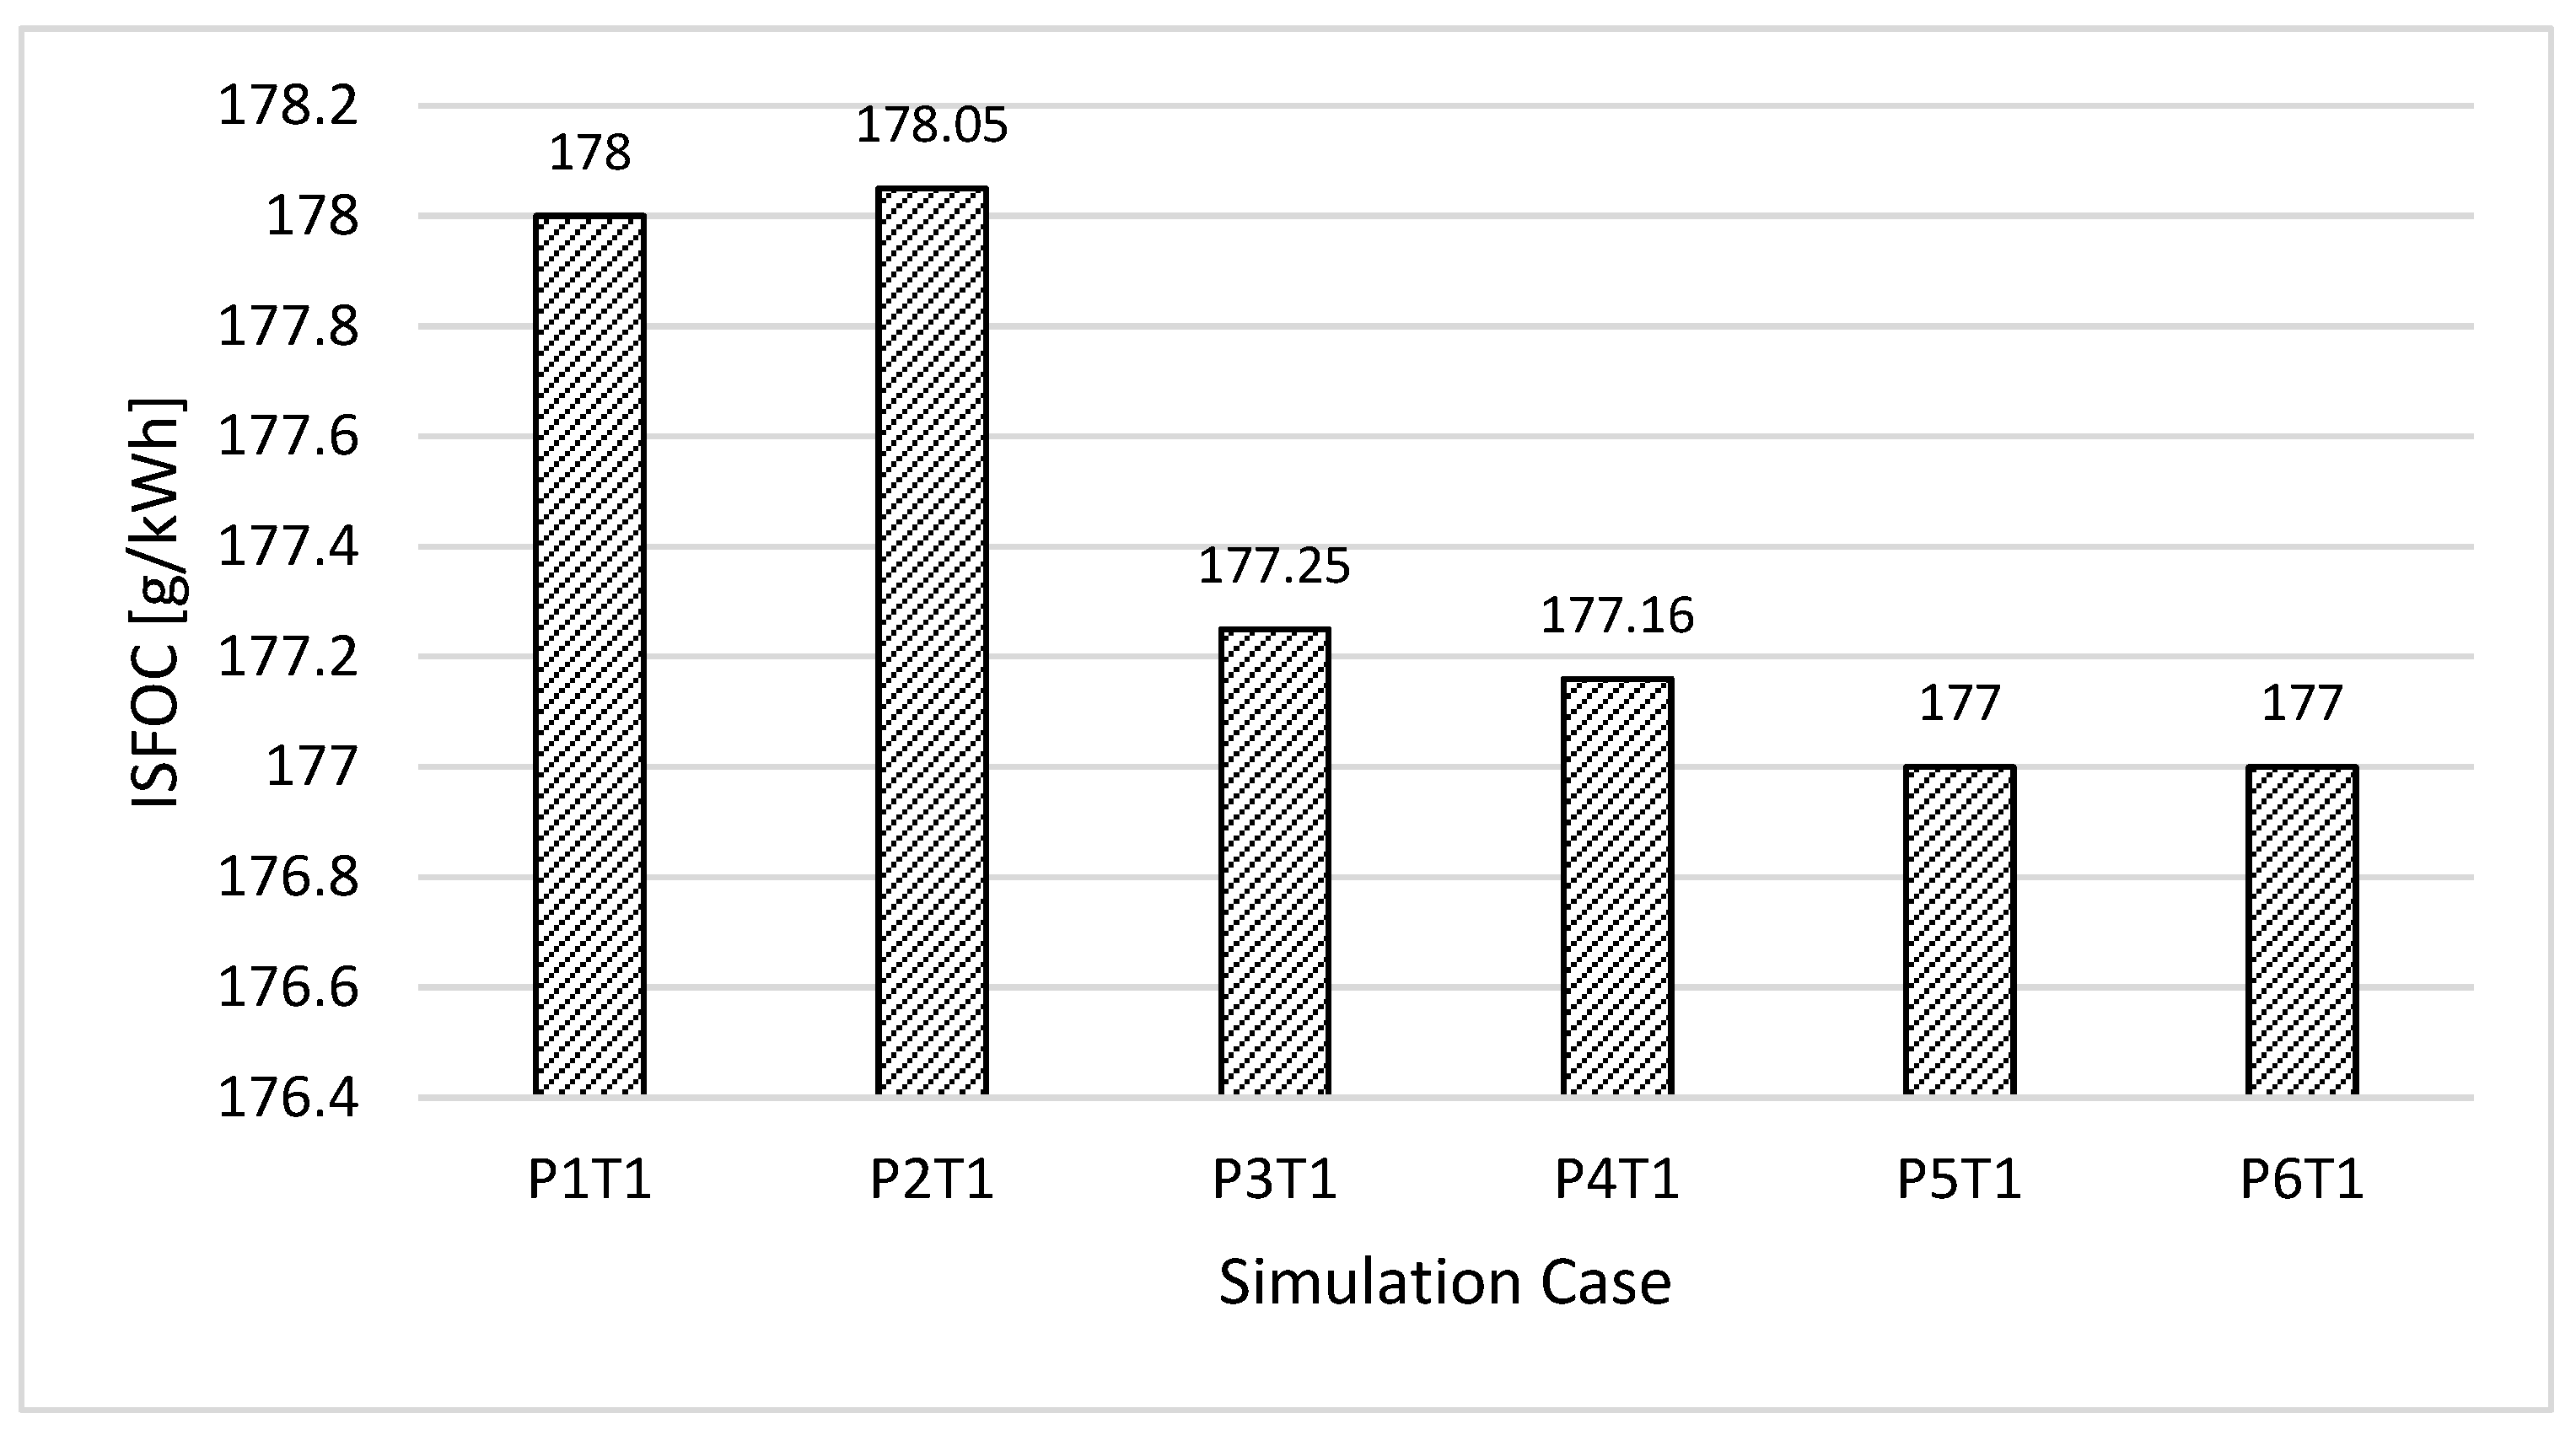
  • Cylinder power and IMEP of the engine increased, leading to a reduction in the engine’s SFOC as charge air pressure increased.
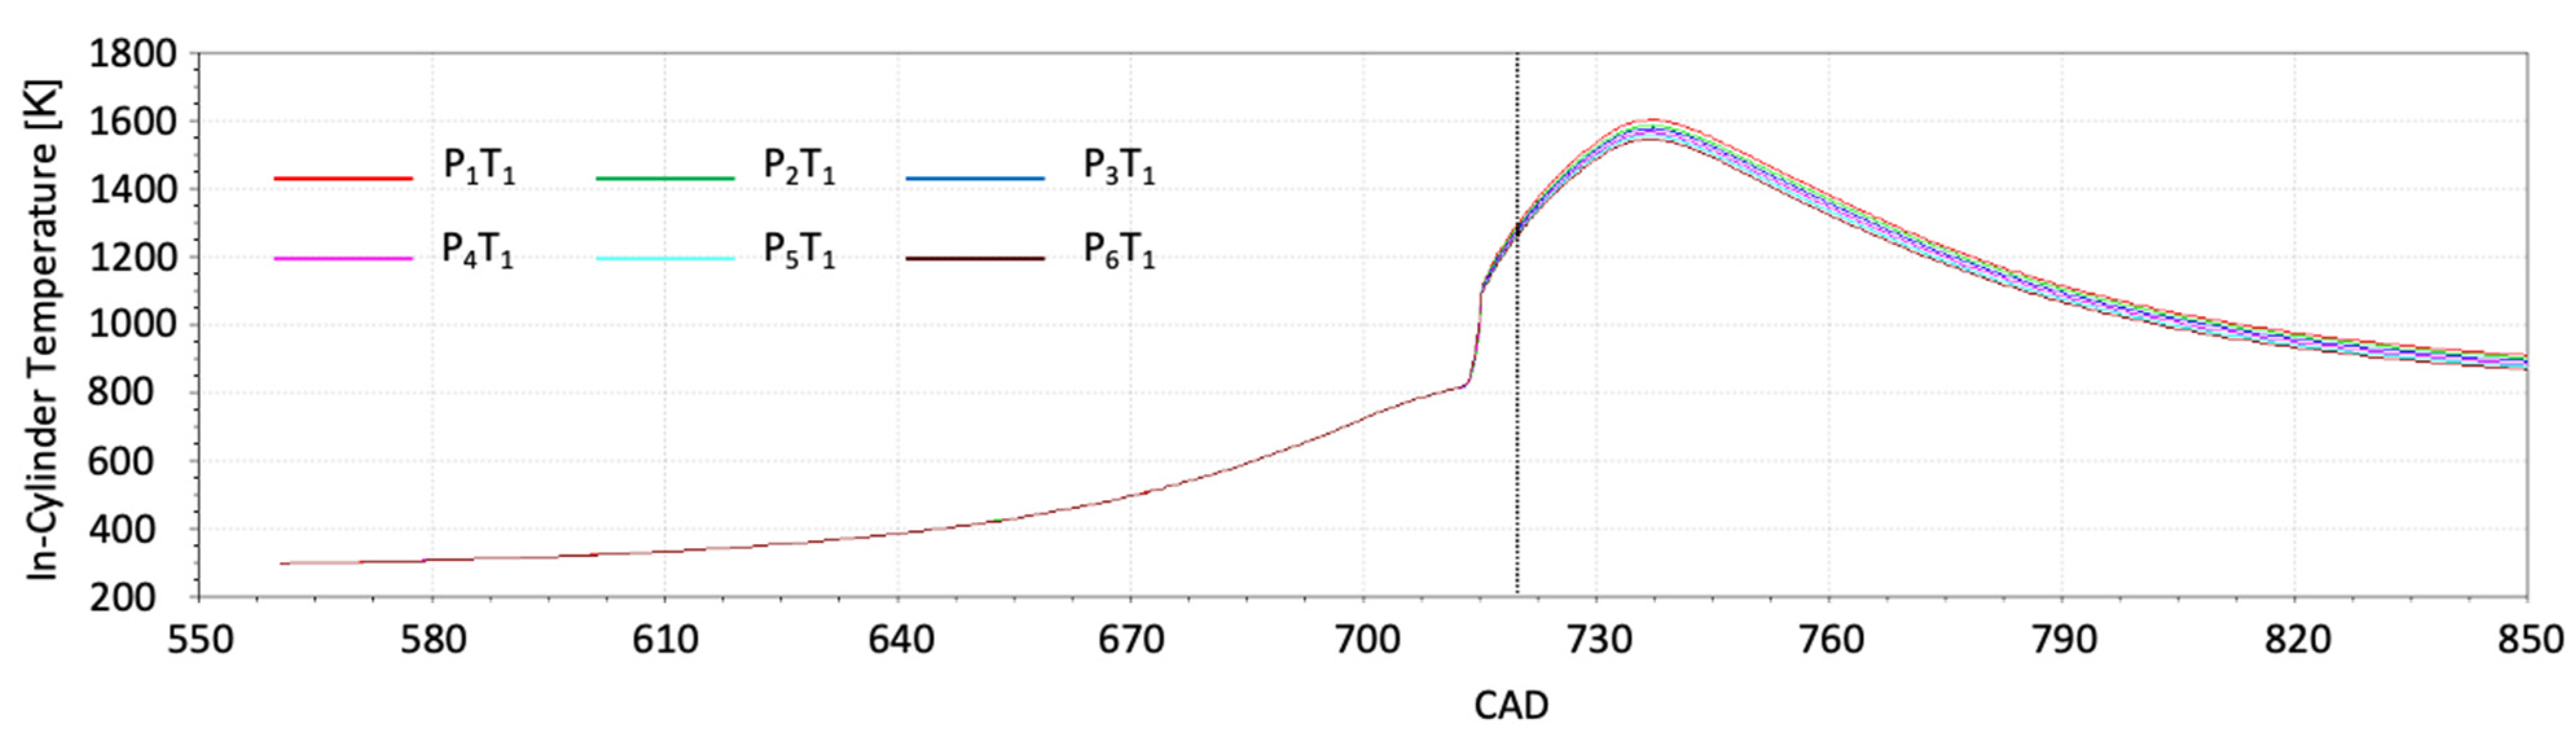
  • In-cylinder peak temperature decreased, leading to a decrease in thermal NO emissions as the charge air pressure increased.
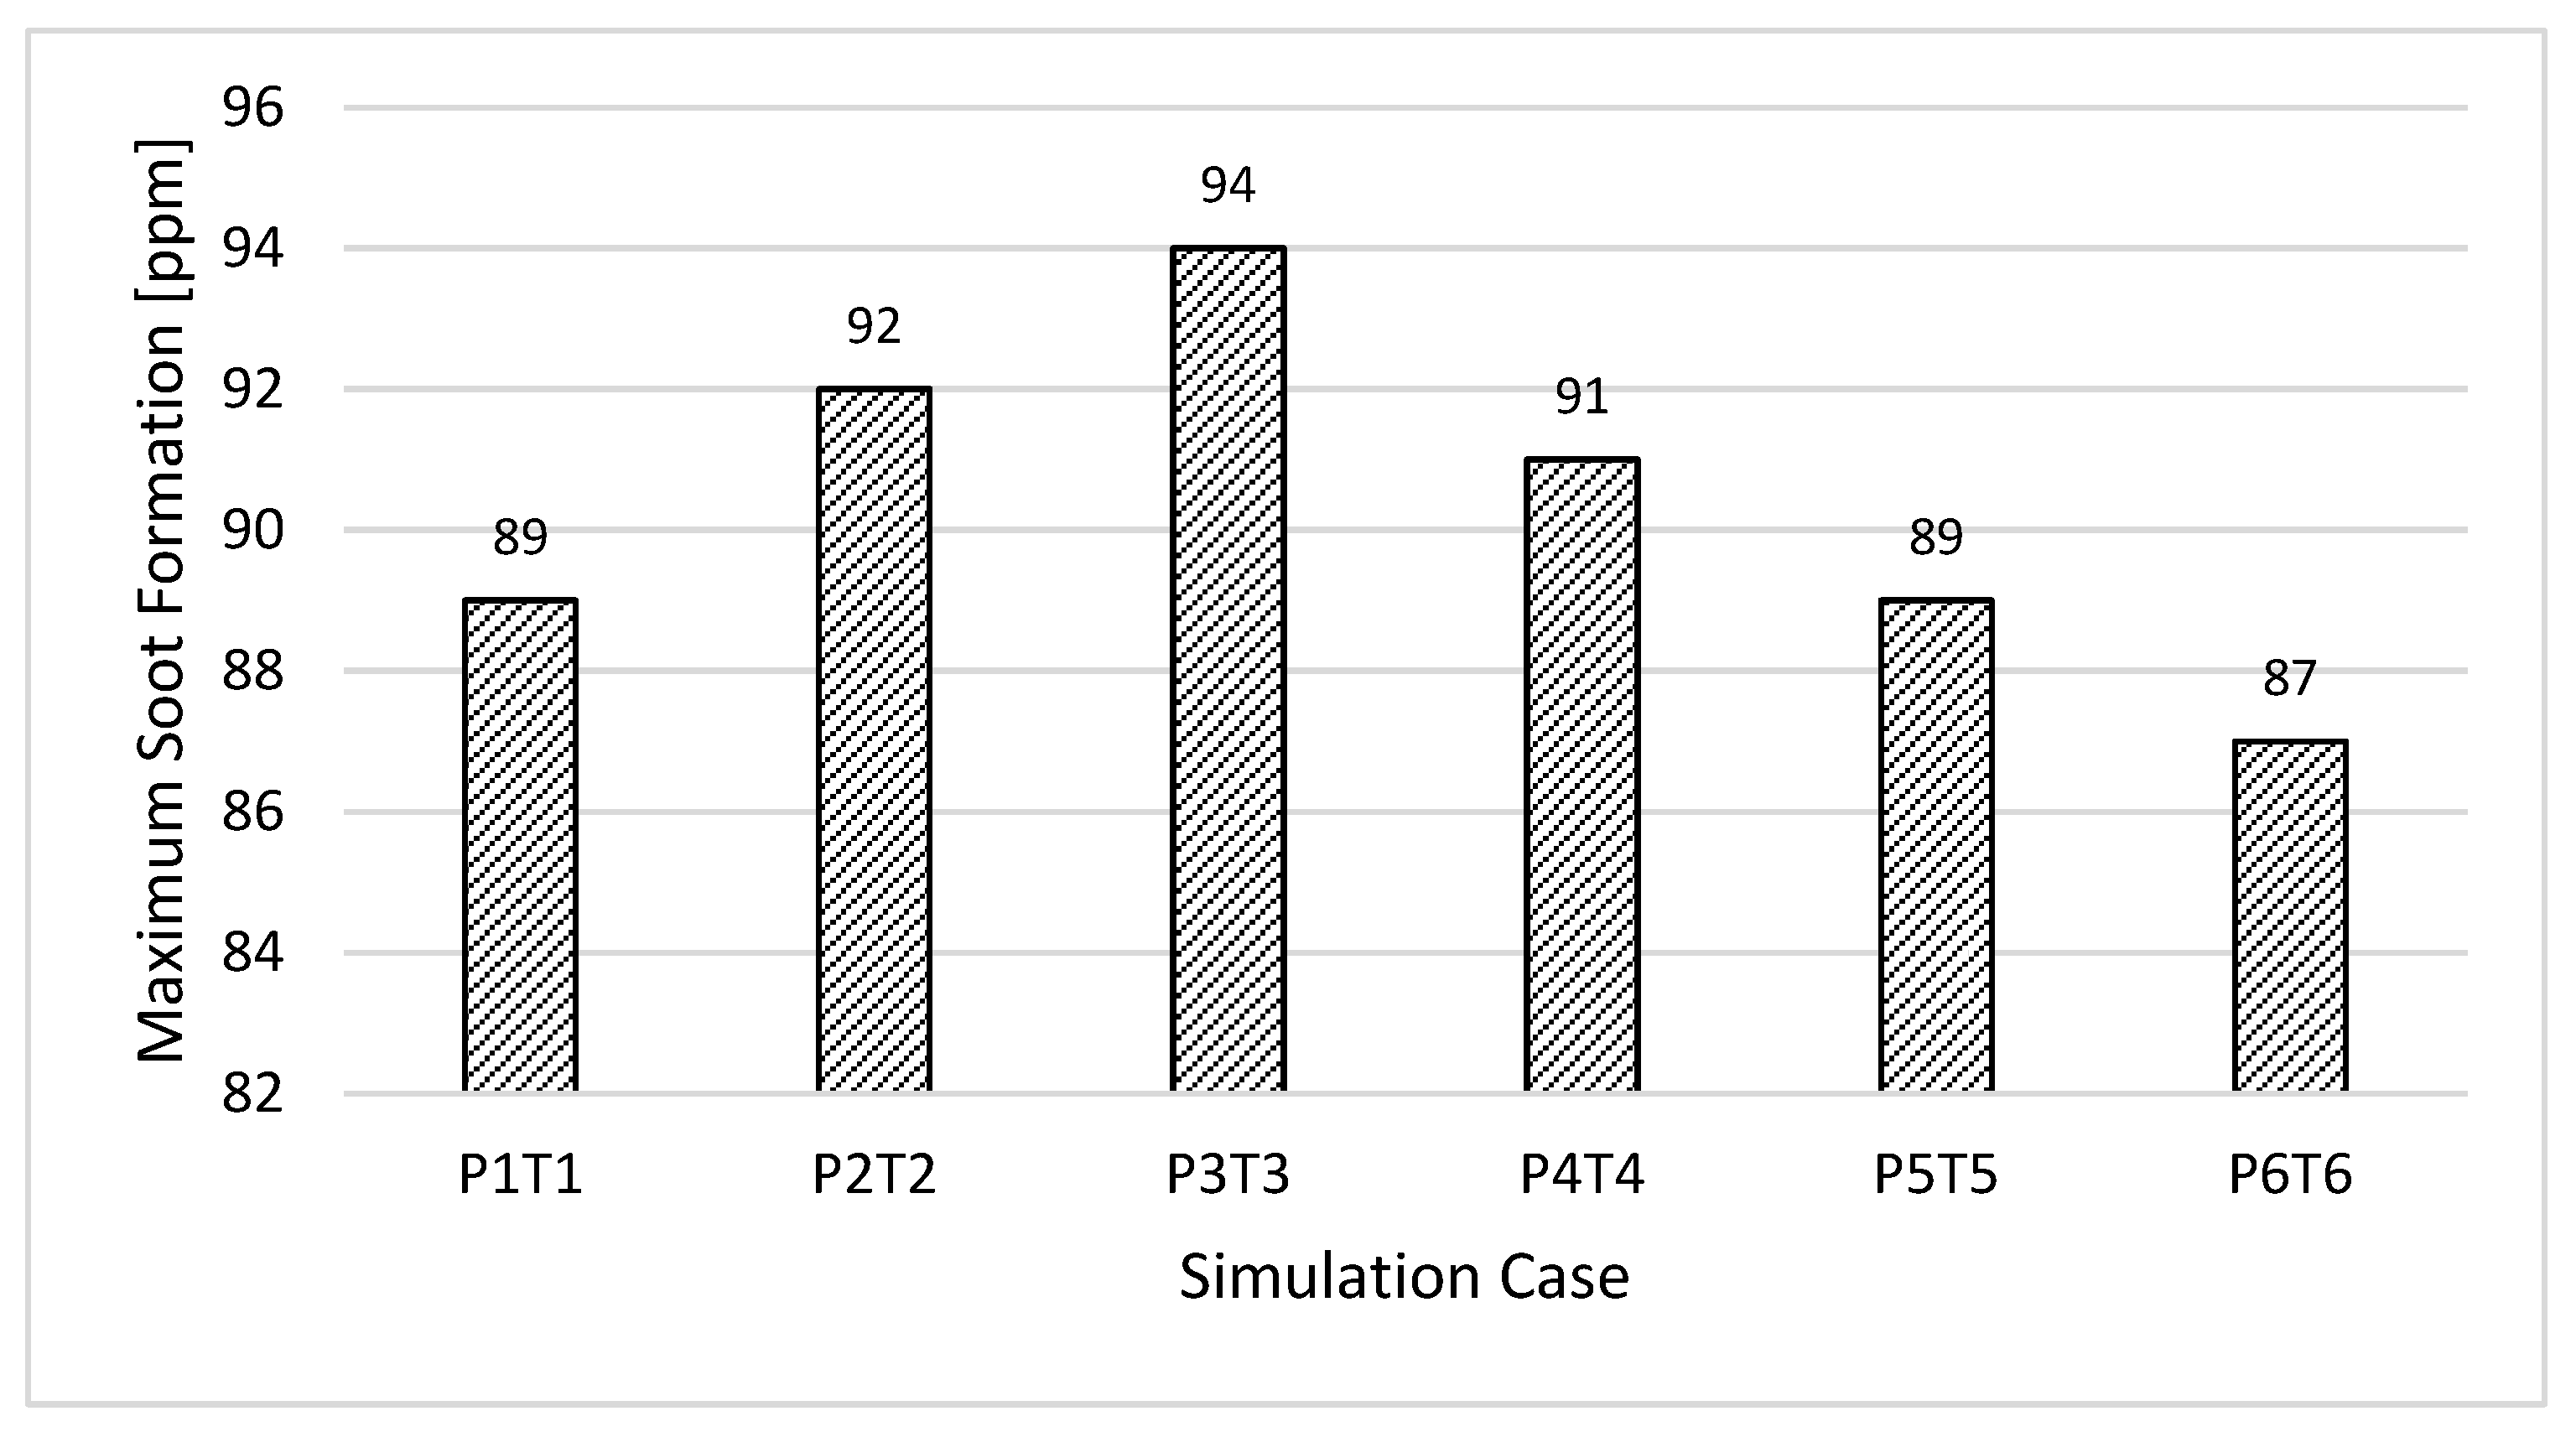
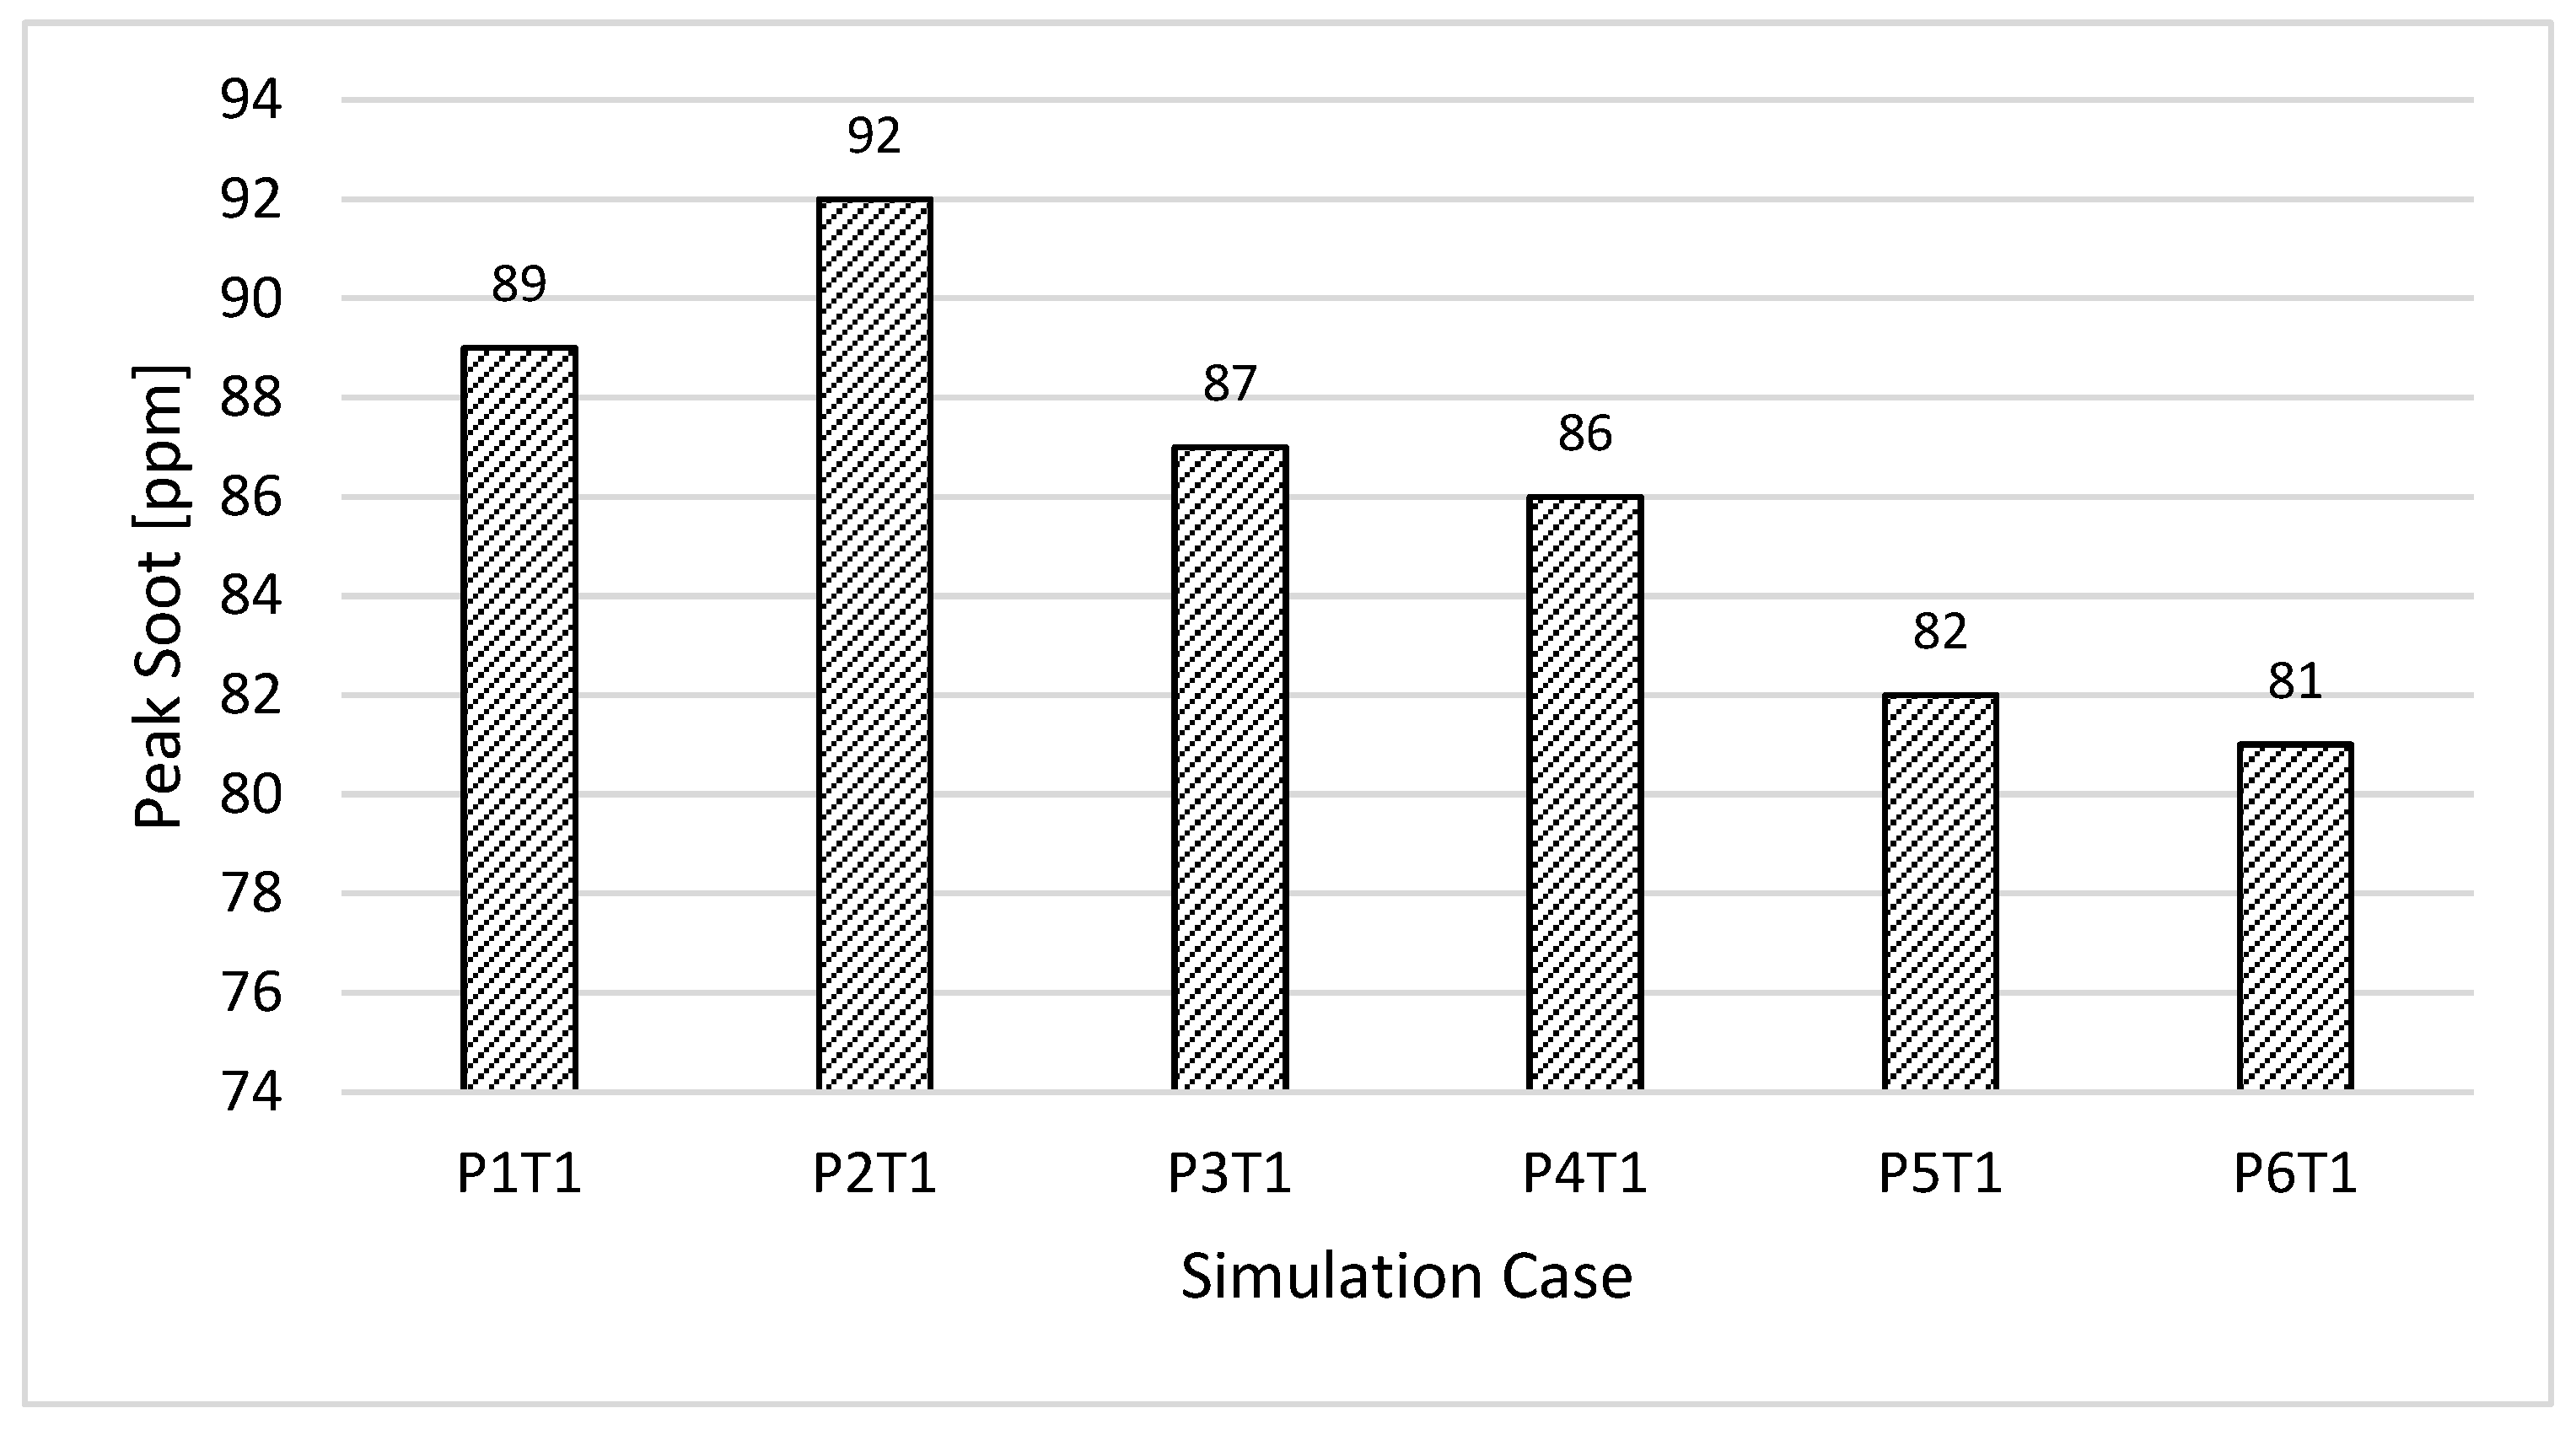
  • The maximum soot formed in the engine cylinder slightly increased as the pressure of the charge air increased and then tended to decrease if the pressure of the charge air continued to increase.
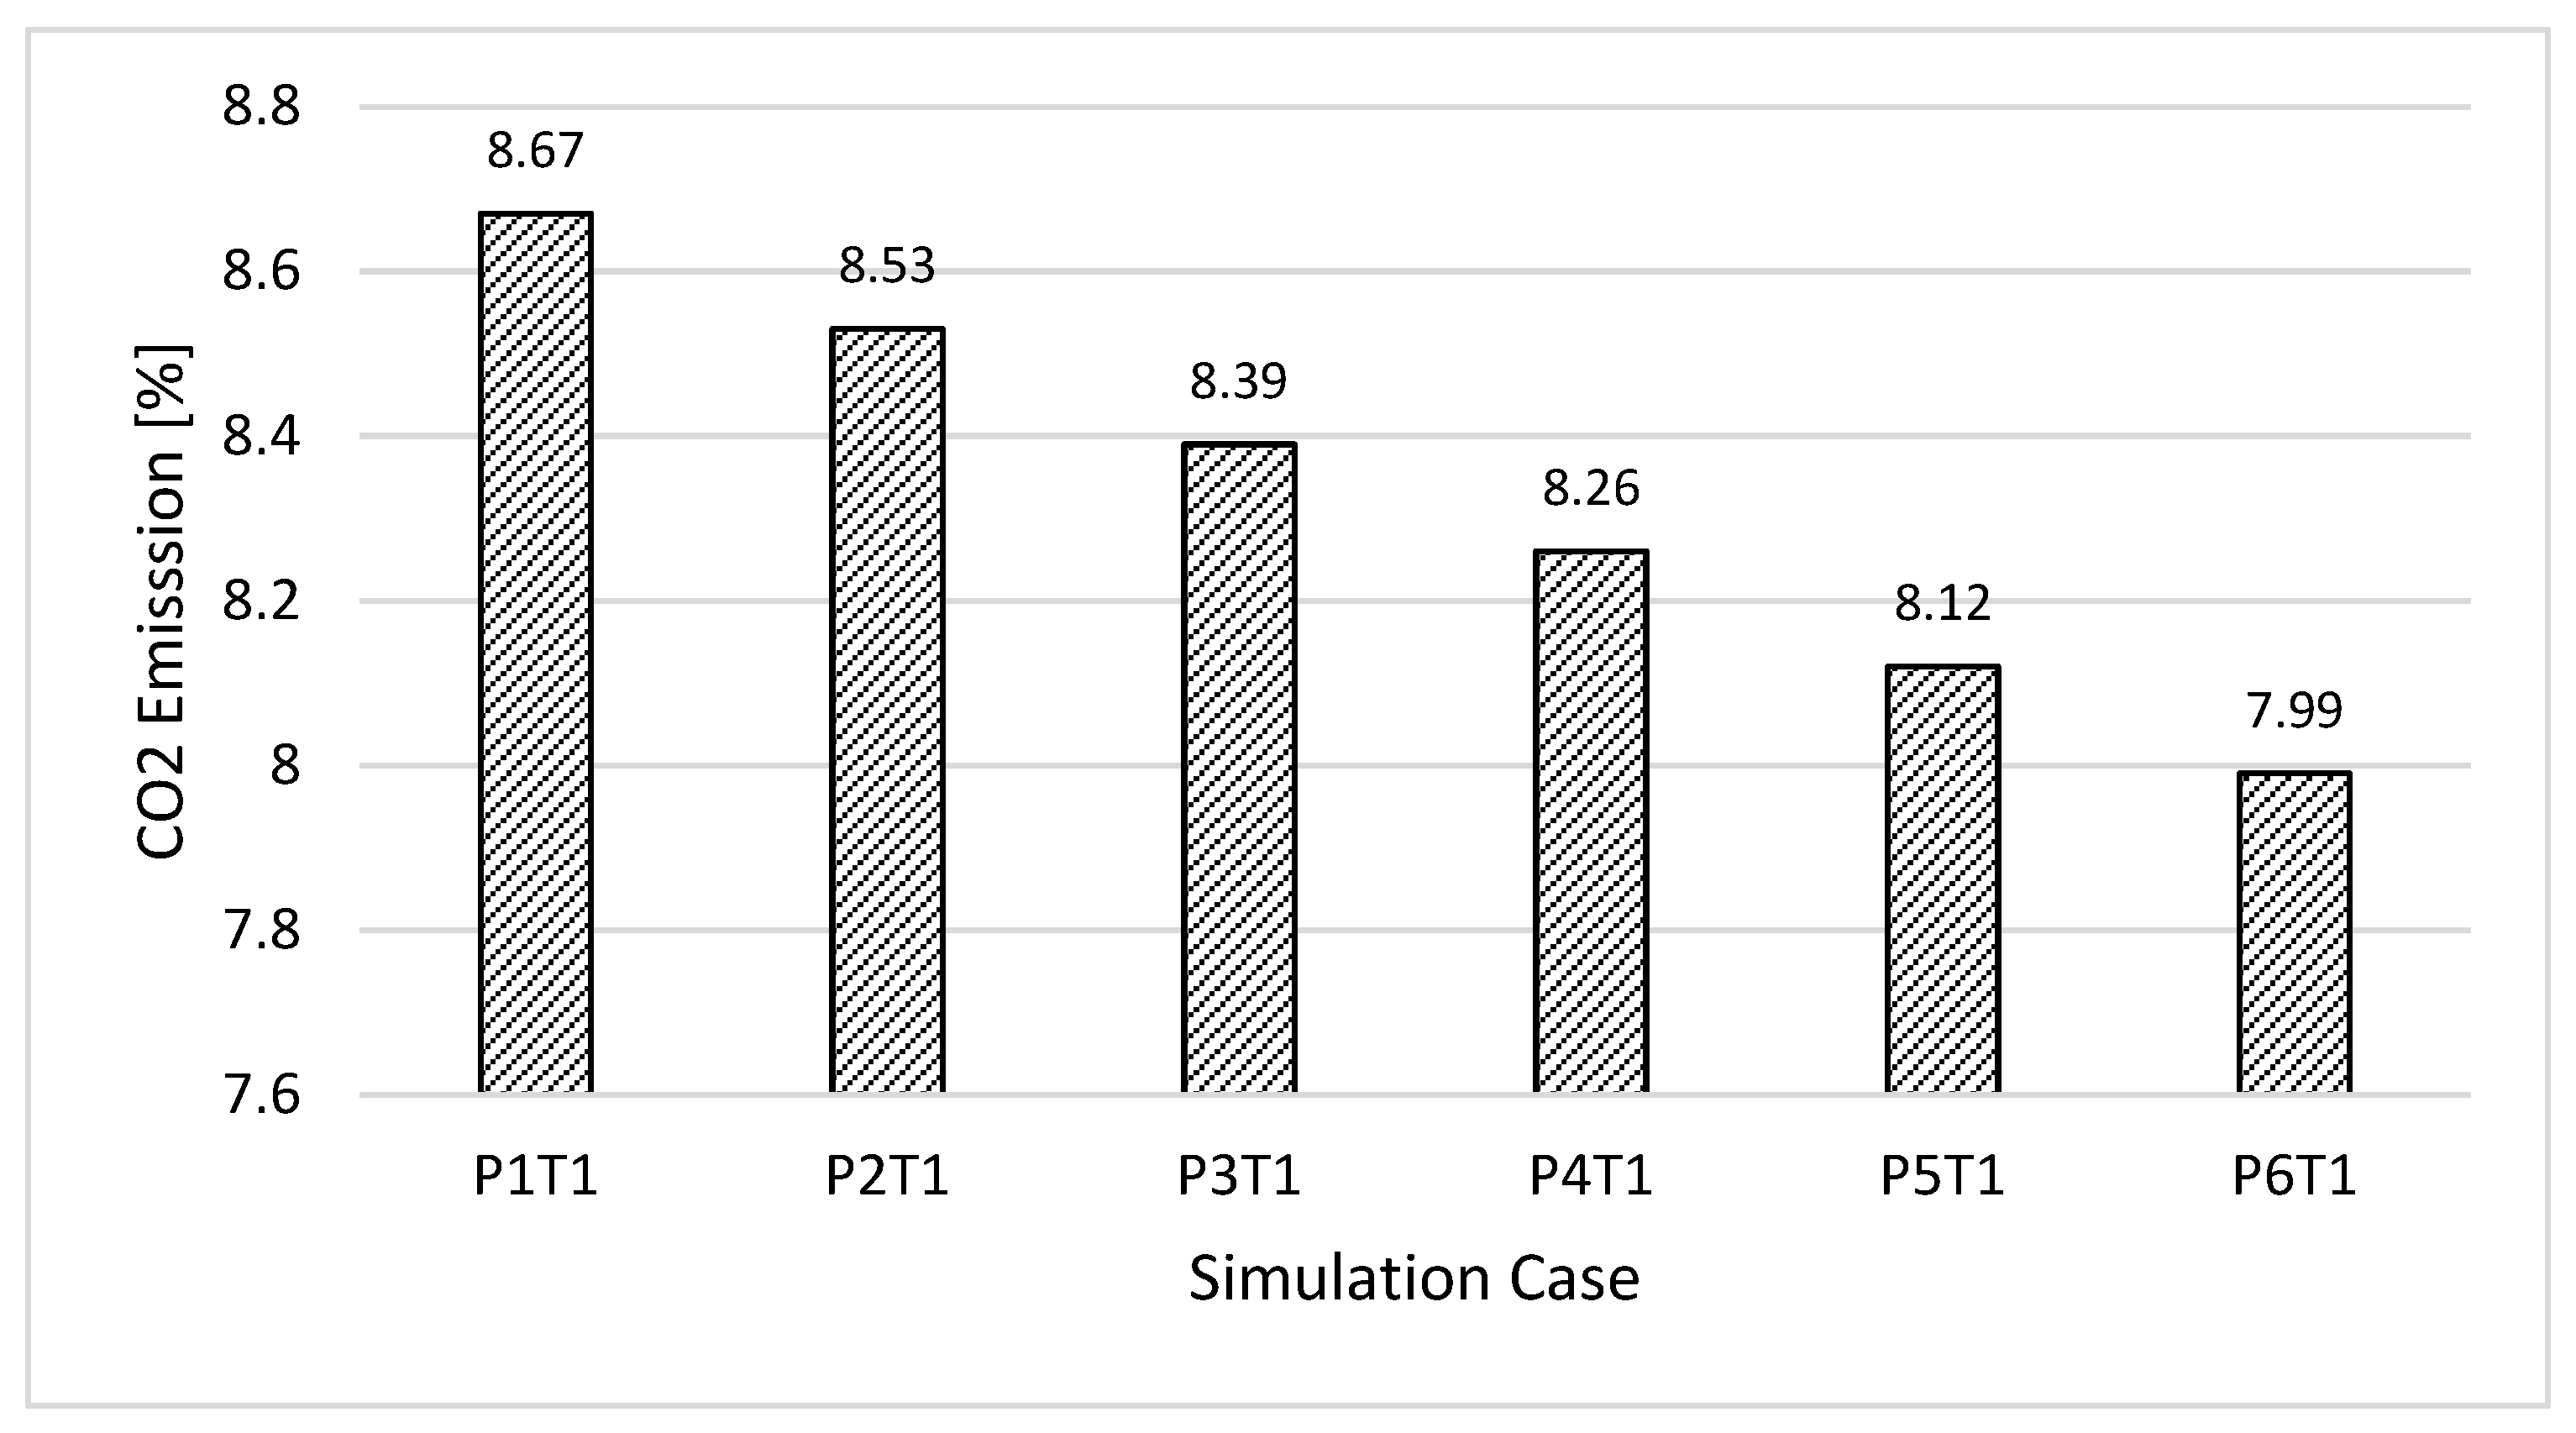
  • CO2 emission tended to decrease as charge air pressure increased.
This study shows that turbocharging the charge air for the engine will not be effective if the charge air after turbocharging is not cooled. By cooling the charge air after turbocharging the engine, both the power and economy performance of the engine are improved. Specifically, when increasing the charge air pressure from 2.33 bar to 2.53 bar while keeping the charge air temperature unchanged through the use of cooling, engine power was increased by 0.46% while fuel oil consumption was reduced by approximately 0.56%. Specifically, increasing the charge air pressure reduced NO, CO2, and soot emissions by 14.46, 7.84, and 8.9%, respectively.
As is known, the quality of combustion of the fuel inside the engine combustion chamber and the emission characteristics of the engine are not only affected by the parameters of the intake air but also depend on other factors related to the fuel, engine parts related to the fuel injection system, injector structure, injection timing, injection strategy, injection pressure, nozzle hole diameter, combustion chamber shape, etc. Therefore, to evaluate the factors that overall are affecting the combustion and emission of the engine, in the future, it is necessary to conduct research related to the above-mentioned issues.

Author Contributions

Conceptualization, V.C.P., V.V.L. and D.T.N.; methodology, V.C.P. and V.V.L.; software, V.C.P. and D.T.N.; validation, V.C.P. and V.V.L.; formal analysis, V.C.P. and M.T.V.; data curation, D.T.N. and M.T.V.; writing—original draft preparation, D.T.N.; writing—review and editing, V.C.P. and D.T.N.; project administration, V.C.P.; funding acquisition, V.C.P. All authors have read and agreed to the published version of the manuscript.

Funding

This research received no external funding.

Data Availability Statement

Not applicable.

Conflicts of Interest

The authors declare no conflict of interest.

Nomenclature

3DThree-DimensionalGHGGreenhouse Gas
ABDCAfter the Bottom Dead CentreICEInternal Combustion Engine
BBDCBefore the Bottom Dead CentreIDIgnition Delay
BCBoundary ConditionIMEPIndicated Mean Efficiency Pressure
BDCBottom Dead CentreIMOInternational Maritime Organization
SFOCSpecific Fuel Oil ConsumptionKHRTKelvin–Helmholtz Rayleigh–Taylor
CADCrank Angle DegreeLCVLower Calorific Value
CFDComputational Fluid DynamicPAHPolycyclic Aromatic Hydrocarbon
CIECompression Ignition EnginePMParticulate Matter
CRCompression RatioPRRPressure Rise Rate
DFDual-FuelRMSRoot Mean Square
ECAEmission Control AreaROHRRate of Heat Release
EGEExhaust Gas EmissionSOIStart of Injection
EOIEnd of InjectionTDCTop Dead Centre
EVCExhaust Valve Closing TKETurbulence Kinetic Energy
EVOExhaust Valve OpeningUHCUnburnt Hydrocarbon

References

  1. Wang, Z.; Zhou, S.; Feng, Y.; Zhu, Y. EGR modeling and fuzzy evaluation of Low-Speed Two-Stroke marine diesel engines. Sci. Total Environ. 2020, 706, 135444. [Google Scholar] [CrossRef]
  2. Bilgili, L. Life cycle comparison of marine fuels for IMO 2020 Sulphur Cap. Sci. Total Environ. 2021, 774, 145719. [Google Scholar] [CrossRef]
  3. Woodyard, D. Pounder’s Marine Diesel Engines and Gas Turbines; Butterworth-Heinemann: Oxford, UK, 2009. [Google Scholar]
  4. Heywood, J.B. Internal Combustion Engine Fundamentals; McGraw-Hill Education: Singapore, 2018. [Google Scholar]
  5. Siddartha, G.N.V.; Ramakrishna, C.S.; Kujur, P.K.; Rao, Y.A.; Dalela, N.; Yadav, A.S.; Sharma, A. Effect of fuel additives on internal combustion engine performance and emissions. Mater. Today Proc. 2022, 63, A9–A14. [Google Scholar] [CrossRef]
  6. Sarjovaara, T.; Larmi, M.; Vuorinen, V. Effect of charge air temperature on E85 dual-fuel diesel combustion. Fuel 2015, 153, 6–12. [Google Scholar] [CrossRef]
  7. Kahandagamage, G. Analysis of the effect of charge air temperature and humidity on the combustion process of diesel engines at Heladhanavi Power Plant, Puttalam, Sri Lanka. Master’s Thesis, Open University of Sri Lanka, Nugegoda, Sri Lanka, 2015. [Google Scholar]
  8. Gowthaman, S.; Sathiyagnanam, A. Effects of charge temperature and fuel injection pressure on HCCI engine. Alex. Eng. J. 2016, 55, 119–125. [Google Scholar] [CrossRef]
  9. Gonca, G.; Sahin, B. Effect of turbo charging and steam injection methods on the performance of a Miller cycle diesel engine (MCDE). Appl. Therm. Eng. 2017, 118, 138–146. [Google Scholar] [CrossRef]
  10. Gonca, G.; Sahin, B.; Parlak, A.; Ayhan, V.; Cesur, I.; Koksal, S. Application of the Miller cycle and turbo charging into a diesel engine to improve performance and decrease NO emissions. Energy 2015, 93, 795–800. [Google Scholar] [CrossRef]
  11. Khandal, S.; Banapurmath, N.; Yaliwal, V.; Manavendra, G.; Akshay, P. Effect of turbo charging on the performance of dual fuel (DF) engine operated on rice bran oil methyl ester (RBOME) and coconut shell derived producer gas induction. J. Pet. Environ. Biotechnol. 2015, 6, 2. [Google Scholar]
  12. Fayad, M.A. Effect of fuel injection strategy on combustion performance and NO x/smoke trade-off under a range of operating conditions for a heavy-duty DI diesel engine. SN Appl. Sci. 2019, 1, 1088. [Google Scholar] [CrossRef]
  13. Ouchikh, S.; Lounici, M.; Loubar, K.; Tarabet, L.; Tazerout, M. Effect of diesel injection strategy on performance and emissions of CH4/diesel dual-fuel engine. Fuel 2022, 308, 121911. [Google Scholar] [CrossRef]
  14. Yang, B.; Zeng, K. Effects of natural gas injection timing and split pilot fuel injection strategy on the combustion performance and emissions in a dual-fuel engine fueled with diesel and natural gas. Energy Convers. Manag. 2018, 168, 162–169. [Google Scholar] [CrossRef]
  15. Panda, K.; Ramesh, A. Diesel injection strategies for reducing emissions and enhancing the performance of a methanol based dual fuel stationary engine. Fuel 2021, 289, 119809. [Google Scholar] [CrossRef]
  16. Huang, G.; Li, Z.; Zhao, W.; Zhang, Y.; Li, J.; He, Z.; Qian, Y.; Zhu, L.; Lu, X. Effects of fuel injection strategies on combustion and emissions of intelligent charge compression ignition (ICCI) mode fueled with methanol and biodiesel. Fuel 2020, 274, 117851. [Google Scholar] [CrossRef]
  17. Pham, V.C.; Choi, J.-H.; Rho, B.-S.; Kim, J.-S.; Park, K.; Park, S.-K.; Le, V.V.; Lee, W.-J. A numerical study on the combustion process and emission characteristics of a natural gas-diesel dual-fuel marine engine at full load. Energies 2021, 14, 1342. [Google Scholar] [CrossRef]
  18. Pham, V.C.; Rho, B.-S.; Kim, J.-S.; Lee, W.-J.; Choi, J.-H. Effects of various fuels on combustion and emission characteristics of a four-stroke dual-fuel marine engine. J. Mar. Sci. Eng. 2021, 9, 1072. [Google Scholar] [CrossRef]
  19. Kim, J.-S.; Lee, W.-J.; Pham, V.C.; Choi, J.-H. A Numerical Study on Fuel Injection Optimization for a ME-GI Dual-Fuel Marine Engine Based on CFD Analysis. Appl. Sci. 2022, 12, 3614. [Google Scholar] [CrossRef]
  20. Pham, V.C.; Lee, J.-K.K.W.-J.; Choe, S.-J.; Le, V.V.; Choi, J.-H. Effects of Piston Bowl Geometry on Combustion and Emissions of a Four-Stroke Heavy-Duty Diesel Marine Engine. Appl. Sci. 2022, 12, 13012. [Google Scholar] [CrossRef]
  21. Kim, J.-S.; Lee, W.-J.; Choi, J.-H. Effects of hydrogen mixture ratio and scavenging air temperature on combustion and emission characteristics of a 2-stroke marine engine. Energy Rep. 2023, 9, 195–216. [Google Scholar] [CrossRef]
  22. Hoang, A.T.; Pham, V.V. A Study on a Solution to Reduce Emissions by Using Hydrogen as an Alternative Fuel for a Diesel Engine Integrated Exhaust Gas Recirculation. AIP Conf. Proc. 2020, 2235, 020035. [Google Scholar] [CrossRef]
  23. Shadidi, B.; Najafi, G.; Yusaf, T. A review of hydrogen as a fuel in internal combustion engines. Energies 2021, 14, 6209. [Google Scholar] [CrossRef]
  24. Tüccar, G.; Uludamar, E. Emission and engine performance analysis of a diesel engine using hydrogen enriched pomegranate seed oil biodiesel. Int. J. Hydrog. Energy 2018, 43, 18014–18019. [Google Scholar] [CrossRef]
  25. Bakar, R.; Kadirgama, K.; Ramasamy, D.; Yusaf, T.; Kamarulzaman, M.; Aslfattahi, N.; Samylingam, L.; Alwayzy, S.H. Experimental analysis on the performance, combustion/emission characteristics of a DI diesel engine using hydrogen in dual fuel mode. Int. J. Hydrog. Energy, 2022; in press. [Google Scholar] [CrossRef]
  26. Pham, V.C.; Kim, H.; Choi, J.-H.; Nyongesa, A.J.; Kim, J.; Jeon, H.; Lee, W.-J. Effectiveness of the Speed Reduction Strategy on Exhaust Emissions and Fuel Oil Consumption of a Marine Generator Engine for DC Grid Ships. J. Mar. Sci. Eng. 2022, 10, 979. [Google Scholar] [CrossRef]
  27. AVL GmbH. AVL FIRE R2019 User Guide; AVL List GmbH: Graz, Austria, 2019. [Google Scholar]
  28. AVL GmbH. AVL FIRE User Manual. Available online: https://www.avl.com/fire (accessed on 1 September 2023).
  29. Durbin, P.A. Near-wall turbulence closure modeling without “damping functions”. Theor. Comput. Fluid Dyn. 1991, 3, 1–13. [Google Scholar] [CrossRef]
  30. Candel, S.; Veynante, D.; Lacas, F.; Maistret, E.; Darabiha, N.; Poinsot, T. Coherent flamelet model: Applications and recent extensions. In Recent Advances in Combustion Modelling; World Scientific: Singapore, 1991; pp. 19–64. [Google Scholar] [CrossRef]
  31. R2018a, A.F. Combustion Module User Manual; AVL List GmbH: Graz, Austria, 2018. [Google Scholar]
  32. Shu, J.; Fu, J.; Liu, J.; Zhang, L.; Zhao, Z. Experimental and computational study on the effects of injection timing on thermodynamics, combustion and emission characteristics of a natural gas (NG)-diesel dual fuel engine at low speed and low load. Energy Convers. Manag. 2018, 160, 426–438. [Google Scholar] [CrossRef]
  33. AVL FIRE R2018. Spray Module User Manual; AVL List GmbH: Graz, Austria, 2018. [Google Scholar]
  34. AVL FIRE R2018. Emission Module User Manual; AVL List GmbH: Graz, Austria, 2018. [Google Scholar]
  35. Raine, R.; Stone, C.; Gould, J. Modeling of nitric oxide formation in spark ignition engines with a multizone burned gas. Combust. Flame 1995, 102, 241–255. [Google Scholar] [CrossRef]
  36. Jabbr, A.I.; Vaz, W.S.; Khairallah, H.A.; Koylu, U.O. Multi-objective optimization of operating parameters for hydrogen-fueled spark-ignition engines. Int. J. Hydrog. Energy 2016, 41, 18291–18299. [Google Scholar] [CrossRef]
  37. Scappin, F.; Stefansson, S.H.; Haglind, F.; Andreasen, A.; Larsen, U. Validation of a zero-dimensional model for prediction of NOx and engine performance for electronically controlled marine two-stroke diesel engines. Appl. Therm. Eng. 2012, 37, 344–352. [Google Scholar] [CrossRef]
  38. Wei, L.; Geng, P. A review on natural gas/diesel dual fuel combustion, emissions and performance. Fuel Process. Technol. 2016, 142, 264–278. [Google Scholar] [CrossRef]
  39. Naber, J.; Reitz, R.D. Modeling engine spray/wall impingement. SAE Trans. 1988, 97, 118–140. [Google Scholar]
  40. Montazeri, H.; Blocken, B. CFD simulation of wind-induced pressure coefficients on buildings with and without balconies: Validation and sensitivity analysis. Build. Environ. 2013, 60, 137–149. [Google Scholar] [CrossRef]
  41. Meng, F.-Q.; He, B.-J.; Zhu, J.; Zhao, D.-X.; Darko, A.; Zhao, Z.-Q. Sensitivity analysis of wind pressure coefficients on CAARC standard tall buildings in CFD simulations. J. Build. Eng. 2018, 16, 146–158. [Google Scholar] [CrossRef]
  42. Burnett, R.T.; Cakmak, S.; Brook, J.R.; Krewski, D. The role of particulate size and chemistry in the association between summertime ambient air pollution and hospitalization for cardiorespiratory diseases. Environ. Health Perspect. 1997, 105, 614–620. [Google Scholar] [CrossRef]
  43. Kittelson, D.; Watts, W.; Johnson, J. On-road and laboratory evaluation of combustion aerosols—Part1: Summary of diesel engine results. J. Aerosol Sci. 2006, 37, 913–930. [Google Scholar] [CrossRef]
  44. Rounce, P.; Tsolakis, A.; York, A.P.E. Speciation of particulate matter and hydrocarbon emissions from biodiesel combustion and its reduction by aftertreatment. Fuel 2012, 96, 90–99. [Google Scholar] [CrossRef]
  45. Tree DR, S.K. Soot processes in compression ignition engines. Prog. Energy Combust. Sci. 2007, 33, 272–309. [Google Scholar] [CrossRef]
  46. Pan, W.; Yao, C.; Han, G.; Wei, H.; Wang, Q. The impact of intake air temperature on performance and exhaust emissions of a diesel methanol dual fuel engine. Fuel 2015, 162, 101–110. [Google Scholar] [CrossRef]
Figure 1. Three-dimensional computational mesh at the TDC of the engine.
Thermo 03 00030 g001
Figure 2. Mesh sensitivity analysis results: (a) cylinder pressure; (b) cylinder temperature; (c) NO mass fraction, and (d) CO2 mass fraction.
Thermo 03 00030 g002
Figure 3. Comparisons of the simulation and experimental results.
Thermo 03 00030 g003
Figure 4. In-cylinder pressure diagrams of the engine in the cases both charge air pressure and temperature changed.
Thermo 03 00030 g004
Figure 5. In-cylinder peak pressures in the cases both charge air pressure and temperature changed.
Thermo 03 00030 g005
Figure 6. Cylinder power and IMEP of the engine in the cases both charge air pressure and temperature changed.
Thermo 03 00030 g006
Figure 7. SFOC of the engine in the cases both charge air pressure and temperature changed.
Thermo 03 00030 g007
Figure 8. In-cylinder temperature diagrams in the cases both charge air pressure and temperature changed.
Thermo 03 00030 g008
Figure 9. NO emissions in the cases both charge air pressure and temperature changed.
Thermo 03 00030 g009
Figure 10. Temperature contours on the central plane at 5 CADs ATDC in the cases both charge air pressure and temperature changed.
Thermo 03 00030 g010
Figure 11. Maximum soot formed inside the engine cylinder in the cases both charge air pressure and temperature changed.
Thermo 03 00030 g011
Figure 12. CO2 formation in the engine cylinder in the cases both charge air pressure and temperature changed.
Thermo 03 00030 g012
Figure 13. In-cylinder pressure diagrams of the engine in the cases only charge air pressure changed.
Thermo 03 00030 g013
Figure 14. In-cylinder peak pressures in the cases only charge air pressure changed.
Thermo 03 00030 g014
Figure 15. Cylinder power and IMEP of the engine in the cases only charge air pressure changed.
Thermo 03 00030 g015
Figure 16. SFOC of the engine in the cases only charge air pressure changed.
Thermo 03 00030 g016
Figure 17. In-cylinder temperature diagrams in the cases only charge air pressure changed.
Thermo 03 00030 g017
Figure 18. NO emissions in the cases only charge air pressure changed.
Thermo 03 00030 g018
Figure 19. In-cylinder temperature contours on the central plane at 5 CADs ATDC in the cases only charge air pressure changed.
Thermo 03 00030 g019
Figure 20. Maximum soot formed in the cases only charge air pressure changed.
Thermo 03 00030 g020
Figure 21. CO2 formation in the engine cylinder in the cases only charge air pressure changed.
Thermo 03 00030 g021
Table 1. Specifications of the simulated engine.
ParameterValueUnit
Name of EngineDoosan V222TIH
Type of Engine4-valve, 4-cycle, V-type, direct-injection, water-cooled with wet turbocharger and intercooler
No. of Cylinder12
Cylinder Bore × Stroke128 × 142mm
Compression Ratio15.5:1-
Mean Piston Speed8.52m/s
Rated Speed1800rpm
Rated Power @ Rated Speed530kW
Indicated Mean Effective Pressure (IMEP)16.4bar
Table 2. CFD model summary.
PhenomenaModel/Mechanism
Turbulencek-ζ-f
Combustion3-zone extended coherent flame model (ECFM-3Z)
EmissionsNOExtended Zeldovich mechanism
SootKinetic soot mechanism
IgnitionAuto-ignition model
AtomizationBreakupWAVE model
EvaporationDukowicz model
Droplet–wall interactionWalljet1 model
Table 3. Mesh properties and qualities.
Mesh Metrics and Qualities
Element typeHexahedral
Number of nodes at the TDC55,856
Number of elements at the TDC65,615
Inflation (boundary layers)Total thickness
Thickness [mm]1.2
Number of layers [-]3
Growth rate [-]1.2
Min. orthogonal quality [-]0.65
Max. skewness ratio [-]0.70
Max. aspect ratio [-]12.65
Table 4. BCs and initial conditions for the numerical simulations.
Boundary ConditionsBoundary TypeSpecific Condition/Value
Piston surfaceMovable wallTemp./297 °C
Liner surfaceLayering wallTemp./197 °C
Cylinder head surfaceFixed wallTemp./297 °C
Cutting surfacesCyclic (Periodic)
Initial ConditionsValue
Charge air temp.Presented in Table 5
Charge air press.Presented in Table 5
IVC30 CADs ABDC
EVO30 CADs BBDC
SOI12 CADs BTDC
EOI18 CADs ATDC
Injection duration30 CADs
Table 5. Simulation cases.
Simulation Case MatrixCharge Air Temperature (°C)
T1 = 24T2 = 29T3 = 34T4 = 39T5 = 44T6 = 49
Charge Air Pressure (Bar)P1 = 2.33P1T1
P2 = 2.37P2T1P2T2
P3 = 2.41P3T1 P3T3
P4 = 2.45P4T1 P4T4
P5 = 2.49P5T1 P5T5
P6 = 2.53P6T1 P6T6
Table 6. Mesh properties at the TDC and calculation time.
Mesh MetricsCoarseMediumFine
No. of nodes40,34955,85678,686
No. of elements45,50365,61590,925
QualitiesMin. orthogonal0.620.650.66
Max. skewness0.710.700.72
Max. aspect ratio13.5612.6512.05
Calculation time17 h25 h36 h
Disclaimer/Publisher’s Note: The statements, opinions and data contained in all publications are solely those of the individual author(s) and contributor(s) and not of MDPI and/or the editor(s). MDPI and/or the editor(s) disclaim responsibility for any injury to people or property resulting from any ideas, methods, instructions or products referred to in the content.

