Article

Analytical Model for Thermoregulation of the Human Body in Contact with a Phase Change Material (PCM) Cooling Vest

by
Kaspar M. B. Jansen
* and
Lennart Teunissen
Department of Sustainable Design Engineering, Delft University of Technology, 2628 CE Delft, The Netherlands
*
Author to whom correspondence should be addressed.
Thermo 2022, 2(3), 232-249; https://doi.org/10.3390/thermo2030017
Submission received: 22 July 2022 / Revised: 18 August 2022 / Accepted: 25 August 2022 / Published: 29 August 2022

Abstract

:
Cooling vests containing phase change materials (PCMs) are used to reduce heat stress in hot environments and maintain the body core temperature within a safe range. The performance of such cooling vests depends in a complicated way on the PCM material and mass, the insulation value of the clothing layers and heat loss to the environment. Conventionally, these performance parameters are evaluated experimentally or using a numerical model, both of which do need a certain amount of evaluation time. The objective of this paper is to develop a transient heat transfer model which includes metabolic heat production in the human body, as well as clothing and PCM layers and radiation to the environment but which is presented as a series of closed-form equations that can be evaluated without the need of a numerical solver. We present solutions for the body and PCM temperature as well as for the heat flux, cooling power and cooling duration. The model equations are validated by comparing them with experiments of ice PCM packs on a hotplate, as well as with published experimental and numerical data for the core temperature, heat flux and percentage of environmental heat loss using a Glauber salt type of PCM. Both the hotplate experiments and the model predictions show that the cooling power during PCM melting drops from about 70 to 32 W for increasing insulation layer thicknesses. In addition, the model is seen to compare well with experimental and simulation data in the literature. In a parametric study, we show how the equations can be used to evaluate the effects of PCM melting temperature and PCM thickness on cooling performance. The paper, therefore, can be considered as a practical means to help select the best cooling vest configuration for workers in a hot and humid environment.

1. Introduction

The thermal interaction of the human body with its environment is complex. Inside the body, heat is produced by metabolism, which is then conducted to the body’s surface and dissipated by sweat evaporation and radiation to the environment. In addition, blood circulation below the surface distributes heat over different body regions. The human body can regulate heat transfer by mechanisms such as vasoconstriction, vasodilation, shivering and sweating. In addition, humans use different layers of clothing to keep their bodies comfortable. To keep the body core temperature within a narrow range of, say 36–38 °C, is a delicate task that usually works out well. However, in more extreme conditions, such as hot and humid environments, the main mechanisms of dissipating the body’s metabolic heat (i.e., sweat evaporation and radiation to the environment) are impeded and external cooling interventions such as cooling vests may be employed to help regulate the temperature.
Yazdi [1] categorizes the types of cooling interventions into three main classes: (i) air flow cooling, (ii) liquid flow systems and (iii) cooling by vests containing pockets with phase change materials (PCMs). Such PCMs are usually frozen liquids or salts which take up latent heat during melting. PCM vests are the most practical and economical solution and are therefore often applied. They have, however, the disadvantage of their limited duration: once the PCM is melted, the cooling effect rapidly vanishes. In order to better understand how and how long PCMs are able to affect body temperature, different types of studies were performed. Some of these tested the effects of PCM vests directly on human subjects whereas others used thermal manikins or developed numerical models to predict the PCM effects.
Human trial tests on trained firefighters by Smolander [2] for example showed that a 1 kg ice vest did not have much effect on the body core temperature but did lower the heart rate and improved the subjective thermal sensation. Teunissen [3] studied the effect of water-soaked cooling pads and a vest with water-perfused tubes and found that there was no effect on heart rate and core temperature and that the cooling effect of both systems mainly consisted of a temporary cooler thermal sensation. A similar observation was made by Butts [4] who tested 20 male subjects in a hot environment wearing a vest containing 3.6 kg of PCM with a melting temperature of 10 °C. They concluded that the PCM vest mainly reduced the physiological strain and could in principle increase safety and facilitate performance in occupational settings. House [5] performed a systematic series of human trial tests for cooling vests with PCM melting temperatures of 0, 10, 20 and 30 °C and concluded that only the 0 °C and 10 °C vests provided measurable cooling effects under the given conditions (40 °C air temperature and wearing fire-fighting clothing). In addition, Song [6] reports human trial tests using a combination of PCM and air cooling and concluded that their cooling system could significantly reduce the core temperature, heart rate and physiological strain index during exercise in hot environments. Ouarani [7] investigated the performance of cooling vests with PCMs of 18 and 28 °C melting temperature using both human subjects and a thermal manikin. They concluded that using PCM cooling vests significantly reduced the body heat storage and that the best cooling performance was achieved by placing the 28 °C packets at the upper torso while covering the lower torso with 18 °C packets, but that too many packets lead to sweat suppression. In a recent study, Li et al. [8] present an ultra-light PCM vest for use in work situations with short-time high-temperature exposures (e.g., when transferring between buildings or vehicles). They conclude that one kilogram of a PCM with 23 °C melting temperature is sufficient to decrease the skin temperature by 1.35 to 1.78 °C for a duration of up to 20–30 min. The effects on the core temperature, however, were not reported. The apparent contradictions about the efficiency of cooling vests, as emerge from the above studies, are partly due to the fact that they all use different cooling materials, clothing layers and environmental conditions. Another reason is that human tests are less suited to detect subtle differences between different cooling systems due to the inherent variability between subjects. Moreover, human trial tests are expensive and time-consuming and are therefore limited in number.
Thermal manikin studies provide a more reproducible means for evaluating and comparing the performance of differences between cooling garments [9]. In a recent study using a thermal manikin, Ciuha [10] for example presents a very useful comparison of the performance of all kinds of commercially available cooling vests during 8 h test trials. They conclude that active cooling vests (vortex and water-perfused cooling) were most efficient, followed by PCM vests, hybrids and evaporative vests. Gao et al. [11] performed a series of dedicated tests on thermal manikins with PCMs of different mass, covering area and melting temperature. Their results showed that the cooling rate of the PCM vests increased if the temperature difference between the manikin surface and the PCM melting temperature was larger. In a later human trial test [12], however, they concluded that the effect on the core temperature was not significant for their 24 and 28 °C PCMs and suggest to use PCMs of lower melting temperatures (e.g., 15 °C).
A third way of evaluating the effectiveness of cooling interventions is by performing a numerical simulation of the heat transfer between the human body and its environment, including the cooling-related (PCM) materials. Such an approach is promising since it does not require dedicated experimental testing and gives more freedom to systematically vary cooling parameters. Standard thermophysiological models like those of Stolwijk, Fiala and Tanabe [13,14,15] are well accepted and allow reasonably accurate simulations of the human body’s response to a wide range of environmental conditions. In addition, Potter [16] presents a series of empirical equations to estimate the metabolic rate, and clothing thermal resistances, leading to predictions for the body core temperature and a heat strain decision tool. These models, however, do usually not include options to include thermoregulating elements such as PCM packs. Therefore, in recent years, a number of research groups developed their own numerical models in which heat and moisture transfer in personal cooling garments is modeled in combination with PCM materials. Yazdi [17,18,19] modeled the effects of cooling vests using ANSYS finite element software which allows them to include details about the PCM geometry and placement. They show that wearing cooling vests also has negative effects: increase in metabolic costs due to extra weight, sweat blockage and reduced heat loss due to vasoconstriction [19]. In addition, they show that 49–57% of the cooling efficiency is lost to the environment due to radiation and suggest covering the PCM element with an extra insulation layer [18]. Itani [20,21,22] set up a series of heat and mass balance equations for the different clothing and PCM layers and solved them in an iterative way using an explicit numerical scheme. They showed that for cooling vests with melting temperatures of 21, 24 and 26 °C the average cooling power slightly decreased (25, 22 and 20 W, respectively) but the melting time increased (from 90 to 120 and 180 min). Extra mass, on the other hand, did not affect the cooling power but extended the cooling duration [20]. The group of Wan [23,24] developed a numerical model for PCM cooling in combination with air ventilation, based on Tanabe’s multi-node thermoregulation model [15]. In a follow-up study [25], they showed that extra insulation layers on the PCM packets are largely beneficial for reducing the heat loss to the environment and thus increasing the PCM performance. All numerical models discussed above were seen to compare well with human trial and thermal manikin studies and can therefore be regarded as a valuable tool for the selection of the type of PCM garment needed. These models, however, are developed by specific research groups and are not always generally available.
Alternative ways for assessing the performance of PCM-containing garments are using a surface with controlled constant temperature (hotplate) to measure the cooling power profiles [26,27,28] or a selection tool based on the biophysical energy balance equation [29]. In the latter paper, the energy that can be absorbed by the PCM materials is estimated as the sum of the latent heat during melting and the energy required to heat up the PCM to the skin temperature, which is then compared to the metabolic heat and the heat losses due to evaporation and respiration. Parametric studies based on simulations or experiments are possible but always require a series of iterations which can be time-consuming. Analytical models, on the other hand, can provide more direct insight into how specific PCM-related parameters affect the performance of the cooling vest for a given set of environmental conditions (e.g., clothing layers, air temperature, radiation).
The formulation of the heat transfer problem around the human body resembles that of the transient heat response of a composite wall for which solutions are known from building physics literature [30]. These solutions, however, do not take into account the effect of external cooling interventions as we wish to do in the current paper. Hu et al. [31] present a one-dimensional heat transfer model including a PCM layer to predict the risk of skin burns for firefighters. Unfortunately, they still need a numerical solver and about 10 min simulation time per scenario. In this paper, we consider a body segment consisting of core, skin and clothing layers and develop a one-dimensional body heat transfer model which takes into account both the metabolic heat production, conduction through clothing layers, heat absorbed by a phase change layer as well as radiation to the environment. We show that with this approach we are able to reproduce results from numerical studies presented in literature and use the analytical model to derive simple closed-form expressions for the cooling capacity and duration of a PCM package, as well as the ratio between heat flow from the body to the PCM, and the heat loss of the PCM to the environment.

2. Materials and Methods
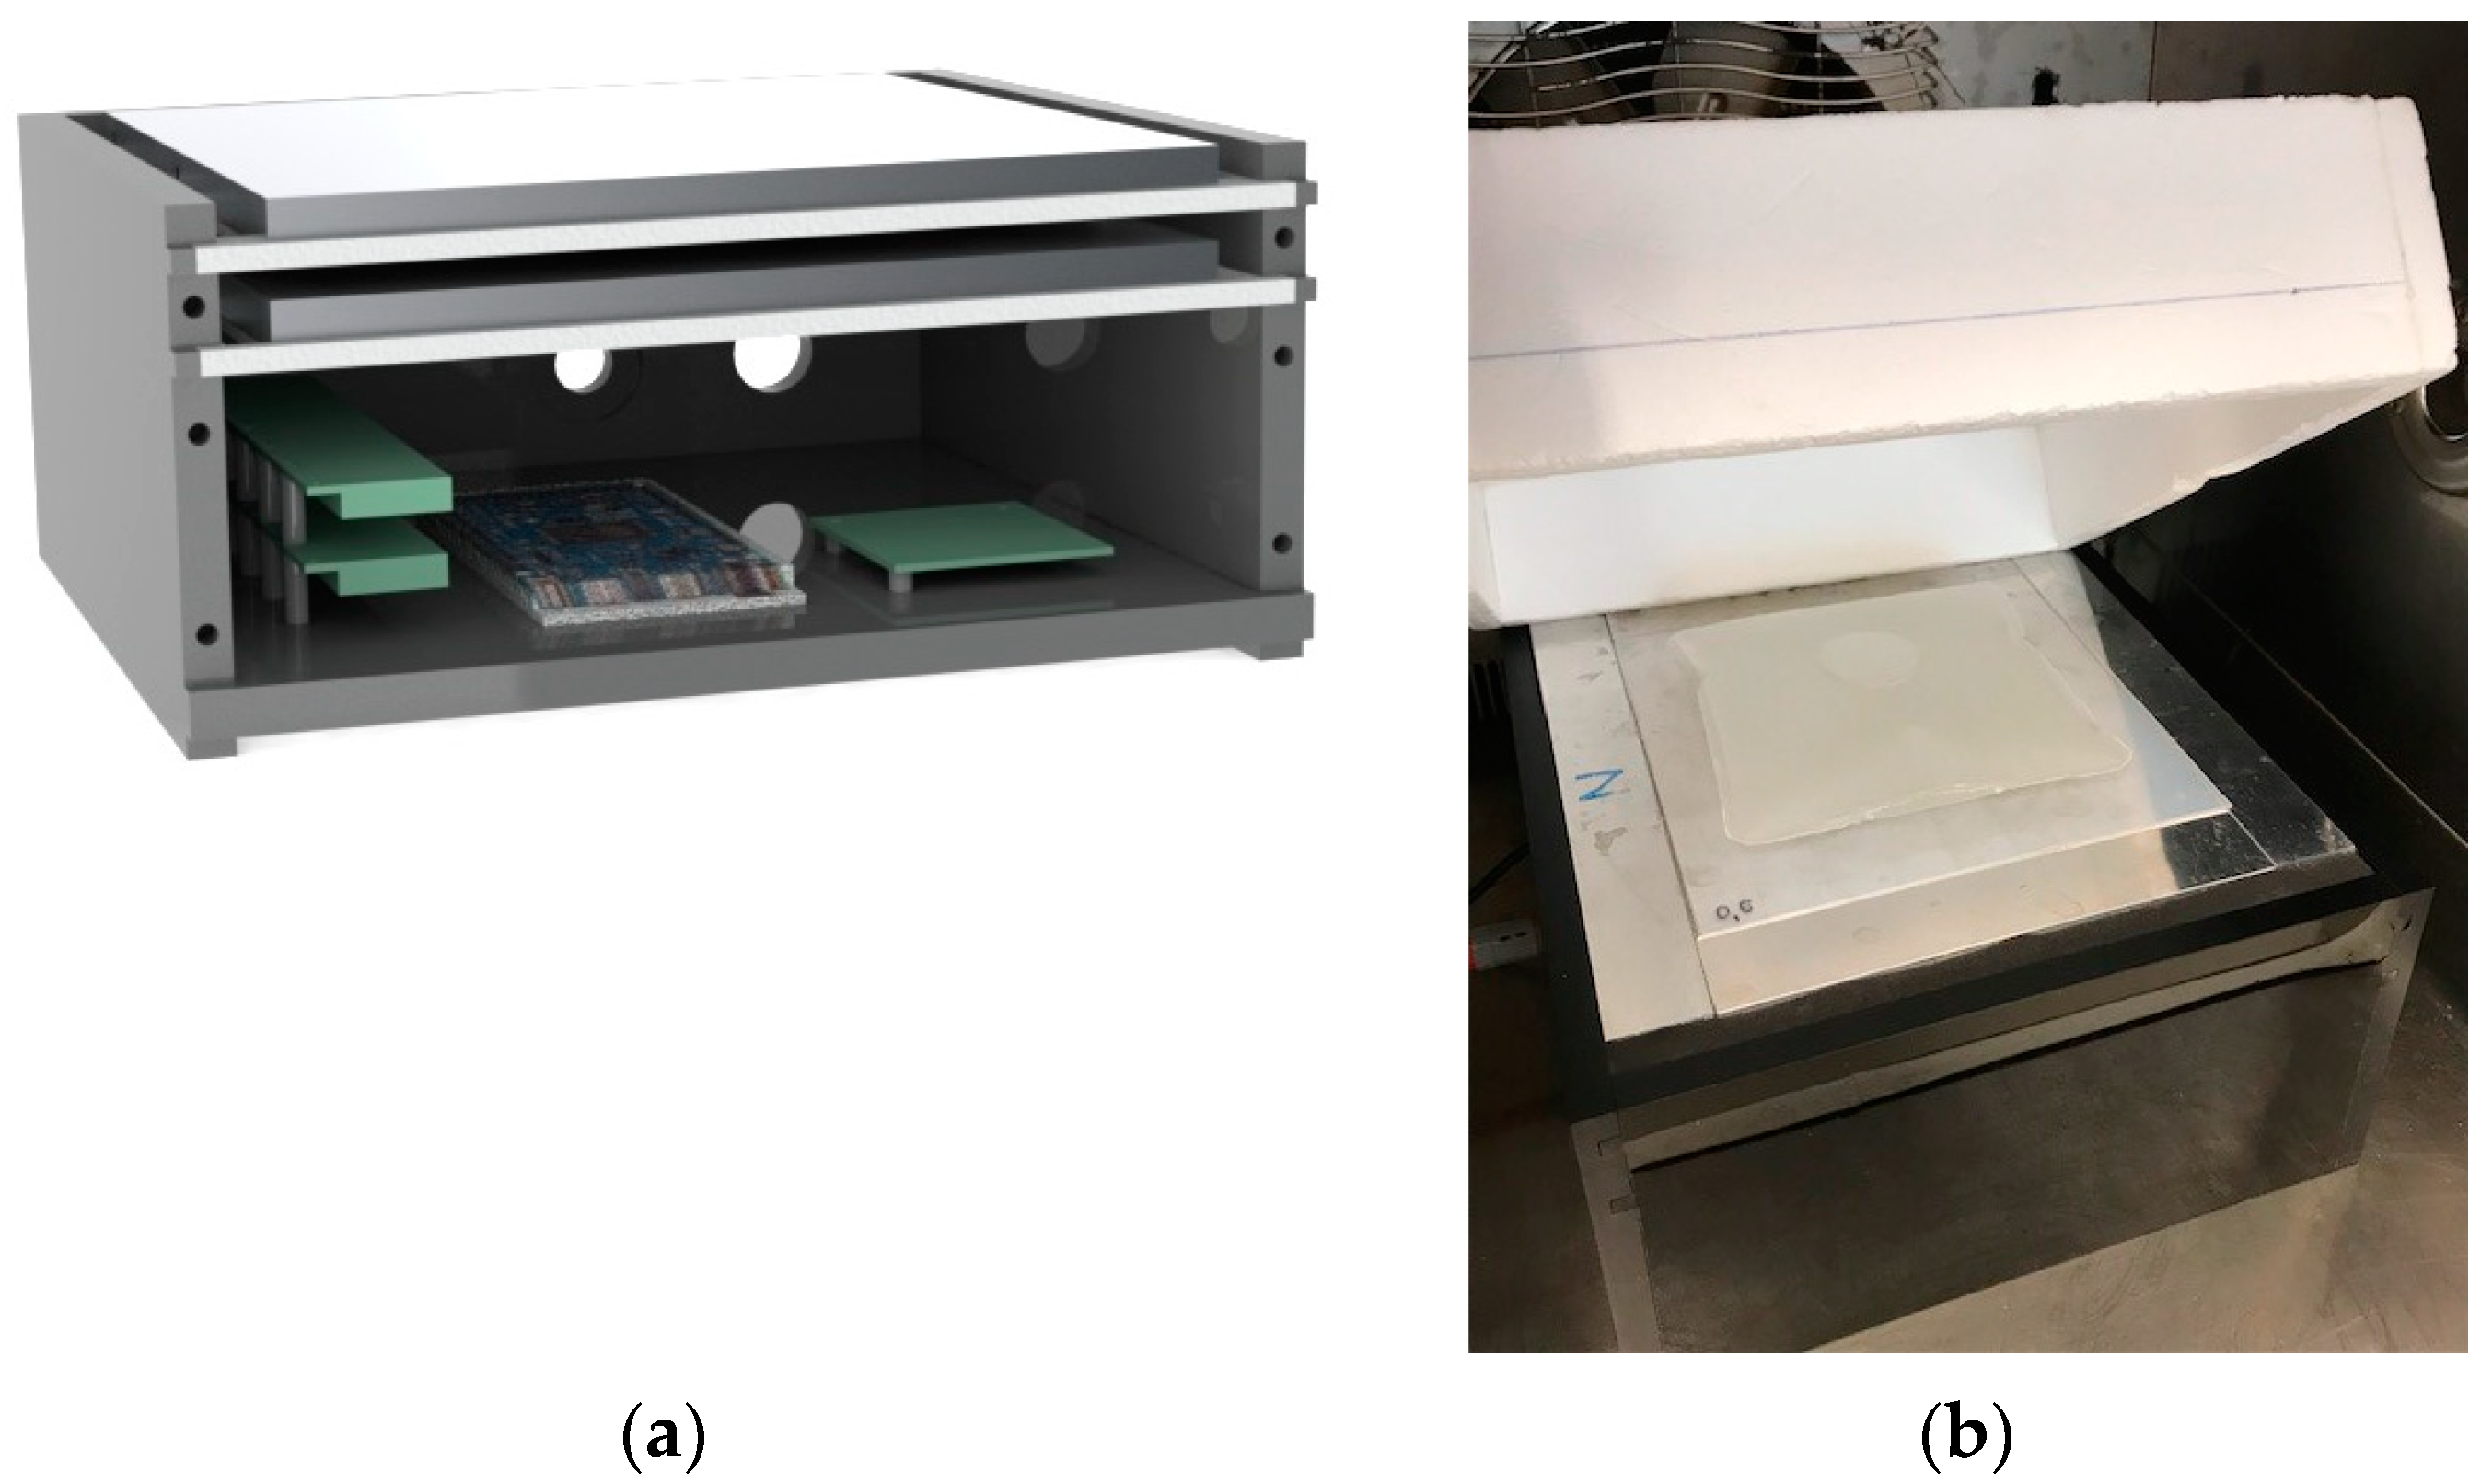
2.1. Hotplate

To measure the cooling characteristics, a custom-made hotplate was used (Figure 1). The device consists of an aluminum plate equipped with PT100 temperature sensors which are constantly kept at a predefined temperature using foil heaters attached to its backside. The sensors have a response time of 0.4 s and an accuracy of 0.2 °C. The power input required to keep the preset temperature is a measure of the cooling power and is recorded by a data acquisition system. The measuring area is 150 × 150 mm and is surrounded by a 50 mm wide edge with separate temperature control to minimize lateral heat losses (guarded hotplate principle). The data was sampled at 1 Hz and filtered by an exponentially weighted moving average filter with a weighting factor of 0.05. The hotplate was validated by determining the thermal conductivity of EPS (polystyrene foam) and Perspex plates of various thicknesses, resulting in realistic thermal conductivity coefficients of 0.03 and 0.15 Wm−1K−1, respectively.

2.2. Sample Preparation

Two PCM packs were fabricated from 0.145 mm thick TPU (thermoplastic polyurethane) foil, filled with demi water and sealed using a laser cutter. The ice packs weighed 186 and 199 g and had contact areas of 88 and 85 mm2, respectively.
The heat transfer rate was systematically varied by inserting a series of silicon rubber sheets with different thicknesses between the hot plate surface and the PCM sample pack. The silicone rubber (Dow Corning) was cut in pieces of 150 × 150 mm to fully cover the measuring area of the hot plate. The insulation thicknesses used were 0, 0.2, 0.4, 0.6 and 1.0 mm.

2.3. Procedure

PCM packs were frozen in a refrigerator at −18 °C for at least six hours. During freezing, the samples were compressed between two Perspex plates with a 1 kg weight on top in order to create a flat surface for optimal initial contact with the hotplate.
The hotplate was placed in a bench-top climatic chamber (Espec SH-661, Espec corp, Osaka, Japan) to create a temperature and humidity-controlled environment. The climate chamber contained a fan continuously blowing at ~1.5 m/s. To shield the samples from airflow and minimize radiation loss, a styropor foam cover with a thickness of 10 mm was placed on top of the samples on the hotplate (see Figure 1b). The temperature of the hotplate as well as the climatic chamber were set at 35 °C, mimicking the skin temperatures in hot conditions.

3. Heat Transfer Theory

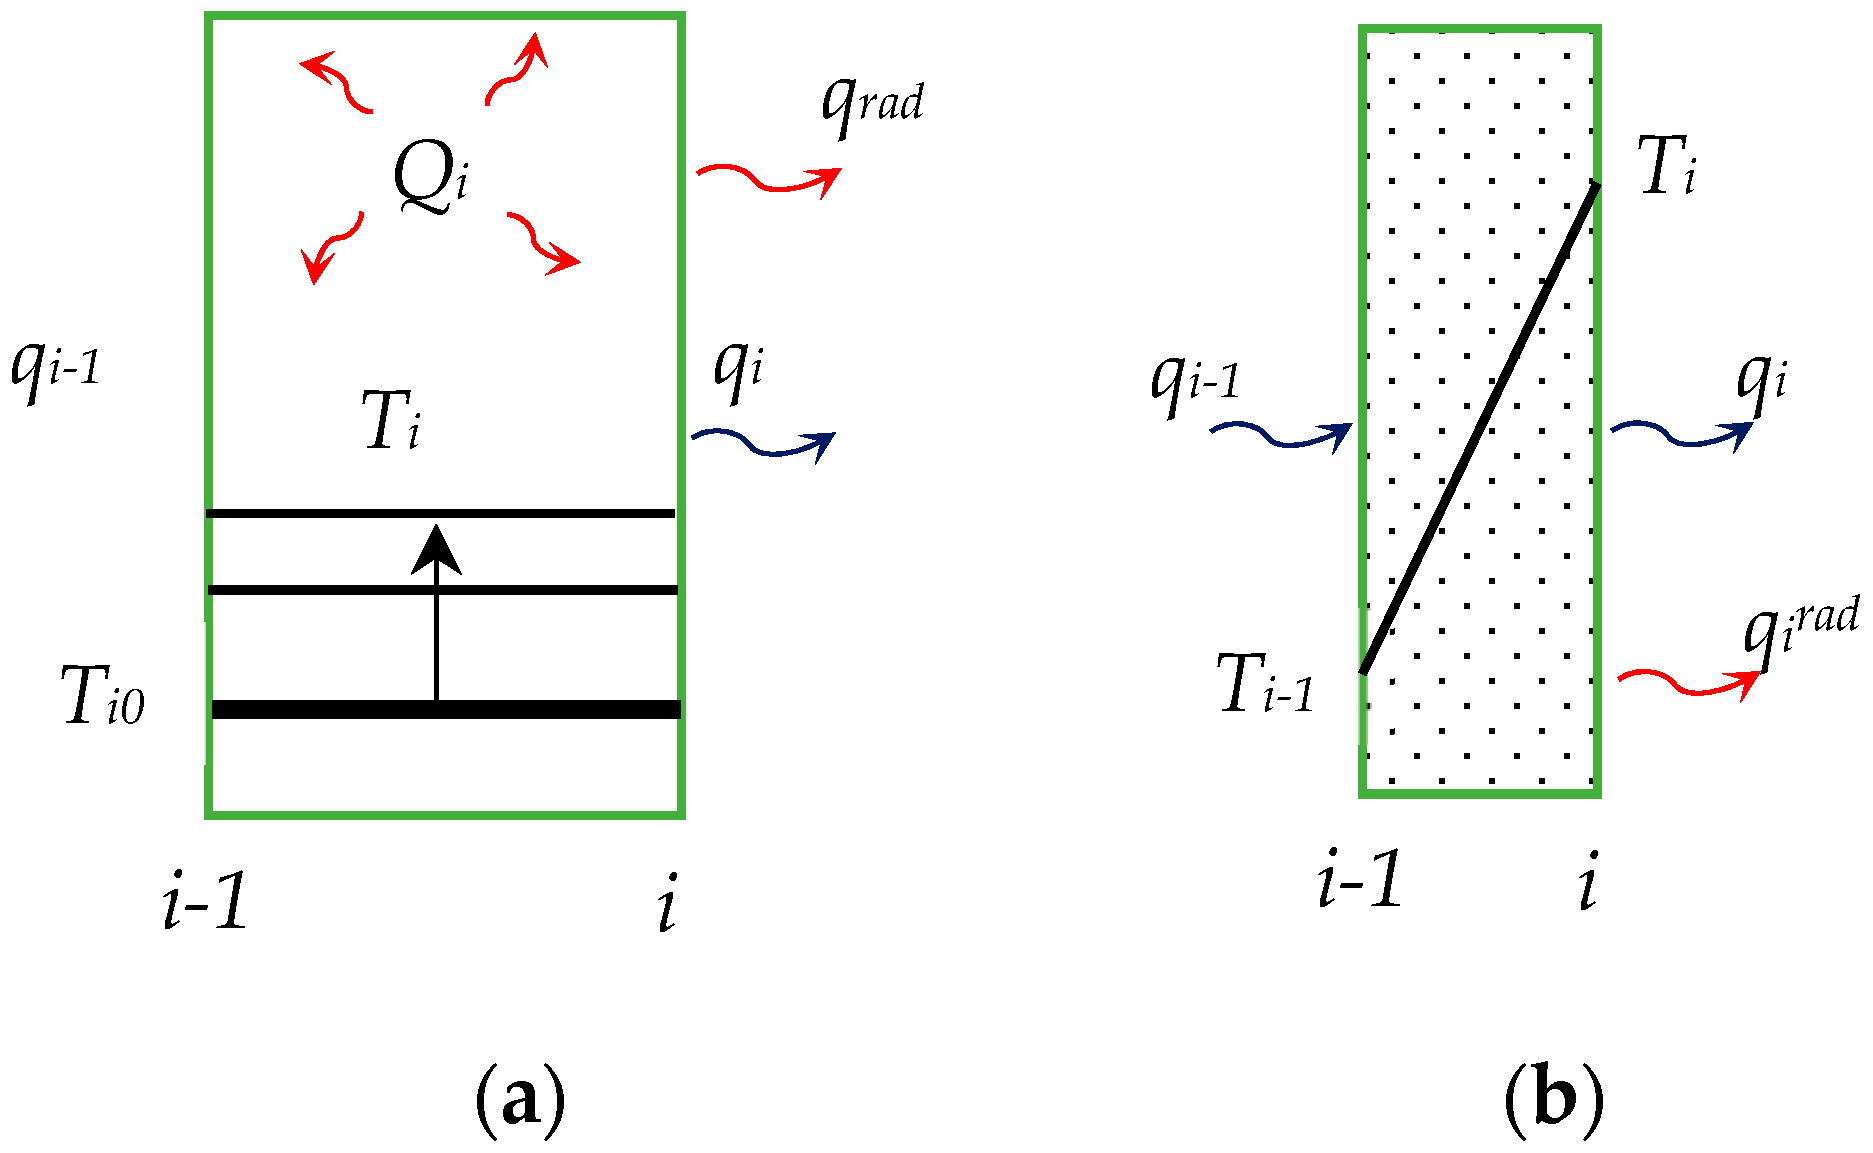
3.1. Basic Heat Equations

For this modeling we consider the one-dimensional heat transfer through a series of adjacent layers representing the human body core, a skin layer, thermal insulation layers as well as a layer of pre-cooled phase change material (PCM). The heat balance in all of these layers is given as [32]
ρ c d T d t = k d 2 T d x 2 + Q V
in which c is the heat capacity in [J kg−1K−1], k denotes the thermal conductivity in [Wm−1K−1] and QV is a volumetric heat source term with units [W/m3]. Integrating over the layer thickness d, we obtain
ρ c d d T d t = k ( d T d x | d d T d x | 0 ) + Q   [ W / m 2 ]
where the two gradient terms at the right-hand side represent the heat flux at x = 0 and at x = d, respectively. Q denotes the total heat production per unit area in the layer with thickness d. The temperature now represents the average over the layer thickness. Notice that since we take x = 0 at the center of the torso, d1 corresponds to half the torso thickness.
The assembly of layers representing the human body and its surroundings consists of layers with a large enough thermal mass in which the temperature changes due to heat production or exchange with the environment and of layers with a low thermal mass in which no heat accumulates and which acts as a thermal insulation element (see Figure 2). The corresponding heat balance equations for these fundamental elements are given by Equation (2).
ρ i c i d i d T i d t = q i q i 1 + Q i + q i r a d ,                           0 = q i q i 1 + q i r a d
The qrad term in Figure 2 denotes the radiation heat flow, whereas qi is the heat flux due to conduction
q i = k i T i T i 1 d i = 1 R i ( T i T i 1 )             [ W / m 2 ]
and Ri [m2K/W] is the thermal resistance of layer i. If there are two adjacent insulation layers with resistances of, say, Ri,a and Ri,b then heat flux to both layers is still equal to qi and the effective thermal resistance of the combined layers can be expressed as the sum of the sub-layer contributions
q i = 1 R i e f f ( T i T i 1 ) ,                           R i e f f = R i , a + R i , b

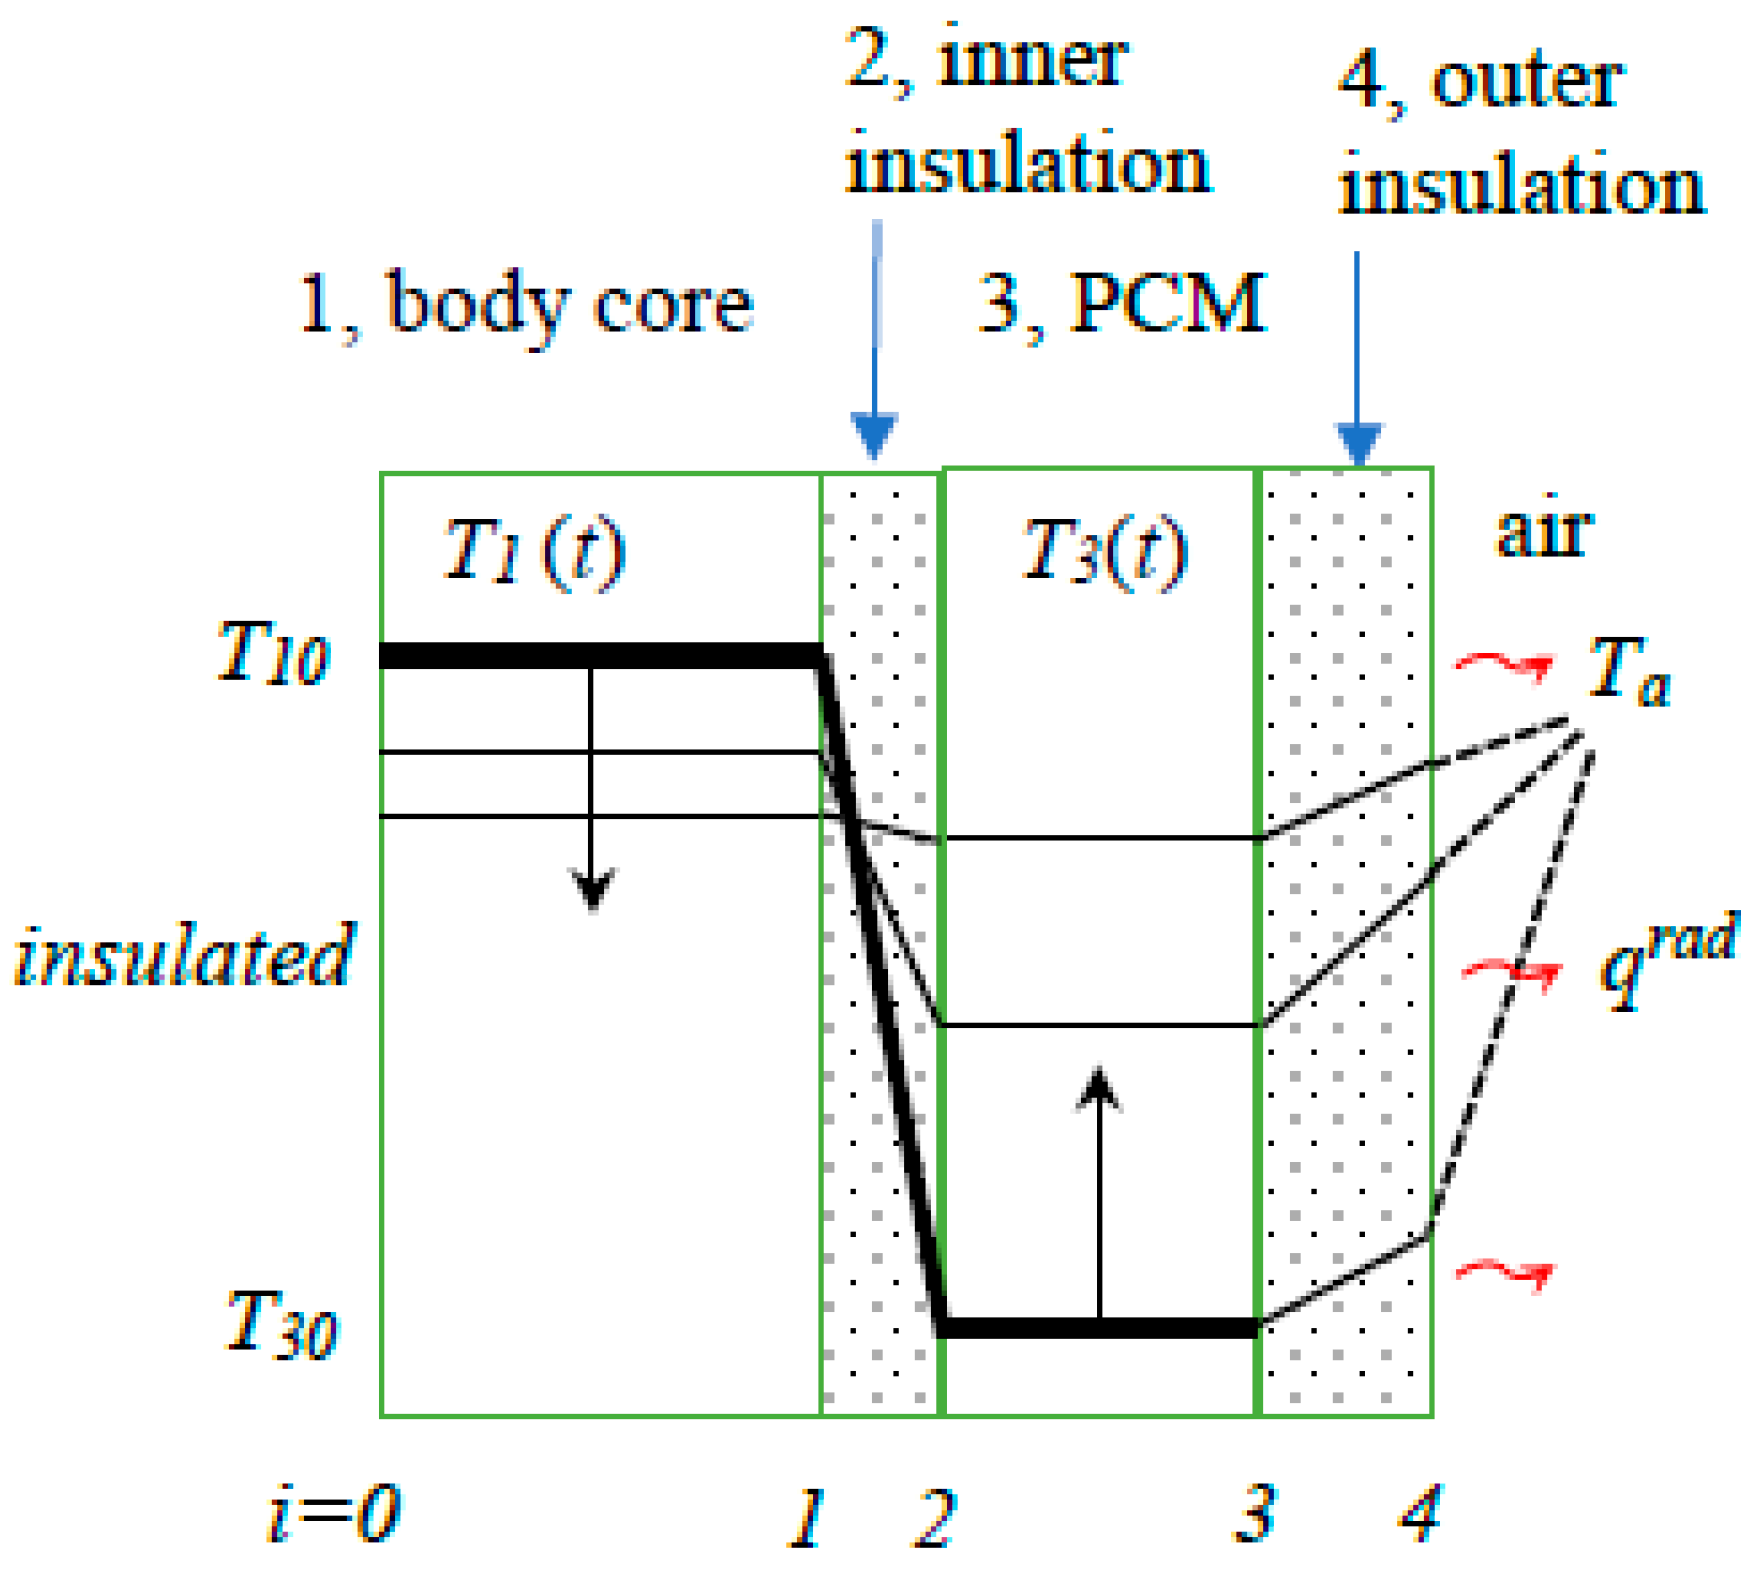
3.2. Human Cooling Model

In this case, we have two transient thermal layers: the body core and the PCM layer. In addition, we have an inner and an outer insulation layer. The first one comprises the insulation effect of the skin as well as the inner clothing, whereas the latter one is responsible for the clothing layers covering the PCM slab (see Figure 3). At the outside, this clothing is exposed to a radiation boundary condition qrad = hr (T4 − Ta) in which hr [Wm−2K−1] is the radiative heat transfer coefficient, T4 is the temperature of the outer surface and Ta is the mean radiant temperature. Similar to the inner insulation layer above, we can eliminate temperature T4 and define an effective thermal resistance for the heat flux from layer 3 to temperature Ta:
q 3 = q 4 = 1 R 4 e f f ( T a T 3 ) ,                             R 4 e f f = R 4 + 1 / h r
Using the equations for the thermal elements we then obtain for the differential equations
ρ 1 c 1 d 1 d T 1 d t = q 1 q 0 + Q 1 q 1 = q 2 = 1 R 2 e f f ( T 3 T 1 ) ρ 3 c 3 d 3 d T 3 d t = q 3 q 2 + Q 3 q 3 = q 4 = h r ( T a T 3 )
Rewriting then gives a system of two first order differential equations which can be solved with T1 (t = 0) = T10 and T3 (t = 0) = T30 as initial conditions:
ρ 1 c 1 d 1 d T 1 d t = 1 R 2 e f f ( T 3 T 1 ) q 0 + Q 1 ρ 3 c 3 d 3 d T 3 d t = A R 2 e f f ( T 3 T 1 ) + h r ( T a T 3 ) + Q 3
For the left boundary, the symmetry condition is assumed: q0 = 0. Note that the source terms comprise all the heat generated or absorbed by the body:
Q 1 = M W E R e s p
in which M, W, E and Resp denote the metabolic heat production and heat losses due to work, evaporation and respiration, respectively. These terms depend on the amount of activity performed by the body and the humidity of the environment but are essentially independent of the body temperature. In this paper, we therefore consider them as lumped into parameter Q1. Details for determining the individual contributions can be found in thermophysiology literature [33].

Skin Temperature

The skin temperature can be calculated by assuming that the skin acts as an insulation layer with thermal resistance Rskin and which is part of the thermal resistance between the body core and PCM (inner insulation, layer 2). Since the heat fluxes through the skin and the rest of layer 2 are equal, we can calculate the temperature on the skin surface as
T s k i n = ( 1 f R )   T 1 + f R T 3 ,                 f R = R s k i n R 2 r e s t + R s k i n
where fR can be interpreted as the ratio of insulation resistance between the skin layer and the total of layer 2. For thin skin, fR is small and the skin temperature is close to the body core temperature, T1 whereas in absence of other insulation the skin temperature matches that of the PCM, T3. In the following section, we will derive solutions for T1 and T3 in a few practically relevant cases.

3.3. Solutions for T1 and T3

Equation (6) represents a system of two linear first-order differential equations which can be solved for the case in which layer 1 represents a human body with varying temperature or in case it represents a hotplate or thermal manikin in which the surface temperature is kept constant.

3.3.1. Solution 1: Human Body Cooling with Heat Production and Radiation; No PCM Layer

This can be regarded as the reference situation to which the solutions containing the effects of a PCM layer will be compared. Without the PCM layer we have the human body, layer 1, an inner and outer clothing insulation layer with thermal resistances R2 and R4, respectively, and radiation to temperature Ta (see Figure 1). We thus have one transient thermal element with temperature T1 and one insulation layer combination with effective resistance R2eff = R2 + R4 + 1/hr. Dividing by ρ1c1d1 the differential equation then becomes
d T 1 d t = h 1 ( T a T 1 ) + Q 1
in which h0 and Q1 are defined below Equation (10). The solution of Equation (9) with initial condition T1 (t = 0) = T10 then becomes
T 1 = T 1 0 + { ( T a T 1 0 ) + Q 1 h 1 } [ 1 e h 1 t ]
in which
h 1 = 1 ρ 1 c 1 d 1 R 2 e f f ;       Q 1 = Q 1 ρ 1 c 1 d 1 ;       R 2 e f f = R 2 + R 4 + 1 / h r
The reciprocal of parameter h1 can be regarded as the time constant which governs the thermal transients and depends on the values of the thermal insulations of layer 2 and 4 as well as on the radiation resistance 1/hr. Equation (10) can describe both the body heating due to internal heat sources and radiation from an elevated ambient temperature as well as the cooling of a body in a colder environment. In the steady state, radiation and heat generation are in equilibrium and T1 approaches Ta + Q1/h0.

3.3.2. Solution 2A: Human Body Cooling with PCM Layer, Heat Production and Radiation

In this section, we solve the equations in the transient situation in which both T1 and T3 change with time. In the case of a human body in contact with a frozen phase change material that means that the PCM heats up and the human body slowly cools. In the next section, we discuss the case in which the PCM material is in its melting stage. We start with rewriting Equation (6) as
d T 1 d t = h 1 ( T 3 T 1 ) + Q 1 d T 3 d t = h 3 ( T 3 T 1 ) + h 4 ( T a T 3 ) + Q 3
with
h 1 = 1 ρ 1 c 1 d 1 R 2 e f f ;   h 3 = 1 ρ 3 c 3 d 3 R 2 e f f ;   h 4 = 1 ρ 3 c 3 d 3 R 4 e f f ;     Q 3 = Q 3 ρ 3 c 3 d 3
where R2eff = R2 and R4eff = R4 + 1/hr. The solution of the differential equations will have exponential terms of the form A i e α i t in which the coefficients Ai and αi follow by substitution in Equation (11) in combination with the initial conditions T1 (t = 0) = T10 and T3 (t = 0) = T30. The results consist of a term that describes the combined effect of conduction and radiation, Tc+r, and a second term that deals with the combined source terms and radiation, TQ+r. For the overall temperature we can thus write:
T ( t ) = T c + r ( t ) + T Q + r ( t )
In the case of conduction and radiation (c + r) we obtain
T 1 c + r = T 1 0 { β ( T 1 0 T 3 0 ) + δ ( T 3 0 T a ) } [ 1 e α 1 t ] { ( 1 β ) ( T 1 0 T 3 0 ) + ( 1 δ ) ( T 3 0 T a ) } [ 1 e α 2 t ] T 3 c + r = T 3 0 + { h 3 C ( T 1 0 T 3 0 ) γ ( T 3 0 T a ) } [ 1 e α 1 t ] + { h 3 C ( T 1 0 T 3 0 ) ( 1 γ ) ( T 3 0 T a ) } [ 1 e α 2 t ]
It can be verified that for t = 0 the initial conditions are retained and that for t→∞ both layers approach the mean radiant temperature Ta. Remark that the above (and following) solutions all have the structure
T = T ( 0 ) + A 1 [ 1 e α 1 t ] + A 2 [ 1 e α 2 t ]
The terms between square brackets vary from 0 to unity and describe the transient behavior whereas A1 and A2 denote the magnitude of these terms. For the source terms in combination with radiation (Q + r) we obtain
T 1 Q + r = β C Q 1 + h 1 Q 3 C α 1 [ 1 e α 1 t ] + ( 1 β ) C Q 1 h 1 Q 3 C α 2 [ 1 e α 2 t ]
T 3 Q + r = h 3 Q 1 + ( 1 β ) C Q 3 C α 1 [ 1 e α 1 t ] + h 3 Q 1 + β C Q 3 C α 2 [ 1 e α 2 t ]
Notice that in specific cases the above solutions may largely simplify. In the case of a PCM layer, which is thin with respect to the human body, for example, Equation (14a) reduces to (see Supplementary Information)
T 1 Q + r β Q 1 t
The parameters in the above equations are given by
α 1 = 1 2 ( H C ) ;   α 2 = 1 2 ( H + C ) ;   β = α 2 h 1 C ;   γ = α 2 h 4 C ;       δ = α 2 C ;     α 0 = h 1 + h 3 ;       H = h 1 + h 3 + h 4 ;         C = H 2 4 h 1 h 4
Coefficient β can be considered as the distribution coefficient of thermal mass between layer 1 and 3. This becomes more evident when radiation is absent in which case β reduces to h3/(h1 + h3) (see Supplementary Information). If the PCM layer is absent, β = 1.

3.3.3. Solution 2B: Human Body Cooling with PCM during Melting Stage

A material that melts acts as an energy sink and absorbs heat until the material is completely melted. The absorbed energy for material 3 during melting is given as
E 3 m = m 3 L 3
in which L3 [J/kg] denotes the latent heat of material 3. During melting the temperature in the material is constant and at its melting point T3m. Inserting this in Equations (6) and solving the equations then yields
T 1 = T 1 ( t 1 ) + ( T 3 m T 1 ( t 1 ) + Q 1 h 1 ) [ 1 e h 1 ( t t 1 ) ]
where t1 is the time the PCM layer reaches its melting point. Note that this equation does not contain any radiation parameter which makes sense since the constant PCM temperature in fact blocks the transfer of outside radiation effects to layer 1. The net effect of radiation is that it speeds up the melting process, an effect which will be discussed in more detail for case 3B below. Equation (17) shows the effect of PCM melting on the body core temperature. Whether the body temperature increases due to the metabolic heat or decreases due to PCM cooling depends on the sign of the term between brackets. If Q’1/h1 > T1 (t1) − T3m then the body temperature increases, if it is smaller, it decreases.
The cooling power (in W) of the used PCM package is the heat flux from the body core to the PCM layer, multiplied by the PCM surface area, A, and is thus proportional to the body and PCM temperature difference T1 − T3. Most relevant to estimate the cooling efficiency is its value during the PCM melting stage for which the PCM temperature is at its melting point. In addition, the core temperature will never deviate much from its initial value, so we may also replace T1 with its initial value T10 to obtain as an estimate of the PCM cooling power during melting:
P P C M A R 2 e f f ( T 1 0 T 3 m )
The melting time duration will be similar to that for the hot plate, given by Equation (21) in the section below.

3.3.4. Solution 3A: Hot Plate with PCM Transients and Radiation

In this case, temperature T1 is controlled at a fixed T1hp by applying a heat source of strength Q1 = Php. The hot plate experiment serves to determine experimentally how much heat is transferred from the PCM material through the insulation to the body in the ideal situation that the body temperature would remain constant. This allows, for example, to experimentally determine the insulation resistance R2eff and the time constant α0. Solving Equation (6) we obtain for the hotplate power, Php and PCM temperature
P h p = A R 2 e f f ( T 1 h p T 3 )
T 3 = T 3 0 e ( h 3 + h 4 ) t + h 3 T 1 h p + h 4 T a h 3 + h 4 [ 1 e ( h 3 + h 4 ) t ]
Since the PCM temperature T3 gradually rises towards the hot plate temperature the generated cooling power, Php, decreases during the experiment. The speed of this decrease is inversely proportional to h3 + h4 and thus depends on the radiation parameter h4. In the setup of the experiment, the choice can be made to isolate the upper PCM surface. In that situation, h4 = 0 and parameter h3 can be extracted directly from the measurements. In addition, by putting the hotplate in an environment with ambient temperature Ta = Thp, we can determine the sum of h3 and h4 and obtain the radiation parameter h4. It is also possible to do the hotplate experiment with a clothing layer in between the hot plate and PCM to measure the thermal resistance value of the clothing fabric. From the experimental data during the transient phases, the effect of the radiation and outer insulation is obtained whereas the thermal resistance of the inner layers follows from the cooling power at the melting plateau (see Equation (21) below).

3.3.5. Solution 3B: Hot Plate during PCM Melting with Radiation at the PCM Surface

If during the hotplate experiment the PCM starts to melt also temperature T3 is constant and the cooling power plateau is simply given by
P h p = A R 2 e f f ( T 1 h p T 3 m )
The cooling power at the hotplate interface during melting thus does not depend on the radiation and is proportional to the temperature difference between the hotplate and PCM melt temperature and surface area A, as expected, but is also dependent on the thermal resistance of the insulation layers in between. That means that both the properties of the packing material in which the PCM is encapsulated as well as any other layer or air gap in between have a direct effect on the cooling power. This finding can be used to reduce the cooling power of a PCM package and obtain a longer cooling duration with lower intensity. The cooling duration tm is obtained by solving for the source term in the second part of Equation (6)
Q 3 = 1 R 2 e f f ( T 1 h p T 3 m ) h r ( T a T 3 m )
This source term is the heat absorbed by the PCM layer per unit of time. Since this is constant during melting, the total amount of absorbed heat becomes Q3A tm = −E3m = −m3L3. The minus sign is to account for the fact that the PCM is not a heat source but a heat sink. Rearranging then gives for the duration of the PCM melting stage
t m = m 3 L 3 A R 2 e f f ( T 1 h p T 3 m ) + h r A ( T a T 3 m )
Both terms in the numerator are positive contributions and Equation (19) can be used as a simple way to determine quantitatively how radiation effects will decrease the duration of the PCM melting. Note that in these equations the mass is calculated using the density ρ, surface area A and layer thickness d as m = ρ A d. After the melting phase, another transient process starts with as initial conditions the starting situation at the end of melting (see Supplementary Information).

4. Model Verification

In the derivation of the equations above many simplifications were made: temperatures within layers were taken as uniform, heat capacities in insulation layers were neglected and details of the melting process were neglected. Such a process of neglecting parts but keeping other aspects is inevitable in the modeling of complex processes. In order to find out if the above solutions still have the desired practical relevance, we compare the results first with a series of experiments on a hotplate in which the thermal conditions were well controlled and, secondly, with experimental and numerical data available in literature which are reflecting more realistic situations of participants wearing cooling vests in hot environments.

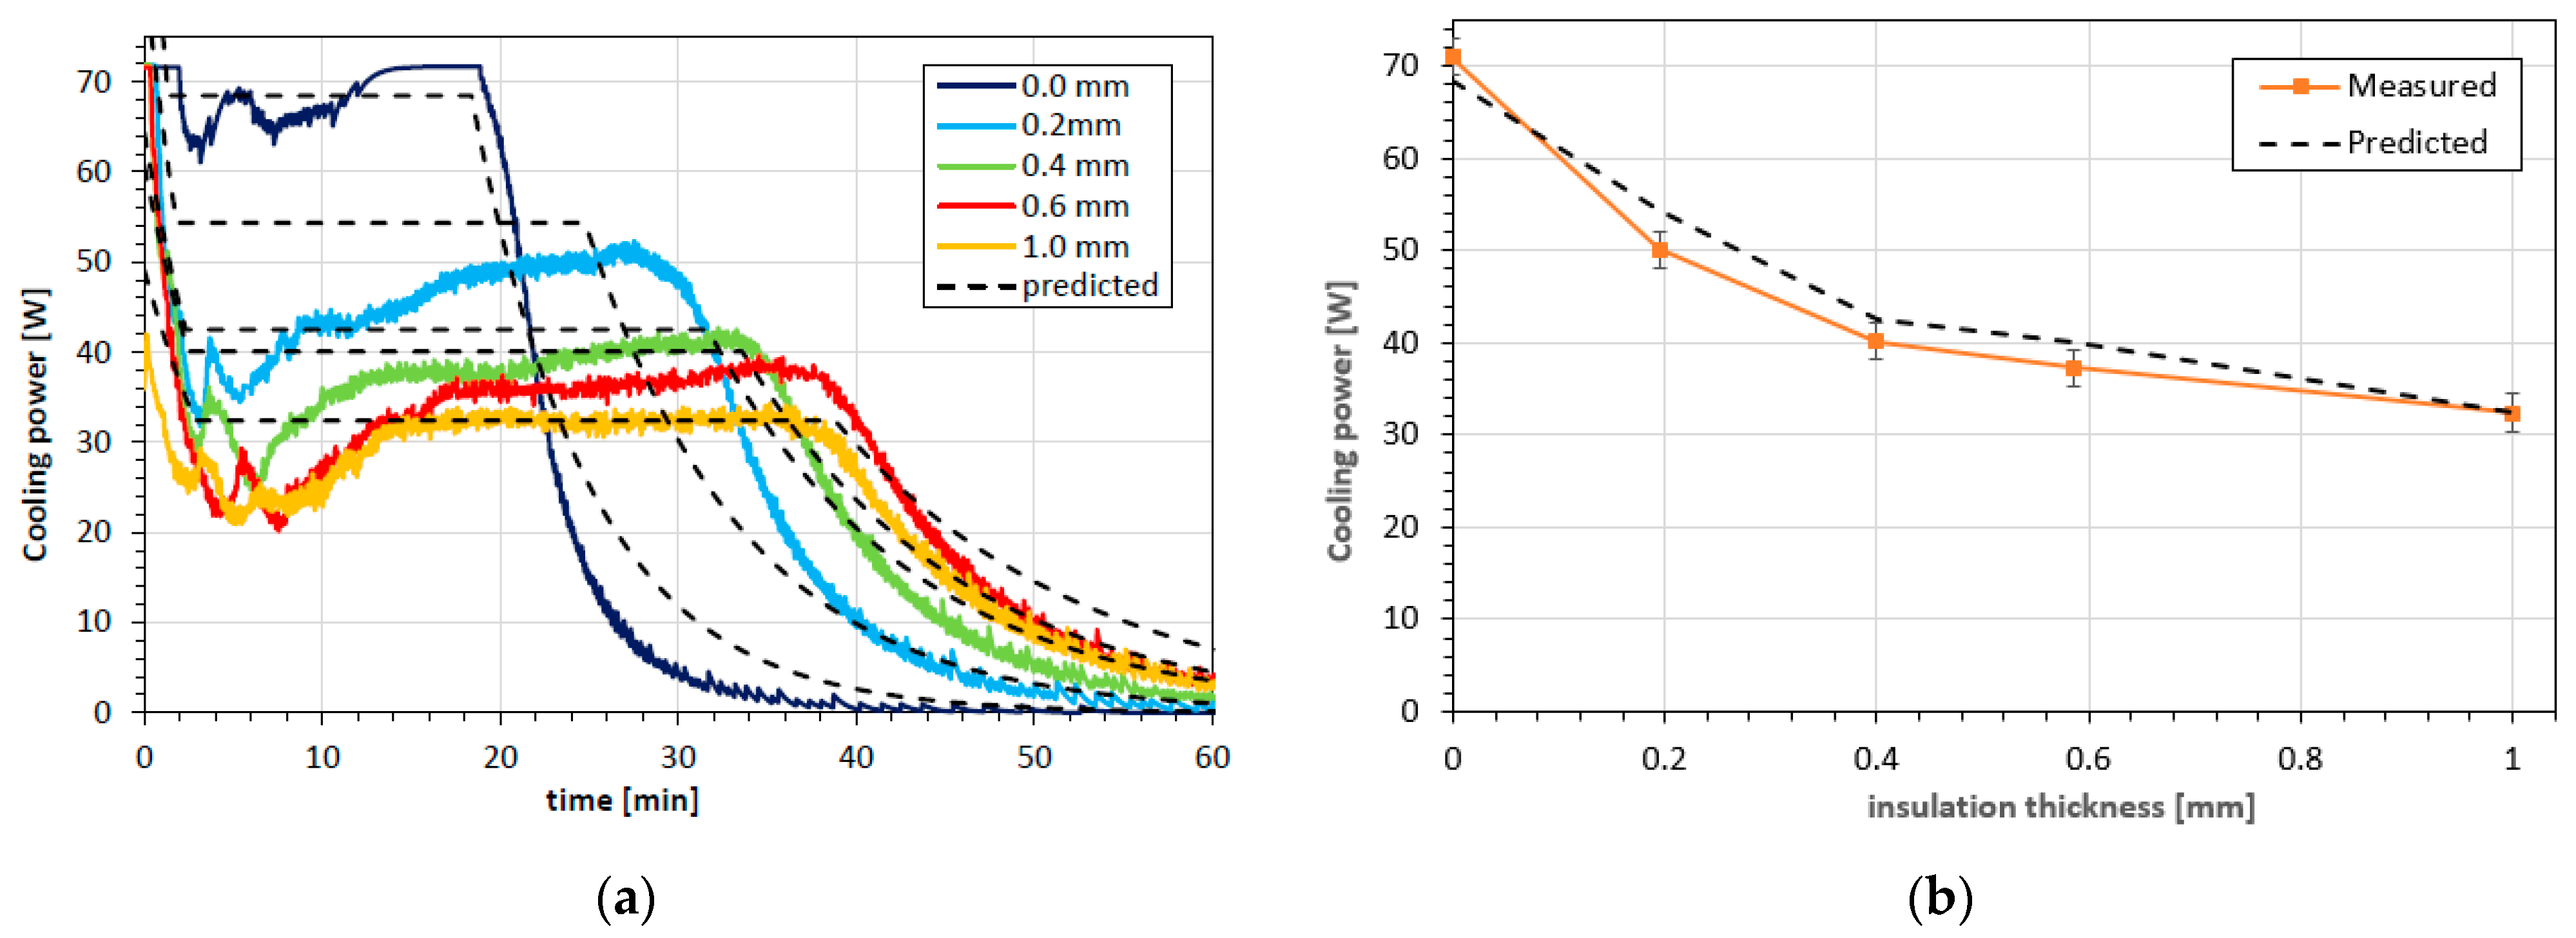
4.1. Comparison with Measured Cooling Power of PCM Ice Packs

Ice packs and insulation layers with different thicknesses were placed on a hotplate as outlined in the experimental section. The measured cooling power profiles for the insulation layer thickness series are shown in Figure 4a as the colored full lines. The cooling package without an extra insulation layer (but with the thin TPU cover, shown as the 0.0 mm line) shows a slightly unstable response close to the 70 W level during the first 20 min and then a rapid decay in cooling power. All other curves show similar behavior but with lower peak power consumption and longer cooling durations. In all cases, the first 5 to 10 min show irregular behavior in which the cooling power first drops rapidly, then increases slightly and eventually reaches a plateau value. The fluctuation in the recorded cooling power during the first 12 min are attributed to the fact that the initial PCM surface was not completely flat, resulting in a reduction in heat transfer. After the formation of a thin fluid film, the heat transfer stabilizes until all solid material is melted.
The calculations are based on Equations (19)–(22) and are performed using thermal conductivities of 0.18 and 0.20 Wm−1K−1 for the TPU and silicone rubber, respectively, and for water a density of 1000 kg/m3, a solid and liquid heat capacity of 2100 and 4180 J kg−1 K−1, respectively, and latent heat of melting of 334 J/g. To account for the air gap between the sample hotplate an initial resistance value of 3.8 10−3 m2K W−1 is assumed. A comparison with the predicted cooling power curves (dashed lines) shows that both the initial decay, the durations of the melting plateau and the subsequent exponential decay are reasonably well predicted. The root mean square error between measurements and predictions amounts to 4.7 W, which is about 10% of the absolute cooling power values. The values of the plateau values at the end of melting are plotted in Figure 4b together with their predictions. The agreement between measured and predicted cooling power at the melting plateau (Figure 4b) can be considered as good.

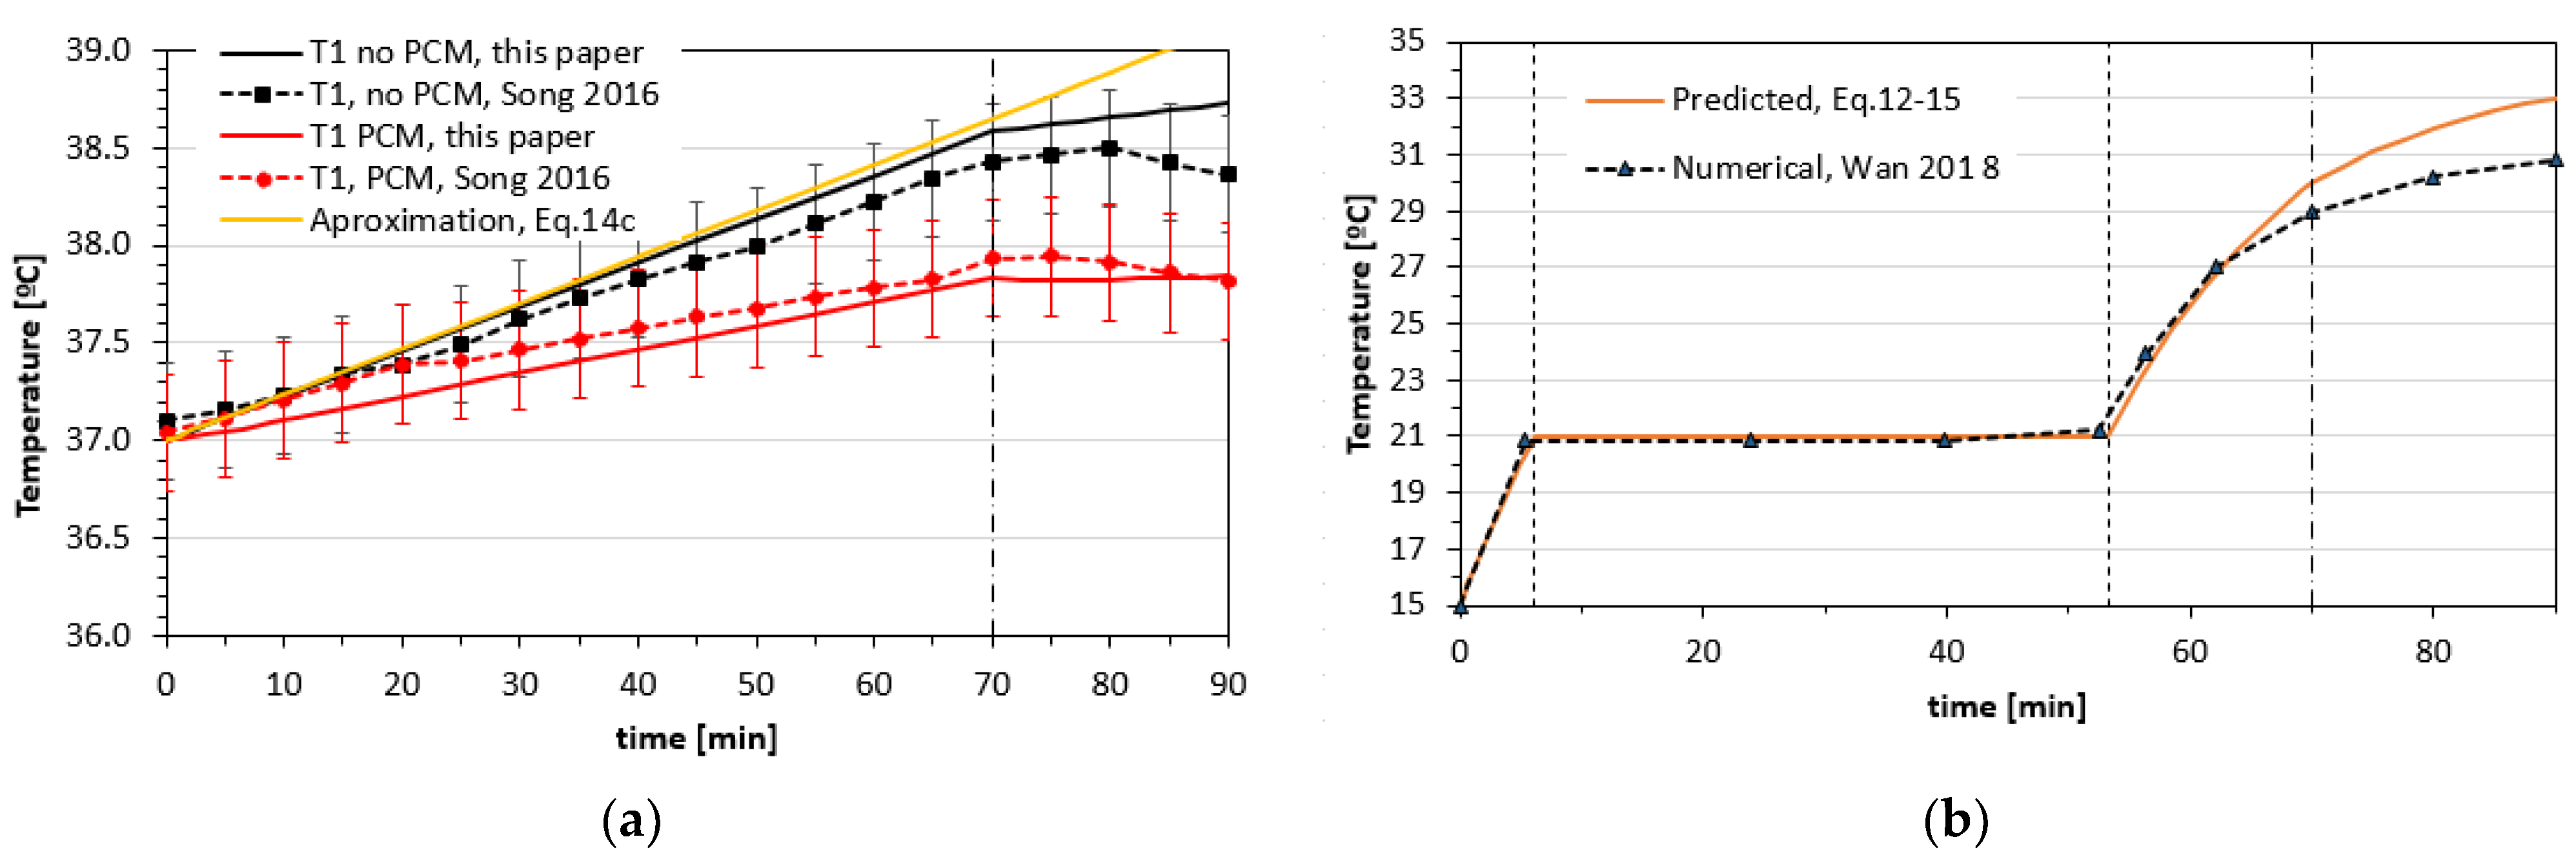
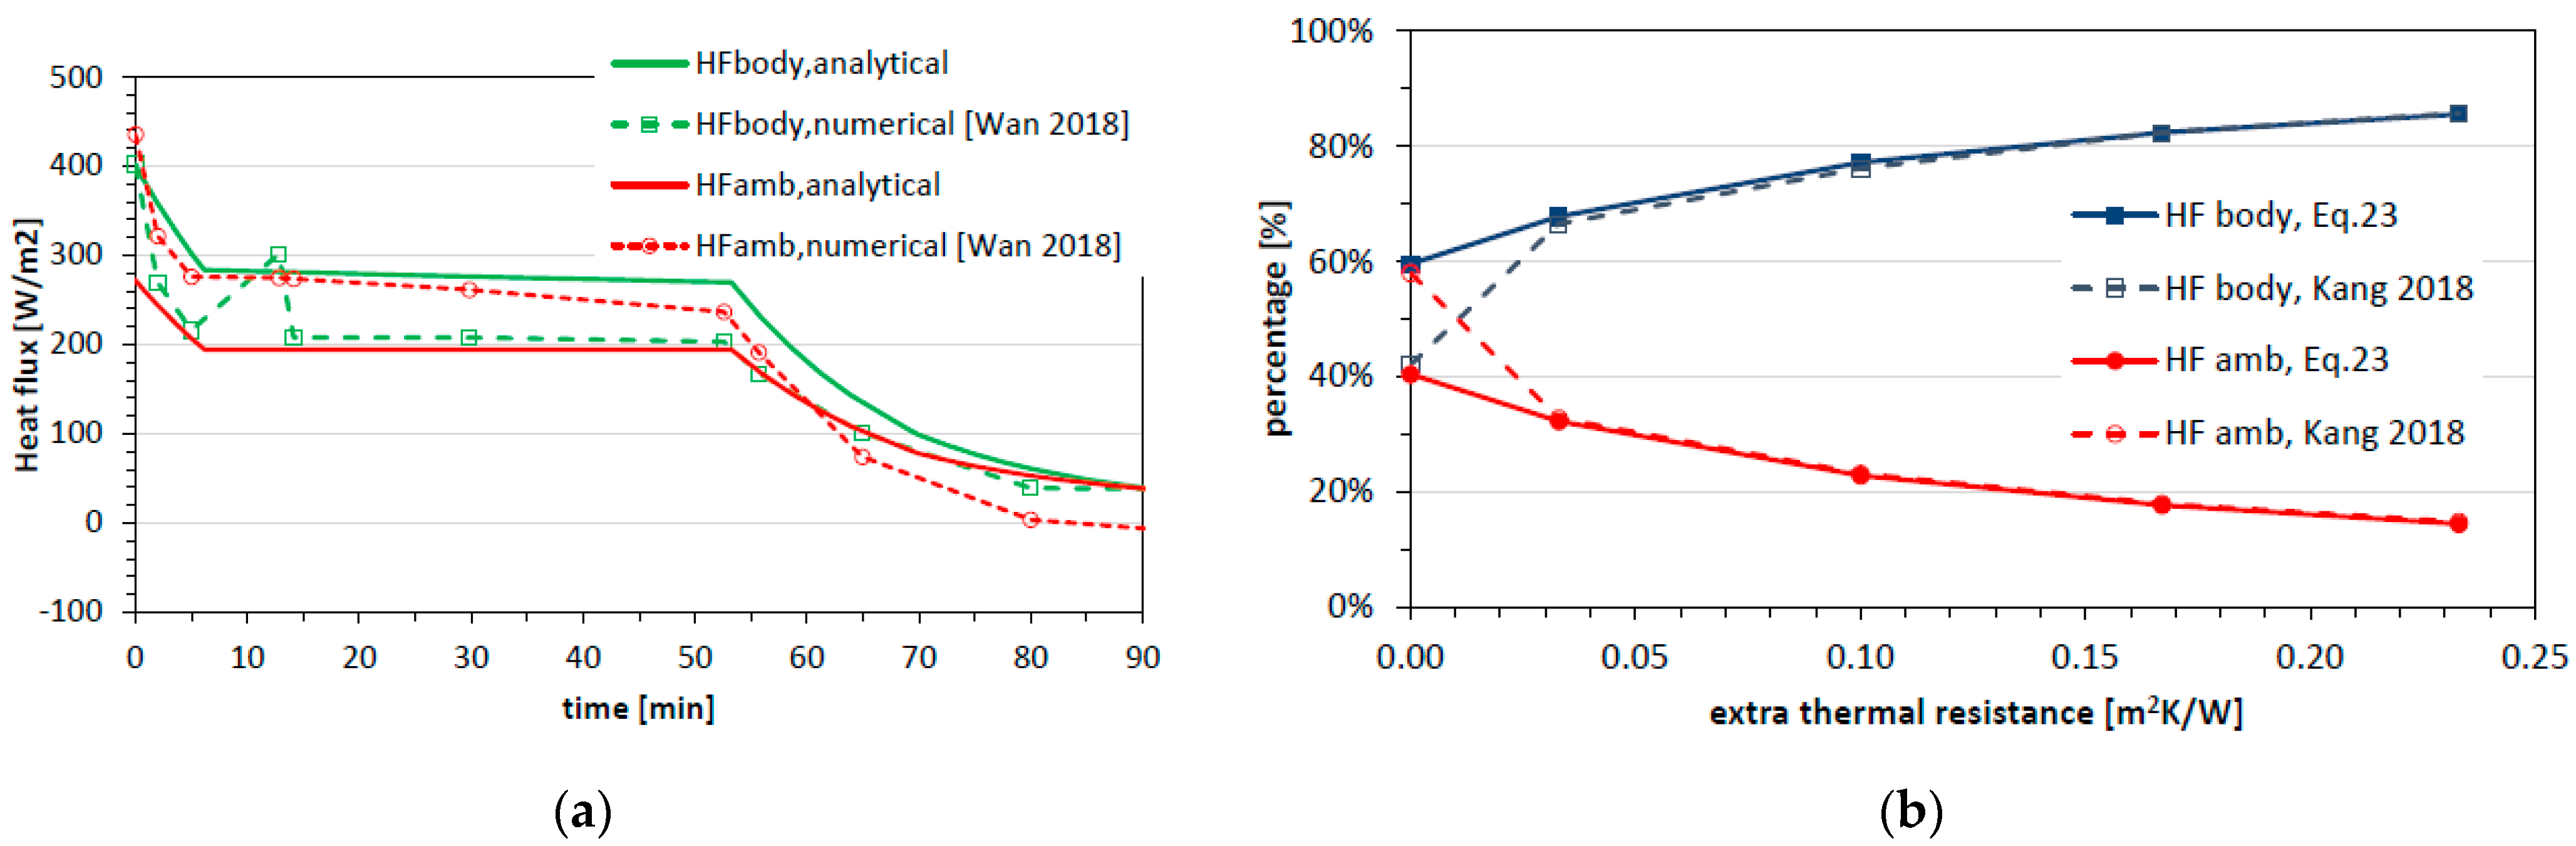
4.2. Comparison with Data Reported in Literature
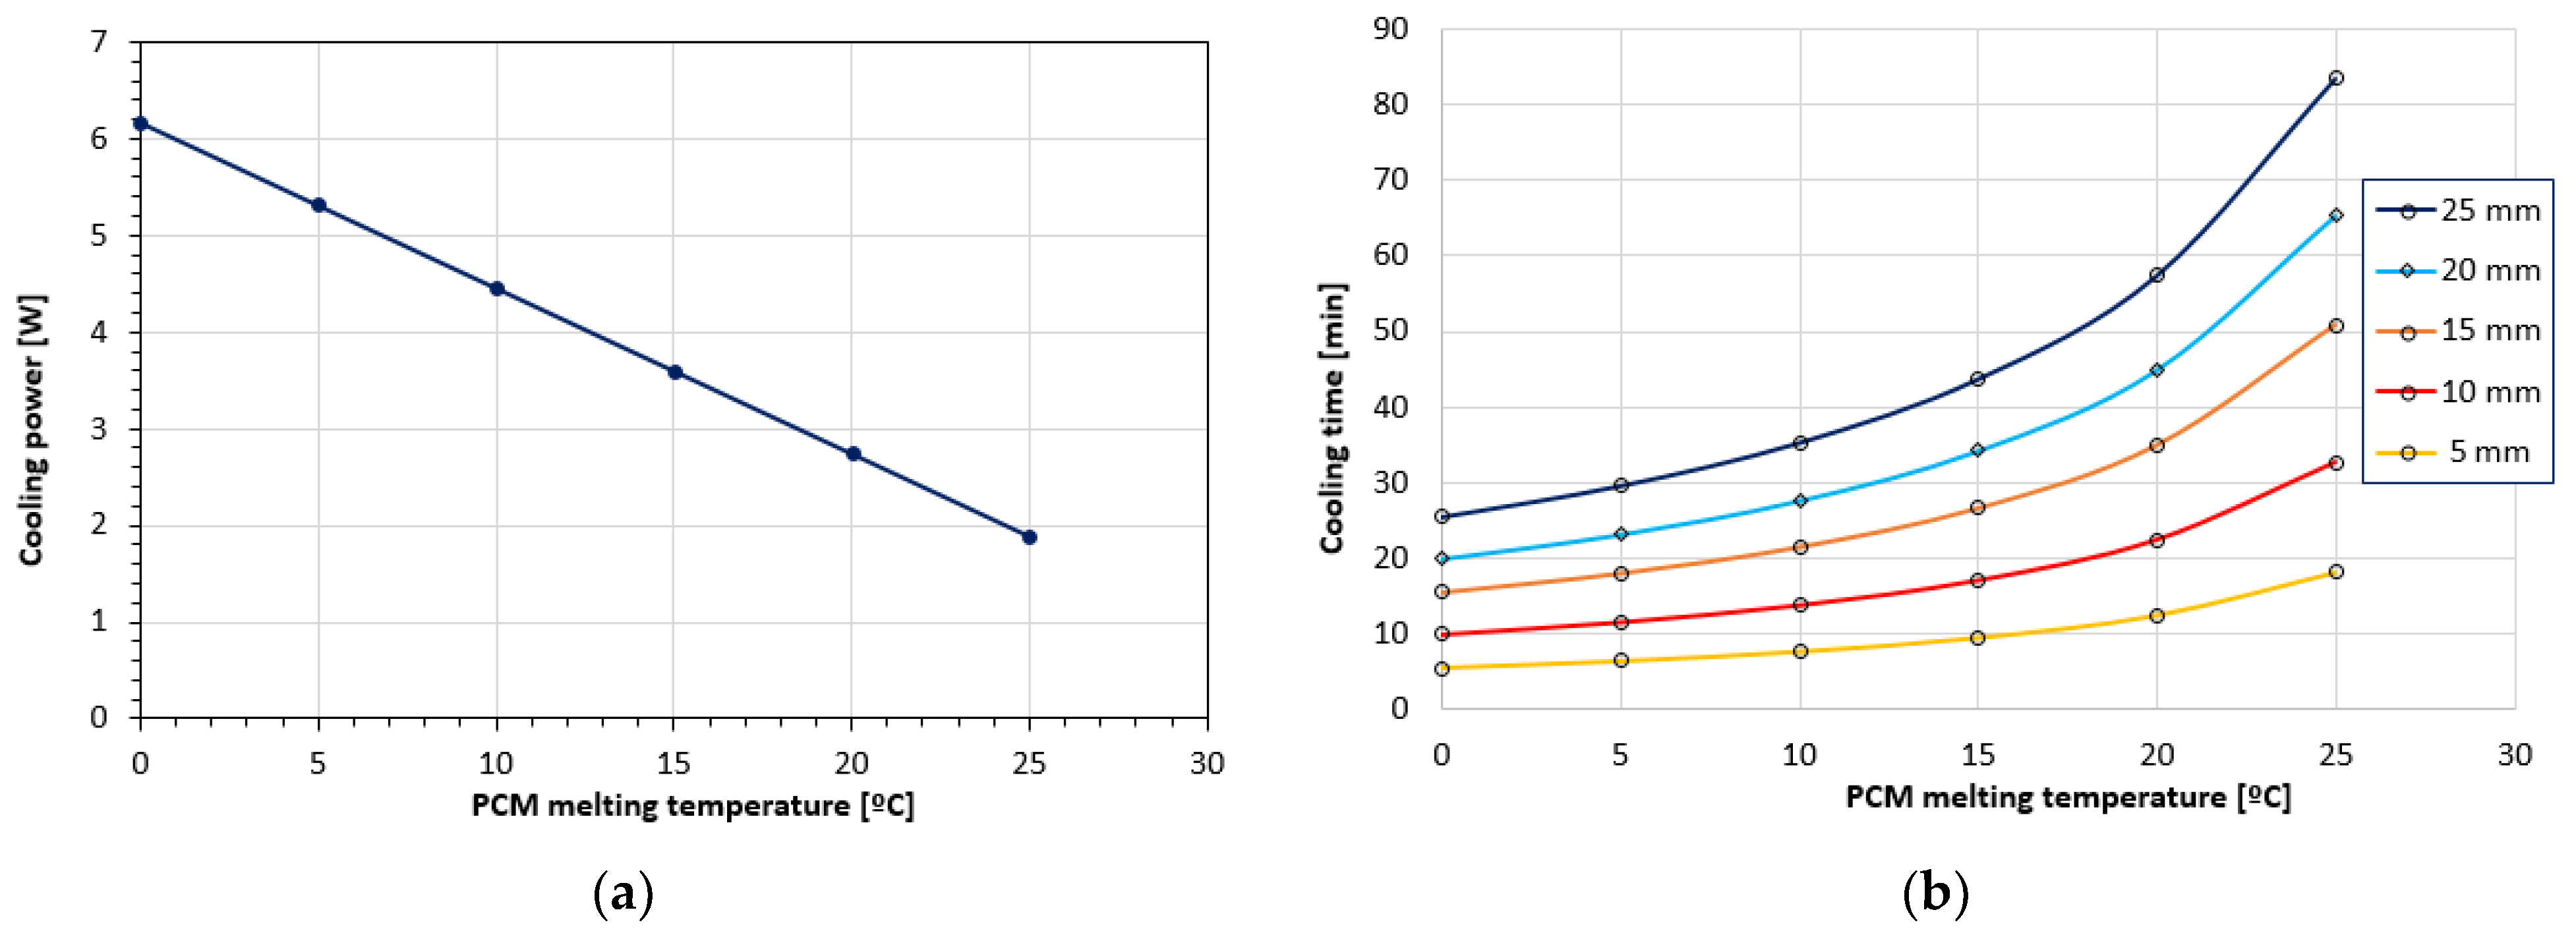
The study of Song [6] on the effects of PCM cooling on human subjects and the numerical simulations corresponding to this [23] will be used to assess the validity of our solutions. They present a human trial study in which 8 participants walked for 70 min on a treadmill at 4.5 km/h (corresponding to 2.7 MET or 157 W/m2, [30]), followed by a 20-min recovery period (1 MET, 58 W/m2). Tests were performed using a cooling vest with and without Glauber salt-based PCM packs with an initial surface temperature of 15 °C. The mean radiant temperature and relative humidity were kept constant at 36 °C and 59%, respectively. For the modeling a radiation heat transfer coefficient of 14 W m−2 K−1 and an initial body temperature of 37 °C were used. The thermal properties used for the calculations can be found in Table 1.
As can be seen in Figure 5a, the body core temperature steadily increases during the exercise period in the hot environment (first 70 min) and then slows down or decreases (last 20 min). The dashed line with symbols represents the measured data from the study of Song [6], whereas the full lines are the results of our model. The differences are typically less than 0.1 °C for both the case without PCM (black lines) and with PCM.
Wan [23] developed a numerical model to analyze the heat and moisture transfer for a hybrid personal cooling garment consisting of PCM packages and ventilation. They showed that their simulations agreed well with the experimental study on human subjects of Song [6] if they model the thermal resistance of the air gap between the PCM package and skin as 0.038 m2KW−1. In Figure 5 we compare their predictions of the PCM temperature (dashed line with symbols) with our solutions for T3 (full line). It is clear that both phase 1 (warming of the PCM to its melting temperature) and phase 2 (PCM melting) are accurately captured by our model whereas the last part (warming of the liquid PCM towards Ta = 36 °C) is slightly over predicted.
The heat flows to the body and the environment are shown in Figure 5. Since those heat flows are proportional to (T1T3) and (TaT3), respectively (see Equation (4)), the heat flow plateaus between 5 and 50 min reflect the PCM melting period. The peak in Wan’s body heat flow between 5 to 15 min is due to sweat condensation on the PCM inner surface which was taken into account in the numerical calculations but not in our model. Condensation thus does have an effect on the heat flow, but its contribution is limited. Comparing the heat flow calculations with those of Wan [23] shows a fairly good agreement over the full time scale.
In a follow-up study, Kang [25] presents the effects of an extra insulation layer on the outside of the PCM pack to improve the efficiency of PCM cooling. The idea is that this extra insulation slows down the PCM melting caused by heat transfer from the environment. As shown in Figure 6a the percentage of heat absorbed from the body (dashed blue line) indeed steadily increases and the part lost to the environment (dashed red line) decreases if the insulation value of the extra layer is increased. Using the heat flux definition of Equation (4) with the PCM at its melting temperature and assuming that the core temperature is still close to T10 we can obtain a simple expression for the ratio rHF of heat lost to the environment with respect to that absorbed from the body and calculate the corresponding fractions (Equation (23)). As shown by the full lines in Figure 6b these results agree quite well with the simulation data of Kang [25]. The only difference appears in the case in which the extra insulation is absent (see also Figure 6a). It should be noted that by choosing a different heat transfer coefficient (25 instead of 14 Wm−2K−1) a much better fit would have been obtained.
f H F b o d y = 1 1 + r H F ,                 f H F a m b = r H F 1 + r H F ,                   r H F = ( T a T 3 m ) ( T 1 0 T 3 m ) R 2 e f f R 4 e f f

5. Parametric Study

In the previous section, we showed that our model is well capable of reproducing results from the literature. As an example of how the equations can be used to obtain a better understanding of the effect of different PCM-related parameters on the cooling performance, we present a simple parametric study. For the selection of a cooling vest, the weight and the cooling duration of the vest are most important. If the vest is too heavy or bulky it decreases the wearing comfort. In addition, according to [34] every extra kilogram of mass increases the net metabolic rate by 1.18 W and thus decreases the performance. On the other hand, if the PCM mass is low, the cooling effect is limited. The targeted duration is determined by the requirements of the application. For a construction worker working 2-h shifts, the desired duration should be at least close to those two hours. For the parametric study, we take the experimental configuration as described in the studies of Song and Wan [6] [23] and the corresponding data in Table 1 as a starting point: a package area of 92 cm2, initial body and mean radiant temperatures of 36 °C, a heat transfer coefficient of 14 W m−2 K−1 and a density of 500 kg/m3. The effective thermal resistance R2eff is the sum of the resistances of the skin, underwear and PCM pocket (see Table 1) and the extra air gap resistance of 0.038 m2KW−1 mentioned in [23]. The parameters that we varied were the PCM thickness (obtained from m3 = ρ3 A3 d3) and the PCM melting temperature, T3m.
Figure 7a shows that the plateau cooling power drops linearly with the melting temperature of the PCM, as could be expected from Equation (18). Note that the cooling power is independent of the thickness of the PCM layer that is used. Figure 7b shows that the reduction in cooling power with increasing PCM temperature is accompanied by a non-linear increase in cooling time. In addition, it shows that here it does make sense to use a thicker PCM layer. For a PCM melting temperature of 20 °C, the cooling time can be seen to increase from 12 to 57 min if the thickness is increased from 5 to 25 mm. If for a certain cooling vest application the required cooling duration is, e.g., 40 min and a PCM pack of 25 mm can be used, it follows from Figure 7b that the PCM melting temperature should be 13 °C and that the corresponding cooling power amounts to 4 W (Figure 7a). In addition, the graphs show that a higher melting temperature will lead to lower cooling powers.
The parametric study presented here was performed using a calculation spreadsheet in which the graphs immediately update after a change in one or more of the model parameters. In contrast, in numerical and experimental studies each data point is the result of a single simulation or experiment which will take considerably more time. The rapid way of evaluating the effect of different parameters on the cooling performance can therefore be considered a large benefit of using an analytical model as presented in this paper.

6. Discussion, Limitations and Recommendations for Future Work

In the above sections, we presented a set of equations describing the effect of PCM cooling on the heat transfer near the human body, validated this model and showed its benefit for doing parametric performance studies. The equations also give a direct qualitative and quantitative substantiation of observations made based on experimental studies. The observation of Gao [11] that the cooling power increased proportionally to the body to PCM temperature difference, e.g., directly follows from Equation (18). Similarly, Equation (22) predicts the reduction in the PCM cooling time due to radiation to the environment as mentioned in [18] whereas Equation (23) gives a quantitative prediction for the effect of an extra insulation layer (Figure 6b and [25]). Moreover, the findings of Hamdam [20] about the effects of the PCM mass and melting temperature on the cooling power can be observed directly from Equation (18). The model presented here can therefore be seen as a valuable tool for interpreting literature observations as well as predicting the effect of design parameters on the cooling vest performance.
Apart from its benefits, it is obvious that the model also has its limitations. The most important ones are listed below:
  • The model considers one-dimensional planar heat transfer and thus neglects the effects of body curvature on the conduction and heat loss (or gain) to the environment. Since a curved body has more surface area per unit volume, this assumption underestimates the radiation contribution, and this effect gets larger for more curved body parts such as arms and legs. Since we are interested in the heat transfer near the PCM layer, the rule of thumb is that the model is valid if the PCM thickness is much less than that of (half of) the body, d3/d1 « 1. Note that in thermophysiology models the body is usually considered to consist of cylindrical elements [12,13,14]. This may be a good approximation for the arms and legs but could be less appropriate for the trunk area.
  • We approximated the body core and PCM as a layer with a uniform, averaged temperature, as was performed in previous (numerical) modeling work [13,14,15]. In this way, the effects of internal temperature gradients and melting details are disregarded.
  • In order to simulate human thermoregulation in realistic conditions, heat loss by sweat evaporation, respiration and the effect of subcutaneous blood flow must be taken into account. As mentioned before, all these effects essentially act as an energy source or loss contributions in the body core layer and thus only change the numerical value of the Q1 parameter in our model. The equations to model these energy loss terms are conveniently described in [33].
  • In practice, only a part of the torso surface is covered with PCM packs. The effect of such a partial coverage on the core temperature can be estimated by a simple averaging process.
T 1 a v g = ( 1 f A ) T 1 n o   P C M + f A T 1 P C M ,                   f A = A p a c k s A t o r s o
where fA denotes the area fraction of the torso covered by PCM packs. The PCM temperature T3 and calculated cooling times as derived here remain as they are.
Note that although the solutions may appear lengthy, they can be simplified considerably in limiting cases and under special conditions. First of all, for the human body in contact with a PCM, as considered in this paper, all Q3 terms in the equations above can be omitted. Next to that, simplifications can be made by linearizing the transient elements, as explained in the Suppl. Info. In addition, for cases where the thermal mass of layer 3 (the PCM layer) is much smaller than that of the body layer the β and δ parameters are close to unity and more simplifications are possible. The largest simplifications are obtained in cases where radiation is absent. In that case, there is only one exponential term needed. The solutions for the no-radiation case are given in the Supplemental Information.

7. Conclusions

The motivation for this paper was to find simple relations between PCM-related parameters such as latent heat, mass and thickness and the effectiveness of cooling (cooling power, cooling duration and change in body core temperature). In order to be relevant for the practical situation of a human wearing a cooling vest in an outdoor environment, we took into account the temperature increase due to metabolic heat generation as well as the effects of insulation by clothing layers and radiation to the environment. The solutions presented are new and have not been reported before in literature.
The key results of this paper are:
  • A set of closed-form equations is presented which do not need a numerical solver and directly relate cooling vest design parameters such as the PCM mass and melting temperature to its performance
  • The model was able to reproduce cooling power data obtained from experiments with ice packs on a hot plate with constant surface temperature as well as PCM cooling data in various literature sources;
  • The relation between the PCM performance and the PCM melting temperature and layer thickness is shown in a dedicated parametric study.
The solutions presented here are general and not only describe the change in body temperature in a hot environment when in contact with a PCM material, but also the temperature development of a human in an extremely cold environment. In addition, the thermal performance of clothing with an integrated heating layer can be predicted by using nonzero values in the Q3 terms in the equations above. The hotplate solutions can also be used to describe the case of a thermal manikin with different clothing and PCM configurations in constant surface temperature mode. Moreover, of course, the solutions are not limited to a human body system and can also be used to estimate the effectiveness of cooling elements in contact with food or PCMs used in industrial processes or building environments. The equations are computationally simple and do not need a numerical solver, which allows them to be embedded in a spreadsheet or app as a simple means of estimating the layers of clothing needed to dress in a cold environment or the maximum work time in insulating garments while working in a hot environment.

Supplementary Materials

The following supporting information can be downloaded at: https://www.mdpi.com/article/10.3390/thermo2030017/s1.

Author Contributions

K.M.B.J.: Conceptualization, Formal analysis, Writing and editing; L.T.: Experiments, Writing-Reviewing. All authors have read and agreed to the published version of the manuscript.

Funding

This work is part of the research program “Citius Altius Sanius” with project number P16-28 project 8, which is financed by the Dutch Research Council (NWO).

Data Availability Statement

The data related to this paper can be found in the Supplementary Information.

Conflicts of Interest

The authors declare no conflict of interest.

Nomenclature

ASurface area of layer element (m2)
A1, A2Parameters in solution for T (°C)Greek symbols
CParameter in Equations (14) and (15) (s−1)αParameter in exponential function (s−1)
c1, c3Specific heat (J kg−1 K−1)βParameter in Equations (13) and (15) (-)
dLayer thickness (m); d1 is half the torso thicknessγParameter in Equations (13) and (15) (-)
EEnergy (J)δParameter in Equations (13) and (15) (-)
fFraction (-)ρDensity (kg m−3)
hiParameter (s−1)Sub- and superscripts
hrradiative heat transfer coefficient (Wm−2K−1)0Solution at t = 0
HParameter (s−1)1Body core layer
kThermal conductivity (Wm−1K−1)2Insulation between body core and PCM layer
LLatent heat of PCM (J/kg)3PCM layer
miMass of layer i (kg)4Outside insulation
PCooling power (W)aambient
qHeat flux (W/m2)effeffective
QHeat production per unit area (W/m2)HFHeat flow
Q’Q/(ρcd) (K/s)hphotplate
QVVolumetric heat production (W/m3)iLayer number
RThermal resistance (m2K W−1)lliquid
tTime (s)mmelt
TTemperature (°C)RResistance contribution
xThickness coordinate (m)radRadiation contribution
ssolid
AbbreviationsskinSkin Layer
PCMPhase change material

References

  1. Mokhtari Yazdi, M.; Sheikhzadeh, M. Personal cooling garments: A review. J. Text. Inst. 2014, 105, 1231–1250. [Google Scholar] [CrossRef]
  2. Smolander, J.; Kuklane, K.; Gavhed, D.; Nilsson, H.; Holmer, I. Effectiveness of a light-weight ice-vest for body cooling while wearing fire fighter’s protective clothing in the heat. Int. J. Occup. Saf. Ergon. JOSE 2004, 10, 111–117. [Google Scholar] [PubMed]
  3. Teunissen, L.P.J.; Wang, L.-C.; Chou, S.-N.; Huang, C.-H.; Jou, G.-T.; Daanen, H.A.M. Evaluation of two cooling systems under a firefighter coverall. Appl. Ergon. 2014, 45, 1433–1438. [Google Scholar] [CrossRef] [PubMed]
  4. Butts, C.L.; Smith, C.R.; Ganio, M.S.; McDermott, B.P. Physiological and perceptual effects of a cooling garment during simulated industrial work in the heat. Appl. Ergon. 2017, 59, 442–448. [Google Scholar]
  5. House, J.R.; Lunt, H.C.; Taylor, R.; Milligan, G.; Lyons, J.A.; House, C.M. The impact of a phase-change cooling vest on heat strain and the effect of different cooling pack melting temperatures. Eur. J. Appl. Physiol. 2013, 113, 1223–1231. [Google Scholar]
  6. Song, W.; Wang, F. The hybrid personal cooling system (PCS) could effectively reduce the heat strain while exercising in a hot and moderate humid environment. Ergonomics 2016, 59, 1009–1018. [Google Scholar]
  7. Ouahrani, D.; Itani, M.; Ghaddar, N.; Ghali, K.; Khater, B. Experimental study on using PCMs of different melting temperatures in one cooling vest to reduce its weight and improve comfort. Energy Build. 2017, 155, 533–545. [Google Scholar] [CrossRef]
  8. Li, W.; Liang, Y.; Liu, C.; Ji, Y.; Cheng, L. Study of ultra-light modular phase change cooling clothing based on dynamic human thermal comfort modeling. Build. Environ. 2022, 222, 109390. [Google Scholar] [CrossRef]
  9. ASTM F2371-10; Standard Test Method for Measuring the Heat Removal of Personal Cooling System Using a Sweating Heated Manikin. ASTM International: West Conshohocken, PA, USA, 2010.
  10. Ciuha, U.; Valenčič, T.; Mekjavic, I.B. Cooling efficiency of vests with different cooling concepts over 8-hour trials. Ergonomics 2021, 64, 625–639. [Google Scholar] [CrossRef]
  11. Gao, C.; Kuklane, K.; Holmér, I. Cooling vests with phase change material packs: The effects of temperature gradient, mass and covering area. Ergonomics 2010, 53, 716–723. [Google Scholar] [CrossRef]
  12. Gao, C.; Kuklane, K.; Holmér, I. Cooling vests with phase change materials: The effects of melting temperature on heat strain alleviation in an extremely hot environment. Eur. J. Appl. Physiol. 2011, 111, 1207–1216. [Google Scholar] [CrossRef] [PubMed]
  13. Stolwijk, J.A.J.; Hardy, J.D. Temperature regulation in man—A theoretical study. Pflüger’s Arch. Für Die Gesamte Physiol. Des Menschen Und Der Tiere 1966, 291, 129–162. [Google Scholar] [CrossRef]
  14. Fiala, D.; Lomas, K.J.; Stohrer, M. A computer model of human thermoregulation for a wide range of environmental conditions: The passive system. J. Appl. Physiol. 1999, 87, 1957–1972. [Google Scholar] [CrossRef] [PubMed]
  15. Tanabe, S.-I.; Kobayashi, K.; Nakano, J.; Ozeki, Y.; Konishi, M. Evaluation of thermal comfort using combined multi-node thermoregulation (65MN) and radiation models and computational fluid dynamics (CFD). Energy Build. 2002, 34, 637–646. [Google Scholar] [CrossRef]
  16. Potter, A.W.; Blanchard, L.A.; Friedl, K.E.; Cadarette, B.S.; Hoyt, R.W. Mathematical prediction of core body temperature from environment, activity, and clothing: The heat strain decision aid (HSDA). J. Therm. Biol. 2017, 64, 78–85. [Google Scholar] [CrossRef]
  17. Mokhtari Yazdi, M.; Sheikhzadeh, M.; Borhani, S. Modeling the heat transfer in a PCM cooling vest. J. Text. Inst. 2015, 106, 1003–1012. [Google Scholar] [CrossRef]
  18. Mokhtari Yazdi, M.; Sheikhzadeh, M.; Dabirzadeh, A.; Chavoshi, E. Modeling the efficiency and heat gain of a phase change material cooling vest: The effect of ambient temperature and outer isolation. J. Ind. Text. 2016, 46, 436–454. [Google Scholar] [CrossRef]
  19. Yazdi Motahareh, M.; Sheikhzadeh, M.; Chavoshi Seyed, E. Modeling the performance of a PCM cooling vest considering its side effects. Int. J. Cloth. Sci. Technol. 2015, 27, 573–586. [Google Scholar] [CrossRef]
  20. Hamdan, H.; Ghaddar, N.; Ouahrani, D.; Ghali, K.; Itani, M. PCM cooling vest for improving thermal comfort in hot environment. Int. J. Therm. Sci. 2016, 102, 154–167. [Google Scholar] [CrossRef]
  21. Itani, M.; Ghaddar, N.; Ghali, K.; Ouahrani, D.; Chakroun, W. Cooling vest with optimized PCM arrangement targeting torso sensitive areas that trigger comfort when cooled for improving human comfort in hot conditions. Energy Build. 2017, 139, 417–425. [Google Scholar] [CrossRef]
  22. Itani, M.; Ouahrani, D.; Ghaddar, N.; Ghali, K.; Chakroun, W. The effect of PCM placement on torso cooling vest for an active human in hot environment. Build. Environ. 2016, 107, 29–42. [Google Scholar] [CrossRef]
  23. Wan, X.F.; Wang, F.M.; Udayraj. Numerical analysis of cooling effect of hybrid cooling clothing incorporated with phase change material (PCM) packs and air ventilation fans. Int. J. Heat. Mass Tran. 2018, 126, 636–648. [Google Scholar] [CrossRef]
  24. Xu, P.; Kang, Z.; Wang, F.; Udayraj. A Numerical Analysis of the Cooling Performance of a Hybrid Personal Cooling System (HPCS): Effects of Ambient Temperature and Relative Humidity. Int. J. Environ. Res. Public Health 2020, 17, 4995. [Google Scholar] [CrossRef]
  25. Kang, Z.; Udayraj; Wan, X.; Wang, F. A new hybrid personal cooling system (HPCS) incorporating insulation pads for thermal comfort management: Experimental validation and parametric study. Build. Environ. 2018, 145, 276–289. [Google Scholar] [CrossRef]
  26. Wan, X.; Fan, J. A new method for measuring the thermal regulatory properties of phase change material (PCM) fabrics. Meas. Sci. Technol. 2009, 20, 025110. [Google Scholar] [CrossRef]
  27. Ying, B. Assessing the performance of textiles incorporating phase change materials. Polym. Test. 2004, 23, 541. [Google Scholar]
  28. Ghali, K.; Ghaddar, N.; Harathani, J.; Jones, B. Experimental and Numerical Investigation of the Effect of Phase Change Materials on Clothing During Periodic Ventilation. Text. Res. J. 2004, 74, 205–214. [Google Scholar] [CrossRef]
  29. Elson, J.; Eckels, S. An objective method for screening and selecting personal cooling systems based on cooling properties. Appl. Ergon. 2015, 48, 33–41. [Google Scholar] [CrossRef]
  30. Al-Mujahid, A.; Zedan, M.F. Transient heat-conduction response of a composite plane wall. Wärme-Und Stoffübertragung 1991, 26, 33–39. [Google Scholar] [CrossRef]
  31. Hu, Y.; Huang, D.; Qi, Z.; He, S.; Yang, H.; Zhang, H. Modeling thermal insulation of firefighting protective clothing embedded with phase change material. Heat Mass Transfer. 2013, 49, 567–573. [Google Scholar] [CrossRef]
  32. Carslaw, H.S.; Jaeger, J.C. Conduction of Heat in Solids; Oxford University Press: Oxford, UK, 1947. [Google Scholar]
  33. ASHRAE. Thermal Comfort Conditions; ASHRAE Standard: Peachtree Corners, GA, USA, 2005. [Google Scholar]
  34. Grabowski, A.; Farley, C.T.; Kram, R. Independent metabolic costs of supporting body weight and accelerating body mass during walking. J. Appl. Physiol. 2005, 98, 579–583. [Google Scholar] [CrossRef] [PubMed] [Green Version]
Figure 1. (a) Hotplate design consisting of top aluminum plate, heating elements and control electronics; (b) Hotplate with silicone rubber insulation layer, ice pack and styrene cover.
Thermo 02 00017 g001
Figure 2. (a) Transient thermal element; (b) Thermal insulation element.
Thermo 02 00017 g002
Figure 3. Temperature profiles for human body with PCM. The thick black line indicates the initial temperature profile.
Thermo 02 00017 g003
Figure 4. Measured cooling powers of ice packs on hotplate (a) Comparison of experiments (full lines) and predictions (dash-dotted lines); (b) Cooling power at melting plateau versus insulation layer thickness. Symbols: measured values, dashed line: predictions.
Thermo 02 00017 g004
Figure 5. Predicted temperature profiles compared with literature data: (a) Measured body core temperature T1 (dashed lines, Song [6]) and analytical results (full lines) for the case without PCM cooling (black lines) and with PCM (red lines); (b) PCM temperature T3 as predicted by Equations (12)–(15) (full line) compared with numerical data from Wan [23] (dashed line with triangles).
Thermo 02 00017 g005
Figure 6. (a) Heat absorbed by the PCM from the body (green lines) and environment (red lines); Full lines: analytical model, dashed lines: numerical [23]; (b) Effect of extra insulation of PCM outer surface on body cooling efficiency. Full lines: analytical solution Equation (23), dashed lines [25].
Thermo 02 00017 g006
Figure 7. Results of parametric study: (a) Cooling power plateau values, Equation (18); (b) Cooling time, Equation (22). The numbers in the legend indicate the PCM thickness in mm.
Thermo 02 00017 g007
Table 1. Thermal properties used as input for human PCM cooling model. Data from [23] unless indicated otherwise. Thermal resistances are calculated as the ratio of thickness and thermal conductivity.
PropertyLayer 1Layer 2Layer 3Layer 4
Body Core [14]Skin [14]UnderwearPCM PocketAir GapPCM, Na2SO4Outer Layer
Thermal conductivity [Wm−1K−1]0.420.470.06140.03170.0250.60.0592
Specific heat [J/kg]3800-13401340-36001210
Density [kg/m3]1085-317392-500607
Thickness [mm]1232.00.3560.16519.50.338
Melting temperature [°C]-----21-
Melting enthalpy [kJ/kg]-----144-
Thermal resistance [m2KW−1]-0.00480.00580.00500.20-0.0057
Publisher’s Note: MDPI stays neutral with regard to jurisdictional claims in published maps and institutional affiliations.

