1. Introduction
The environmental impact of greenhouse gas (GHG) emissions on our planet are more alarming than ever [
1]. The climate conditions of our planet are worsening from year to year, according to the IPCC annual reports [
2]. Climate change also causes an increase in the energy demand [
3] and the energy dependence of several countries [
4]. The sharing of renewables in the energy context is thus mandatory [
5]. Moreover, the issue of urban wastes disposal is also becoming increasingly important in the pathway of the energy transition [
6]. The production of biogas allows the exploitation of renewable natural gas starting from wastes [
7].
Biogas can be obtained by a plurality of different biomasses, which can differ in total solid content [
8], alkalinity of the moisture [
9], fats content [
10], and other physicochemical characteristics [
11]. This means that a well-organized structure for biomass harvesting in both urban and rural centers paves the way for a massive production of biogas [
12]. The biogas may be used as a fuel for the cogeneration of combined heat and power (CHP) [
13], which is the actual state of the art in biogas plant [
14]. Otherwise, the biogas may be also upgraded into biomethane [
15], separating CO
2 (and other impurities [
16]) from CH
4 [
17]. This biomethane can be used as fuel for vehicles [
18] or injected into the national gas grid [
19]. The possibility of exploiting different biomasses leads to the necessity of considering different reactors in which the AD process occurs [
20]. In fact, in case of manure, wastewater, or sewage sludges, up-flow anaerobic sludge blanket (UASB) reactors are used [
21]. Conversely, in case of organic fraction of municipal solid waste (OFMSW), continuously stirred tank reactors (CSTR) or plug flow reactors (PFR) are mainly considered [
22]. The fact that PFRs and CSTRs are more likely to be adopted in the case of OFMSW makes these technologies extremely attractive for the urban centers waste management [
23].
Several works are available in literature presenting models for the biochemical behavior of the microbial species during the AD process [
24]. In fact, mathematical modelling is crucial to correctly predict the biogas yield from the AD process [
25]. The most diffused model adopted in case of low total solid content of the biomass is the ADM1 model, firstly developed by IWA task group [
26]. The same authors of this work validated [
27] and used this model in previous works to evaluate the production of biogas from the OFMSW in case of CSTRs [
28]. However, in literature, some models are also available for the simulation of PFRs. A study on the modeling of the AD process in a PFR reactor was recently presented by Panaro et al. [
29]. The model proposed in this work is based on second-order partial differential equations (PDEs) for the concentrations of the microbial species. Furthermore, the equations also consider the convective and diffusive phenomena that occur within the digester due to the concentration gradients. The computational domain is a 1D field in which the density is assumed constant. The model was used to predict the production of biogas from untreated manure bedded with straw and showed good results in terms of accuracy. This model is validated, also considering the variation of several pivotal parameters as the organic loading rate (OLR), hydraulic retention time (HRT), and length of the reactor. Veluchamy et al. [
30] proposed a simple first-order reaction kinetic model for the substrate concentration and biogas yield variations along the PFR reactor. Further, in this case, the model is validated against experimental data collected in the laboratory. The reactor was a 65 L batch PFR operating with lignocellulosic corn-silage under mesophilic conditions. In this case, the maximum biogas yield of 0.264 m
3/kgVS d was obtained with the maximum OLR of 6.5 kg/m
3d and HRT of 17 days. An interesting model is proposed by Donoso-Bravo et al. [
31], which assessed that a PFR can be studied as a chain of
n CSTR connected in series, by means of mass balances. In this case, the output of the first reactor becomes the input of the second one, and so on until the
n-th CSTR reactor is reached. The modified ADM1 is the biological model adopted for the prediction of the biogas production and results are validated by means of 160 L batch-scale reactor operating with cow manure. Several models were tested and compared to predict the biogas production in case of nonperfect mixing of digester. The PFR model results slightly overestimated the performance of the reactor with respect to other models based on nonideal mixing assumption.
Unfortunately, even the most accurate models for the biogas yield prediction in PFRs do not consider the thermal phenomena, which occur in these digesters, despite their relevance [
32]. In [
33], the authors performed a thermal analysis of a PFR by considering the thermal losses through the external walls and the solar radiative contribution. No models are considered for the AD process temperature due to the thermal inertia of the biomass within the reactor. Recently, in [
34], the authors proposed an interesting analysis of the optimal control of the nonlinear dynamics of the reactants concentrations by means of the temperature. This parameter was regulated by means of an external heat exchanger, and the relevance of the temperature effect was assessed. However, in this case, a detailed coupling with the AD process was considered. In Wu et al. [
35], a 3D model, based on first-order kinetic equations, mass and energy continuity, and species transport is presented. The numerical simulation is performed in Fluent 6.1 to predict the concentration distribution and temperature variation in the whole dominium. Comparison with experimental data available in literature showed an error below 5% with a temperature gradient lower than 5 K. The same authors [
36] also investigated the heat transfer phenomena occurring between the external surface of the reactor and the environment. Several geometries, cylindrical and rectangular, were proposed and the cylindrical one with a flat cover resulted the least heat dissipating. However, no study regarding heat transfer processes within the PFR reactor are available in literature.
Aim and Novelty of the Work
The aim of this work is to fill the gap in the scientific knowledge regarding the modeling of both biological and thermal phenomena that occur during the anaerobic digestion in PFRs. The literature review presented in this section showed that biological models are widely applied to PFRs. The relevance of the heat transfer contribution to the AD process is vastly recognized but accurate models for the prediction of the temperature gradients, strictly related to the biological ones, are still missing for these reactors. In particular, the available models are not coupled with accurate biological models and do not consider the thermal inertia of the input biomass and digester. These limitations are overcome in the present work and the novelties can be listed as follows:
A detailed and comprehensive integrated thermal and biological model, also removing the common assumption of steady state, is considered. In particular, a detailed 1-D transient simulation model that couples both the biological and thermal aspects of the AD of OFMSW in a PFR is proposed.
The thermal model considers the heat transfer between the OFMSW and the internal heat exchanger, in addition to the heat transfer between the reactor and the environment.
The PFR model is compared to a CSTR one previously developed to assess how different reactors may influence biogas production, starting from the same input biomass.
Simulations are performed in MatLab® and results in terms of time-dependent biochemical species evolution and temperature variations are shown and discussed.
2. Method
A model able to simultaneously simulate the thermal and biological processes occurring within the reactor is implemented in MatLab®. The effectiveness of thermal exchange strictly depends on the geometrical and structural features of the digester and the design of the heating system. By means of the design of the heat exchange system, the temperature profile inside the digester can be predicted. This is a crucial step to determine one of the most significant parameters of the AD process. As mentioned before, the thermal model is strictly related to the biological one, since the biological kinetics are dramatically affected by the operating temperature. By means of this comprehensive model, it is possible to calculate the time histories of the temperature profiles and of the concentration profiles of the different substances and of the biogas flow rate.
In the following sections, the thermal and biological models are described in detail.
2.1. Biological Model
The ADM1 is the most widely recognized and popular mathematical model to describe the anaerobic digestion (AD) process [
37]. As previously discussed, this model was extensively used and validated vs. experimental data in many studies. In this work, the simplified version of ADM1 [
38] was implemented and a few processes and substrate components with respect to general model were considered [
39].
Assuming that the input OFMSW flow rate is equal to the output digestate (
and that the volume occupied by the waste remains constant, the mass balance equations of the model can be generalized as follows:
This equation represents the mass balance for the generic component , and and are the input concentrations of ith component contained in the waste and the concentration of it in the reactor during the AD process, respectively. The last term of Equation (1) is the sum of kinetics of reaction of jth process () multiplied by the biochemical coefficient of the ith component in the jth reaction ().
The simplified ADM1 model consists of 13 differential mass balance equations, one for each organic matter component. In
Table 1, the soluble substrates are indicated with
and the insoluble ones with
:
These concentrations are expressed in
kgCOD/
m3 and evolve in different ways according to the active phase during the AD process. The reactions kinetics are considered by means of the last term of Equation (1), which differ for each component and process. Values are specified in
Table 2.
where,
- -
- -
- -
- -
2.2. Thermal Model
The thermal model consists of two energy balance equations. They constitute a system of two equations in two variables: the output water temperature and the output digestate temperature .
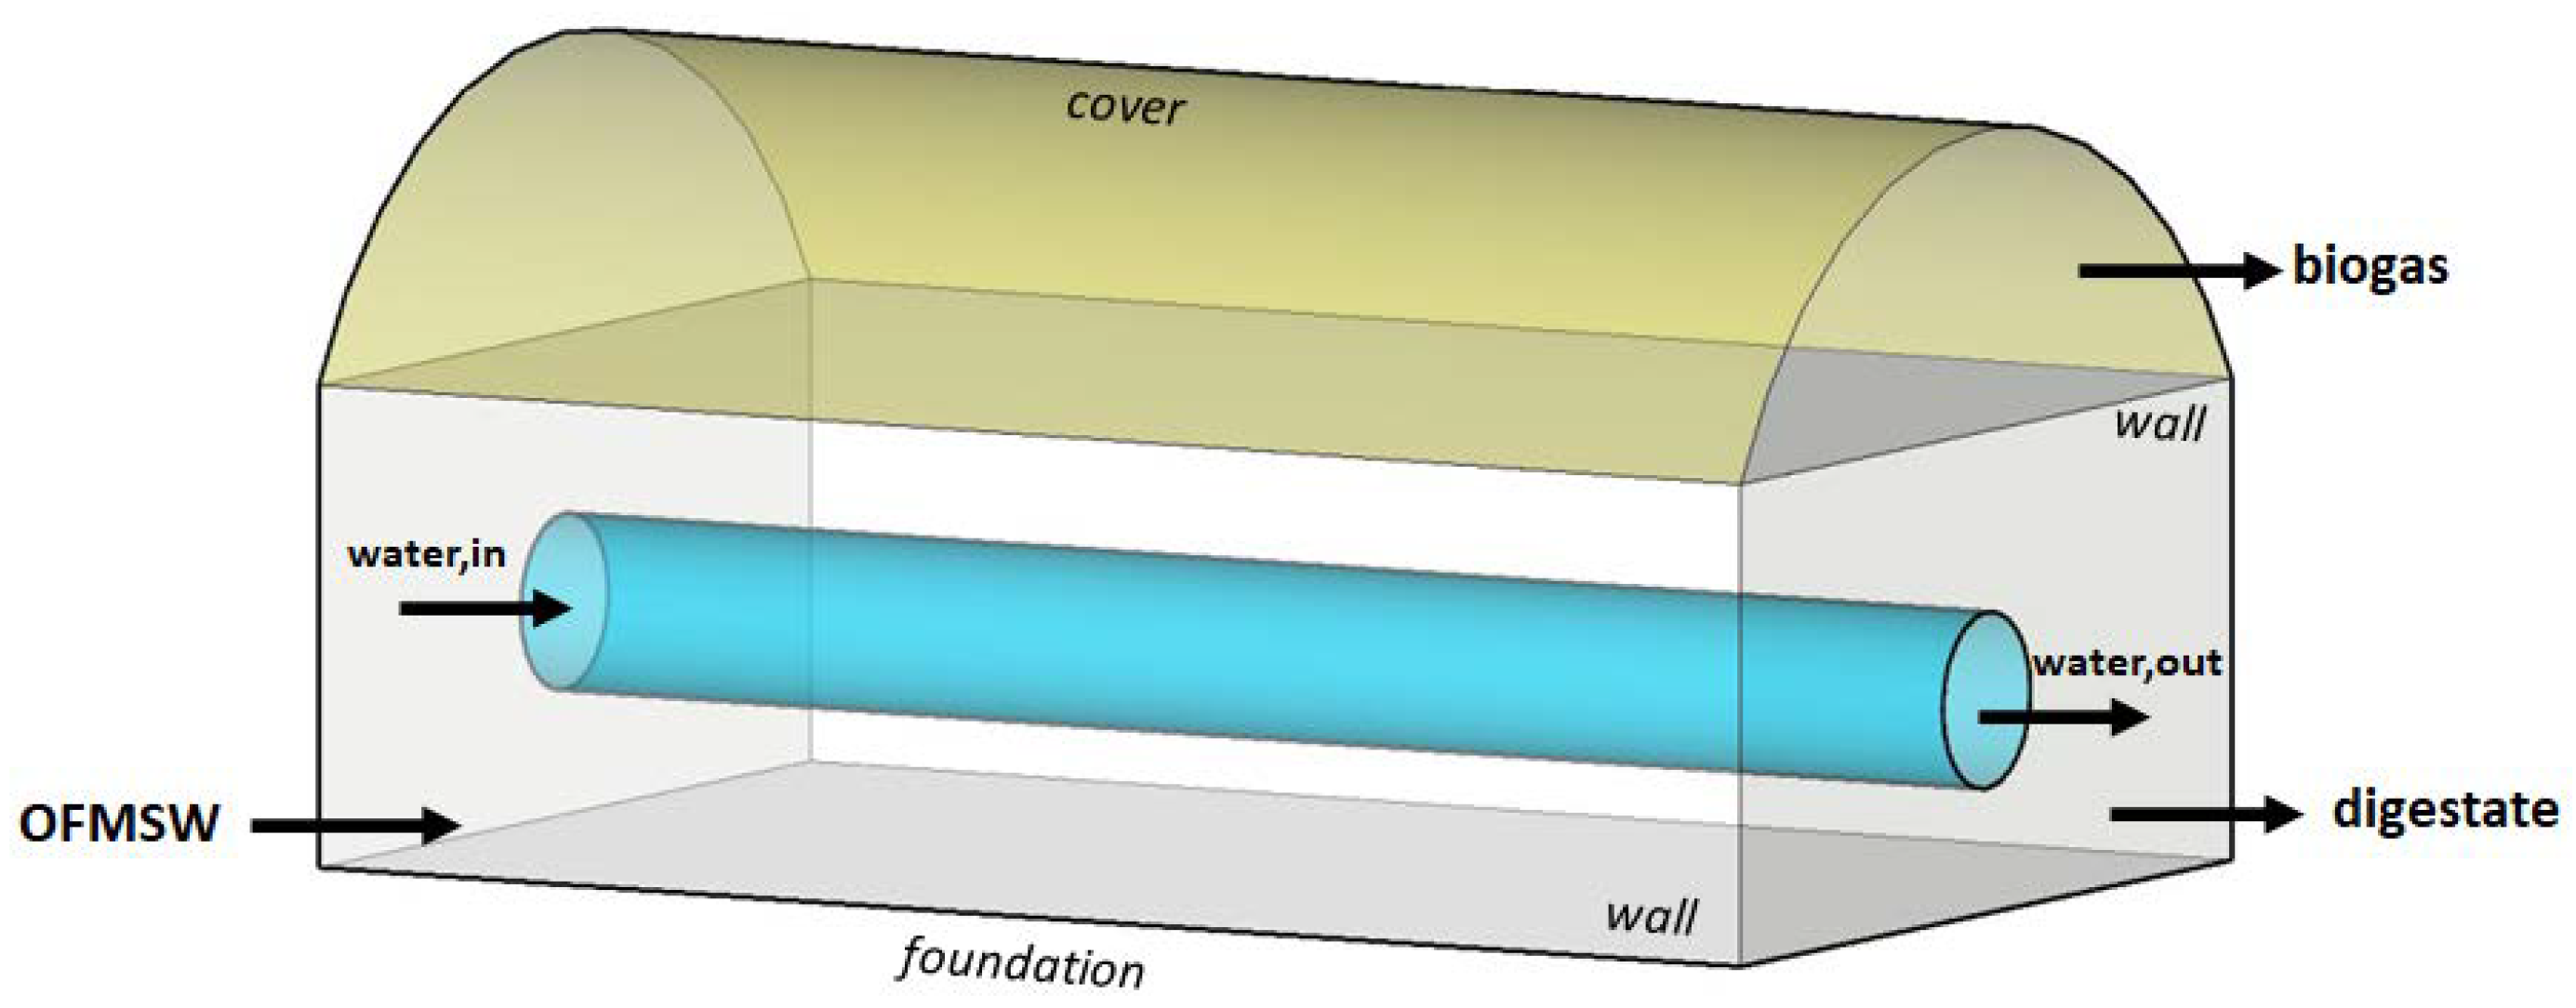
The reactor can be represented by means of the following scheme in
Figure 1:
The first equation is the energy balance equation of the digester:
in which the biogas and digester temperature are assumed to be equal to the output OFMSW temperature.
The thermal flow rate loss of the digester is equal to
The three terms of Equation (3) are the thermal flow rate loss through the digester cover, lateral walls, and foundation, respectively. Assuming that the digester temperature is equal to the mean waste temperature
, Equation (3) becomes
The global heat transmission coefficients
are calculated considering components and thermophysical parameters that will be discussed in the following section:
where
is the sum of the conductive thermal resistances calculated as the ratio of the thickness of the various digester walls’ layers
and their thermal conductivity
.
is the convective coefficient between the digester walls’ internal surface and the OFMSW, in the case of
and
, or the biogas, in the case of
.
is the convective coefficient between the digester walls external surface and the environment, in the case of
and
, or the ground, in the case of
.
For the calculation of , the convective heat exchange resistance along the internal digester walls was neglected since the OFMSW is a predominantly solid substrate. The digester foundation transmittance was calculated neglecting the convective thermal resistance that occurs along the surface in contact with the OFMSW and the ground.
An additional equation (to be coupled with Equation (2)) is required to complete the system of equations. This equation can be obtained by the energy balance on the reactor heat exchanger:
Neglecting the thermal resistance between OFMSW and tube walls and assuming constant the OFMSW temperature,
can be calculated as follows:
where the convection coefficient along the internal side of the pipe
was calculated with the following equation [
40]:
where
is the pipe nominal diameter and
is the Nusselt number calculated with Dittus–Boelter correlation [
40].
2.3. Thermal–Biological Model
Since the reactor considered is a PFR, the input substrate undergoes the anaerobic process while moving along the digester. Therefore, the components concentrations change in the flow direction, as well as in time. In the proposed model, Equations (1), (2) and (6) were discretized with respect to time and space.
In this way, in space, the digester was supposed to be constituted by several CSTRs connected in series [
31], each by means of mass balances. The ADM1 model was solved for each CSTR where the output of the first one corresponds to the inlet conditions of the following one, and so on.
For the first time step, the input conditions were fixed according to the substrate characteristics entering the reactor. The value of
Cp at the inlet of the reactor is assumed to be equal to the one of the OFMSW, whereas the output biomass is supposed to be digestate, with a different value of
Cp. Both these values of specific heat are also assumed to be constant with the temperature since, in the PFR reactor, no relevant temperature gradients are expected. The inlet parameters of the biological model are summarized in
Table 3 while the stoichiometric coefficients, kinetic parameters, and rates have been assumed equal to the ones reported in a previous work of the authors (
Table 4 in [
27]).
Assuming that the digester is in thermodynamic equilibrium with the ambient before the heating, the ambient temperature is assumed as an initial condition for the biomass. The biogas flow rate and the digestate flow rate—the latter calculated as the difference between biomass and biogas flow rates—are obtained from the biological model. Once the flow rates are known, the waste temperature can be obtained by means of the digester thermal balance and the water temperature by the HE thermal balance.
For the following time steps, the procedure is repeated but the input substrate characteristics of each CSTR will correspond to the output ones by the same in the preceding dt.
4. Results
The simulation was carried out for a time span of 60 days, using a time step of 1.5 min and a mesh with spacing of 0.1 m.
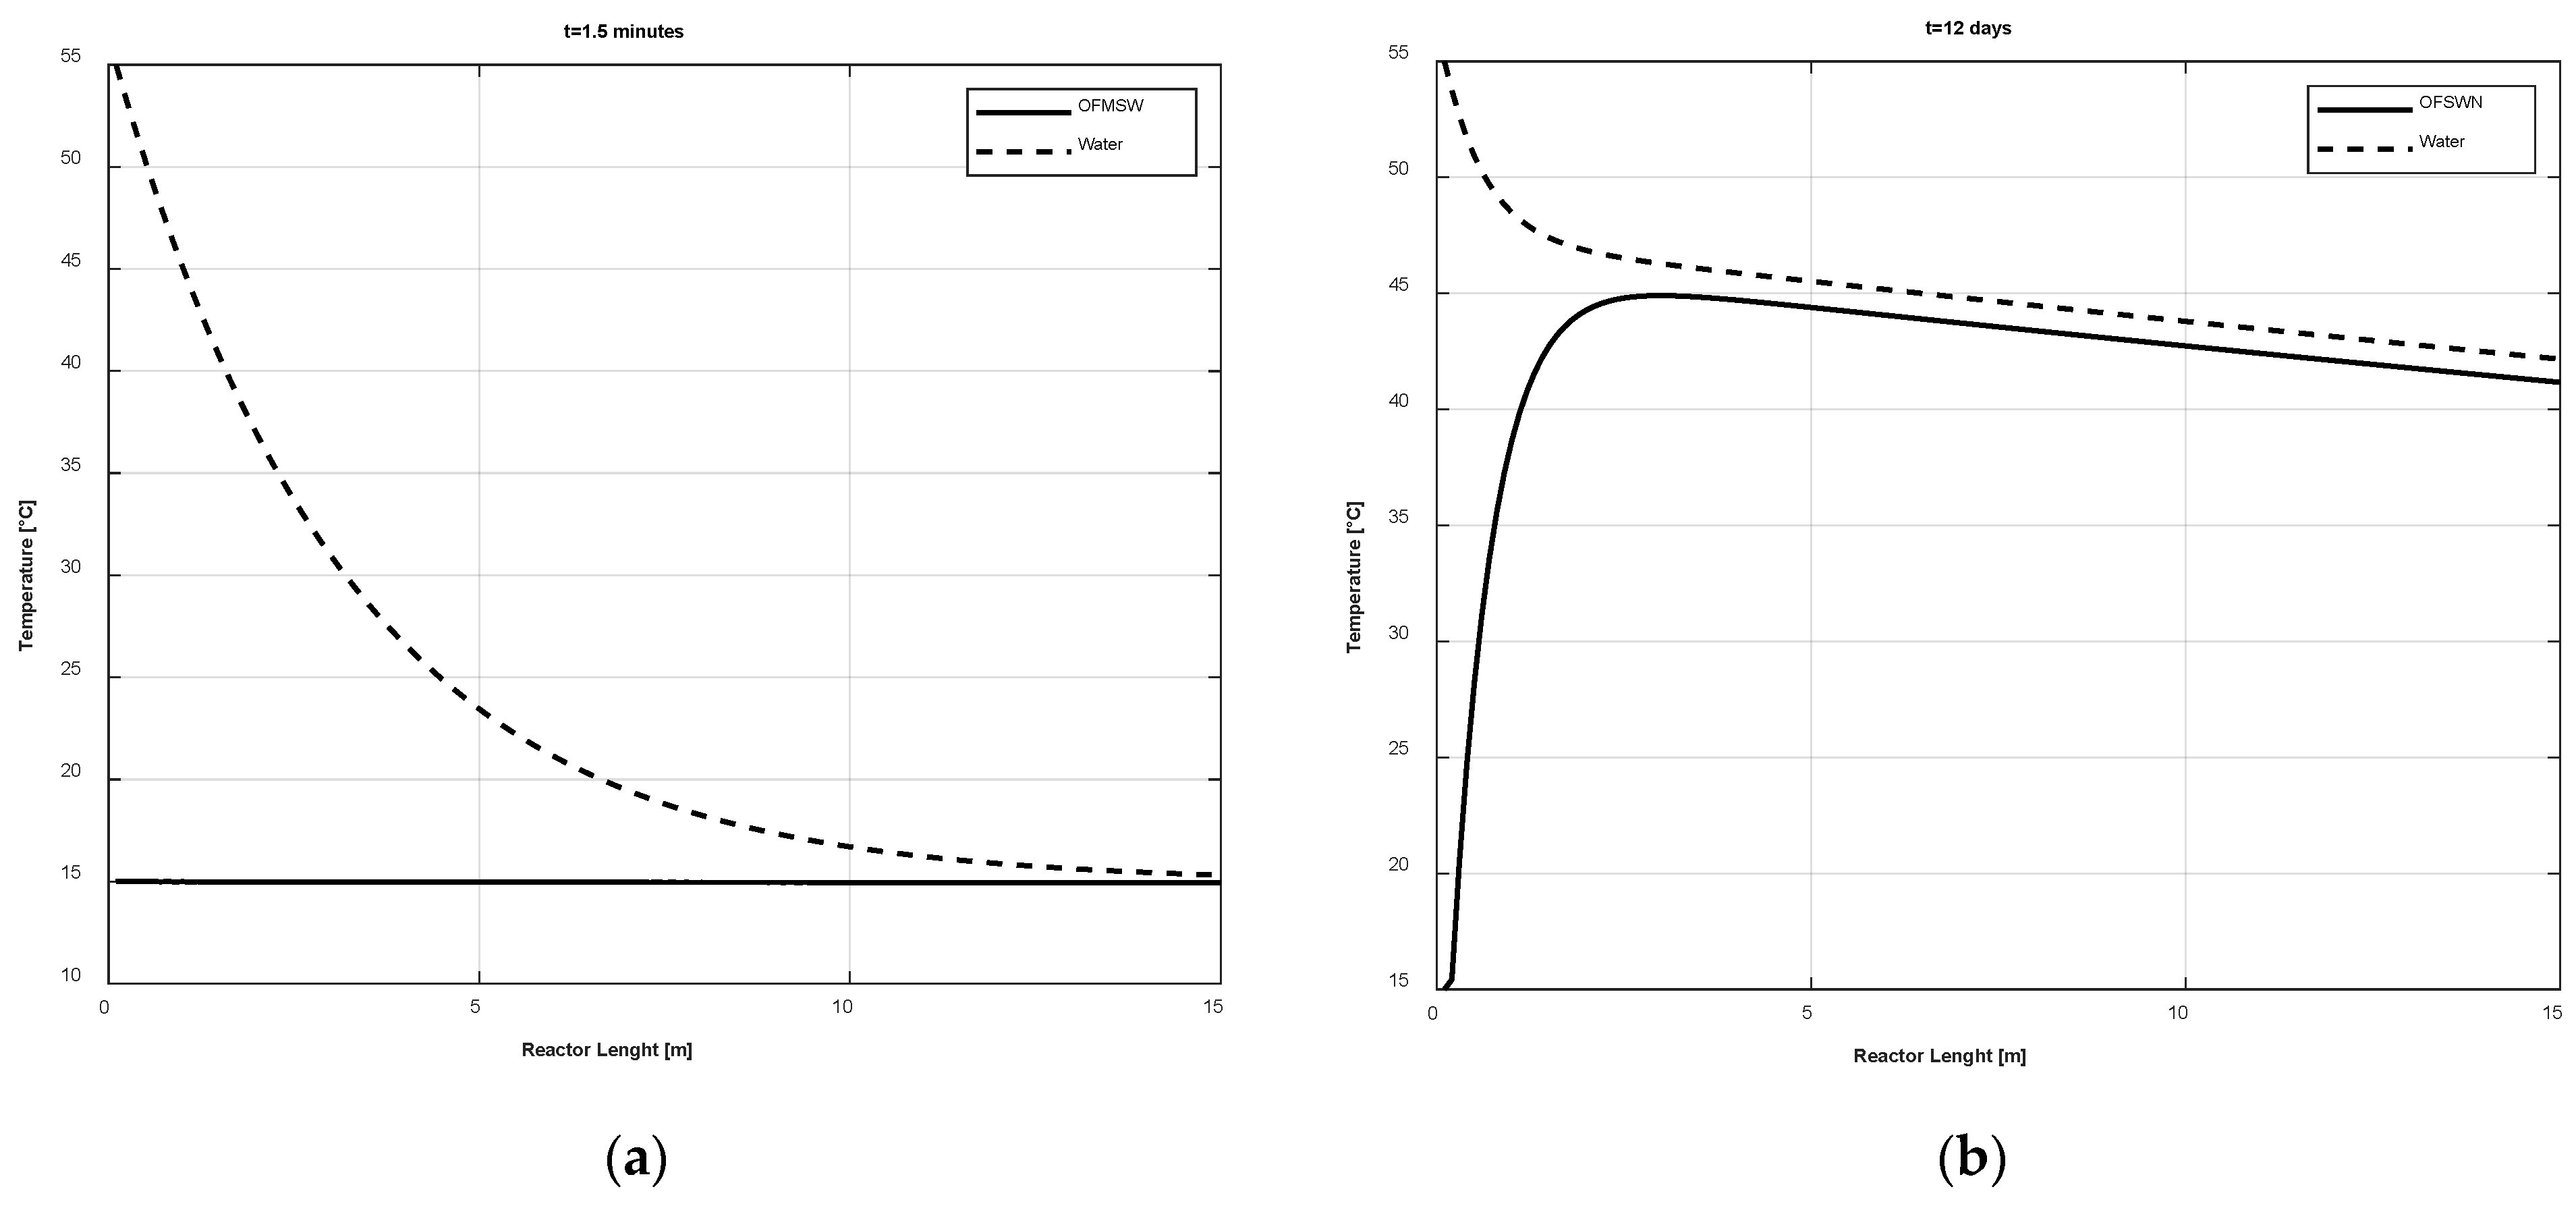
Figure 2 reports the trend of output OFMSW and output water temperature in two different simulation times:
Figure 2a shows the 1-D temperature profile along the reactor at
, while
Figure 2b shows the same temperatures after 12 days. Note that the trend reported in
Figure 2 represents a stationary condition achieved by the digester. In other words, after 12 days, the 1-D temperature profile does not change as a function of time. As expected at 1.5 min, the OFMSW temperature is almost constant along the reactor since the thermal inertia of the mass included in the digester is so high that it takes a long time to heat the mass included in the system. Conversely, at 12 days, a nonmonotonic trend is detected. This is due to the fact that in the first part of the reactor, the temperature of OFMSW sharply increases due to internal heat exchanger. Then, a slight decrease in the OFMSW temperature is detected due to the parallel flow configuration of the heat exchanger, determining a decreasing trend in the temperature of the hot water.
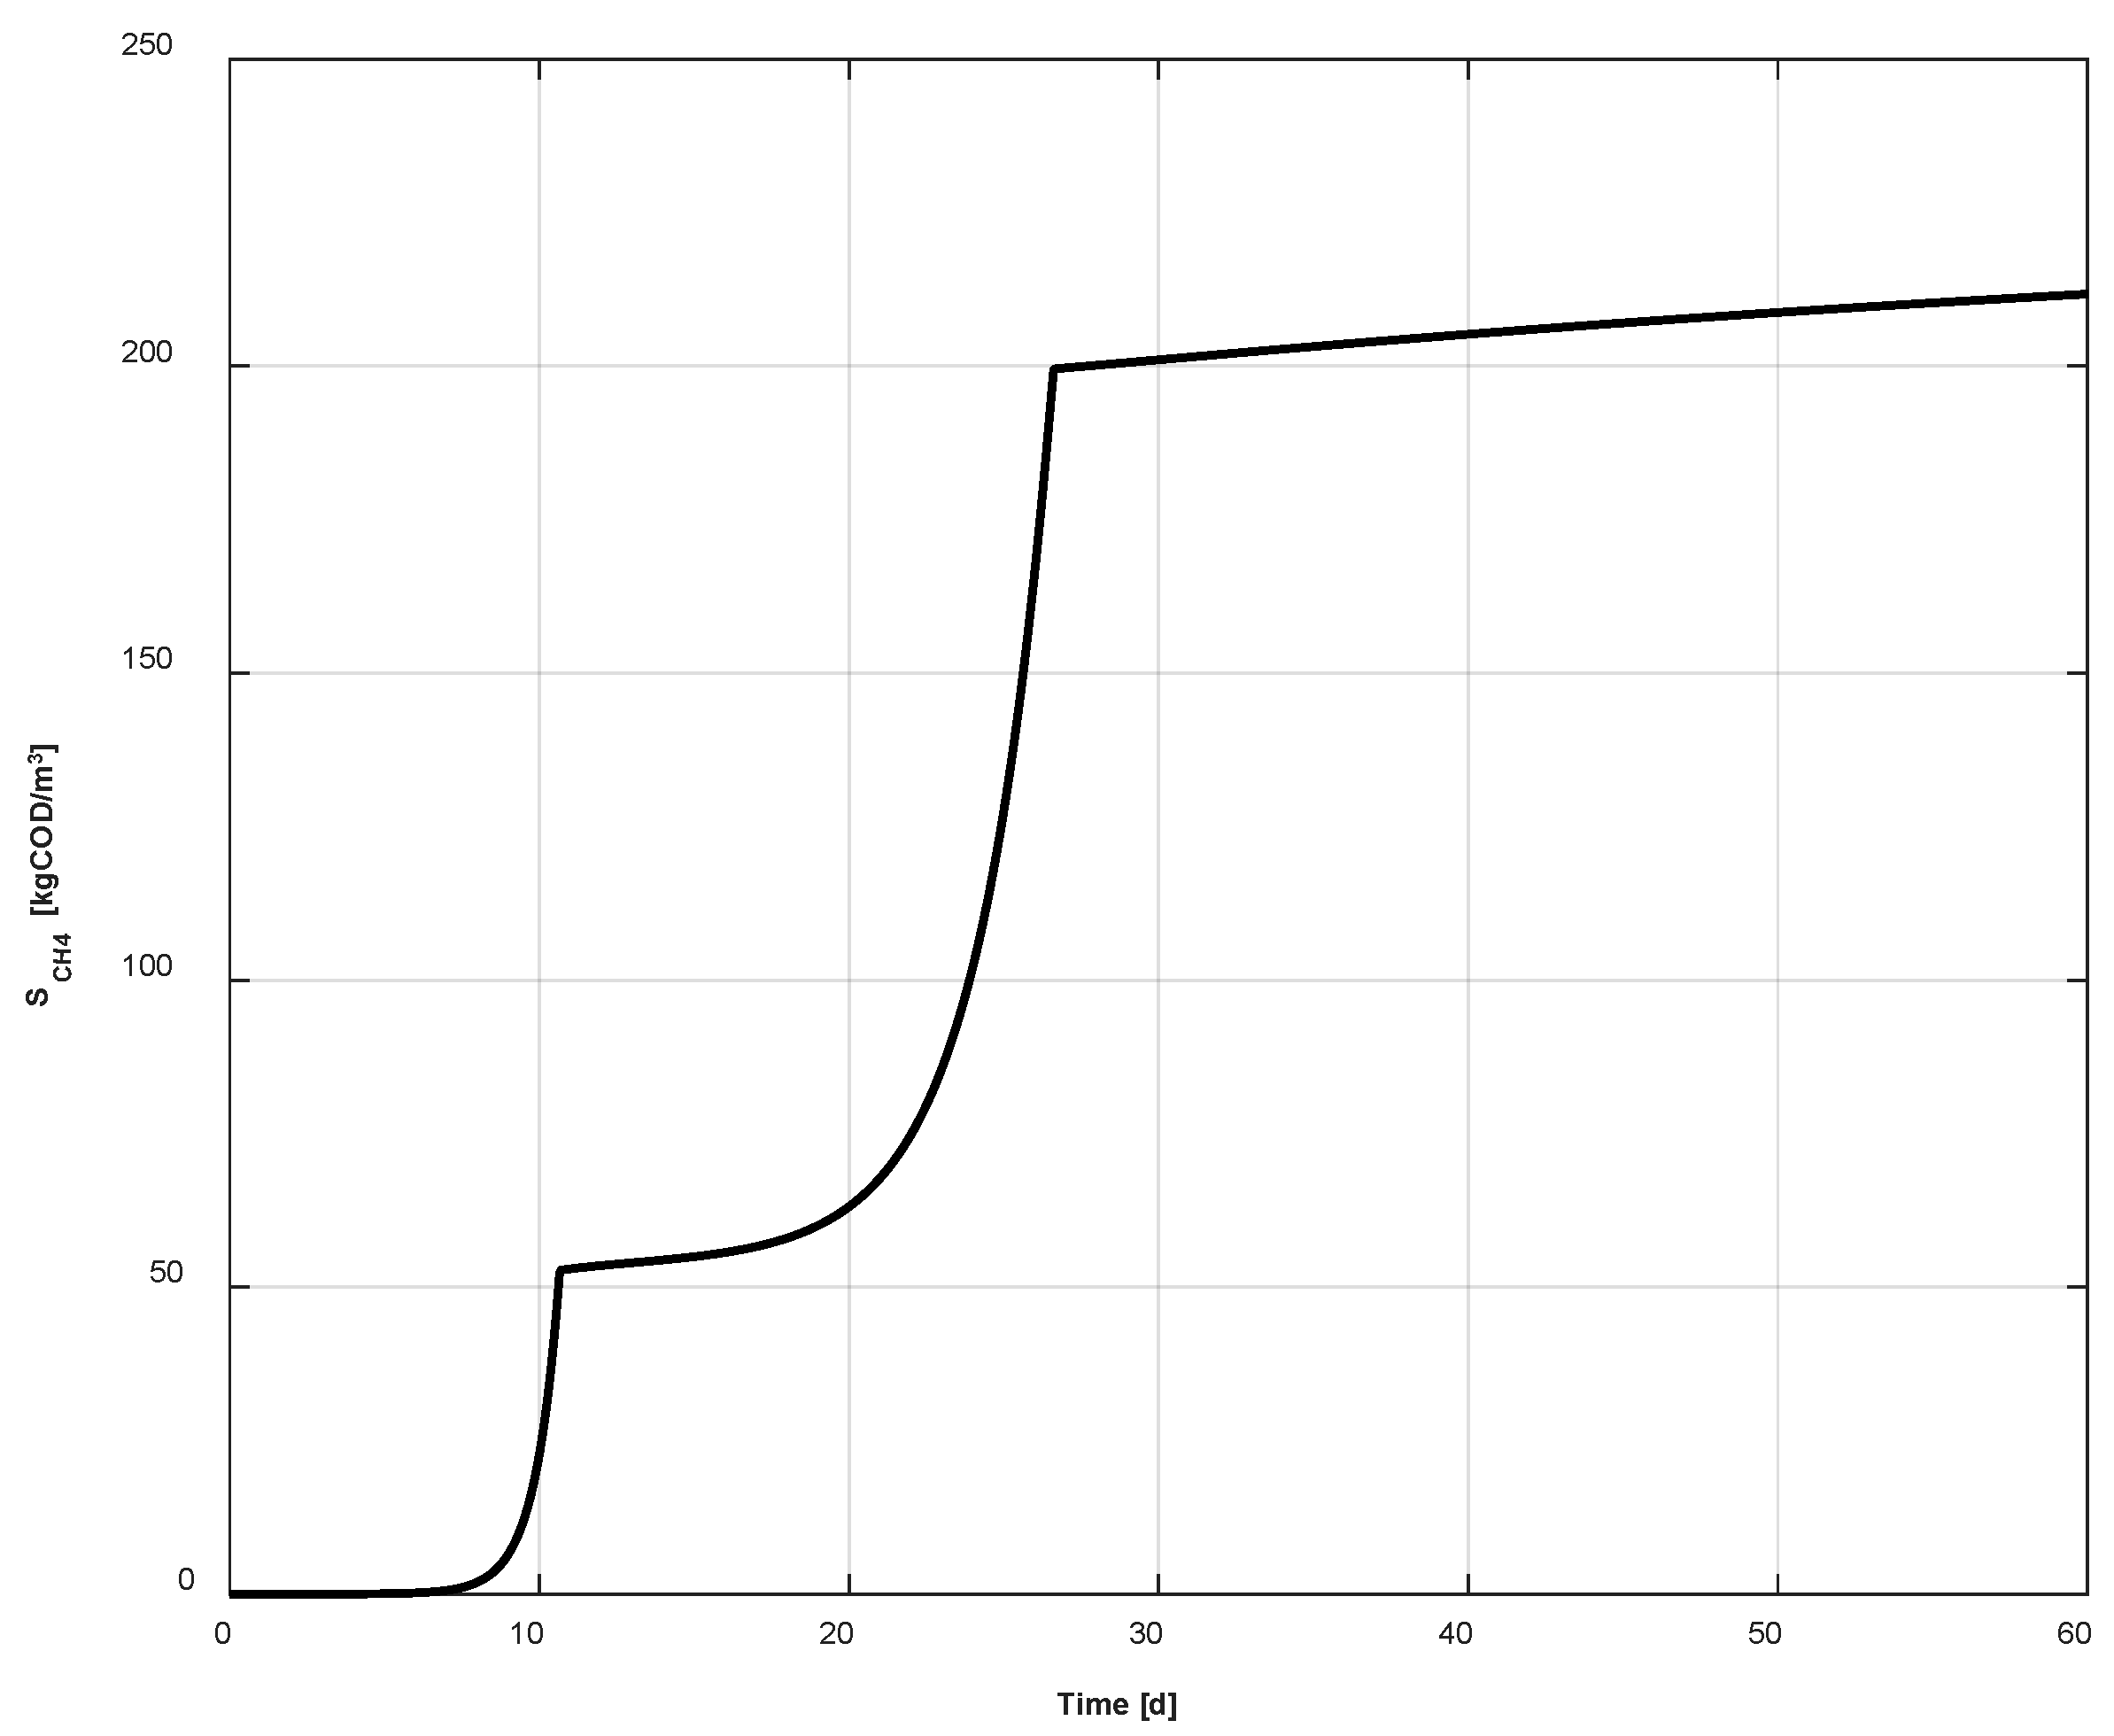
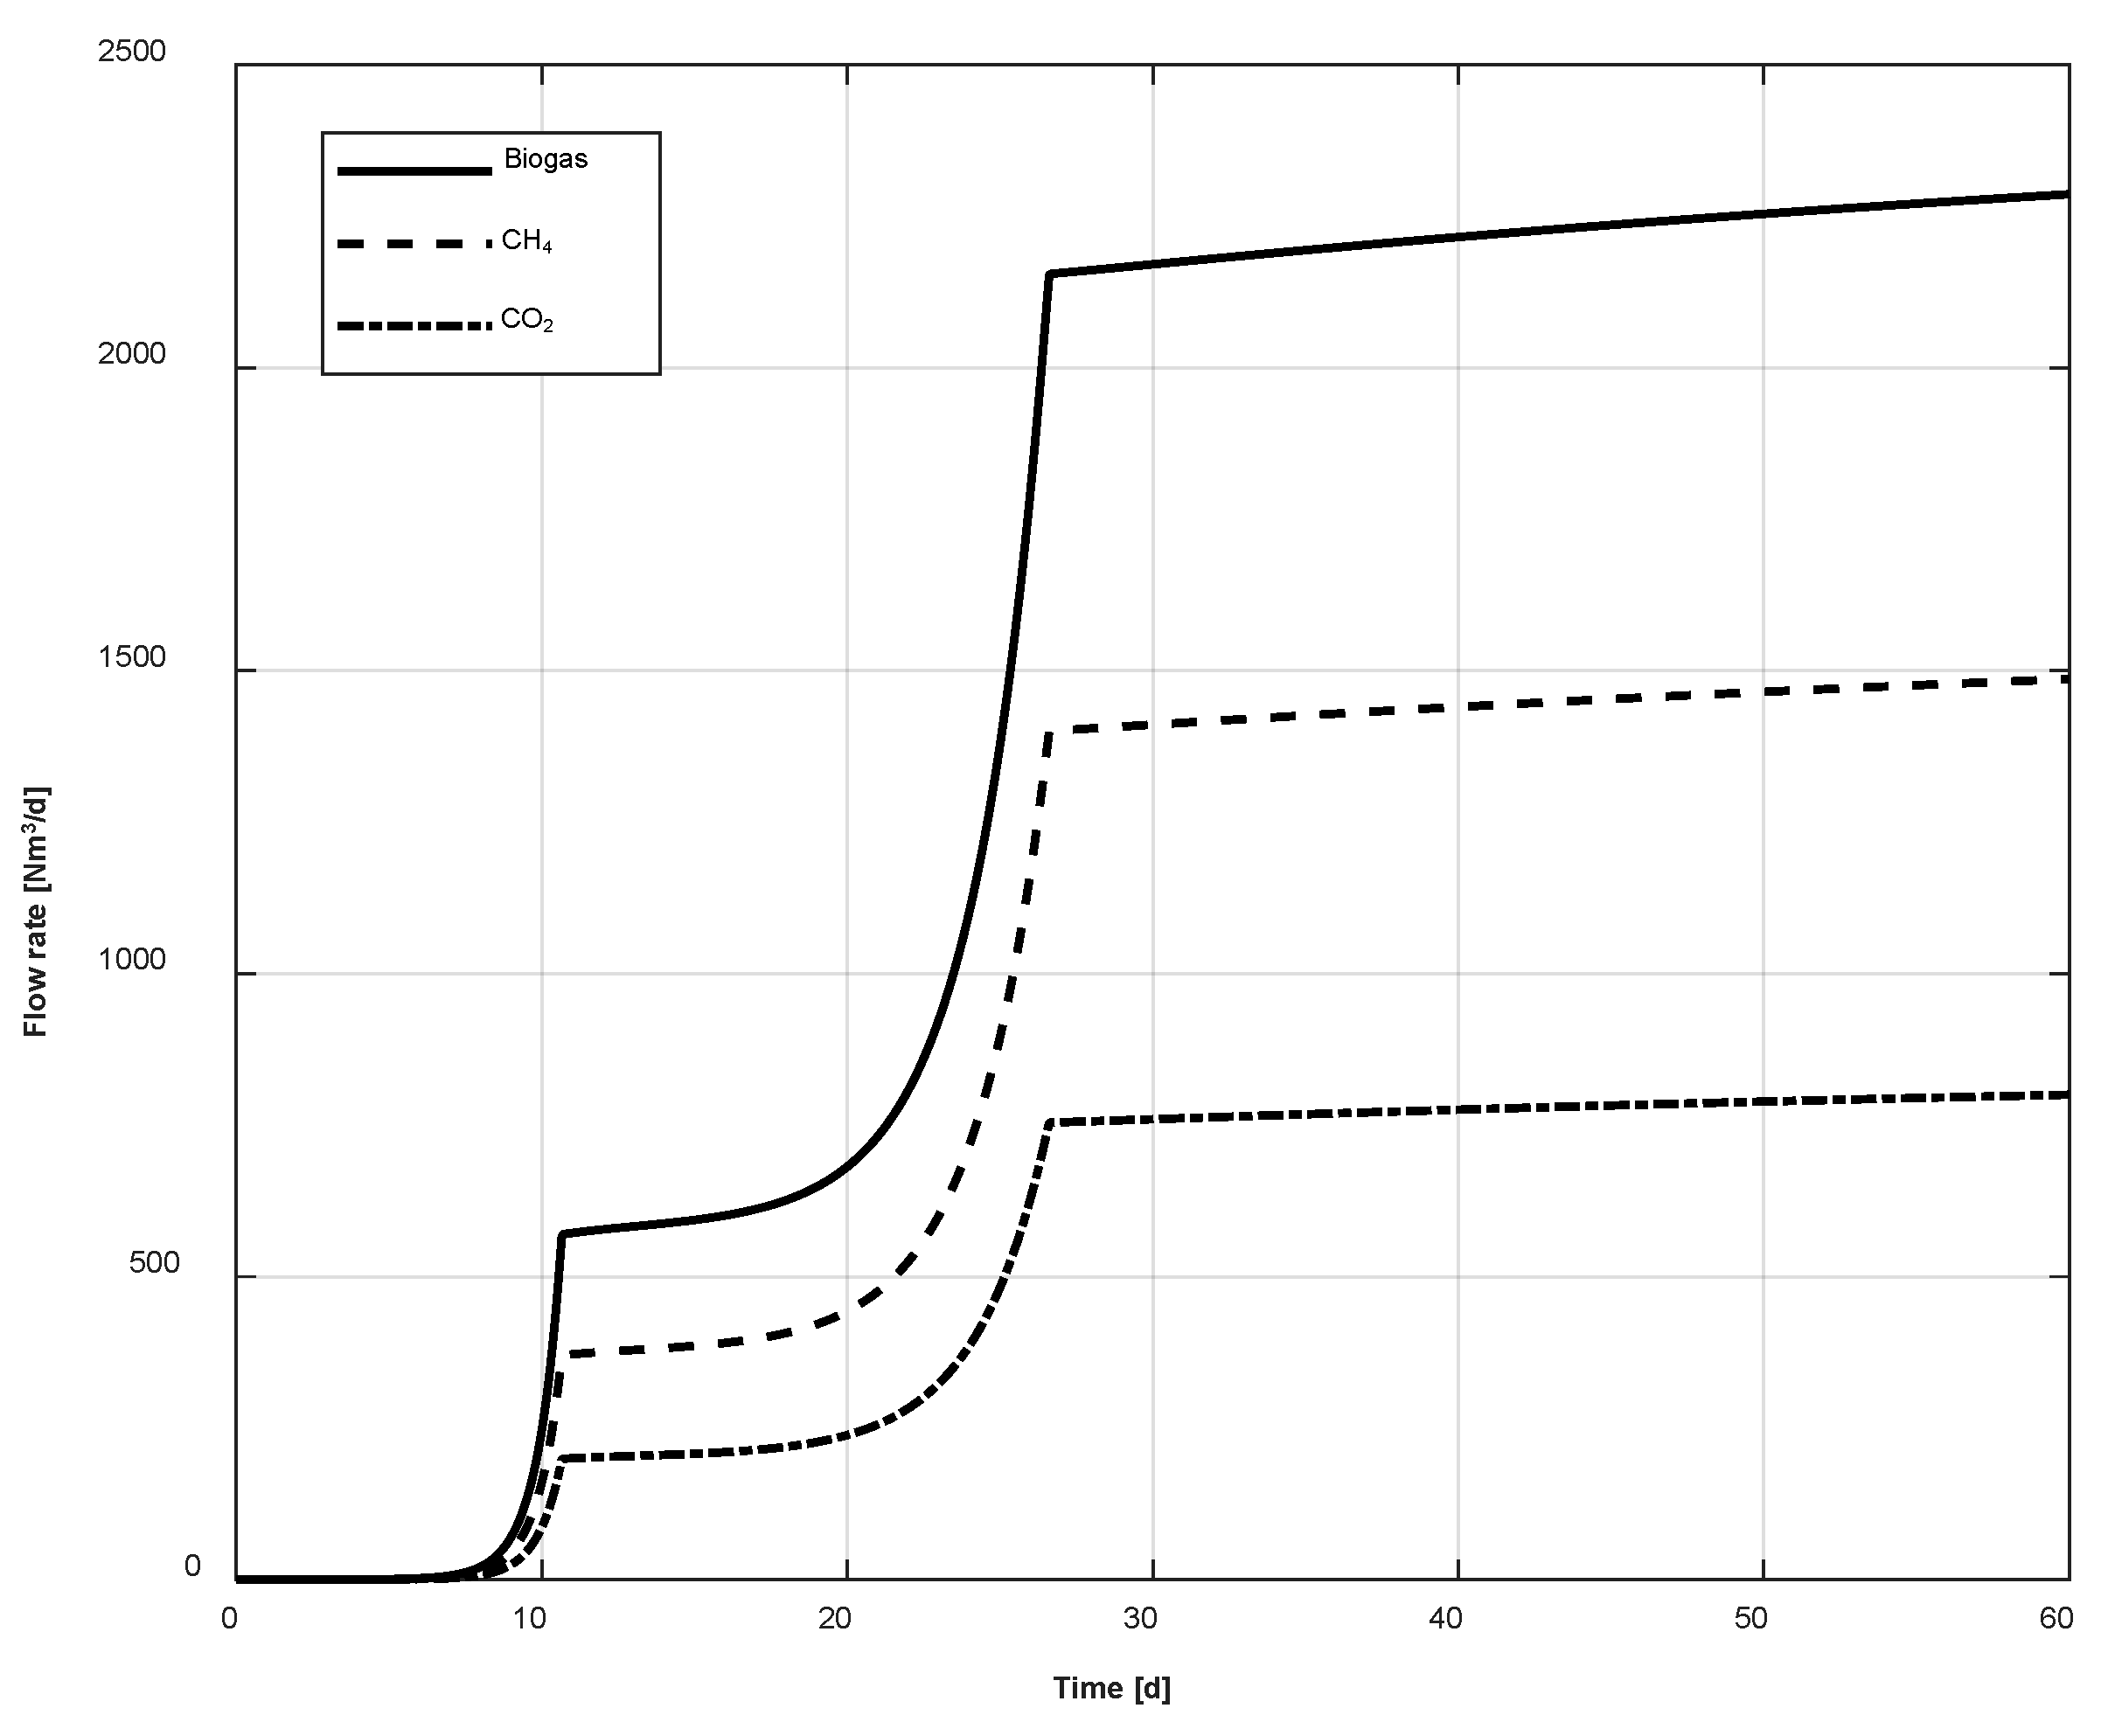
The total flow rate of biogas is estimated assuming that the biogas mixture includes 65% of CH
4 and 35% of CO
2.
Figure 3 shows the trend of the concentration of the methane at the last slice of 1-D discretization of the PFR. The double exponential trend is due to two bacteria families responsible for the production of methane.
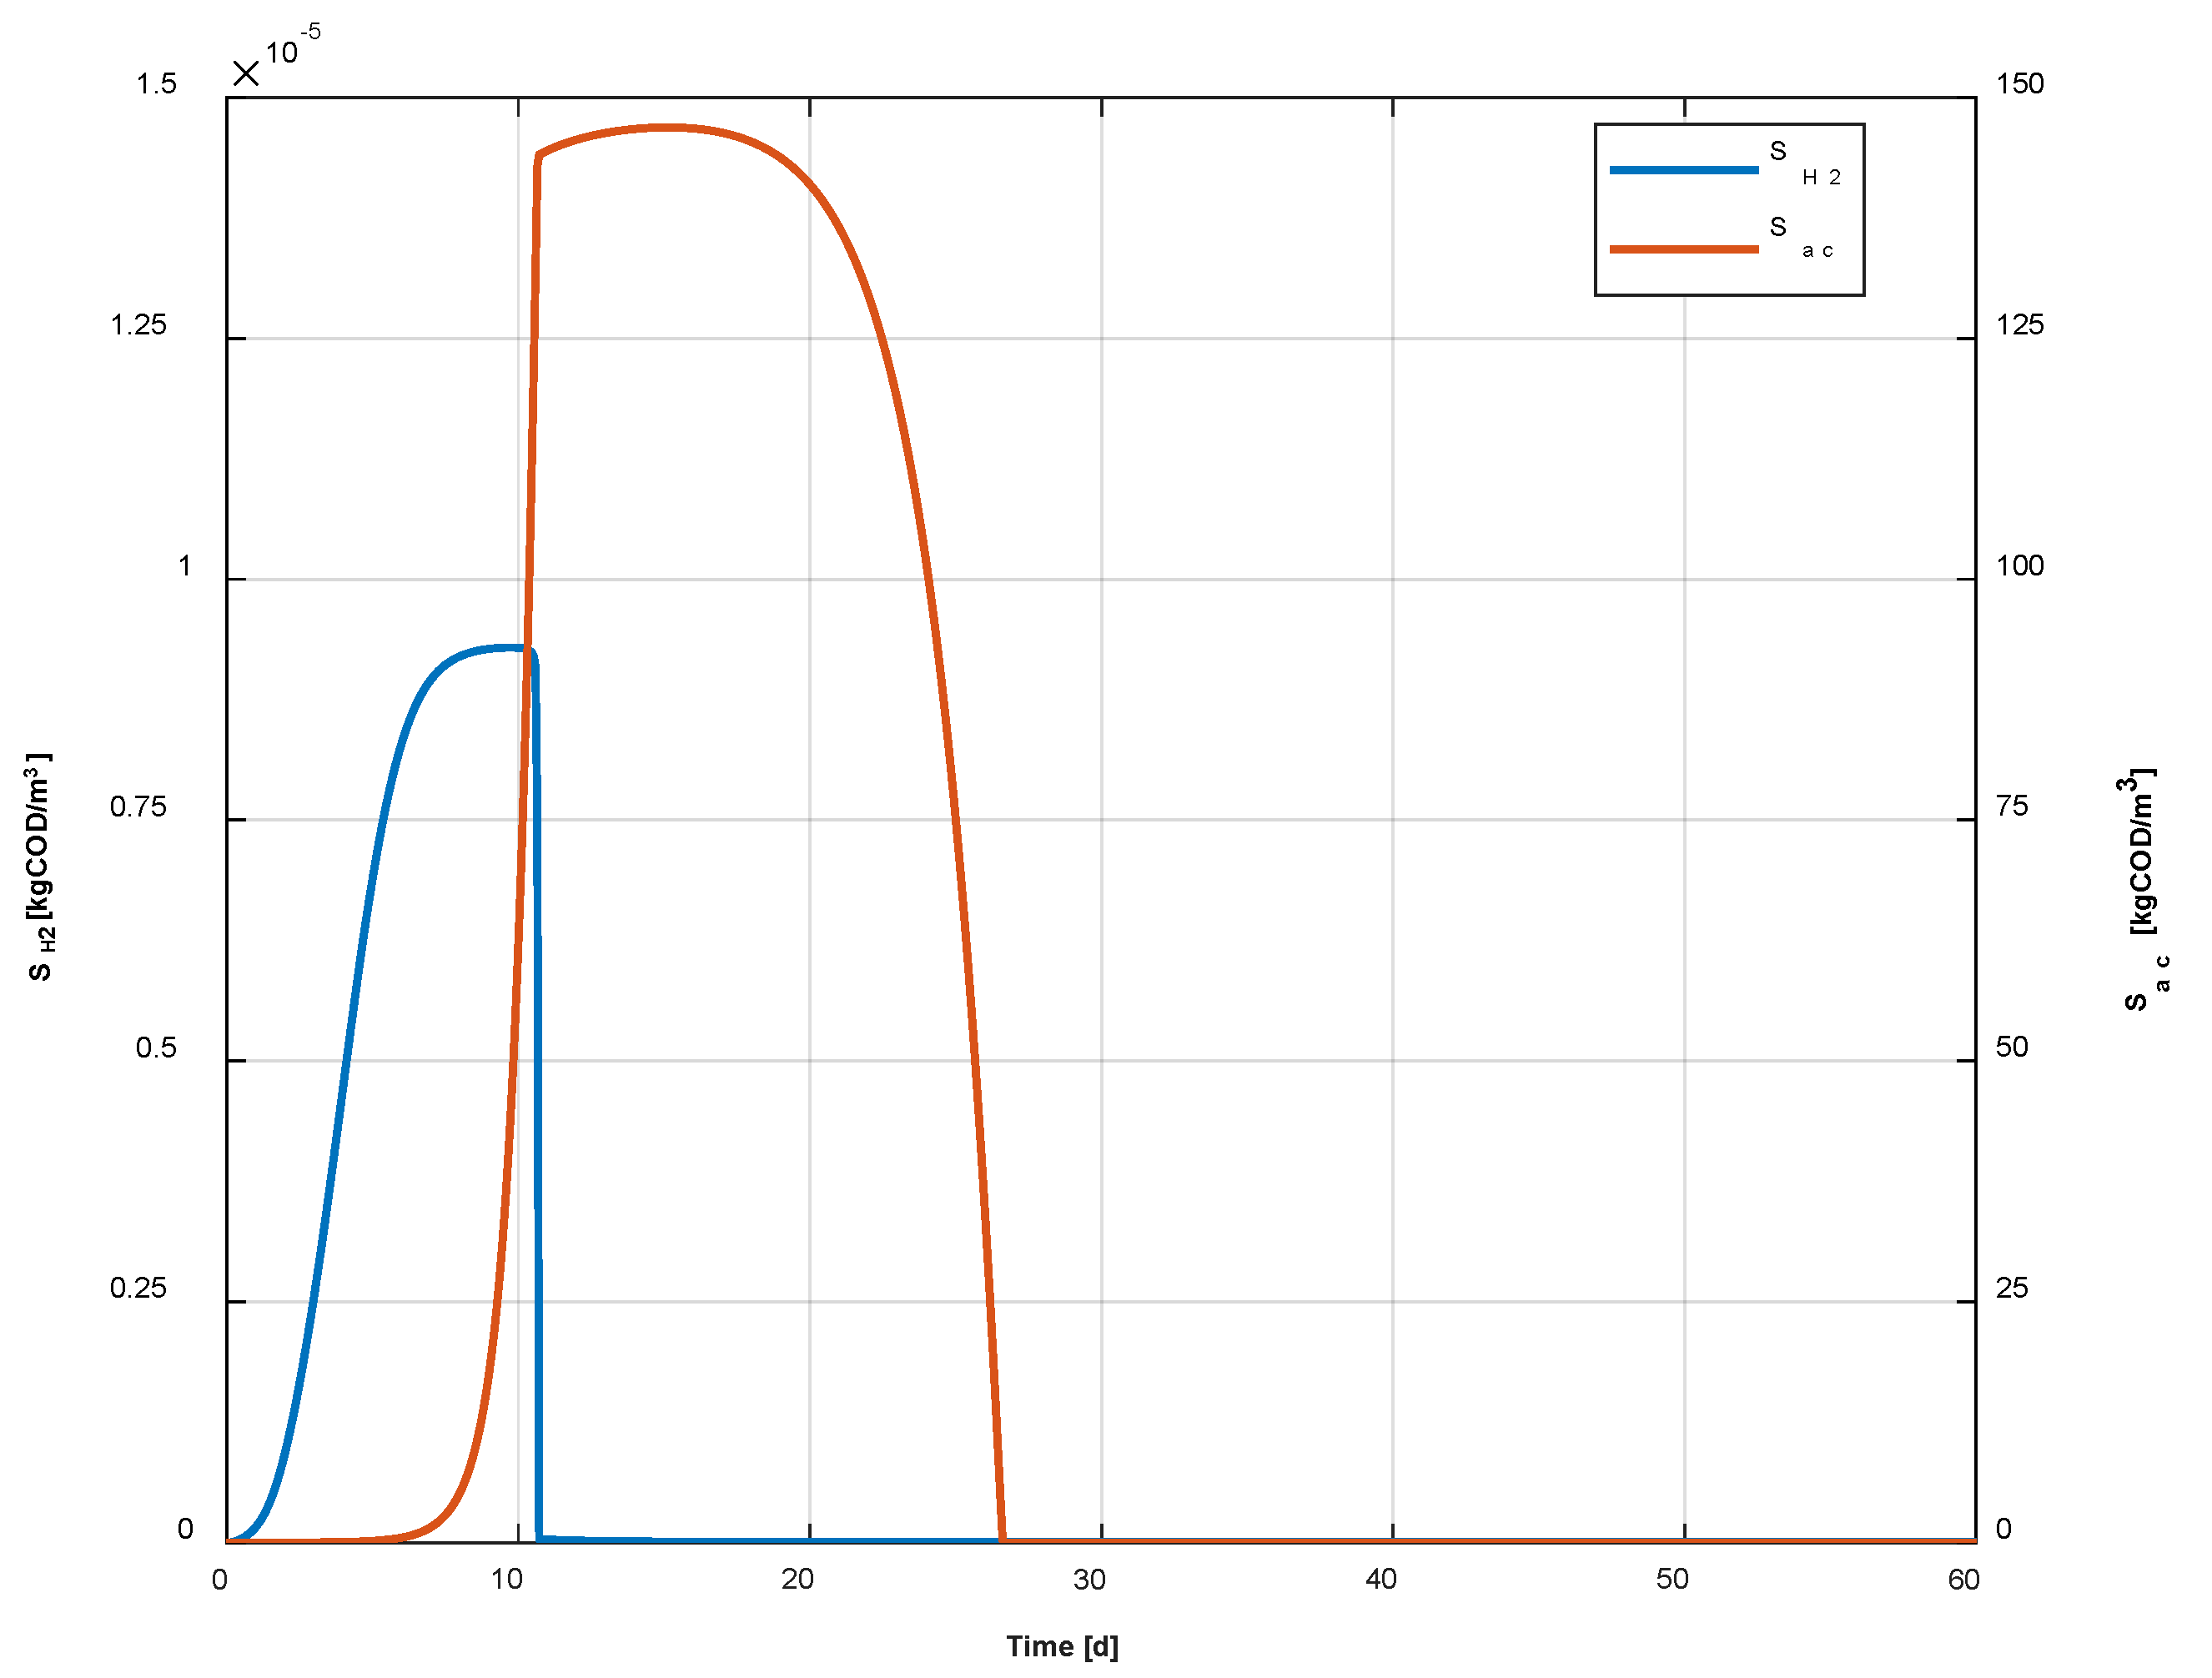
Figure 4 proves that the hydrogenotrophic methanogenesis firstly occurs. In fact, hydrogen begins to rapidly decrease after 10 days (
SH2,
Figure 4), when the biomethane production exhibits an exponential trend (
SCH4,
Figure 4). The second exponential trend is linked to acetate consumption, which is much more consistent in terms of quantity. This process ends after roughly 25 days of process, after which the waste is stabilized and biomethane production stops.
The biogas produced, shown in
Figure 5, follows, as expected, the trend of
SCH4.
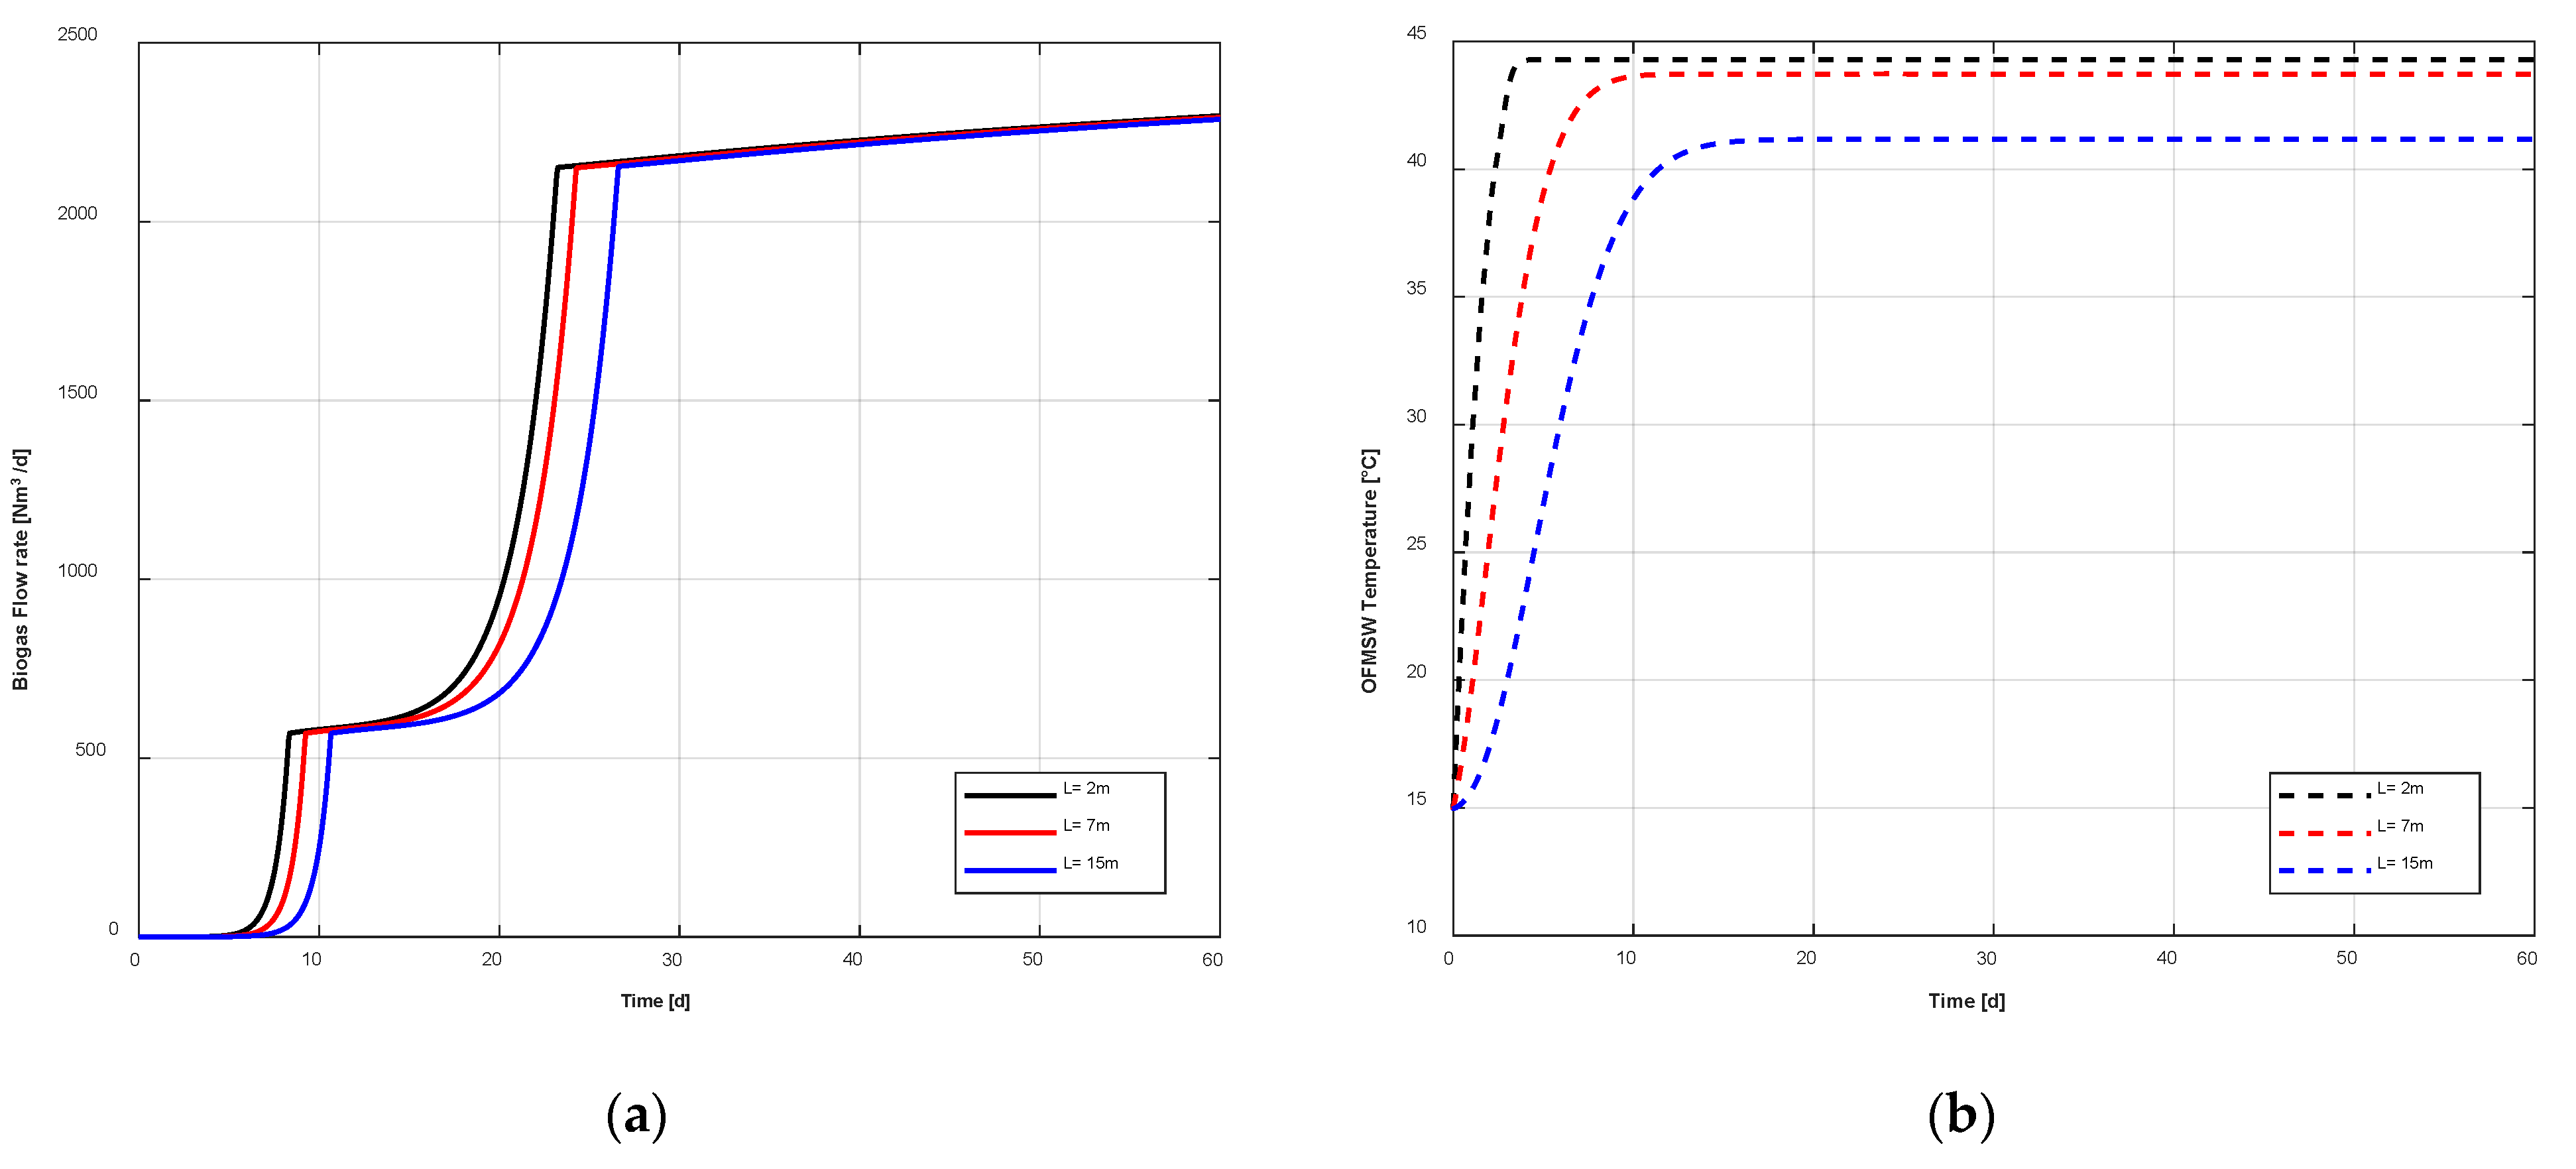
Biogas production along the PFR is roughly constant, as shown in
Figure 6a. For advanced slices of PFR, the beginning of the biomethane production and of the exponential phase is forwardly shifted from the time point of view. The output waste temperature, which varies from slice to slice in the PFR, is one of the most important parameters of the biological model, affecting the metabolic activity of bacteria into the digester. The higher the temperature, the faster the development of the biological model, see
Figure 6a,b.
The exponential trend begin is timely shifted considering adjacent digester slices, i.e., computational nodes, the start of the exponential trend is delayed for the computational node located in advance (
Figure 6a). This trend is due to the fact that the temperature rises more rapidly for the inlet nodes, with respect to the advanced nodes. For example, at 2 m from the PFR inlet, the digester temperature is always greater than the one at 15 m (
Figure 6b) from the inlet. In fact, the higher the digester temperature—in the mesophilic temperature range—the faster the biological processes.
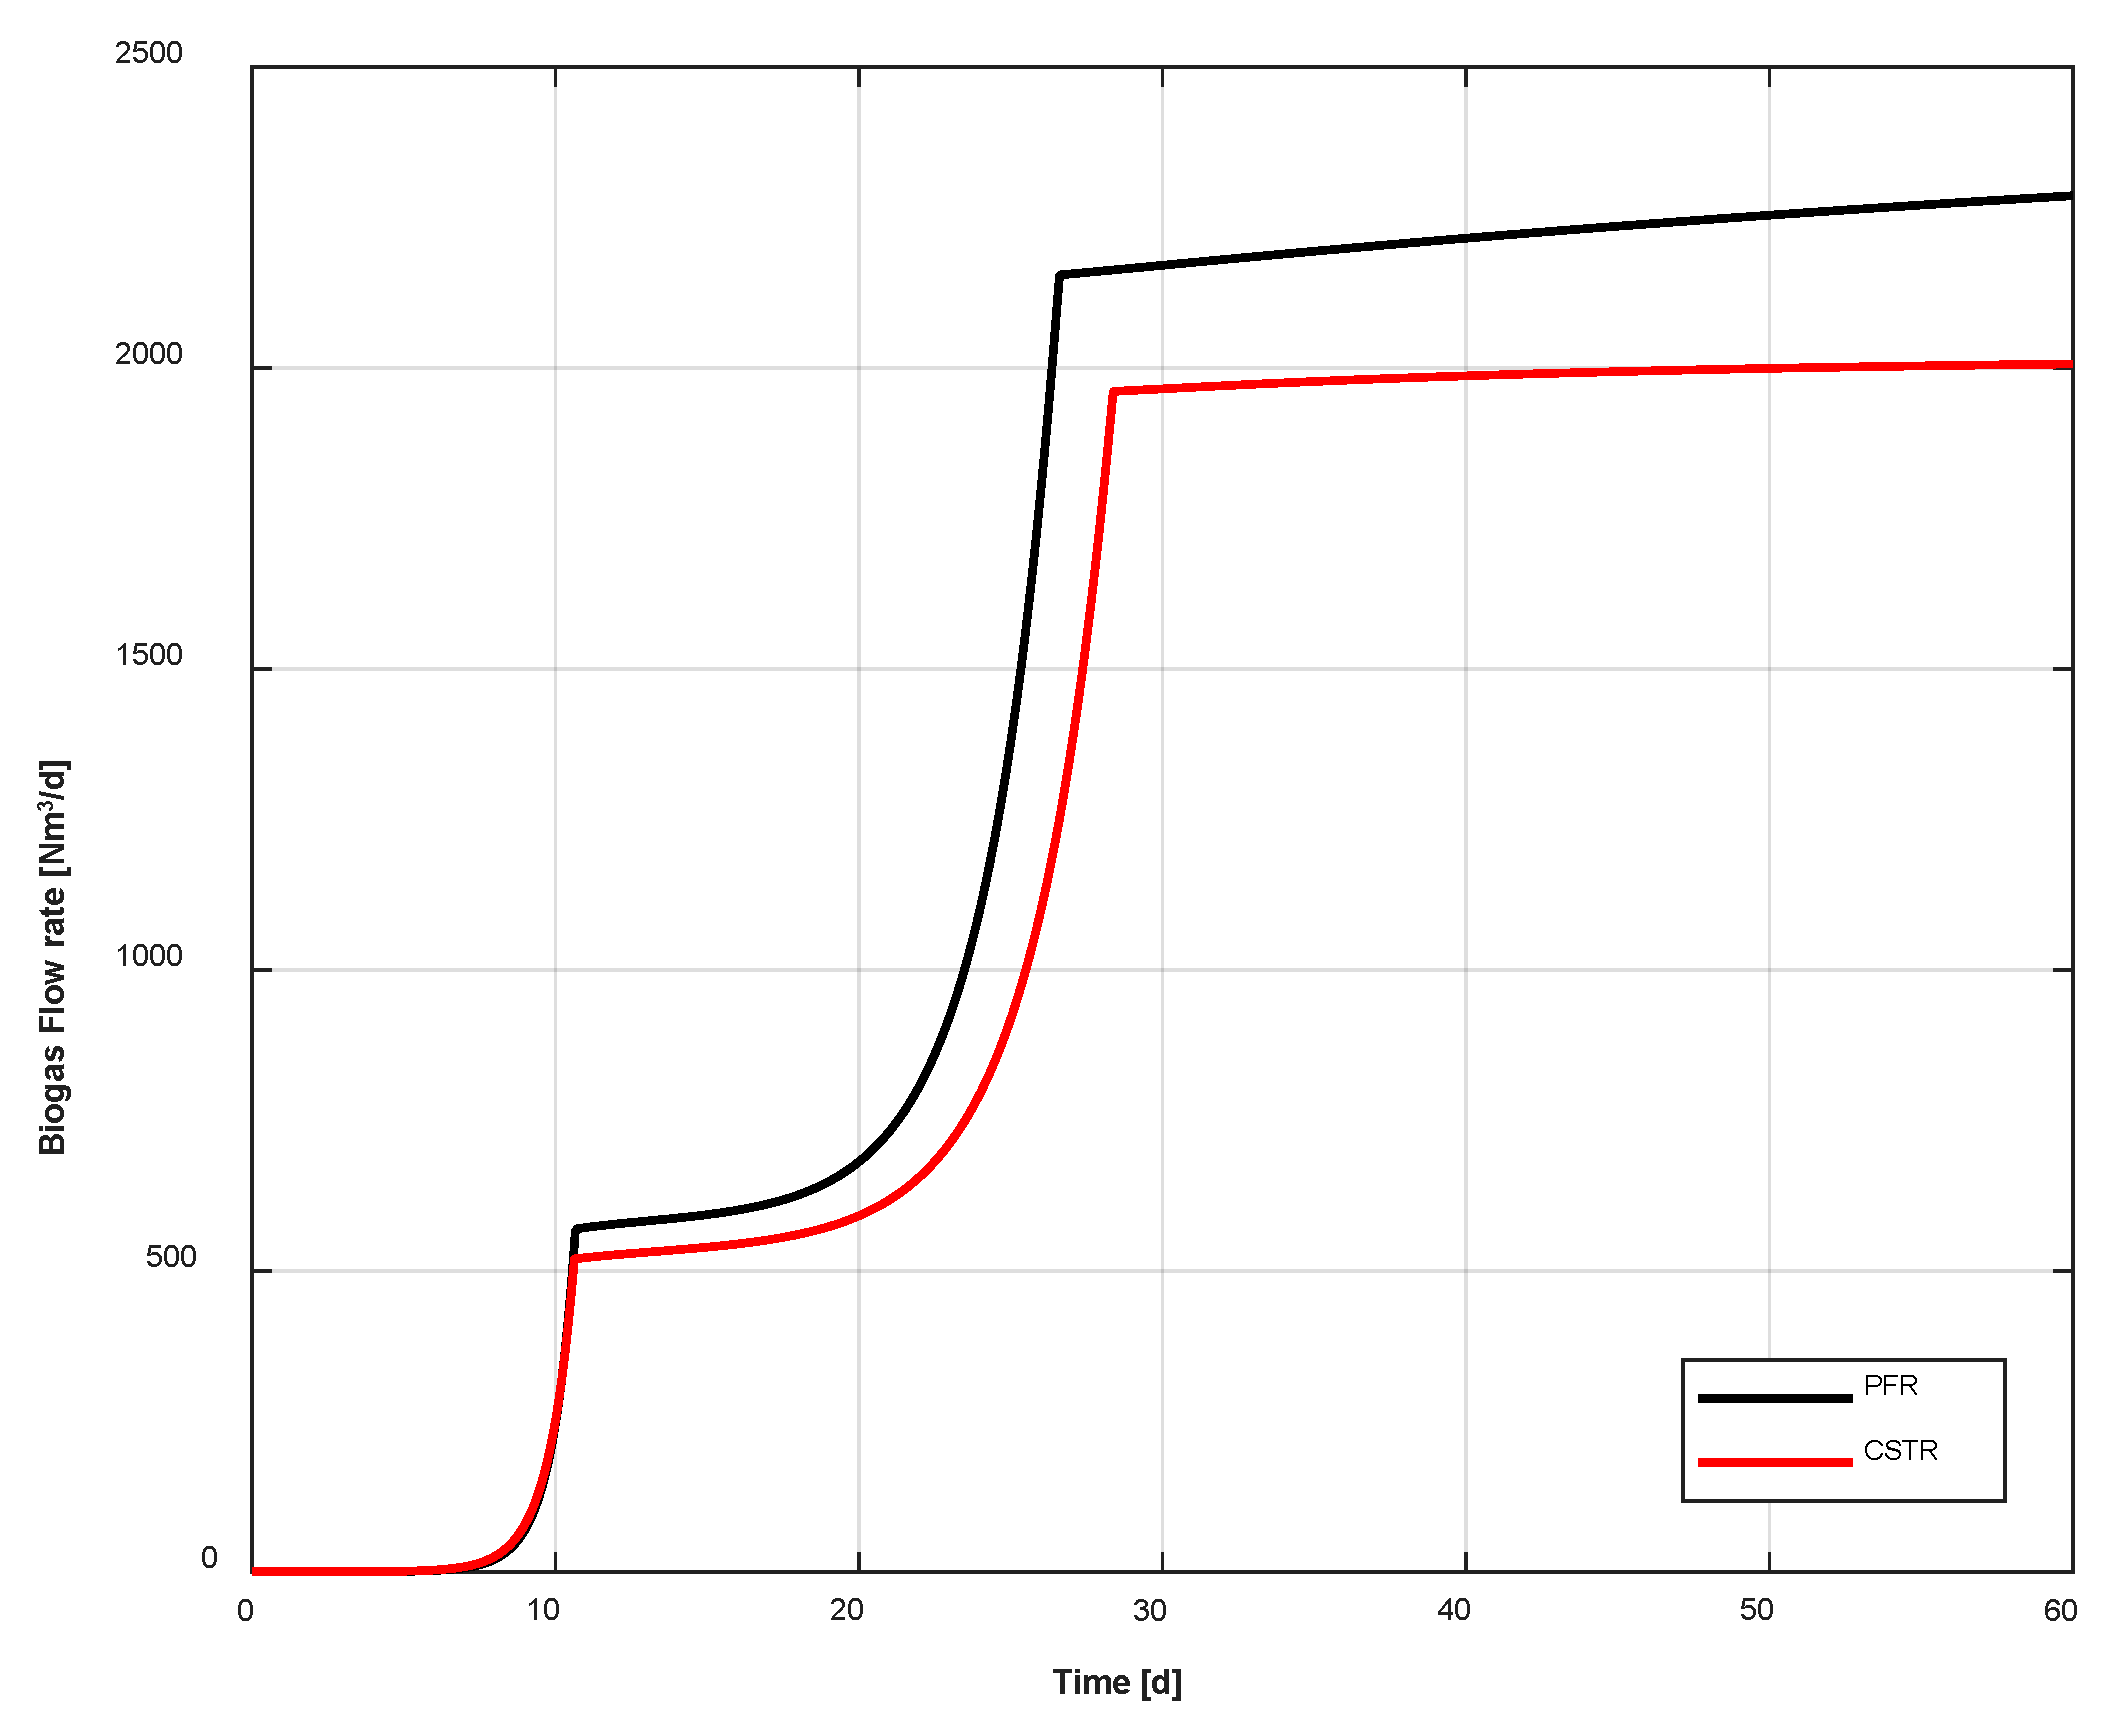
Finally, the proposed PFR model is compared with the CSTR model [
27], see
Figure 7. These two digesters are featured by the same structural characteristics and they process the same waste flow rate. The biogas flow rate production in PFR is higher than one in the CSTR, as shown in
Figure 6.
This result is mainly due to the higher slope of the temperature curve in the case of PFR, which leads to a greater amount of biogas produced in the methanogenic phase (
Figure 7). In fact, as mentioned before, the higher the digester temperature, the faster the biological processes. In addition, a higher temperature promotes the biogas production by the bacteria.
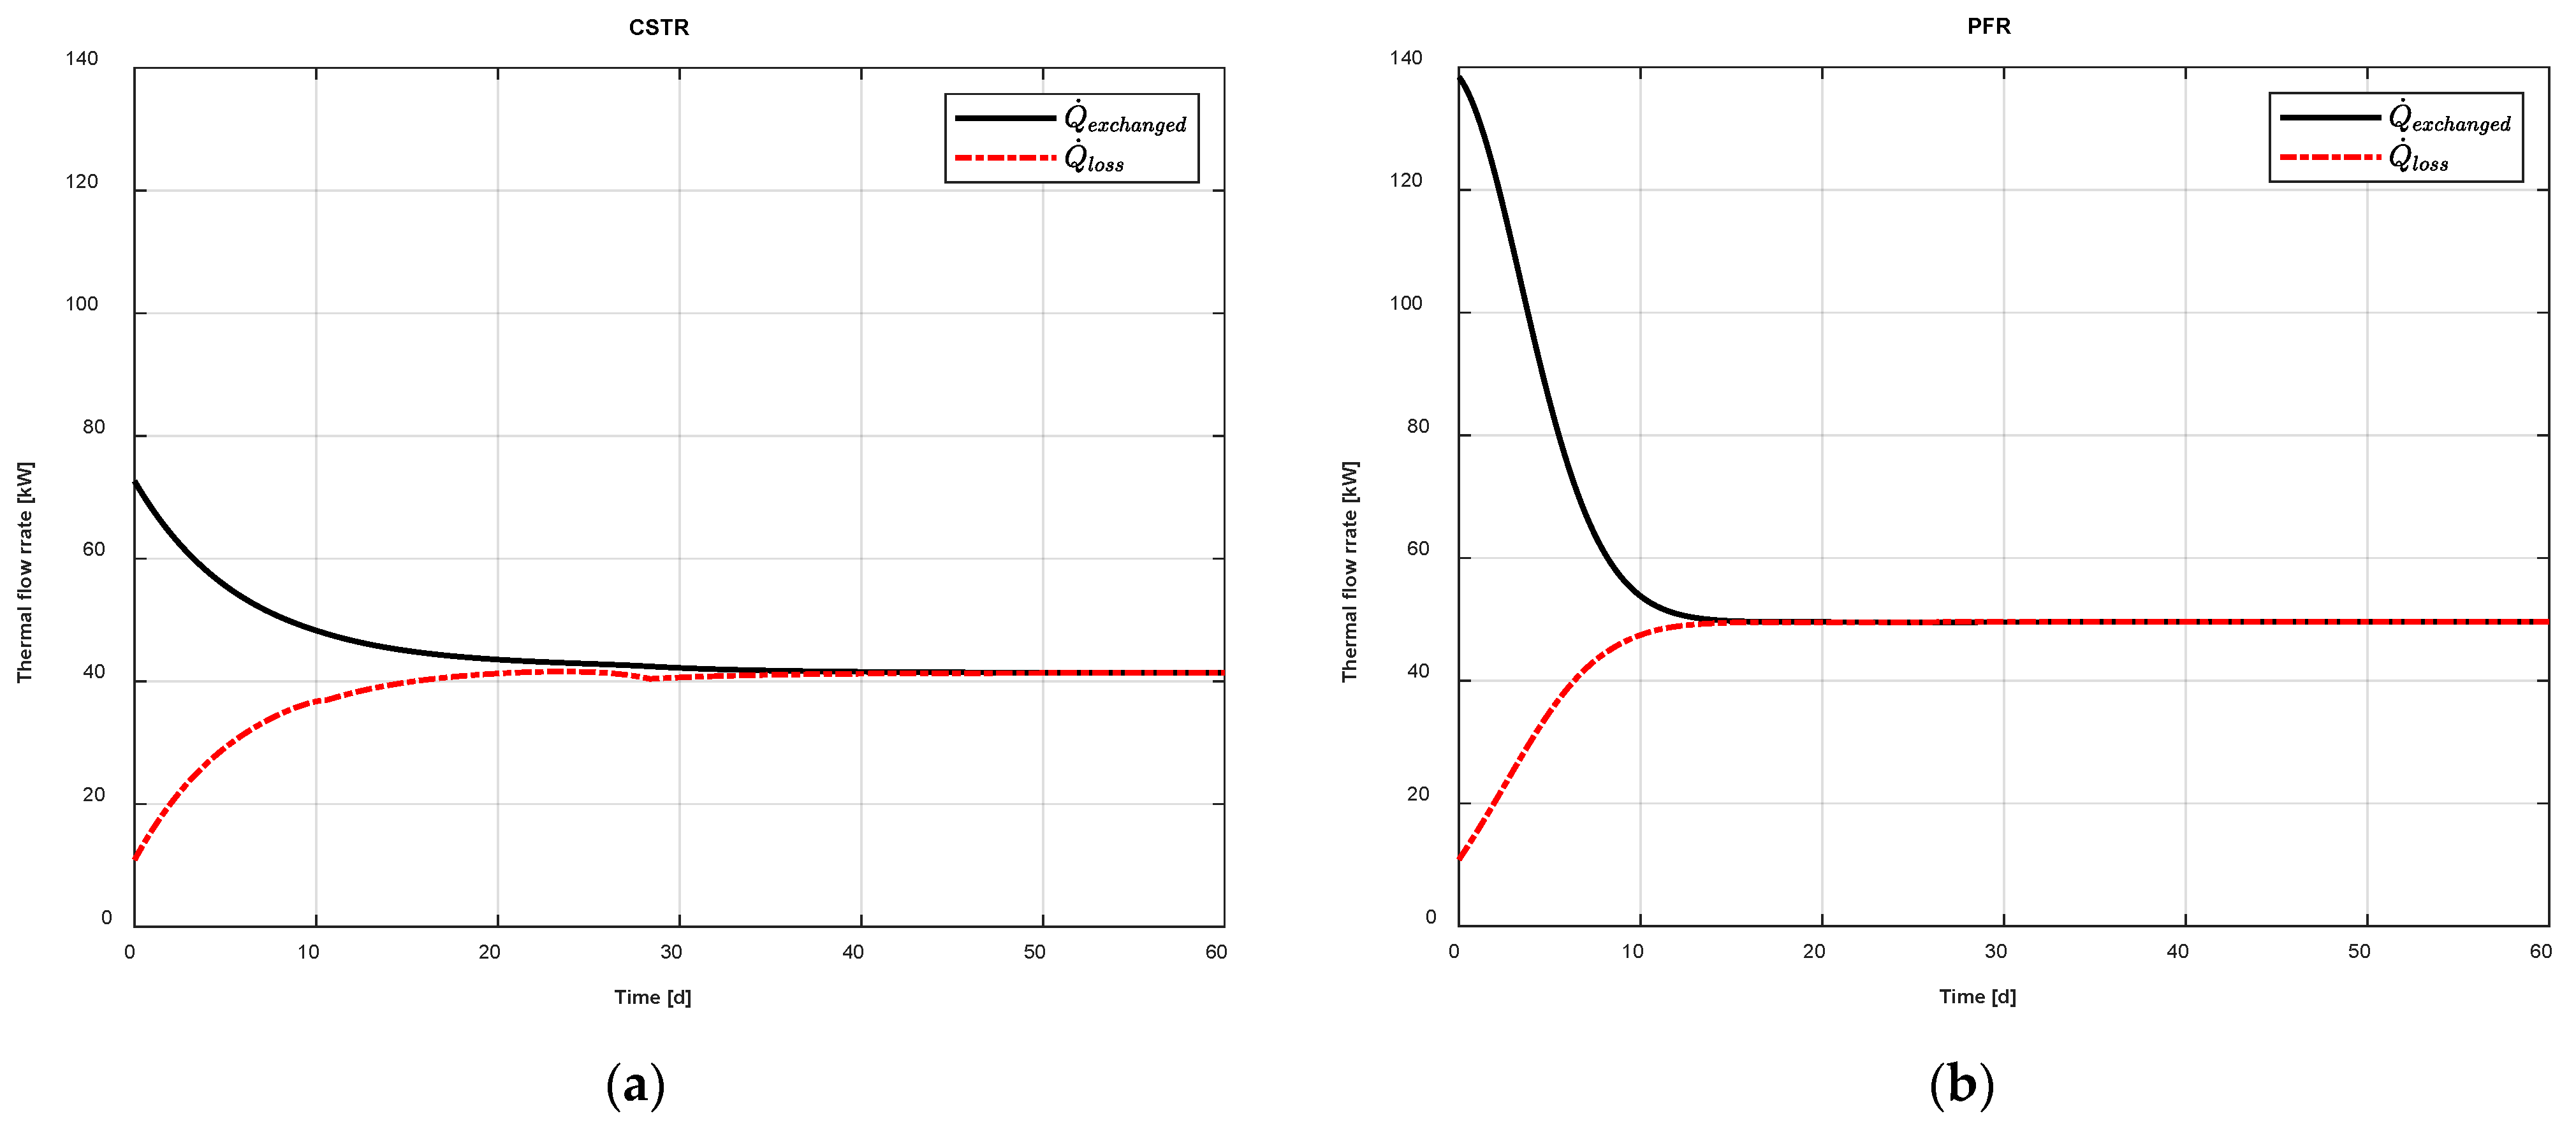
To support this result, the OFMSW temperature and the heat transfer rate involved for both the reactors were analyzed and compared. In
Figure 8, the trend of the heat transfer rate within the reactor and the thermal losses are reported, both for the CSTR (
Figure 8a) and the PFR (
Figure 8b).
The exchanged thermal flow rate, , represents the total input energy. This term represents the thermal energy supplied to the digester by means of the heat exchanger installed into the digester. The thermal losses, , are due to the heat loss toward the environment and the thermal flow rate related to the outgoing biogas and digestate.
Figure 8 proves that the PFR model is featured by a lower thermal inertia with respect to the CSTR one. In fact, the heat exchanger supplies a higher amount of heat to the waste into the digester in the PFR model with respect to the CSTR case. In addition, PFR achieves the steady state earlier, i.e., 12 days (PFR) vs. 22 days (CSTR).
Figure 9 compares the temperatures of the CSTR and PFR.
Note that, concerning the PFR, this figure reports the average temperature among all the computational nodes of the PFR. This figure is consistent with the heat transfer rate trends discussed before. Since the lower thermal inertia of the PFR determines a higher amount of heat supplied to the waste. Therefore, PFR temperature exhibits a sharp increase up to the steady state condition. Conversely, the CSTR achieves the steady state later with respect to the PFR. CSTR is also featured by a slightly lower operating temperature with respect to the PFR. This issue leads to the fact that the PFR is featured by higher thermal losses with respect to the CSTR: is equal to 40 kW and 50 kW in steady state conditions for CSTR and PFR, respectively. However, the geometry of the studied digesters also affects the thermal losses. In fact, although both the digesters are featured by the same volume, CSTR is characterized by a compact shape, whereas PRF is characterized by a greater dispersing surface.
5. Conclusions
In this work, a one-dimensional model able to simulate the biological processes and the heat exchange occurring inside a plug flow reactor is proposed. The anaerobic digestion model is based on the well-known anaerobic digestion model n.1, widely adopted and validated in literature, and is coupled with the thermal balance equation regarding the heat exchanger installed into the digester envelope. With respect to the continuously stirred tank reactor, which considers a single temperature node, the plug flow reactor model also evaluates the temperature gradient along the digester. The model proposed consists in a set of partial differential equations, which are discretized with respect to space and time. Results are compared with the ones previously obtained for a continuously stirred tank reactor to further assess the consistency of the model.
The main findings from the comparison of the results obtained for both models can be summarized as follows:
The considered digester achieves a biogas flow rate of 2300 Nm3/d, which is slightly greater than the one obtained from the previous model.
As expected, the temperature strongly affects the kinetic rates of the microbial species and the methane production. The faster the temperature increase, the faster the evolution of the biological process, for each slice of the reactor.
The biogas production of the plug flow reactor is greater than the one in the continuously stirred tank reactor. This result is due to the fact that the average temperature along the plug flow reactor is greater than the temperature of the continuously stirred tank reactor, per each time step.
The reason of this temperature difference is mainly due to the greater thermal inertia of the continuously stirred tank reactor with respect to the plug flow reactor. Further development of this model may consider the integration of the proposed model for a plug flow reactor with a more complex system, including different renewable technologies, aiming at evaluating the dynamic renewable driven plant producing biogas.


 ,
, 


