Article

Synthesis of Periclase Phase (MgO) from Colloidal Cassava Starch Suspension, Dual Application: Cr(III) Removal and Pigment Reuse

1
Department of Chemistry, Midwestern State University, Alameda Elio Antonio Dalla Vecchia, 838, Guarapuava 85040-167, Brazil
2
Chimie des Interactions Plasma-Surface (ChIPS), Research Institute for Materials Science and Engineering, University of Mons, 7000 Mons, Belgium
*
Author to whom correspondence should be addressed.
Physchem 2024, 4(1), 61-77; https://doi.org/10.3390/physchem4010005
Submission received: 30 November 2023 / Revised: 4 January 2024 / Accepted: 11 January 2024 / Published: 4 February 2024
(This article belongs to the Section Solid-State Chemistry and Physics)

Abstract

:
This study aimed to synthesize magnesium oxide (MgO) using a colloidal starch method for two primary purposes: the removal of chromium (III) ions from synthetic wastewater and the subsequent use of the chromium-containing material as synthetic inorganic pigments (SIPs) in commercial paints. The synthesis used to obtain the oxide (St-MgO) is a promising method for using plants, such as cassava, as green fuels due to their abundance, low cost, and non-toxicity. With this, the oxide showed greater porosity and alkalinity, compared to commercial magnesium oxide (Cm-MgO). The MgO samples were subjected to structural characterization using XRD and FTIR, surface area and pore volume study by B.E.T. and SEM, and chemical composition by ICP-OES and thermogravimetric analysis (TGA). The crystalline periclase phase was identified for both samples, but the brucite phase was shown to be a secondary phase for the commercial sample. After the removal of chromium ions, the brucite crystalline phase became the majority phase for the samples, regardless of the concentration of ions removed. The pigments were characterized by color measurements and discussed in terms of colorimetric parameters using the CIELab method and electron spectroscopy (VIS-NIR). This study also evaluated the colorimetric stability of green pigments in aggressive environments (acidic and alkaline) over a 240 h exposure period, demonstrating minimal color difference. This study aims to develop materials for the decontamination of wastewater containing chromium and its reuse as a synthetic inorganic pigment, using an innovative and sustainable synthesis method.

Graphical Abstract

1. Introduction

Water is one of the most valuable resources, vital for the survival of humans, animals, and plants, and essential for industrial use, energy generation, transportation, agriculture, and livestock development activities such as aquaculture [1]. Only 0.29% of the world’s water is available to be enjoyed, present in rivers, lakes, ponds, dams, and streams [1]. As the populace expands, so does water consumption in various areas (IBGE, 2020). The contamination of aquatic zones by wastewater has been a huge problem to tackle, as the lack of sanitation and treatment has contributed to a great deal of environmental and public health damage. Effluents can contain solid or dissolved waste, including sanitary sewage, oils, grease, and industrial substances that can pose health risks when in the environment [2]. Disposal can be carried out legally if it follows the rules established by CONAMA (National Environmental Council), which determine physicochemical standards such as determination of temperature, color, turbidity, odors, settleable solids, hardness, and determination of dissolved oxygen.
The characteristics of each industrial effluent depend on the process used in the industry, usually consisting of organic compounds and metals that are often bio-accumulative [3]. Among the various elements used industrially, chromium is a toxic element found in nature in two different forms, trivalent (Cr3+) and hexavalent (Cr6+), each of which has different physicochemical characteristics, including mobility, toxicity, and bioavailability [4,5]. In its hexavalent form, it is considered more toxic and carcinogenic and can cause damage to the environment and living beings [4,6,7]. Trivalent chromium is more stable, a nutrient found in some foods, which contributes to glucose metabolism, but in concentrations above 1.0 mg L−1, it becomes harmful to health, and when left free in the environment, it can oxidize to Cr6+ [4,6,7,8]. For this reason, several studies related to the remediation of Cr3+ disposal and contamination are being carried out. Techniques such as ion exchange, membrane filtration, electrocoagulation, filtration, percolation, phytoremediation, reverse osmosis, and removal by precipitation using alkaline oxides are used to treat wastewater contaminated with Cr 3+ [7,9,10].
This work aimed to synthesize magnesium oxide (MgO), a single solid with a high ionic character and a crystalline phase known as periclase, stoichiometry, and crystalline structure of a face-centered cubic type and high thermal resistance [11]. The synthesis was carried out using the colloidal method in a reaction medium with starch extracted from cassava (Manihot esculenta), a tuber native to Brazil with a high energy value, which can be used as a precursor for synthesis [12]. Starch is a biodegradable polysaccharide consisting of amylose and amylopectin molecules made up of D-glucose units [13]. Natural polysaccharides act as low-cost, non-toxic alternative additives produced from plants, acting as complexing agents for central metal ions, and can adapt to the growth of MgO [14]. Several other studies have shown the advantages of opting for biosynthesis and green fabrication using natural fuels, e.g., Naveed et al. 2023 [15] in their studies using aqueous extract of Nigella sativa seeds in the synthesis of zero-valent iron nanoparticles (ZVI-NPs) and evaluation of their heavy metal remediation capabilities. Thus, a synthesized oxide and commercial oxide were used as a comparison for the removal of Cr3+ ions from synthetic wastewater. The removal of chromium by MgO occurs through the coordination of contaminant ions on the surface of the magnesium oxide, resulting in an interaction between the active sites of the oxide and the chromium ions [16,17]. After removing the contaminant, the materials obtained a color characteristic of the Cr
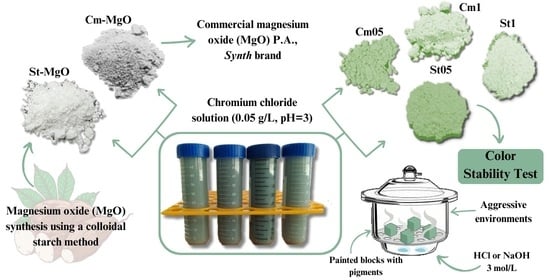
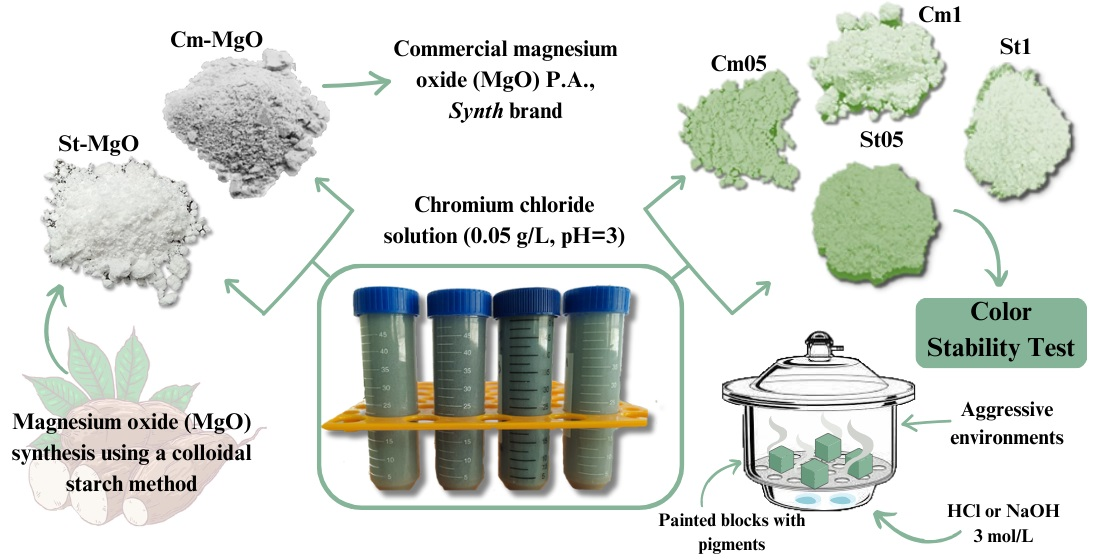
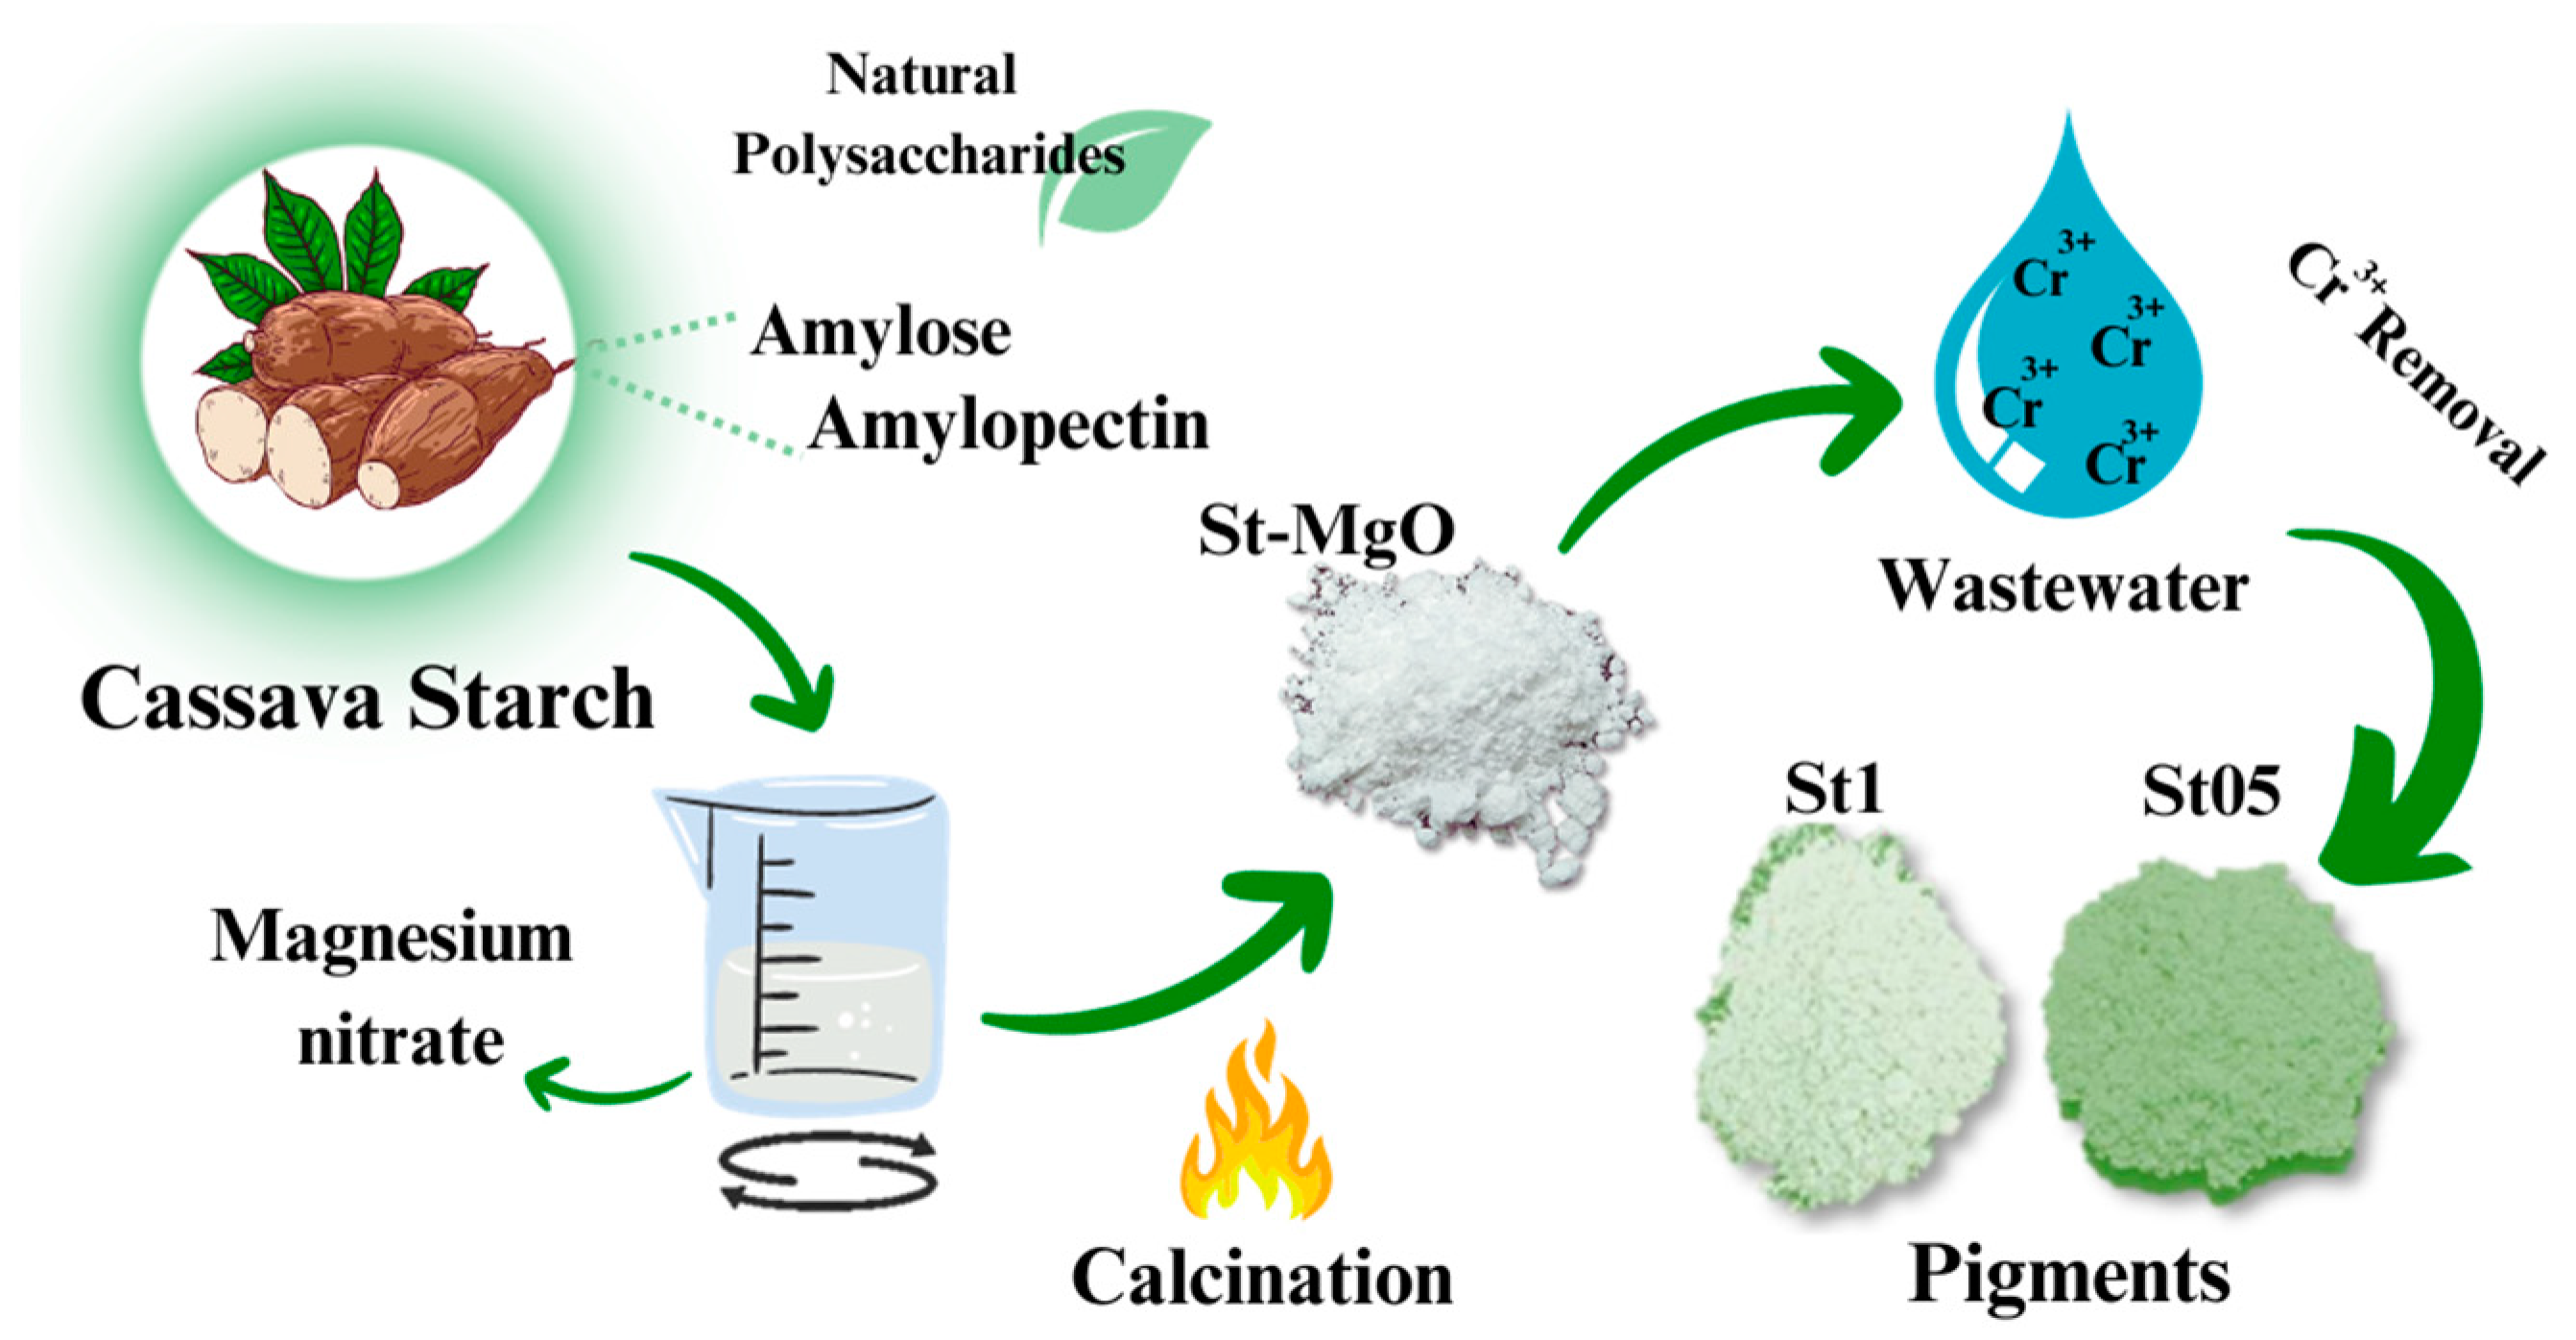
3+ ion. They were then characterized and applied as pigments for colorless real estate paint, showing stability of color and structure. The steps involving the methodology for preparing and applying magnesium oxide (MgO) are shown in Scheme 1.

2. Materials and Methods

2.1. MgO Synthesis and Chromium Removal Tests

The reagents used were of analytical grade: magnesium nitrate (Mg(NO3)2∙6H2O), 98%, Dinâmica); chromium chloride (III) (CrCl3∙6H2O, 97%, Sigma Aldrich, Barueri, São Paulo, Brazil); commercial magnesium oxide (MgO, P.A., Synth, Diadema, São Paulo, Brazil). The starch used was extracted directly from the cassava plant (Manihot esculenta) and used naturally without any chemical treatment. The cassava used was from the region of Palmital City, Paraná. The MgO preparation method involves 3 steps (Scheme 1):
Step I: The extraction of cassava starch was the initial stage and began by sanitizing the cassava with water and a sponge, followed by extracting all the cassava’s external (brown) peel. The white peel and the inner part of the tuber were then processed in a blender (Britânia brand, model B1000, 1200W power), with a 1:2 proportion of cassava and water (w/w). Following processing, the fiber separated from the juice that was rich in starch. The juice that contained starch was allowed to stand for 24 h, after which the starch was separated from the washing water. Then, using an evaporation dish, the starch was dried in an oven at 60 °C for 30 min, sieved, and stored under refrigeration (−7 °C).
Step II: The methodology for preparing the white matrix was adapted from Primo et al. (2019) [18]. The preparation of MgO entails the use of 200 g of dry starch and about 800 g of Milli-Q water, obtaining a 1:4 proportion of dry starch and water (m/m). While stirring constantly, 210.9 g of magnesium nitrate was added to the mass of colloidal starch/water emulsion. Following mechanical stirring (600 rpm, 20 min.) at ambient temperature, the suspension was calcined in a muffle furnace at a temperature of 750 °C (for 60 min) and with a heating ramp of 10 °C min−1. The solid obtained was pulverized and sieved (60 mesh). The synthesized oxide was named St-MgO, while the commercial magnesium oxide used as a comparison was named Cm-MgO.
Step III: The removal tests were carried out simply, using 40 mL of a chromium chloride solution (0.05 g L−1, pH = 3). The whole process was achieved by adding MgO as a sorbent material and regulating the control conditions (stirring time and centrifugation). The masses of samples used were 500 and 1000 mg. The reaction occurred quickly and had a contact time of 15 min, resulting in constant stirring on a magnetic stirrer. After the contact time had elapsed, the materials were centrifuged, filtered, washed, and dried in an oven at 60 °C for 24 h to obtain the green pigments. The pigments were pulverized in an agate mortar and pestle and sieved (60 mesh) for characterization, and the nomenclature established according to the amount of MgO used is shown in Table 1.

2.2. Characterizations

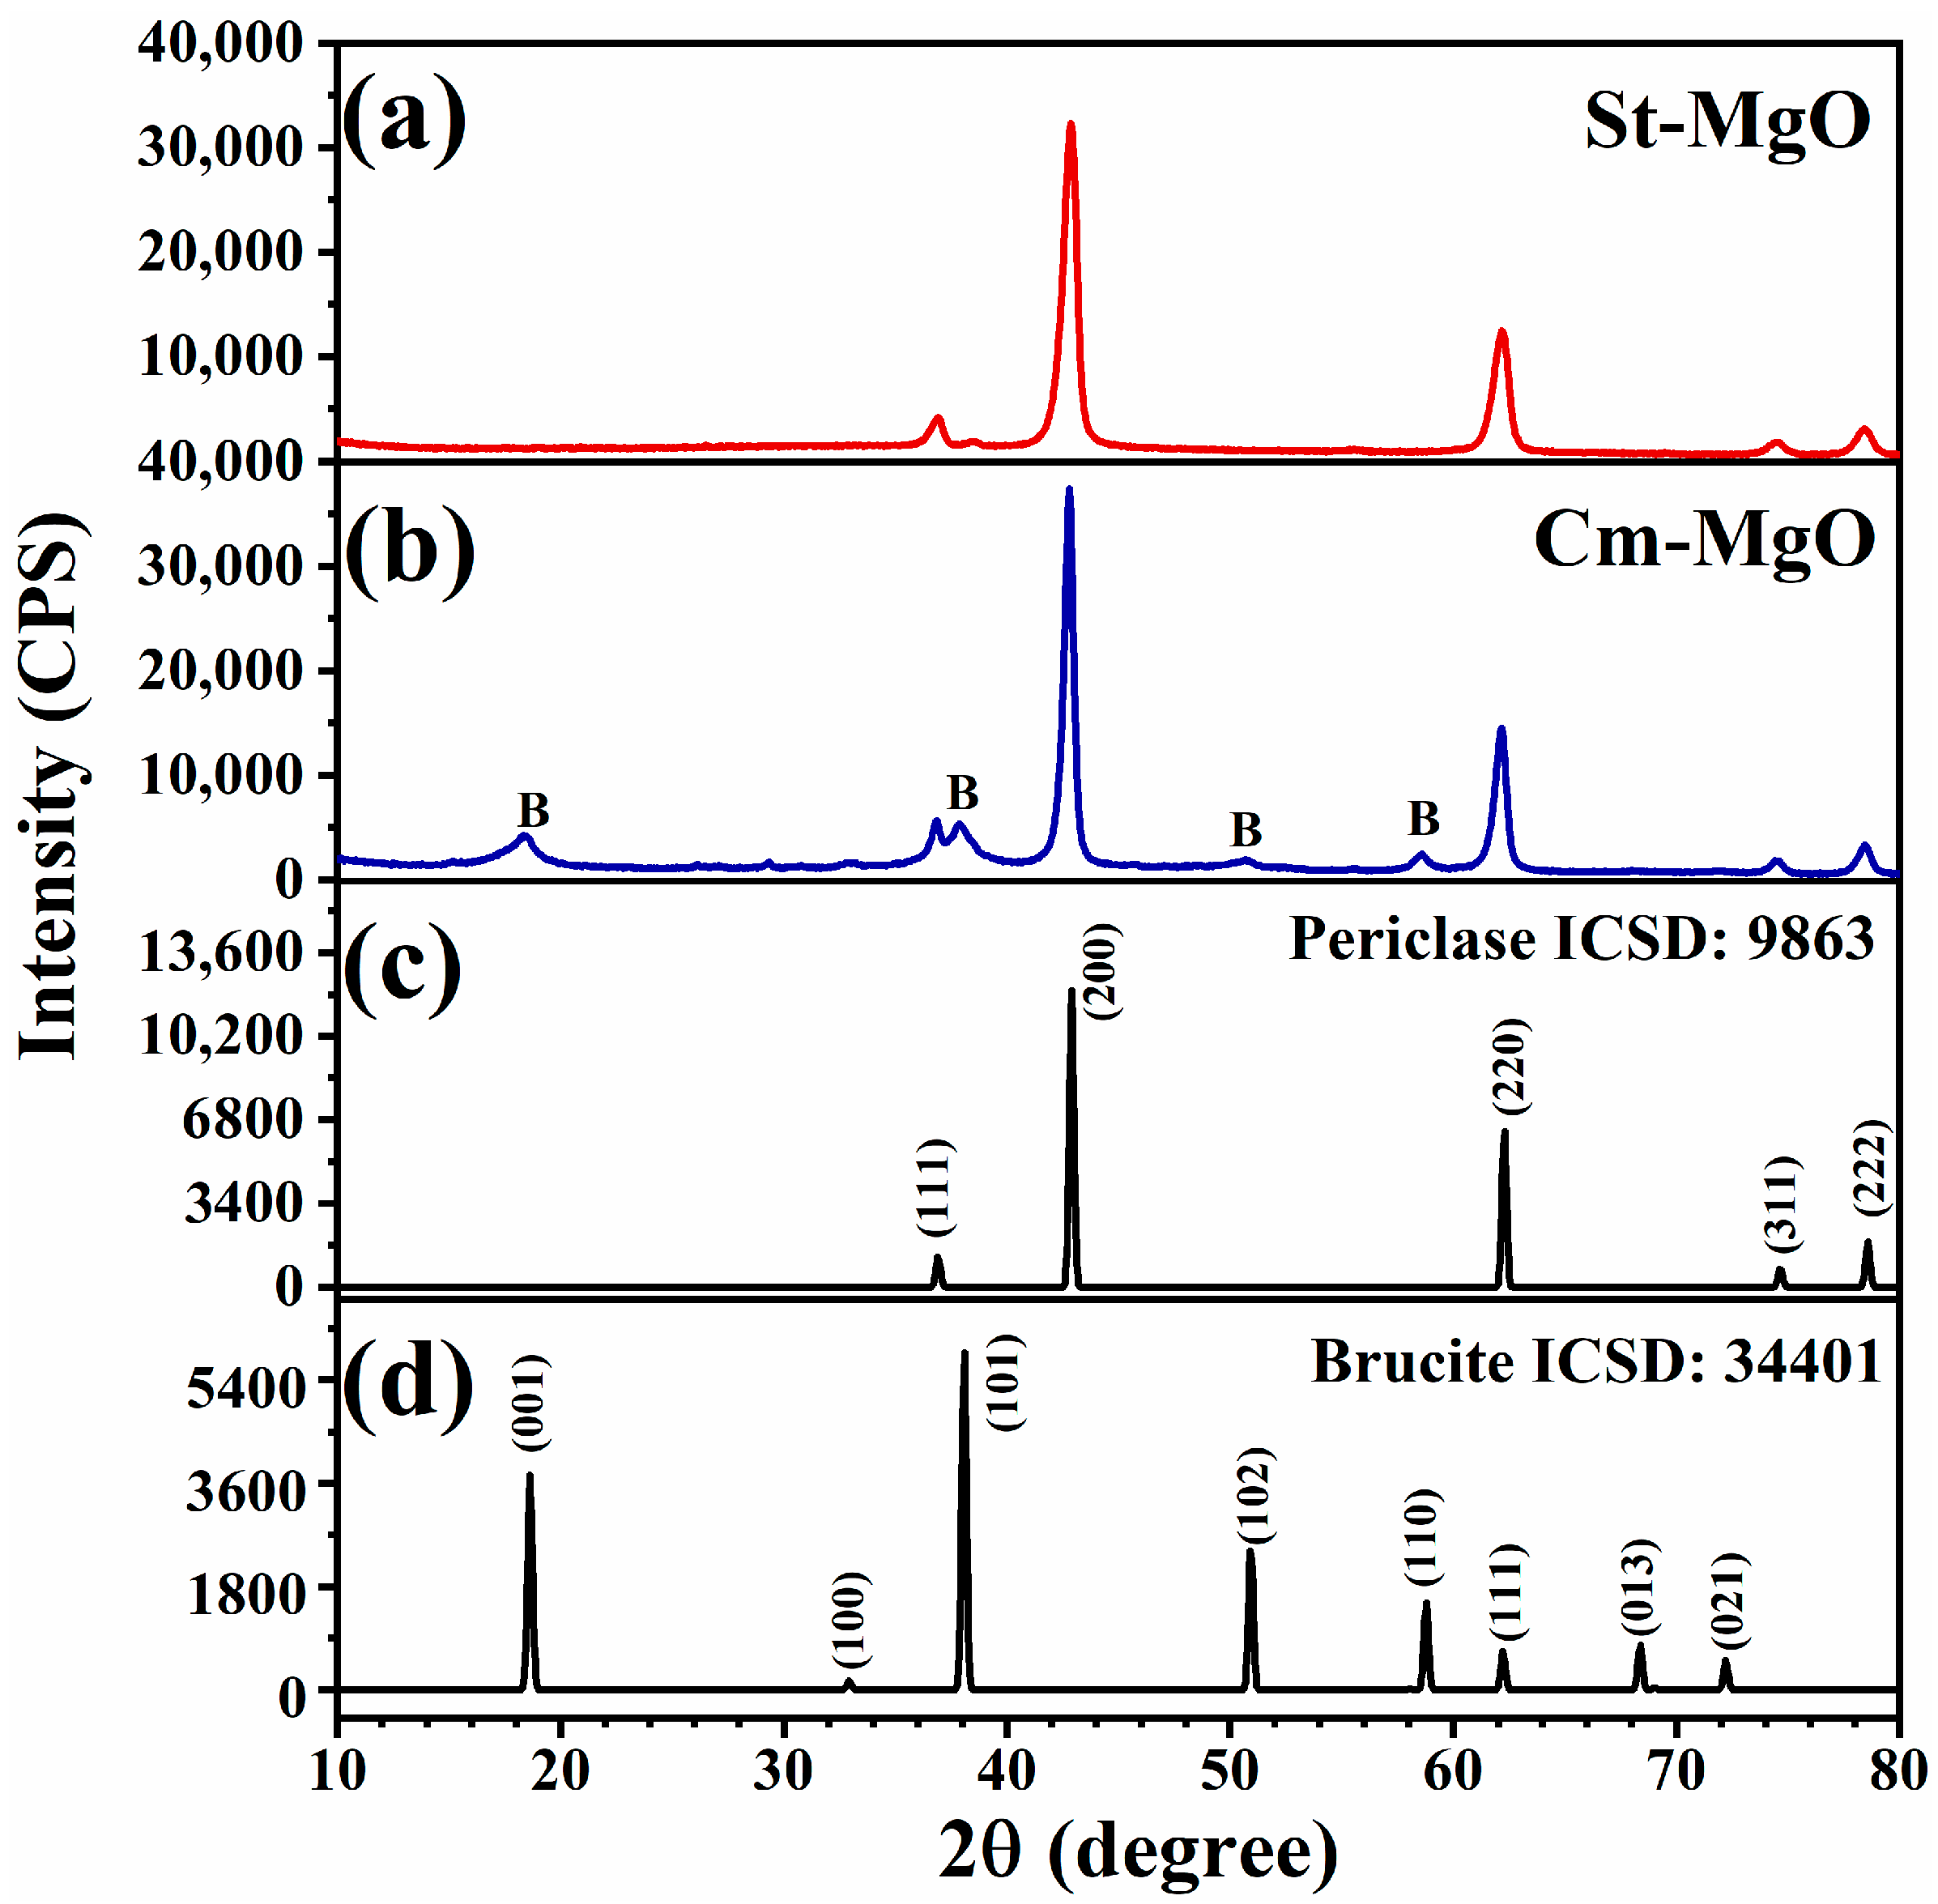
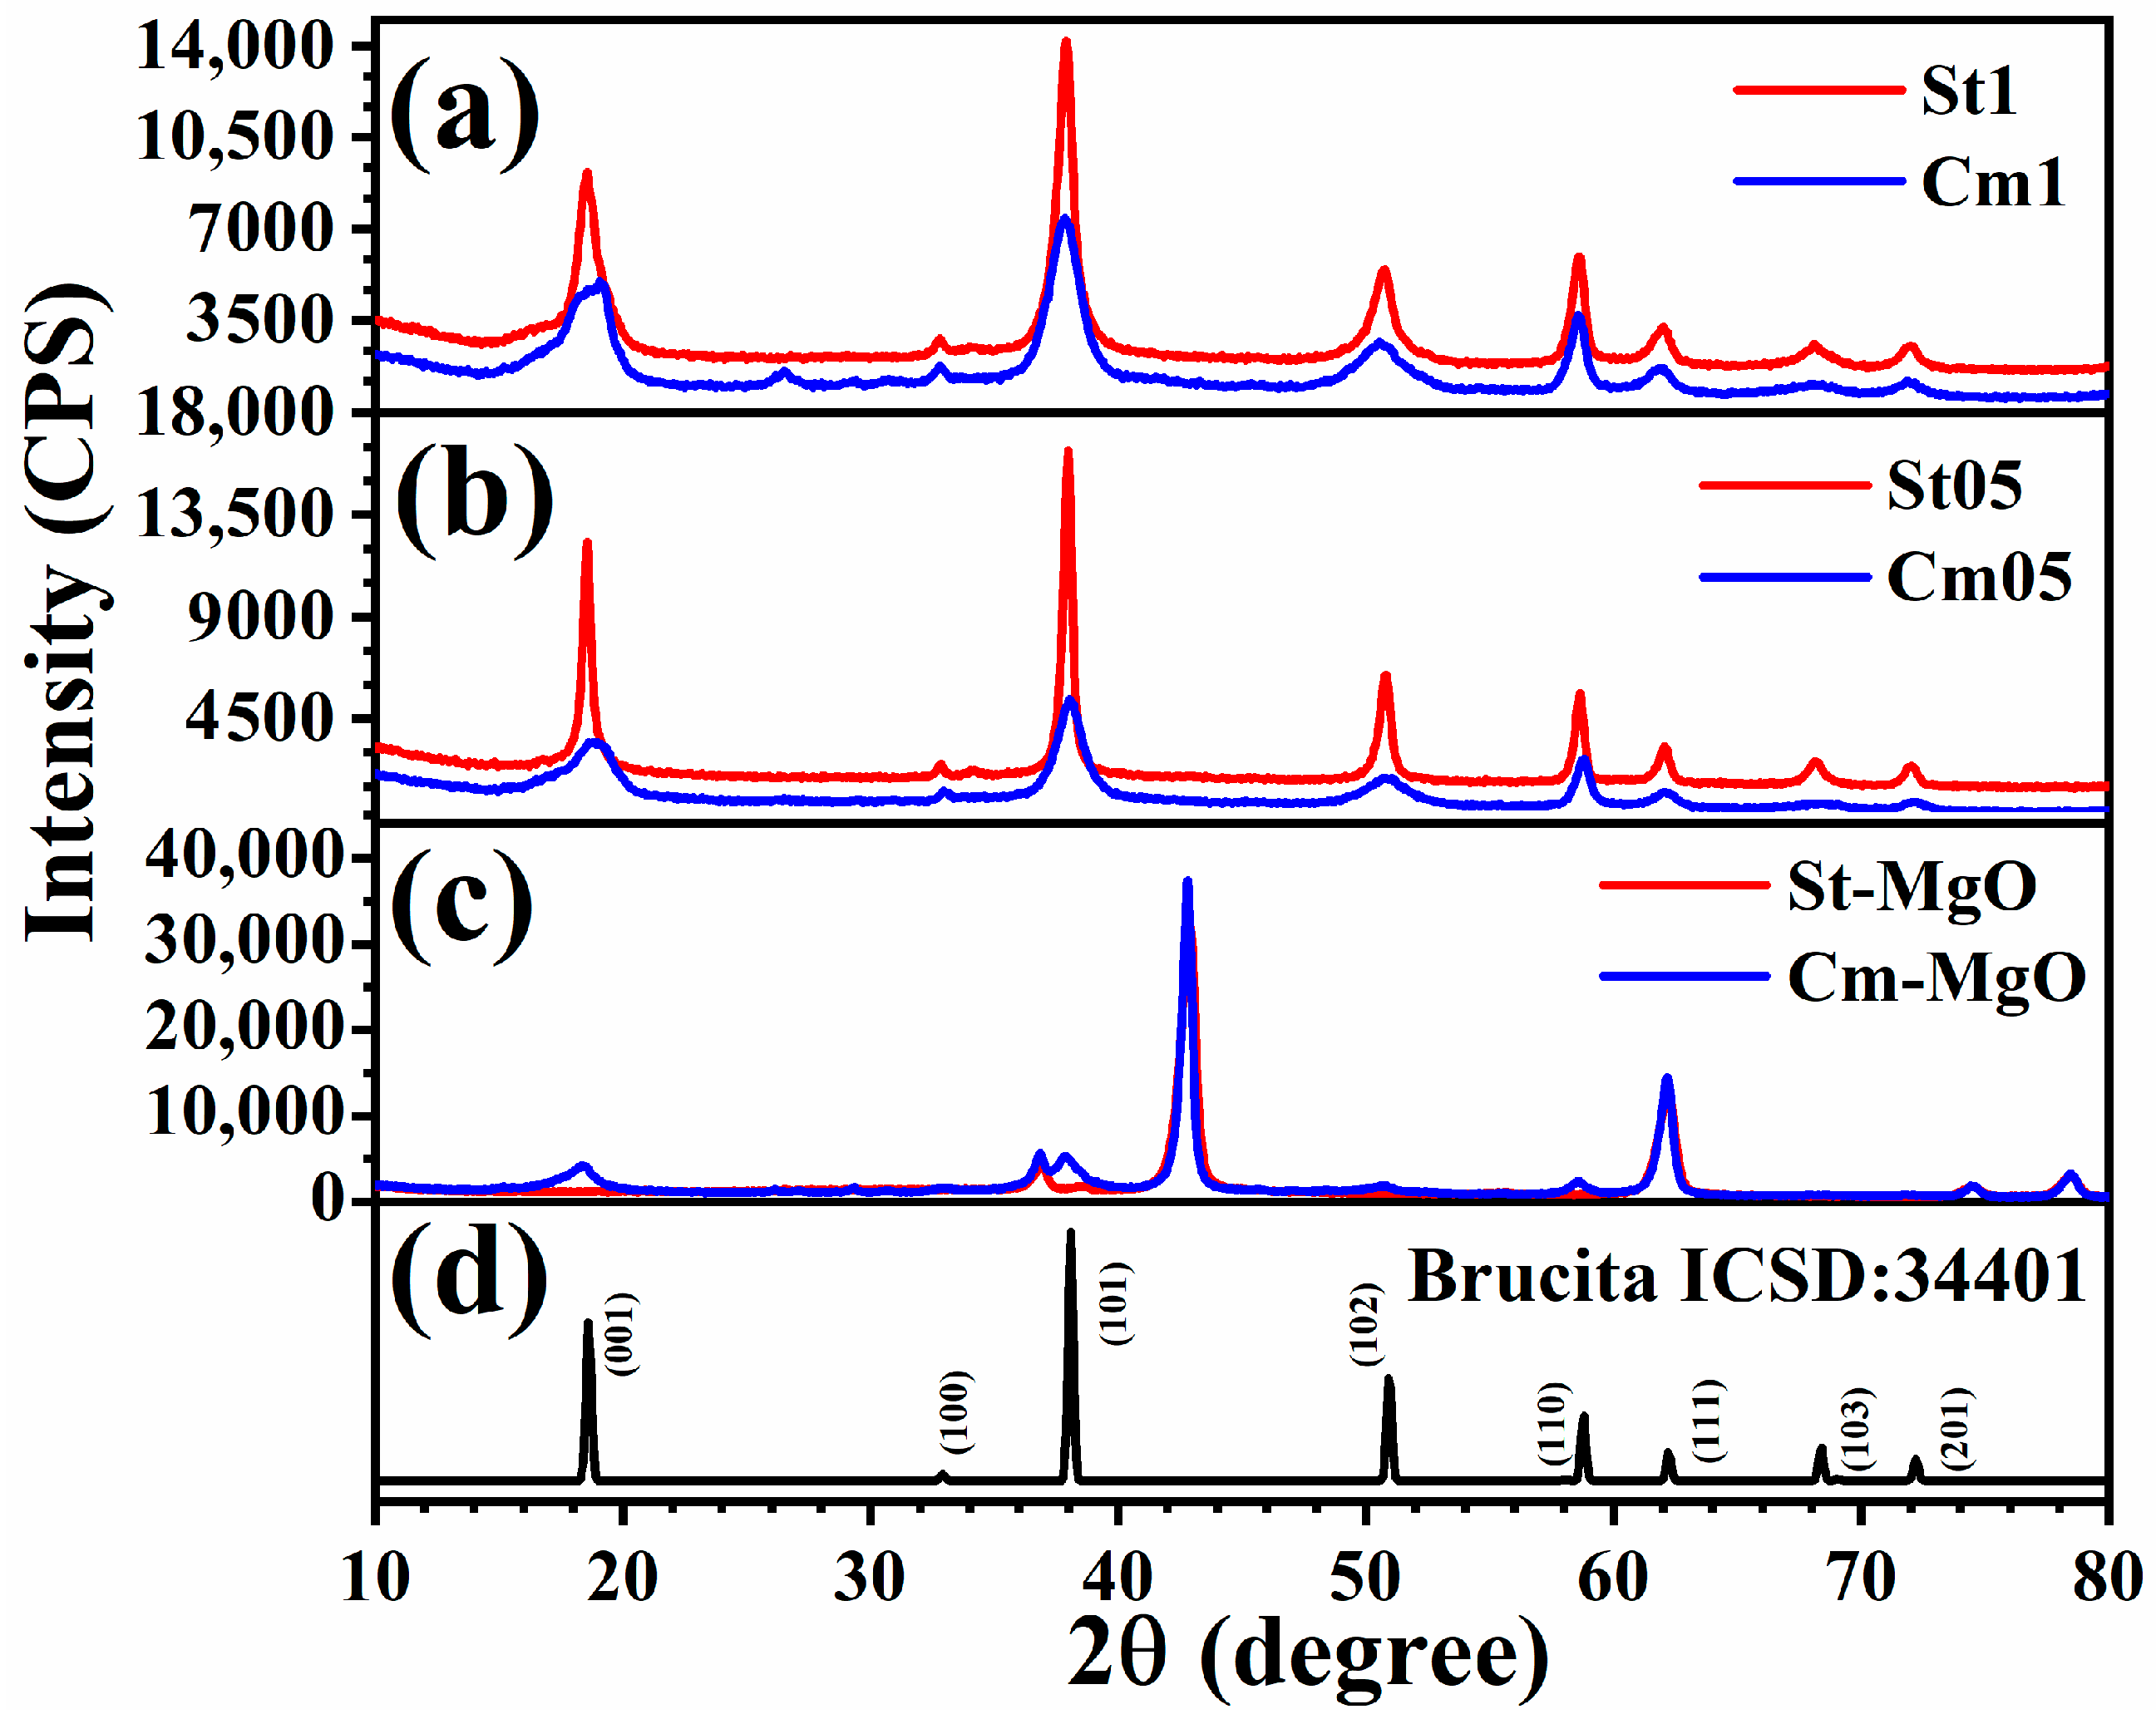
The samples were characterized by X-ray diffractometry (XRD) obtained on a Bruker X-ray diffractometer, model D2Phaser, with a copper cathode (λ = 1.5418 Å), potential of 30 kV, current of 10 mA, range between 10° and 80° (2θ), and increment of 0.2°/s. MATCH® software version 3.16 Build 283 (free-of-charge demo version), with access to the COD-Inorg® 2020 database was used to index the patterns. Using Bruker’s EVA® software version 1.1, it was possible to estimate the crystallinity of the samples from the XRD, and the determination of the average crystal size was given by the Scherrer equation (Equation (1)) [19], where the proportionality constant K was measured from the width of the peak with the greatest intensity at half height, so the minimum value of K = 0.9 and the maximum value K = 1.3 were used.
D = κλ/βcosθ
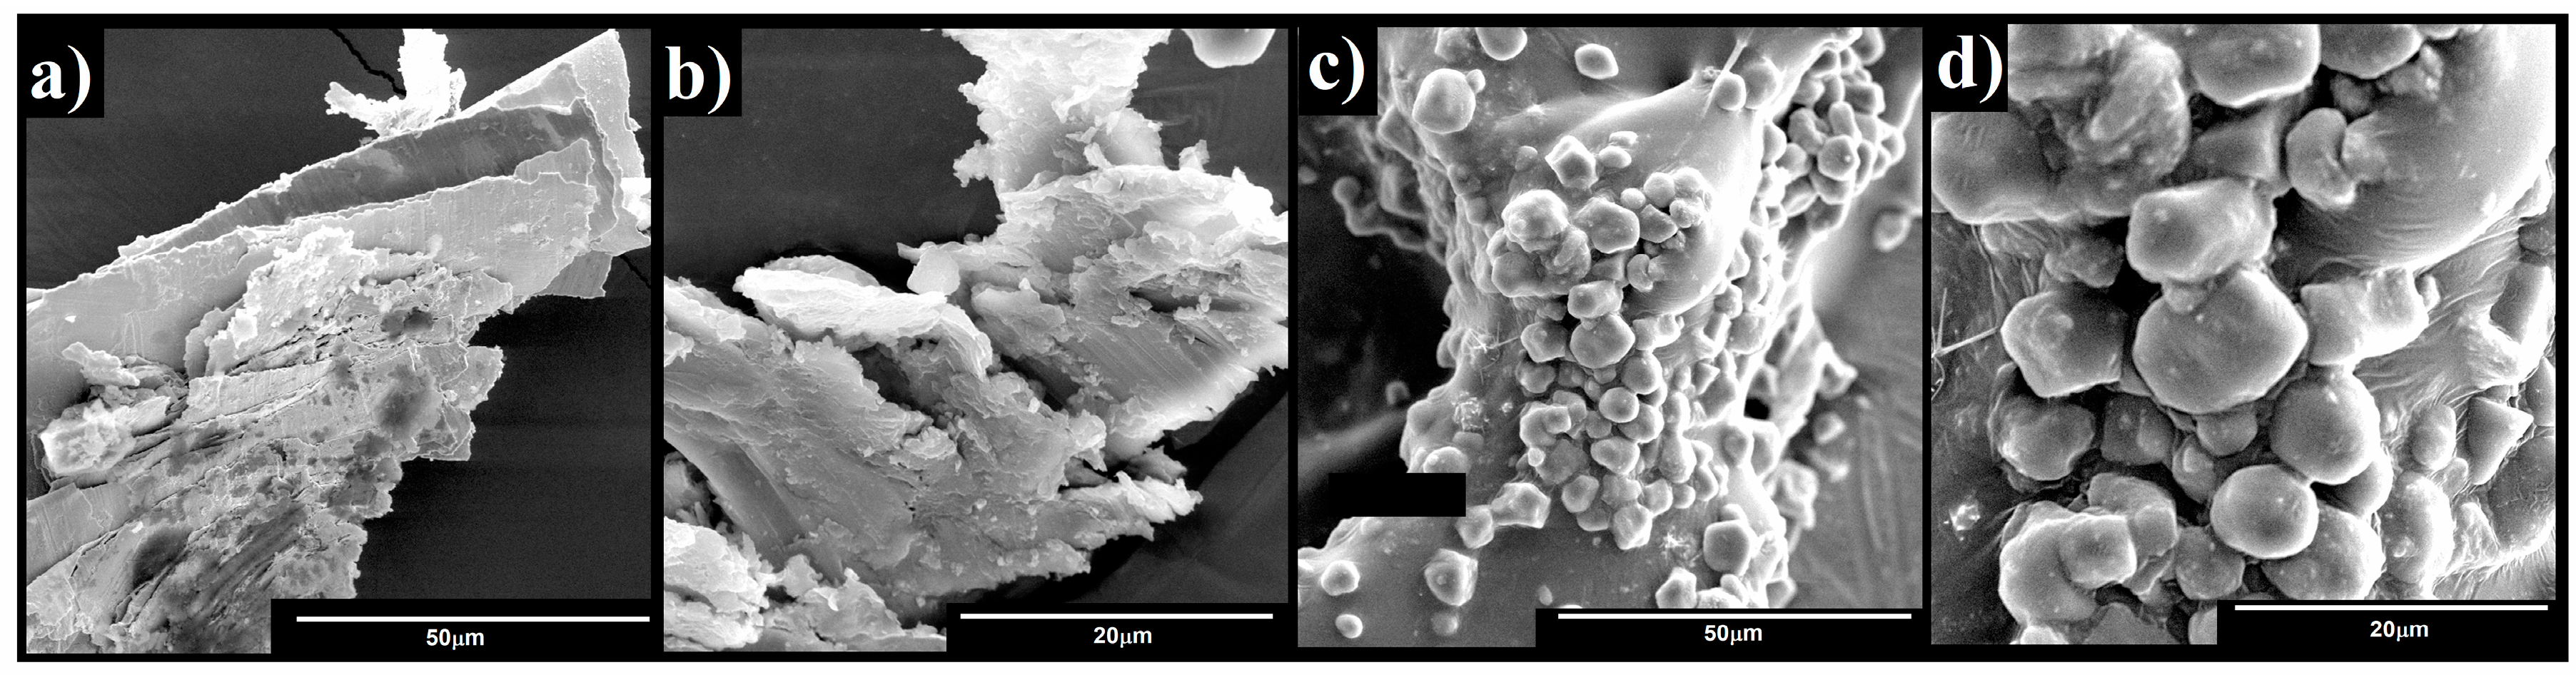
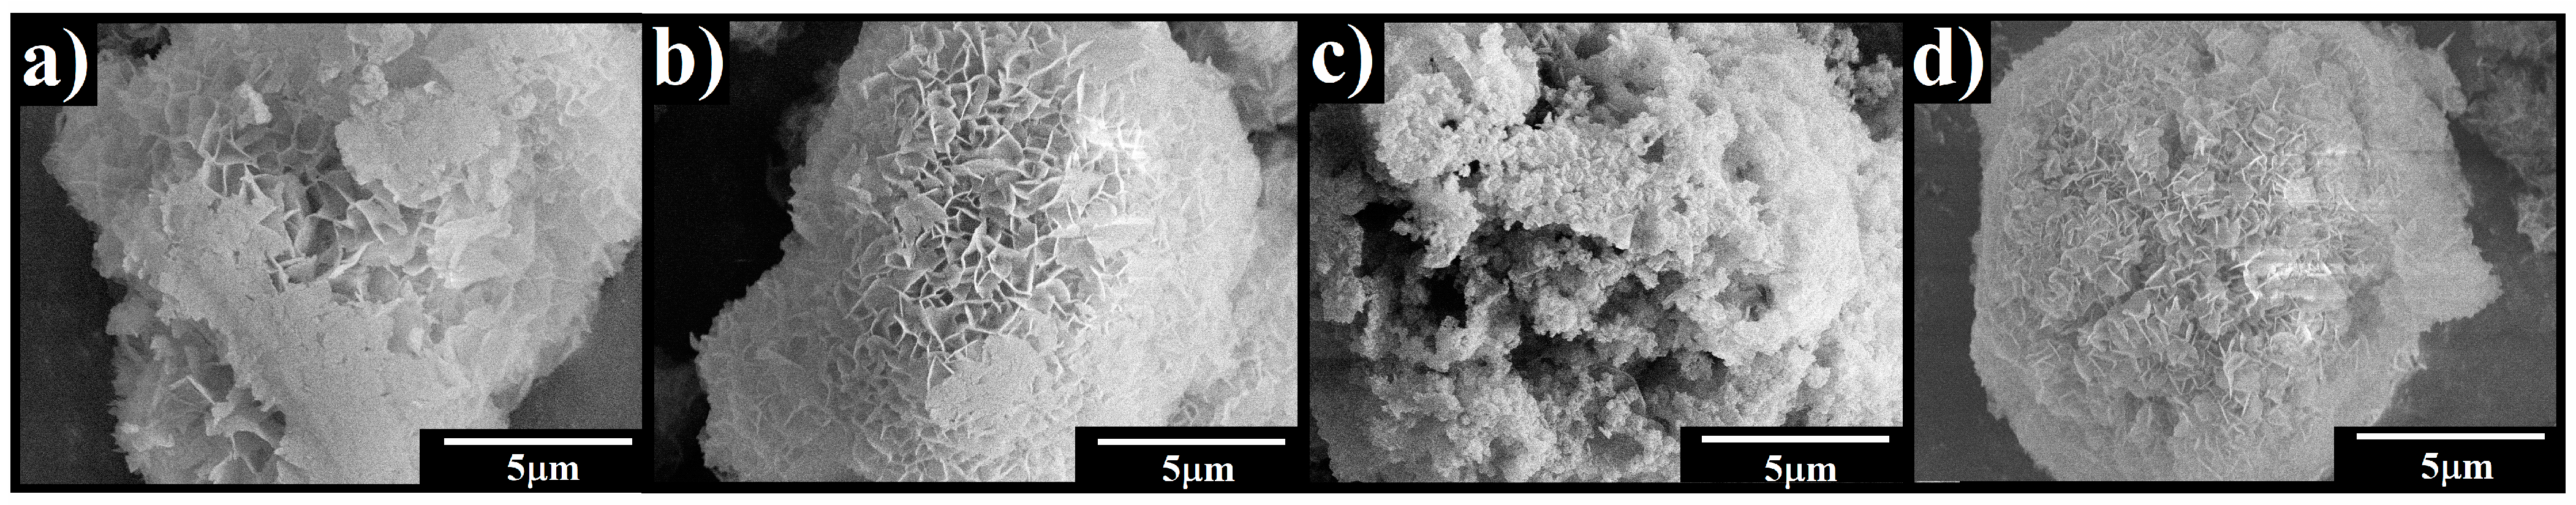
The elements magnesium and chromium were quantified in an inductively coupled plasma optical emission spectrometer, Thermo Scientific ICP-OES, model iCAP 6500, with iTeVa software, version 1.2.0.30. Samples were dissolved in a solution containing 1.0% of HNO3 (v/v) in Milli-Q water and data were collected in triplicate. The analyzed spectral lines were 279.5 nm and 267.7 nm for magnesium and chromium, respectively. Images of the samples were taken on a TESCAN VEGA3 scanning electron microscope (SEM) at a voltage of 10 kV. The micrographs of the pigments were taken on a FEI Scios dual-beam scanning electron microscope at a voltage of 10 kV.
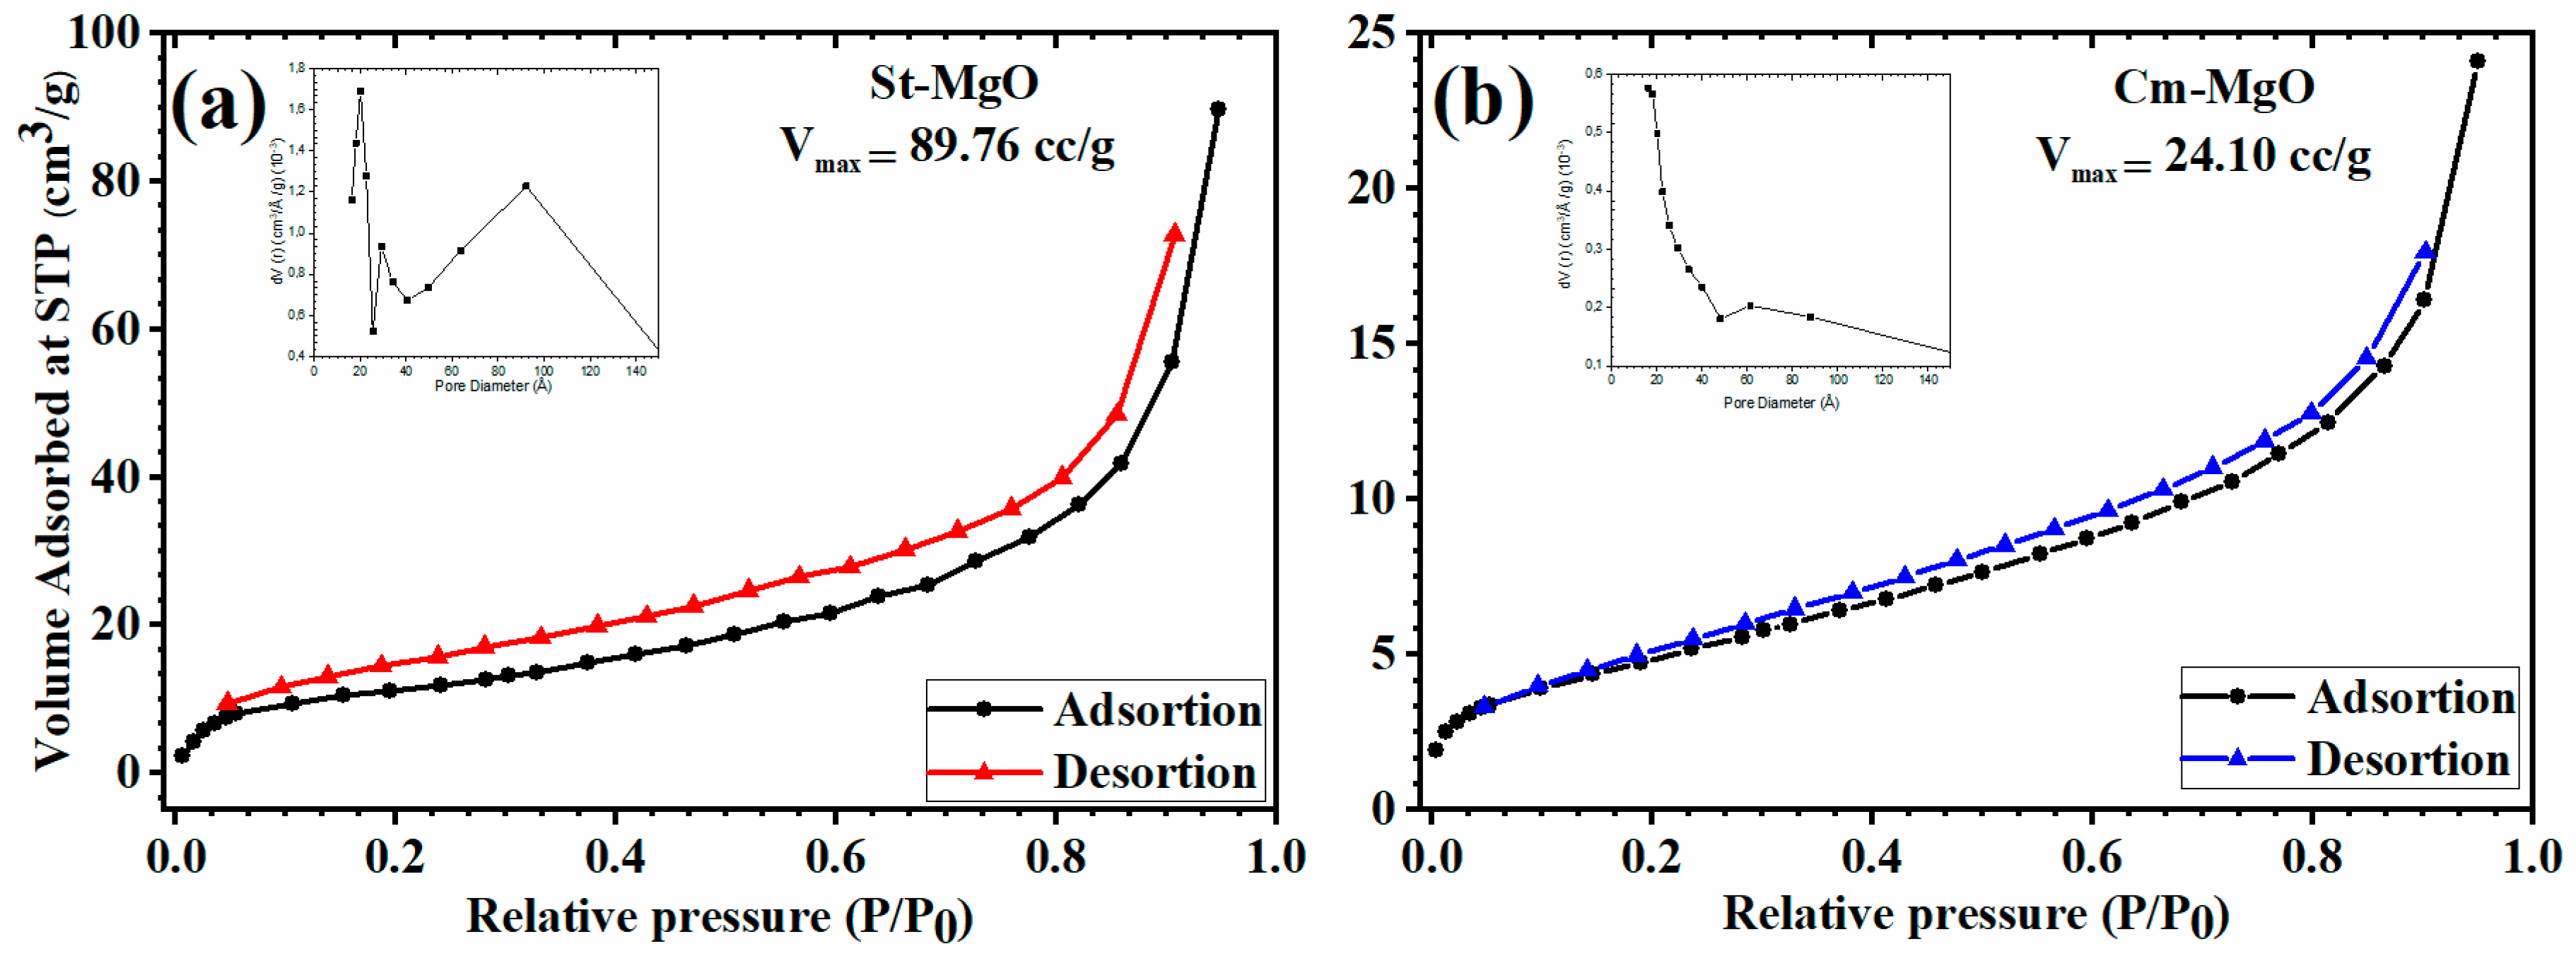
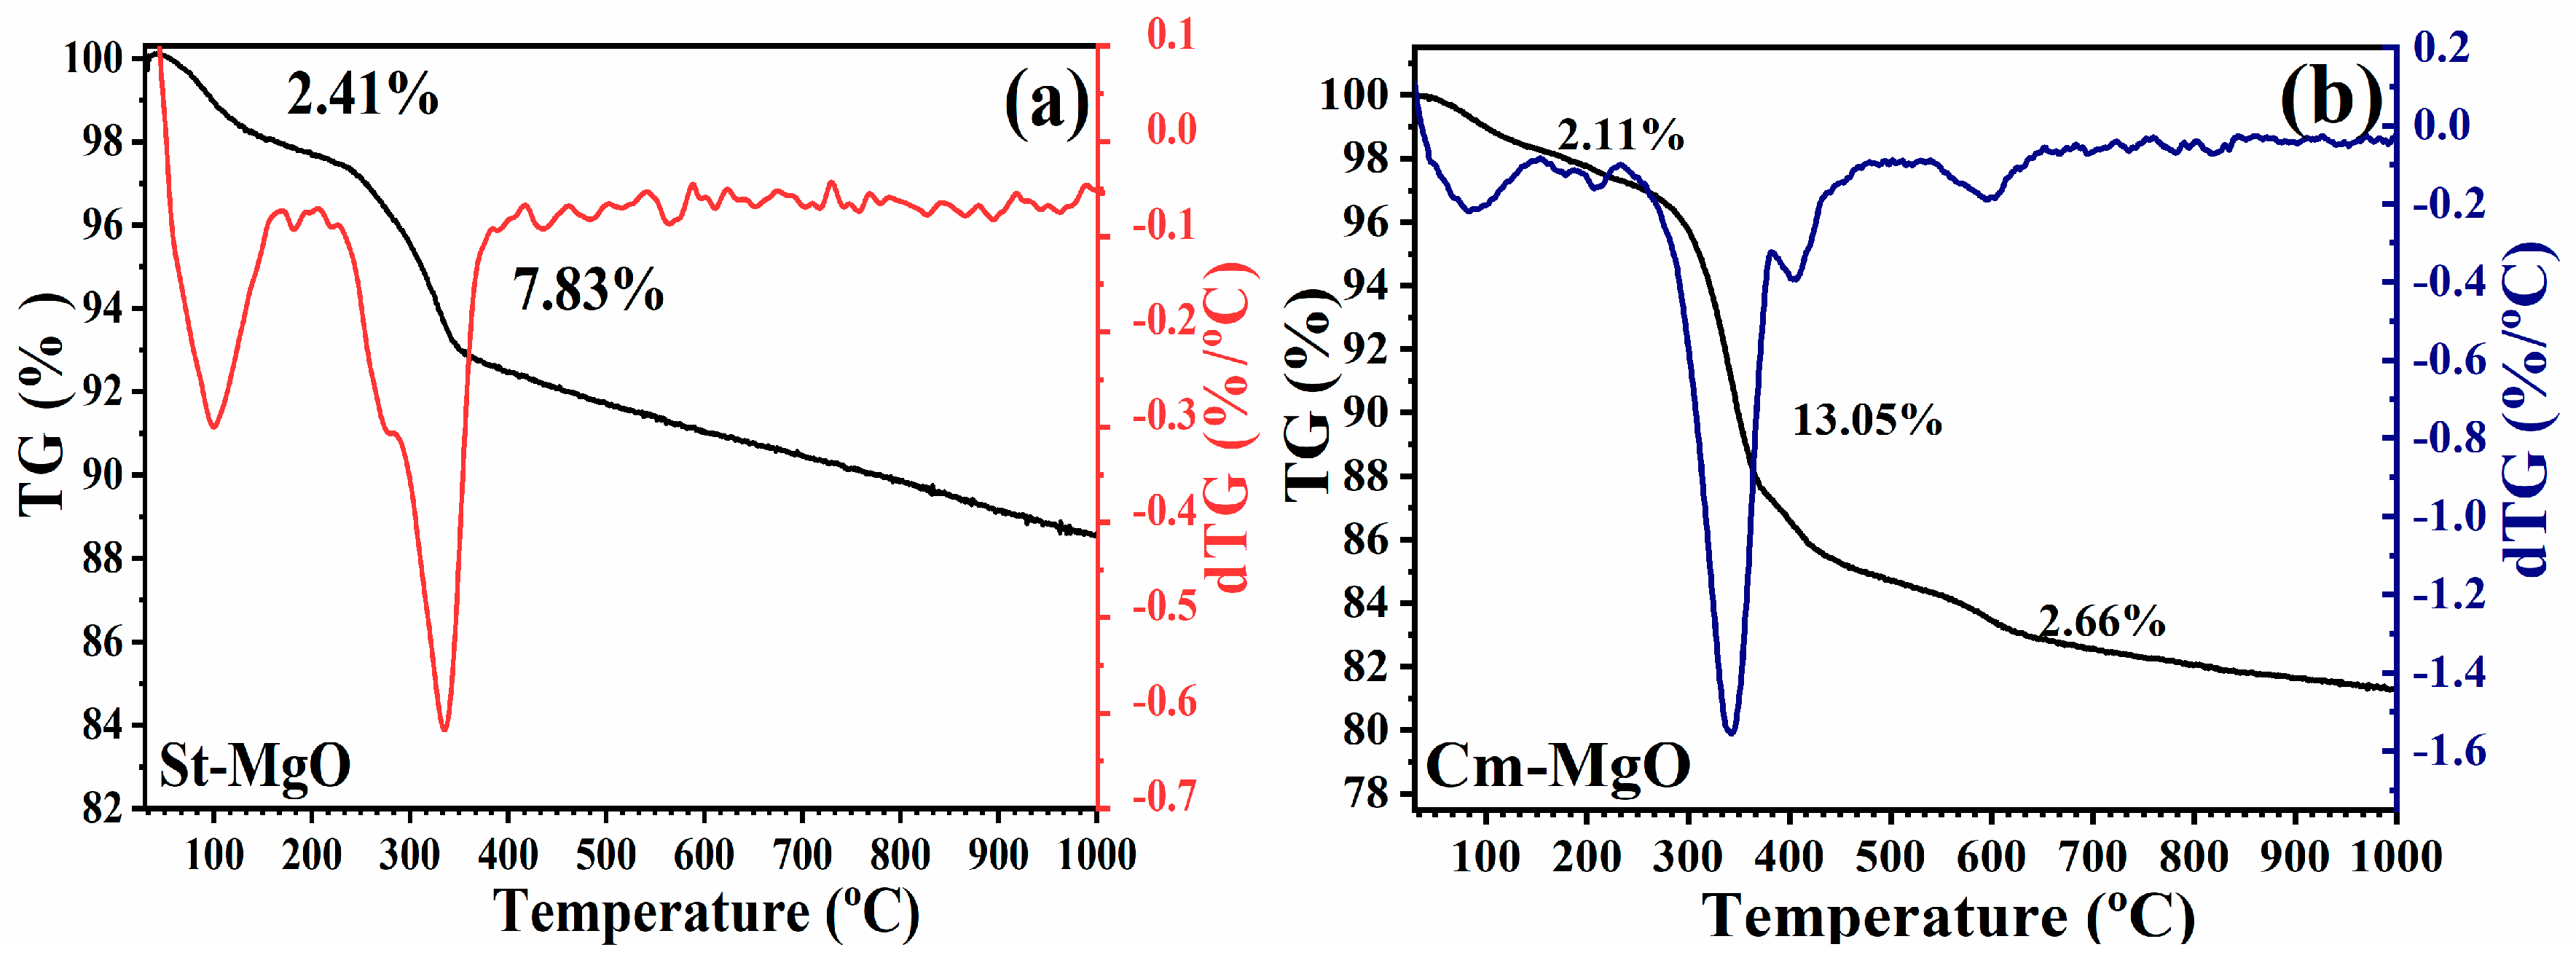
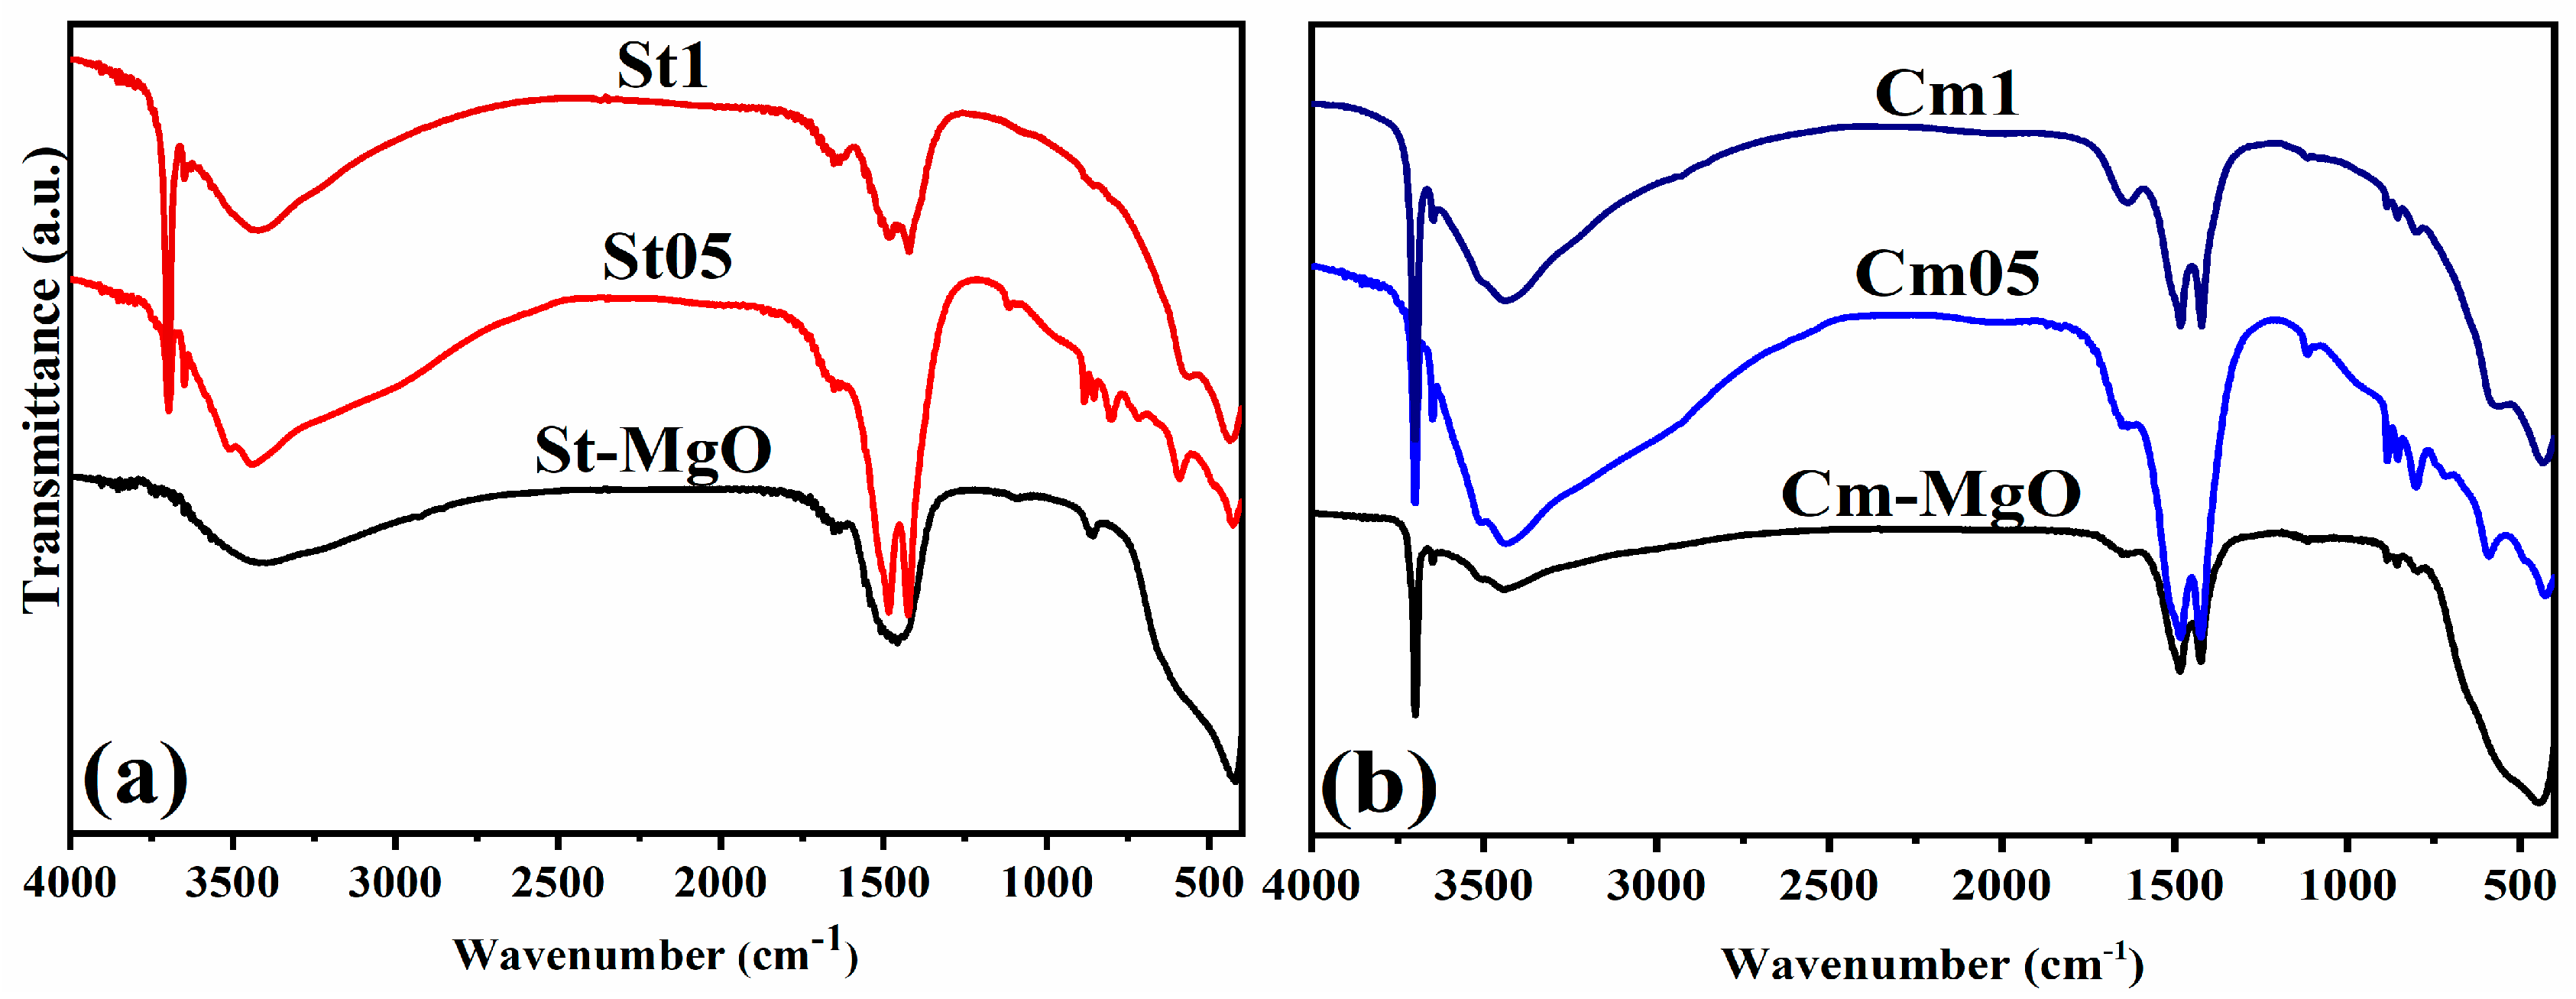
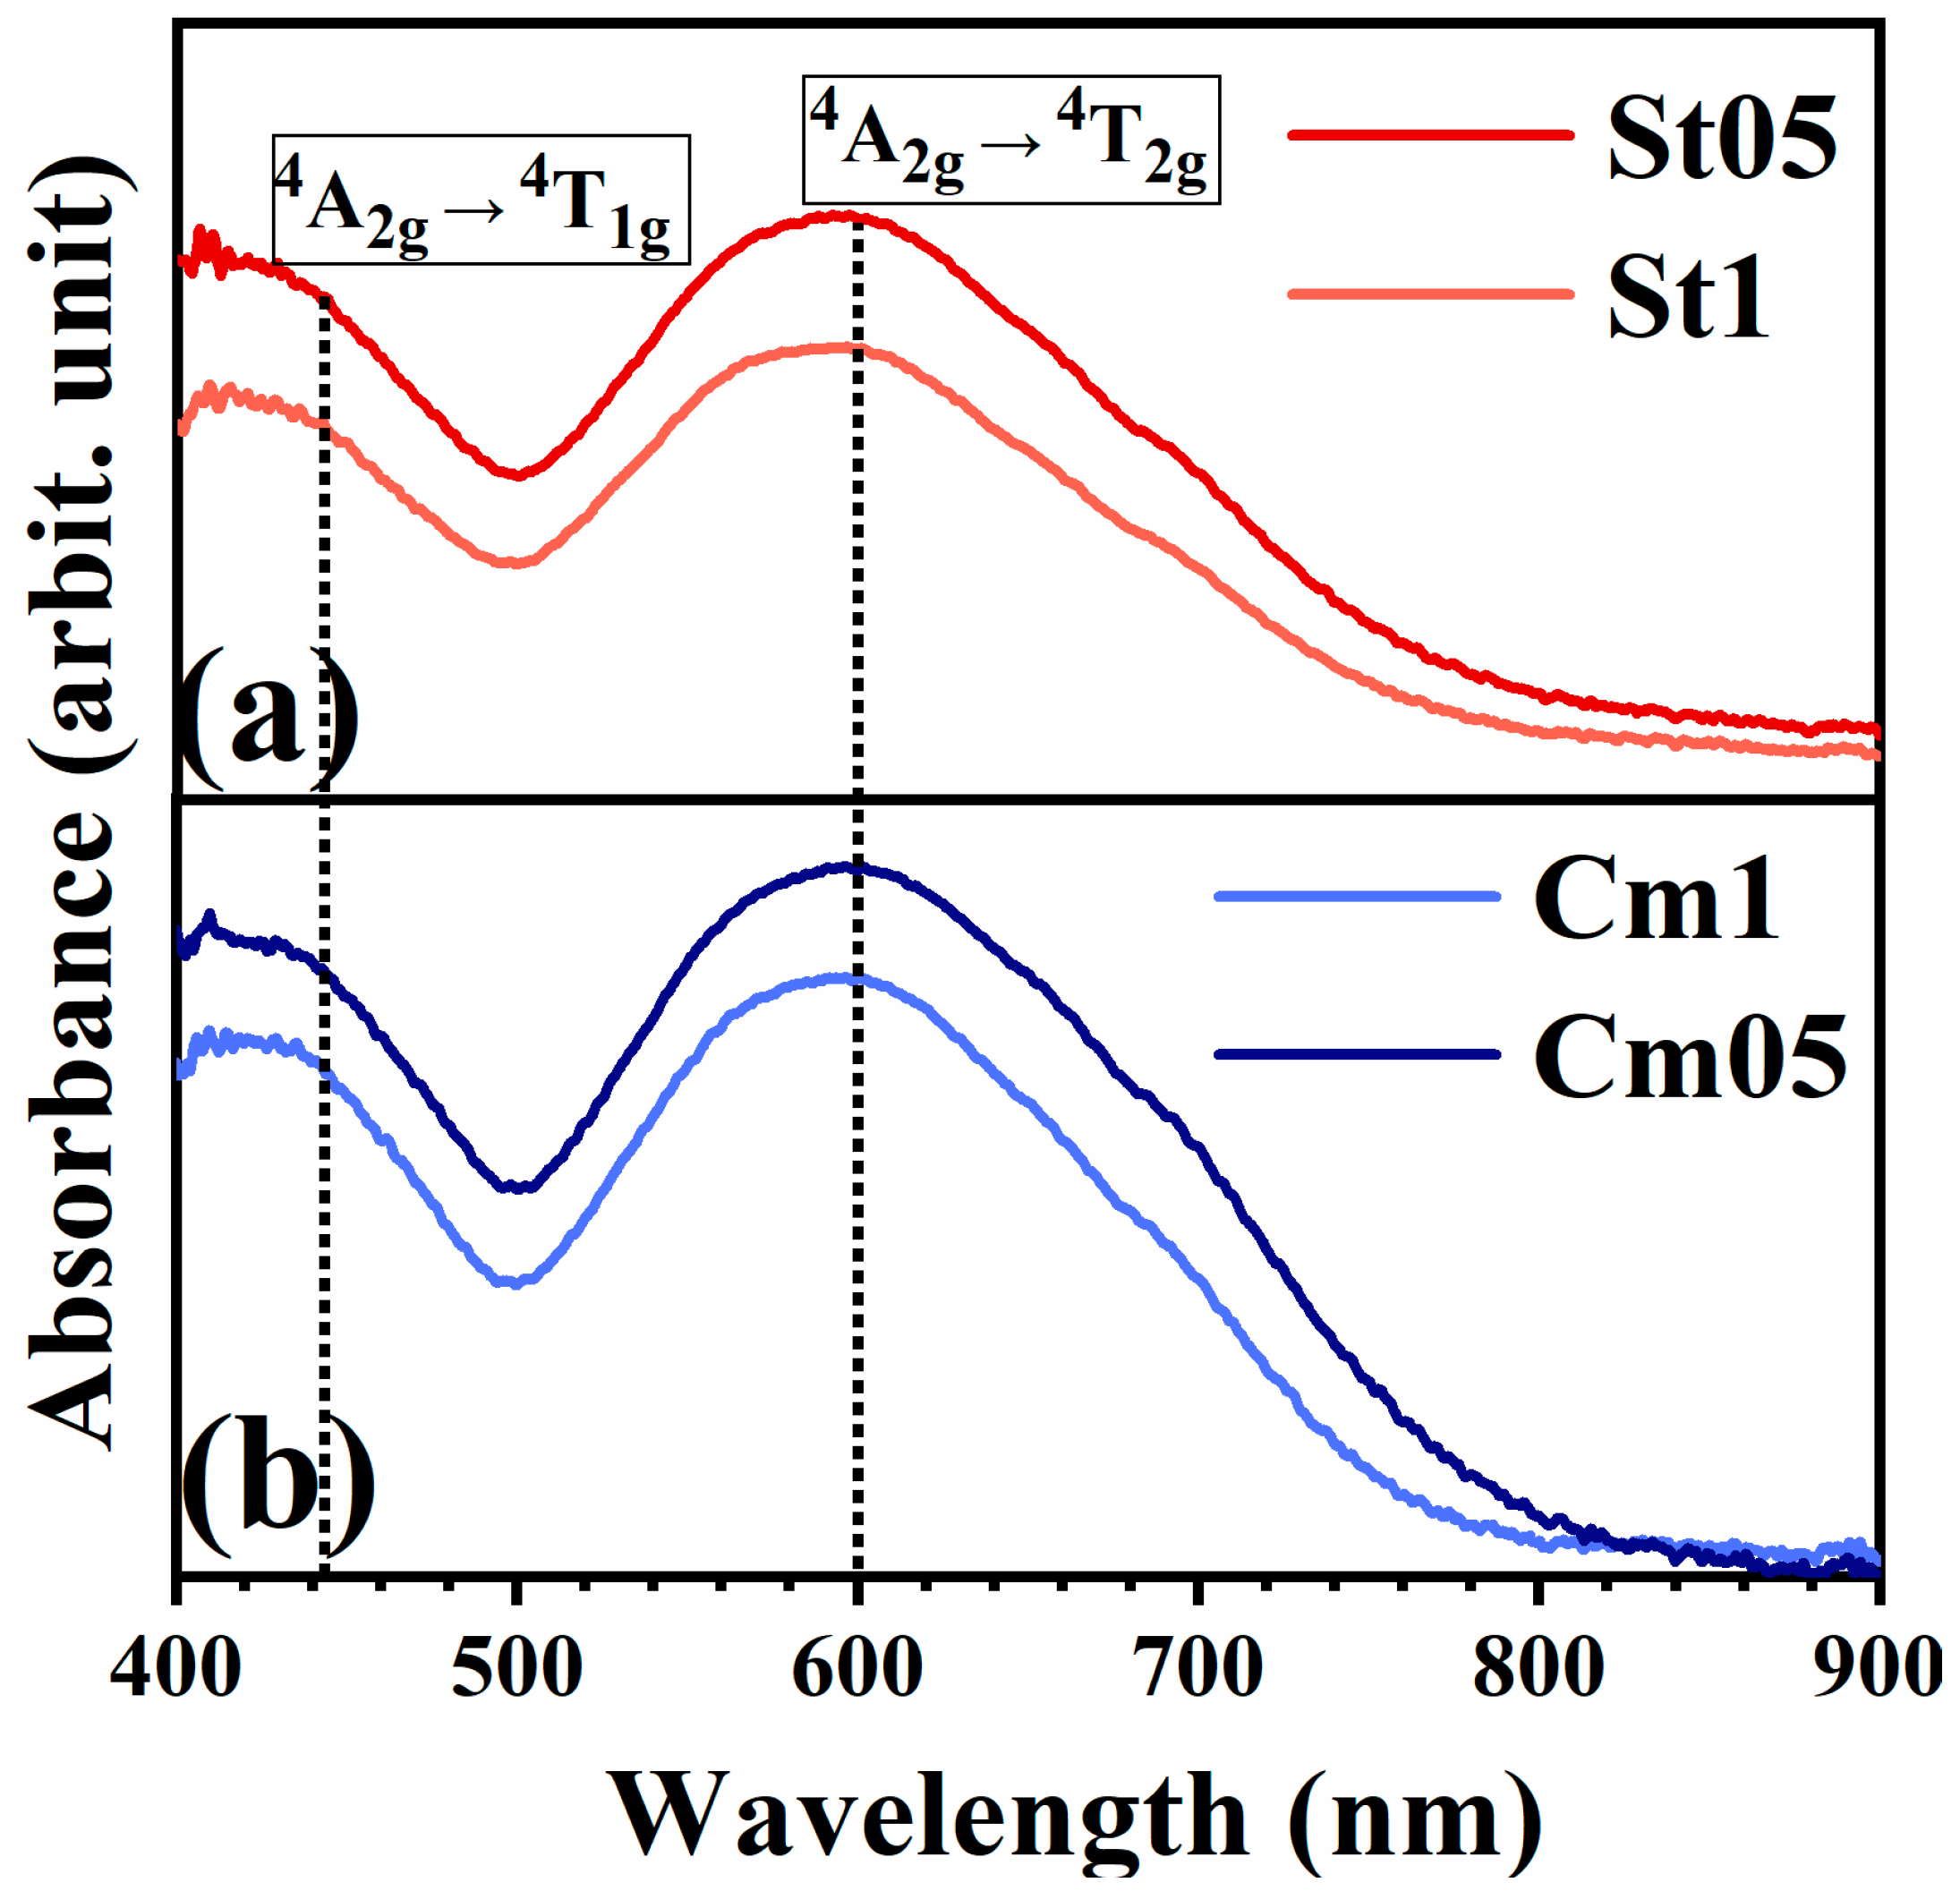
The nitrogen adsorption–desorption isotherms were obtained using the Quantachrome gas sorption analyzer, model NOVA 2000e, with NovaWin software 11.3. The samples were subjected to vacuum degassing at 200 °C or 250 °C for 2 h and 30 min and the analyses were carried out at liquid nitrogen temperature (−196.15 °C). The specific surface areas of the samples were calculated using the Brunauer–Emmet–Teller (BET) multi-point method. The pore volume and average pore radius were calculated by analyzing the desorption curve using the Barrett–Joyner–Halenda (BJH) model. The samples were characterized using a thermogravimetric analyzer (STA 6000 Perkin Elmer® thermal analyzer), with a temperature sweep from 30 to 1000 °C using a heating rate of 10 °C.min−1, in compressed air (20 mL.min−1), in an alumina crucible. The characterization by FTIR was performed using a Bruker Vertex 70 spectrophotometer using KBr pellets containing around 1% (w/w) of the samples, which were gently mixed and pressed at 10 tons. The spectra were collected in transmission mode by accumulating 32 scans in the region of 400–4000 cm−1, using a resolution of 2 cm−1. Electronic spectra were obtained using Ocean Optics USB-2000 equipment for solid samples, with a tungsten lamp, in the 400–900 nm region, in absorbance mode.
The samples were applied as pigments for commercial residential paint in the incorporation into colorless enamel-type paint, and the ratio of paint to water was 1:2 (w/w). The percentage of pigment for incorporation into the paint was 10% for the application of two coats on each plaster block. The colorimetric properties of the pigments in powder and dispersed in the paint were assessed according to the Commission Internationale de I’Eclairage (CIE) using the coordinates L*a*b*C* [20]. In this system, L* is the degree of clarity or darkness of the color, ranging from white (L* = 100) to black (L* = 0). Positive a* values correspond to the color red, while negative values correspond to green [20]. Finally, positive b* values correspond to yellow, while negative values correspond to blue. C* values are associated with chroma, which indicates the saturation of the material, and ∆E, which corresponds to color variation (Equation (2)).
E * = ( L ) 2 + ( a ) 2 + ( b ) 2

2.3. Color Stability Test

The materials were applied as pigments in colorless paints, using Anjo water-based acrylic resin, at a proportion of 10%, and the paint was applied in two coats on square plaster blocks measuring 5 cm on each side. The blocks were exposed to three environments, namely acidic and alkaline, and evaluated by colorimetric analysis at predetermined times. For acid and alkaline media, open Petri dishes containing 50 mL of a solution of hydrochloric acid or sodium hydroxide 3 mol L−1 were placed in the lower part of a desiccator, and the blocks were added to the upper part, exposed to the vapor of the acid or base. The stability test was adapted from Horsth et al. [21].

3. Results and Discussions

3.1. Crystallographic Phase by X-ray Diffractometry (XRD) before Cr Removal

The X-ray diffractograms of the synthesized and commercial magnesium oxide samples are shown in Figure 1. The main crystalline phase identified for both samples was periclase (MgO), according to the crystallographic chart (ICSD: 9863). The diffractogram shows a few peaks, the most intense and narrow with 2θ at around 42.89° in the (200) plane, which shows no apparent difference in intensity and broadening between the St-MgO (Figure 1a) and Cm-MgO (Figure 1b) samples. The other peaks with values of 36.7° (111); 62.2° (220); 74.5° (311); and 78.4° (222).
In the Cm-MgO (Figure 1b) diffractogram, a secondary phase was identified at 18.28° (001); 37.66° (101); 50.76° (102); and 58.50° (110) planes, associated with the brucite phase (Mg(OH)2) (ICSD: 34401), a hexagonal phase in the cubic structure of MgO, possibly generated by the hydration of the oxide by the humidity in the environment [22].
The crystallinity data showed no significant difference between the two samples (Table 2). However, for the Cm-MgO sample (89.7%), a larger average crystallite size (18.11 nm) was obtained, around 26.5% larger than that of the St-MgO sample, which shows the formation of larger particles, due to the possible use of higher temperatures in the formation of the commercial oxide, favoring the sintering of the particles [23].

3.2. Morphology by Scanning Electron Microscopy (SEM) before Cr Removal

Based on SEM images (Figure 2) of the Cm-MgO sample, the formation of overlapping irregular blade-type particles is observed, which indicates a certain tendency towards aggregation, agglomeration, and a rough surface of the particles (Figure 2a,b), a morphology that resembles that of the brucite phase [24], corroborating the XRD data.
The SEM images of the synthesized St-MgO oxide (Figure 2c,d) show rounded particles with undefined pseudo-spheres. The morphology of St-MgO is due to the gelatinization method of the colloidal starch suspension, which acts as a fuel and requires a lower calcination temperature compared to other traditional syntheses, influencing the porosity and agglomeration of the particles [18,25].

3.3. Surface Area Properties by B.E.T. Method

Figure 3 shows the nitrogen adsorption and desorption isotherms of the MgO samples. Both samples have type A isotherms, while the isotherm of the St-MgO sample has a characteristic type IVb shape which, according to the IUPAC classification, is related to reversible isotherms associated with micropores and smaller mesoporous particles (<40 Å) with conical shapes and closed cylinders at the ends of the pores [26].
For the St-MgO sample (Figure 3a), a hysteresis loop of the H4 type was observed by isotherm analysis, typical of materials with narrow spaces between particles, with N2 gas thus filling the pores [26,27]. For the commercial magnesium oxide (Figure 3b), the hysteresis loop is interpreted as type H3 for aggregates of overlapping particles forming plates, corroborating the SEM micrographs [28]. The curves show that the volume of gas adsorbed (Vmax) by the St-MgO sample was 3.72× greater than that for the Cm-MgO sample. This may be associated with the lower calcination temperature and the influence of the starch, resulting in a more porous material with a larger surface area.
The surface area data for both oxides, with St-MgO (43.93 m2/g) having the largest recorded area, are shown in Table 3. The synthesized oxide also had around four times more pore volume and a larger radius than the Cm-MgO sample. However, its classification is microporous, due to the pore radius being at the limit of the mesoporous classification between 20–500 Å [29].

3.4. Thermogravimetric Analysis (TGA/dTG)

The events and mass losses related to each MgO sample can be found in Table 4. The TGA/dTG curves for St-MgO (Figure 4a) and Cm-MgO (Figure 4b) demonstrate that a small loss of mass occurred for both at approximately 30 to 200 °C, corresponding to the elimination of adsorbed water, with a loss of 2.41% for St-MgO and 2.11% for Cm-MgO. For the St-MgO sample (Figure 4a), a second event occurred at approximately 326 °C, with a loss of 7.83% of the mass, which is related to the stabilization of the anhydrous MgO molecule [30].
The Cm-MgO sample (Figure 4b) indicated the greatest mass loss between 200–500 °C, being 13.05%, resulting from the decomposition of the small fraction of Mg(OH)2 present in the sample, corroborating with the XRD data, characterizing the decomposition of the brucite phase to the periclase phase. Finally, an event occurred between 500–700 °C due to the formation of the anhydrous phase of MgO, with a mass loss of 2.66%. Almost no mass loss can be observed above 800 °C, suggesting that the formation of crystalline MgO has been completed [30].

3.5. Chemical Composition by ICP-OES

The results of the magnesium and chromium contents obtained for the samples before and after chromium adsorption are presented in Table 5. It is possible to observe that the initial samples did not present chromium in the composition, but after adsorption, chromium is present. The St05 and Cm05 samples presented a higher chromium content than the St1 and Cm1 samples because the adsorption was carried out maintaining the volume of the solution containing chromium and varying the amount of added material and the St05 and Cm05 samples correspond to the lowest fraction of added material. However, it was observed that the commercial samples Cm05 and Cm1 had a higher chromium content than when the synthesized sample (St-MgO) was applied. The higher chromium content removed by the Cm-MgO sample may have influenced the crystallinity of the sample (Figure 5), the peaks in XRD are wider and less intense, compared to the sample used in adsorption. Furthermore, there was an incidence of new signals in the region of 20 to 35° of 2θ in the diffractogram, indicating that they could be phases related to chromium.
The values obtained for chromium removal can be compared to studies reported in the literature with materials typically used for Cr3+ and Cr6+ removal, as shown in Table 6. In addition, the adsorption capacity of Cr3+ by MgO can be highlighted by the ion exchange process that occurs when MgO is added to different concentrations of Cr3+ ion solutions [14].
In Cr(VI) removal studies by Alvares et al. [31], zeolites were used in a discontinuous system for tannery effluent, opting for 0.0057 mg/g in the removal tests, with considerably low values. Li et al. [32] used mixed aluminum–magnesium hydroxide (AMH) nanoparticles with various molar ratios of Mg/Al prepared by coprecipitation to remove hexavalent Cr, obtaining values of 105.3 to 112.0 mg/g. The studies by Selimin et al. [33] using natural hydroxyapatite (HAp) from black tilapia scales investigated its efficiency as an adsorbent for removing Cr(VI), reaching a capacity of 1.382 mg/g. Seif et al. [16] obtained an excellent removal performance of Cr(III) ions from aqueous solutions of magnesium oxide (MgO) and montmorillonite nanoparticles (NPs) in different proportions, in which the highest amount of montmorillonite obtained a value of 1033.8 mg/g. Recently, Alghamdi et al. [34] used layered double hydroxides with biochar derived from date palm waste (Mg/Fe-LDH-BC) and evaluated their efficiency in removing Cr(VI), obtaining the highest value of 45.05 mg/g.
According to Balaba et al. [14], the metal removal mechanism by MgO involves at least three steps, shown in Equations (3)–(5).
MgO(s) + H2O → Mg(OH)2(s)
3MgO(s) + 2Cr+3Cl3(aq) → xCr2O3(s) + 3Mg(1−x)O(s) + 6Cl
2Mg(OH)2 + Cr+3Cl3(aq) → xCr(OH)2 + 2Mg(1−x)(OH)2 + 6Cl
Equation (3) shows the auto-hydrolysis of periclase (MgO) forming the brucite phase (Mg(OH)2). Equation (4) shows Cr3+ ions in aqueous media interacting with the periclase phase to form chromium(III) oxide. Equation (5) shows the formation of chromium(III) hydroxide. According to Pearson’s Hard and Soft Acid–Base concepts [35], the chromium(III) ion is hard acidic enough to react with the hard base hydroxide ion, rather than the soft base chloride ion.

3.6. Crystallographic Phase by X-ray Diffractometry (XRD) after Cr Removal

The X-ray diffractograms of the samples before and after the removal of the chromium ions, for comparison, show changes in the structure due to the incorporation of chromium (Figure 5). For all materials, there was a transformation from the periclase phase of magnesium oxide to the majority hexagonal brucite phase (Mg(OH)2) according to the crystallographic chart (ICSD: 34401); cation exchange occurred (Mg2+ by Cr3+) as well as the formation of a layered compound (Figure 5c). Evidence of the insertion of chromium into the oxide structure through ion exchange is the proximity of the ionic radii of Mg2+ (0.65 Å) and Cr3+ (0.62 Å), corroborating with the ICP-OES data; as the concentration of Cr increases, there is a decrease in Mg ions.
All samples presented a layered structure, characterized by the presence of diffraction peaks (peak 001) referring to the basal reflection planes relative to the stacking of the layers [36]; from the position of the diffraction peaks, it was possible to calculate the basal distance of the layers (Table 7). Starch samples have higher peak intensity, which indicates greater crystallinity and a greater sequence of stacking of the layers than commercial samples, and the low intensity indicates a decrease in crystallinity (Table 7). The broadening of the peaks indicates disordered stacking of the layers [23], or imperfections in the crystalline lattice, which can, thus, cause micro-deformations resulting in changes in the lattice parameters [37].
The crystallinity of the materials obtained was determined by Bruker’s EVA® software version 1.1 (Table 7); the calculation of the average size of the crystals was given by the Scherrer equation, using the minimum value of K (0.9 and 1.3) for calculations of average crystallite size from the width of the highest intensity peak (peak 101) at half height. We can observe that as there is variation in chromium in the structure of Cm1 and Cm05 samples; both showed and maintained a decrease in crystallinity. However, for the St1 and St05 samples, with the greater amount of chromium in the structure, an increase in the degree of crystallinity and crystallite size was evident, which indicates greater stability in the crystalline structure [38].
Basal distances can also be obtained from X-ray diffractometry data through Bragg’s law equation (using the 001 plane). No major changes were observed in the basal distance (in nm) between the samples and the values obtained coincide with the basal distance values of brucite and compounds originating from brucite (0.48 nm) [39].

3.7. Vibrational Spectroscopy by FTIR

The IR spectra of MgO samples before and after adsorption are shown in Figure 6. The samples showed many similarities, such as the broadband at 3420 cm−1 which is attributed to the stretching of the O–H bond of water molecules physiosorbed in the samples. In the Cm-MgO sample and the samples after chromium adsorption, a signal at 3649 cm−1 and a narrow and intense signal at 3699 cm−1 are observed, which are attributed to the stretching of the O–H bond of the brucite structure [40,41], corroborating the XRD data (Figure 5) that shows a mixture of brucite and periclase phases in Cm-MgO.
The St-MgO sample, which only presented the periclase phase, did not present the bands referring to the brucite O–H bond (Figure 6a). However, after chromium adsorption, in which the periclase phase changes to brucite, bands at 3649 cm−1 and 3699 cm−1 are observed. The samples also showed deformation bands of the O–H bond at 1650 cm−1 and 1484 cm−1 and bands of CO32− adsorbed on the surface of the material when exposed to the environment, located at 2373 cm−1, 1423 cm−1, and 855 cm−1 [42,43,44]. In the region below 1000 cm−1, bands attributed to Mg–O bonds are observed [42,45,46].

3.8. Morphology by Scanning Electron Microscopy (SEM) after Cr Removal

Figure 7 shows the SEM images of the MgO samples. The St1 (Figure 7a) and Cm1 samples (Figure 7b), after the insertion of chromium ions, showed nano-leaf morphologies, due to the change in structure from periclase to brucite [47]. For the sample St05 (Figure 7c), in addition to the lamellae, there is also the aggregation of the particles and the formation of a rough, irregular surface. For sample Cm05 (Figure 7d), no significant change in morphology was observed.
The difference in morphology before and after the insertion of trivalent ions into the structure is due to the phase transformation to magnesium hydroxide with a lamellar structure, which proves the formation of nano-leaf layers [48].

3.9. Application as Pigments

3.9.1. VIS-NIR Spectroscopy—Green Pigments

Chromium is a paramagnetic ion, as it coexists in different oxidation states (Cr3+, Cr4+, Cr5+, Cr6+); the most stable states are found in the form of Cr6+ and Cr3+ [48]. Two of the three spin-quartet bands allowed in the ligand field spectra (Figure 8) for chromium could be identified [48,49].
Chromium(III) ions are known to preferentially occupy octahedral sites forming the two bands observed (Figure 8a,b), reflecting the greater stabilization at these sites, and the color of pigments and position of the absorption bands depend on the ligand’s field strength [50]. For all the samples, the characteristic absorption bands located at approximately 440 nm and 600 nm were observed for both the starch-based MgO pigments (St1 and St05) represented in Figure 8a and the commercial MgO-based pigments (Cm1 and Cm05) represented in Figure 8b, characteristic of Cr(III) ions attributed to the allowed cubic d–d octahedral spin transitions: 4A2g(F) → 4T1g(F) and 4A2g(F) → 4T2g(F), respectively, present for all samples [51,52].
The Cr3+ ion has the 3d3 electronic configuration of an octahedral system (Oh) for the first lowest energy cubic band at 600 nm, 4T2g (t2g eg) of the 4A2g4T2g transition, which is a direct measure of the strength of the 10 Dq crystal field, and for the second highest energy band at 440 nm, also of an octahedral system, 4T1g(t2g eg) for the 4A2g4T1g transition [53].

3.9.2. Colorimetry (CIE L*a*b*C*h*)—Green Pigments

The chromatic properties of the pigments obtained were evaluated according to the CIEL* a*b*C*h* color coordinate values and are listed in Table 8. According to the colorimetric data of the powders, a green coloration is observed, as they have negative a* and b* values located in the green/blue quadrant attributed to the insertion of chromium ions; the St05 and Cm05 materials with a higher concentration of dopant ions have more negative a* associated with the blue color variation (negative b*) shown in Table 8. The highest luminosity (L*) was obtained by the St1 pigment, which had the highest hue angle value (h*), while Cm05 had the highest saturation value (C*).
Table 9 shows the colorimetric data of the plaster blocks with the pigments applied in colorless commercial paint (1:5, paint:water ratio). When analyzing the dispersed pigments, all the samples shifted towards the green/yellow quadrant. The most negative a* value was observed for sample Cm05 as well as the highest value of the angle referring to hue (h*), which is closer to green in color. Some samples have a lower luminosity value (L*), i.e., the incorporation of the pigment into the paint made them lighter. There was little variation in saturation (C*) between the samples and there was a decrease in the hue angle (h*) between the powders and the blocks, showing the influence of the paint on the coloring of the pigments. The results of the colorimetric analysis are consistent with the data obtained by ICP-OES, where the St05 and Cm05 samples that presented a higher chromium content presented darker and greener tones than the St1 and Cm1 samples.

3.9.3. Color Stability in an Acidic Environment

The plaster blocks painted with pigmented paint were subjected to color stability evaluation in an acidic environment (HCl) with exposures of 24, 120, and 240 h (Table 10). The clear paint used showed a total color variation (ΔE) within the maximum time of 240 h (comparing before and after acid exposure) of 2.27. The highest color stability observed was for pigment St1, with a total color variation of 0.78. In an acidic environment, brucite (Mg(OH)2) itself is susceptible to dissolution. Hydrogen ions (H+) present in the acid medium can react with hydroxide ions (OH) in brucite, resulting in water (H2O) and magnesium ions (Mg2+). This reaction has the potential to decompose brucite in an acid medium. However, the presence of chromium ions in smaller quantities within the brucite structure can make it more stable. In an acidic atmosphere, the trivalent chromium ion can undergo reduction to Cr2+, form complexes with OH- ions, and react with H+ ions to form water and Cr2+ ions [54].

3.9.4. Color Stability in an Alkaline Environment

Exposure to an alkaline atmosphere (Table 11) was also conducted, and after 240 h, the clear paint showed a total color difference (ΔE) of 2.19, whereas the smallest difference was observed for sample Cm1. Considering the alkaline atmosphere, the Cr3+ ion can form complexes with hydroxide ions (OH), resulting in substances such as chromium hydroxide [55]; this could be a justification for the lower stability exhibited by the pigments in this environment.
In general, the pigments showed weak color variations [56], demonstrating that it is possible to apply materials as a pigment after the adsorption of chromium ions, as they are color-stable in aggressive atmospheres.

4. Conclusions

The method used to synthesize magnesium oxide from gelatinization with cassava starch proved to be a simple, efficient, low-cost, and reproducible process for obtaining porous oxides.
The X-ray diffractometry (XRD) results identified the formation of single-phase materials (periclase) and crystallinity equal to that of the commercial oxide used as a reference, even when synthesized at relatively low temperatures. This, together with the method of using starch in the reaction medium, led to the formation of magnesium oxide with greater porosity. The SEM images show how the method used can produce different morphologies, such as pseudo-spheres for the synthesized oxide and irregular plates for the commercial oxide. The use of both oxides for the removal of chromium ions had excellent results, with the transformation of the periclase phase to lamellar hydroxides with a hexagonal brucite phase confirmed by FTIR. The data obtained by ICP-OES showed that the samples had values close to the number of magnesium ions before removal, but as the chromium ions were added to the structure, the amount of magnesium decreased, corroborating the ion exchange in the structure. For the SEM data, the morphology obtained was nano-sheets for the green pigments formed from the commercial oxide and rough surface aggregates for the pigments based on the oxide synthesized with starch. The colorimetric properties of the pigments obtained in powder form and applied to colorless paint were analyzed by colorimetry and it was estimated that sample Cm05 was greener than the other pigments (higher negative a* value), both for the powdered samples and when applied to paint. This can be explained by the fact that sample Cm05 had a higher number of chromium ions in mg/g in the structure. After being applied to paint and plaster blocks, the samples were tested for color stability in acidic and basic media, showing little color variation (∆E) after exposure for 240 h.
In terms of the use of chromium (a contaminating heavy metal) as pigments, in an aqueous medium, this pollutant would be more susceptible to mobility, thus affecting a larger contamination area. Depending on the concentration, it would affect the soil near rivers and lakes. When removed from the aqueous medium by MgO nanoparticles, magnesium is substituted by the contaminating chromium ions, due to the ionic proximity between them. Therefore, by removing the harmful Cr3+ ions and trapping them in the structure, the Mg2+ ions are released, which is favorable to the environment. This concluded that it was feasible to prepare magnesium oxide and use it as a material to remove chromium from water as contaminating metal ions and then apply it as a pigment in commercial paint.
As prospects, the work could still encompass other methods to test the stability of chromium ions in the MgO structure, both in powdered pigment and in color stability and photoaging tests. It could also be explored for application as pigments in other dispersion media, such as in ceramic matrices and epoxy resins.

Author Contributions

Conceptualization, N.B. and F.J.A.; methodology, N.B., J.d.O.P. and D.F.L.H.; formal analysis, N.B., J.d.O.P., A.R.S., S.J. and D.F.L.H.; investigation, N.B. and S.J.; resources, F.J.A. and C.B., data curation, N.B., J.d.O.P., A.R.S., S.J. and D.F.L.H.; writing—original draft preparation, N.B., J.d.O.P., A.R.S., S.J., D.F.L.H. and F.J.A.; writing—review and editing, N.B., A.R.S., C.B. and F.J.A.; visualization, N.B. and F.J.A.; supervision, F.J.A.; project administration, F.J.A. and C.B.; funding acquisition, F.J.A. and C.B. All authors have read and agreed to the published version of the manuscript.

Funding

N.B. appreciates Capes for a graduate scholarship. F.J.A. is thankful for a CNPq Productivity grant (310815/2022-3) and the grants CNPq (427127/2018-1). F.J.A. and C.B. are thankful for a WBI/Confap-Fundação Araucária (BEL2023081000001).

Data Availability Statement

The data presented in this study are available on request from the corresponding author.

Acknowledgments

The authors would like to thank the following agencies for their support: Capes, CNPq, Finep, and Fundação Araucária.

Conflicts of Interest

The authors declare no conflicts of interest.

References

  1. Subtil, E.L.; Mierzwa, J.C.; Hespanhol, I. Comparison between a Conventional Membrane Bioreactor (C-MBR) and a Biofilm Membrane Bioreactor (BF-MBR) for Domestic Wastewater Treatment. Braz. J. Chem. Eng. 2014, 31, 683–691. [Google Scholar] [CrossRef]
  2. Silva, J.A. Wastewater Treatment and Reuse for Sustainable Water Resources Management: A Systematic Literature Review. Sustainability 2023, 15, 10940. [Google Scholar] [CrossRef]
  3. da Cruz, L.P.V. Principais Técnicas de Tratamentos de Águas Residuais. Millenium 1997. Available online: https://repositorio.ipv.pt/bitstream/10400.19/724/1/Principais%20t%C3%A9cnicas%20de%20tratamentos.pdf (accessed on 12 January 2024).
  4. Wang, S.; Choi, J.H. Simulating Fate and Transport of Chromium in Saturated Sediments. Appl. Math. Model. 2013, 37, 102–111. [Google Scholar] [CrossRef]
  5. Sharma, P.; Singh, S.P.; Parakh, S.K.; Tong, Y.W. Health Hazards of Hexavalent Chromium (Cr (VI)) and Its Microbial Reduction. Bioengineered 2022, 13, 4923–4938. [Google Scholar] [CrossRef]
  6. Dias, C.A.; Da Costa, A.S.V.; Guedes, G.R.; de Matos Umbelino, G.J.; de Sousa, L.G.; Alves, J.H.; Silva, T.G.M. Impactos Do Rompimento Da Barragem de Mariana Na Qualidade Da Água Do Rio Doce/Samarco’sdam Failure and Its Consequences for the Quality of the Doce River Water. Rev. Espinhaço 2018, 7, 21–35. [Google Scholar]
  7. Vidu, R.; Matei, E.; Predescu, A.M.; Alhalaili, B.; Pantilimon, C.; Tarcea, C.; Predescu, C. Removal of Heavy Metals from Wastewaters: A Challenge from Current Treatment Methods to Nanotechnology Applications. Toxics 2020, 8, 101. [Google Scholar] [CrossRef] [PubMed]
  8. Neef, C.; Meyer, H.P.; Klingeler, R. Morphology-Controlled Two-Step Synthesis and Electrochemical Studies on Hierarchically Structured LiCoPO4. Solid. State Sci. 2015, 48, 270–277. [Google Scholar] [CrossRef]
  9. Sahu, S.K.; Meshram, P.; Pandey, B.D.; Kumar, V.; Mankhand, T.R. Removal of Chromium(III) by Cation Exchange Resin, Indion 790 for Tannery Waste Treatment. Hydrometallurgy 2009, 99, 170–174. [Google Scholar] [CrossRef]
  10. Elabbas, S.; Mandi, L.; Berrekhis, F.; Pons, M.N.; Leclerc, J.P.; Ouazzani, N. Removal of Cr(III) from Chrome Tanning Wastewater by Adsorption Using Two Natural Carbonaceous Materials: Eggshell and Powdered Marble. J. Environ. Manag. 2016, 166, 589–595. [Google Scholar] [CrossRef] [PubMed]
  11. Bindhu, M.R.; Umadevi, M.; Kavin Micheal, M.; Arasu, M.V.; Abdullah Al-Dhabi, N. Structural, Morphological and Optical Properties of MgO Nanoparticles for Antibacterial Applications. Mater. Lett. 2016, 166, 19–22. [Google Scholar] [CrossRef]
  12. Veiga, J.P.S.; Valle, T.L.; Feltran, J.C.; Bizzo, W.A. Characterization and Productivity of Cassava Waste and Its Use as an Energy Source. Renew. Energy 2016, 93, 691–699. [Google Scholar] [CrossRef]
  13. Brito, G.F.; Agrawal, P.; Araujo, E.M.; Melo, J.J.A. Biopolímeros, Polímeros Biodegradáveis e Polímeros Verdes, Revista Eletrônica de Materiais e Processos. Rev. Eletrônica Mater. Process. 2011, 6, 127–139. [Google Scholar]
  14. Balaba, N.; Horsth, D.F.L.; Correa, J.d.S.; Primo, J.d.O.; Jaerger, S.; Alves, H.J.; Bittencourt, C.; Anaissi, F.J. Eco-Friendly Polysaccharide-Based Synthesis of Nanostructured MgO: Application in the Removal of Cu2+ in Wastewater. Materials 2023, 16, 693. [Google Scholar] [CrossRef]
  15. Naveed, M.; Makhdoom, S.I.; ur Rehman, S.; Aziz, T.; Bashir, F.; Ali, U.; Alharbi, M.; Alshammari, A.; Alasmari, A.F. Biosynthesis and Mathematical Interpretation of Zero-Valent Iron NPs Using Nigella Sativa Seed Tincture for Indemnification of Carcinogenic Metals Present in Industrial Effluents. Molecules 2023, 28, 3299. [Google Scholar] [CrossRef] [PubMed]
  16. Seif, S.; Marofi, S.; Mahdavi, S. Removal of Cr3+ Ion from Aqueous Solutions Using MgO and Montmorillonite Nanoparticles. Environ. Earth Sci. 2019, 78, 377. [Google Scholar] [CrossRef]
  17. Xiong, C.; Wang, W.; Tan, F.; Luo, F.; Chen, J.; Qiao, X. Investigation on the Efficiency and Mechanism of Cd(II) and Pb(II) Removal from Aqueous Solutions Using MgO Nanoparticles. J. Hazard. Mater. 2015, 299, 664–674. [Google Scholar] [CrossRef] [PubMed]
  18. Primo, J.d.O.; Borth, K.W.; Peron, D.C.; Teixeira, V.d.C.; Galante, D.; Bittencourt, C.; Anaissi, F.J. Synthesis of Green Cool Pigments (CoxZn1-XO) for Application in NIR Radiation Reflectance. J. Alloys Compd. 2019, 780, 17–24. [Google Scholar] [CrossRef]
  19. Cullity, B.D.; Stock, S.R. Elements of X-ray Diffraction, 3rd ed.; Hall, P., Ed.; Addison-Wesley: Boston, MA, USA, 2001; ISBN 0201610914/9780201610918. [Google Scholar]
  20. Quindici, M. O Segredodas Cores; All Print: São Paulo, Brazil, 2013; ISBN 13-08586. [Google Scholar]
  21. Horsth, D.F.L.; Primo, J.d.O.; Balaba, N.; Anaissi, F.J.; Bittencourt, C. Color Stability of Blue Aluminates Obtained from Recycling and Applied as Pigments. RSC Sustain. 2023, 1, 159–166. [Google Scholar] [CrossRef]
  22. Moulavi, M.H.; Kale, B.B.; Bankar, D.; Amalnerkar, D.P.; Vinu, A.; Kanade, K.G. Green Synthetic Methodology: An Evaluative Study for Impact of Surface Basicity of MnO2 Doped MgO Nanocomposites in Wittig Reaction. J. Solid State Chem. 2019, 269, 167–174. [Google Scholar] [CrossRef]
  23. Souza, T.M.; Braulio, M.A.L.; Bonadia, P.; Pandolfelli, V.C. Magnesia Hydration and Its Binder Effect on Cement-Free Refractory Castables. Ceramica 2013, 59, 206–215. [Google Scholar] [CrossRef]
  24. Pilarska, A.A.; Klapiszewski, Ł.; Jesionowski, T. Recent Development in the Synthesis, Modification and Application of Mg(OH)2 and MgO: A Review. Powder Technol. 2017, 319, 373–407. [Google Scholar] [CrossRef]
  25. Alhaji, A.; Razavi, R.S.; Ghasemi, A.; Loghman-Estarki, M.R. Modification of Pechini Sol–Gel Process for the Synthesis of MgO-Y2O3 Composite Nanopowder Using Sucrose-Mediated Technique. Ceram. Int. 2017, 43, 2541–2548. [Google Scholar] [CrossRef]
  26. Thommes, M.; Kaneko, K.; Neimark, A.V.; Olivier, J.P.; Rodriguez-Reinoso, F.; Rouquerol, J.; Sing, K.S.W. Physisorption of Gases, with Special Reference to the Evaluation of Surface Area and Pore Size Distribution (IUPAC Technical Report). Pure Appl. Chem. 2015, 87, 1051–1069. [Google Scholar] [CrossRef]
  27. Andrade, T.M.; Danczuk, M.; Anaissi, F.J. Effect of Precipitating Agents on the Structural, Morphological, and Colorimetric Characteristics of Nickel Hydroxide Particles. Colloids Interface Sci. Commun. 2018, 23, 6–13. [Google Scholar] [CrossRef]
  28. Ramimoghadam, D.; Zobir, M.; Hussein, B.; Hin Taufiq-Yap, Y. Hydrothermal Synthesis of Zinc Oxide Nanoparticles Using Rice as Soft Biotemplate. Chem. Cent. J. 2013, 7, 136. [Google Scholar] [CrossRef] [PubMed]
  29. Sing, K.S.W.; Rouquerol, F.; Rouquerol, J.; Llewellyn, P. Assessment of Mesoporosity. In Adsorpion by Powders and Porous Solids: Principles, Methodology and Applications, 2nd ed.; Elsevier Inc.: Amsterdam, The Netherlands, 2013; pp. 269–302. ISBN 9780080970356. [Google Scholar]
  30. Khamkongkaeo, A.; Mothaneeyachart, N.; Sriwattana, P.; Boonchuduang, T.; Phetrattanarangsi, T.; Thongchai, C.; Sakkomolsri, B.; Pimsawat, A.; Daengsakul, S.; Phumying, S.; et al. Ferromagnetism and Diamagnetism Behaviors of MgO Synthesized via Thermal Decomposition Method. J. Alloys Compd. 2017, 705, 668–674. [Google Scholar] [CrossRef]
  31. Álvarez, A.M.; Guerrón, D.B.; Montero Calderón, C. Natural Zeolite as a Chromium VI Removal Agent in Tannery Effluents. Heliyon 2021, 7, e07974. [Google Scholar] [CrossRef]
  32. Li, Y.; Gao, B.; Wu, T.; Sun, D.; Li, X.; Wang, B.; Lu, F. Hexavalent Chromium Removal from Aqueous Solution by Adsorption on Aluminum Magnesium Mixed Hydroxide. Water Res. 2009, 43, 3067–3075. [Google Scholar] [CrossRef] [PubMed]
  33. Selimin, M.A.; Latif, A.F.A.; Lee, C.W.; Muhamad, M.S.; Basri, H.; Lee, T.C. Adsorption Efficiency of Hydroxyapatite Synthesised from Black Tilapia Fish Scales for Chromium (VI) Removal. Mater. Today Proc. 2022, 57, 1142–1146. [Google Scholar] [CrossRef]
  34. Alghamdi, A.G.; Ahmad, J.; Alasmari, Z.; Ibrahim, H.M. Removal of Hexavalent Chromium from Contaminated Soil and Water by Mg/Fe Layered Double Hydroxide and Its Composite with Biochar. Arab. J. Geosci. 2023, 16, 145. [Google Scholar] [CrossRef]
  35. Rayner-Canham, G.; Overton, T. Química Inorgânica Descritiva; LTC: Rio de Janeiro, RJ, Brazil, 2015; pp. 120–122. ISBN 978-85-216-2823-1. [Google Scholar]
  36. Todan, L.; Predoană, L.; Petcu, G.; Preda, S.; Culiță, D.C.; Băran, A.; Trușcă, R.D.; Surdu, V.A.; Vasile, B.Ș.; Ianculescu, A.C. Comparative Study of MgO Nanopowders Prepared by Different Chemical Methods. Gels 2023, 9, 624. [Google Scholar] [CrossRef]
  37. Lima, L.G., Jr.; Frederico, C.W.; Fernandes, M.V.S.; Loiola, A.R.; de Almeida Andrade, J.C.R.; de Moura, C.P.; Mattos, I.C.; Nogueira Neto, J.A.; Damasceno da Silva, L.R. Caracterização Geoquímica, Mineralógica, Termogravimétrica, e Por Espectrometria de Infravermelho de Argilominerais Representativos Da Porção Central Da Província Borborema—DOAJ. Available online: https://doaj.org/article/baaa0b5a8d3e4827b05b4c95eaf1ba99 (accessed on 8 August 2022).
  38. Duarte-Nass, C.; Rebolledo, K.; Valenzuela, T.; Kopp, M.; Jeison, D.; Rivas, M.; Azócar, L.; Torres-Aravena, Á.; Ciudad, G. Application of Microbe-Induced Carbonate Precipitation for Copper Removal from Copper-Enriched Waters: Challenges to Future Industrial Application. J. Environ. Manag. 2020, 256, 109938. [Google Scholar] [CrossRef]
  39. Arizaga, G.G.C.; Mangrich, A.S.; da Costa Gardolinski, J.E.F.; Wypych, F. Chemical Modification of Zinc Hydroxide Nitrate and Zn-Al-Layered Double Hydroxide with Dicarboxylic Acids. J. Colloid Interface Sci. 2008, 320, 168–176. [Google Scholar] [CrossRef]
  40. Borchert, H.; Jürgens, B.; Zielasek, V.; Rupprechter, G.; Giorgio, S.; Henry, C.R.; Bäumer, M. Pd Nanoparticles with Highly Defined Structure on MgO as Model Catalysts: An FTIR Study of the Interaction with CO, O2, and H2 under Ambient Conditions. J. Catal. 2007, 247, 145–154. [Google Scholar] [CrossRef]
  41. Mageshwari, K.; Mali, S.S.; Sathyamoorthy, R.; Patil, P.S. Template-Free Synthesis of MgO Nanoparticles for Effective Photocatalytic Applications. Powder Technol. 2013, 249, 456–462. [Google Scholar] [CrossRef]
  42. Selvam, N.C.S.; Kumar, R.T.; Kennedy, L.J.; Vijaya, J.J. Comparative Study of Microwave and Conventional Methods for the Preparation and Optical Properties of Novel MgO-Micro and Nano-Structures. J. Alloys Compd. 2011, 509, 9809–9815. [Google Scholar] [CrossRef]
  43. Chen, P.J.; Wu, C.H.; Shen, P.; Chen, S.Y. Structure/Surface and Optical Property Modifications of MgO Powder by Q-Switched Laser Pulses in Water. Appl. Phys. A Mater. Sci. Process 2014, 116, 823–830. [Google Scholar] [CrossRef]
  44. Li, H.; Li, M.; Qiu, G.; Li, C.; Qu, C.; Yang, B. Synthesis and Characterization of MgO Nanocrystals for Biosensing Applications. J. Alloys Compd. 2015, 632, 639–644. [Google Scholar] [CrossRef]
  45. Frost, R.L.; Kloprogge, J.T. Infrared Emission Spectroscopic Study of Brucite. Spectrochim. Acta A Mol. Biomol. Spectrosc. 1999, 55, 2195–2205. [Google Scholar] [CrossRef]
  46. Zhou, J.; Yang, S.; Yu, J. Facile Fabrication of Mesoporous MgO Microspheres and Their Enhanced Adsorption Performance for Phosphate from Aqueous Solutions. Colloids Surf. A Physicochem. Eng. Asp. 2011, 379, 102–108. [Google Scholar] [CrossRef]
  47. Hassan, M.A. Effect of Halides Addition on the Ligand Field of Chromium in Alkali Borate Glasses. J. Alloys Compd. 2013, 574, 391–397. [Google Scholar] [CrossRef]
  48. Dashkhuu, K. Removal of Chromium from Aqueous Solution by Thermally Treated Mgal Layered Double Hydroxide. Ann. Civ. Environ. Eng. 2017, 1, 1–8. [Google Scholar] [CrossRef]
  49. Hassan, M.A.; Ahmad, F.; Abd El-Fattah, Z.M. Novel Identification of Ultraviolet/Visible Cr6+/Cr3+ Optical Transitions in Borate Glasses. J. Alloys Compd. 2018, 750, 320–327. [Google Scholar] [CrossRef]
  50. Laxmi Kanth, C.; Raghavaiah, B.V.; Appa Rao, B.; Veeraiah, N. Spectroscopic Investigations on ZnF2-MO-TeO2 (MO = ZnO, CdO and PbO) Glasses Doped with Chromium Ions. J. Quant. Spectrosc. Radiat. Transf. 2005, 90, 97–113. [Google Scholar] [CrossRef]
  51. Chavarriaga, E.; Lopera, A.; Bergmann, C.; Alarcón, J. Effect of the Substitution of Co2+ by Mg2+ on the Color of the CoCr2O4 Ceramic Pigment Synthesized by Solution Combustion. Boletín Soc. Española Cerámica Y Vidr. 2020, 59, 176–184. [Google Scholar] [CrossRef]
  52. Knyazev, A.V.; Ma̧cZka, M.; Bulanov, E.N.; Ptak, M.; Belopolskaya, S.S. High-Temperature Thermal and X-Ray Diffraction Studies, and Room-Temperature Spectroscopic Investigation of Some Inorganic Pigments. Dye. Pigment. 2011, 91, 286–293. [Google Scholar] [CrossRef]
  53. Schatschneider, B.; Perumareddi, J.R. UV-Vis Absorption Study of Some Tetragonal Chromium (III) Complexes. Inorganica Chim. Acta 2005, 358, 4571–4574. [Google Scholar] [CrossRef]
  54. Francke, L.; Durand, E.; Demourgues, A.; Vimont, A.; Daturi, M.; Tressaud, A. Synthesis and Characterization of Al3+, Cr3+, Fe3+ and Ga3+ Hydroxyfluorides: Correlations between Structural Features, Thermal Stability and Acidic Properties. J. Mater. Chem. 2003, 13, 2330–2340. [Google Scholar] [CrossRef]
  55. Yang, F.; Pang, F.; Xie, J.; Wang, W.; Wang, W.; Wang, Z. Leaching and Solidification Behavior of Cu2+, Cr3+ and Cd2+ in the Hydration Products of Calcium Sulfoaluminate Cement. J. Build. Eng. 2022, 46, 103696. [Google Scholar] [CrossRef]
  56. Horsth, D.F.L.; Primo, J.O.; Dalpasquale, M.; Bittencourt, C.; Anaissi, F.J. Colored Aluminates Pigments Obtained from Metallic Aluminum Waste, an Opportunity in the Circular Economy. Clean. Eng. Technol. 2021, 5, 100313. [Google Scholar] [CrossRef]
Scheme 1. Synthesis scheme of MgO based on cassava starch and its application in the removal of Cr (III) ions and its reuse as a pigment.
Physchem 04 00005 sch001
Figure 1. X-ray diffraction (XRD) of the MgO samples St-MgO (a); Cm-MgO (b); and the identification patterns of the periclase (c) and brucite (d) phases. For sample Cm-MgO (b), the brucite phase represented by “B” was also identified.
Physchem 04 00005 g001
Figure 2. Scanning electron microscopy images of the Cm-MgO (a,b) and St-MgO (c,d) samples. Magnification: (a,c) ×1600; (b,d) ×3000.
Physchem 04 00005 g002
Figure 3. The samples were subjected to vacuum degassing at 200 °C or 250 °C for 2 h and 30 min. The analyses were carried out at liquid nitrogen temperature (−196.15 °C), forming the adsorption–desorption isotherms for St-MgO (a) and Cm-MgO (b) samples.
Physchem 04 00005 g003
Figure 4. Thermal analysis curve (TGA/dTG) of the samples St-MgO (a) and Cm-MgO (b). TGA curves of samples were obtained by scanning from 30° to 1000 °C in synthetic air with a flow rate of 20 mL⋅min−1 and a heating rate of 10 °C/min.
Physchem 04 00005 g004
Figure 5. XRD diffractograms of MgO-based samples with cassava starch and commercial samples at different concentrations St1 and Cm1 (a), St05 and Cm05 (b). Also presents the data of MgO before the removal of Cr ions (c) and the identification patterns of the brucite (ICSD: 34401) phase (d).
Physchem 04 00005 g005
Figure 6. FTIR spectra of St-MgO (a) and Cm-MgO (b) samples before and after Cr3+ removal.
Physchem 04 00005 g006
Figure 7. SEM images of samples St1 (a), Cm1 (b); St05 (c), and Cm05 (d). All the magnifications: 10.00 KV.
Physchem 04 00005 g007
Figure 8. The visible absorption spectrum of green pigments with a broad band centered at ∼440 and 600 nm for the samples (a) Starch 1 and 05 and (b) Commercial 1 and 05.
Physchem 04 00005 g008
Table 1. Nomenclature of pigments obtained after removal of Cr(III) ions.
SamplesAmount MgO (mg)Green Pigment
St-MgO (Starch)500St05
1000St1
Cm-MgO (Commercial)500Cm05
1000Cm1
Table 2. Crystallite size and crystallinity of the MgO samples.
SamplesCrystallinity (%)Crystallite Size (nm)
K = 0.9K = 1.3
St-MgO89.514.3120.68
Cm-MgO89.718.1126.16
Table 3. Textural properties of MgO samples (surface area, pore volume, and pore radius).
SamplesVmax (cc/g)Surface Area (m2/g)Pore Volume (cm3/g)Pore Radius (Å)
St-MgO89.7643.930.1320.06
Cm-MgO24.1012.600.0316.34
Table 4. Mass loss events of MgO samples based on the thermal analysis curves in Figure 4.
SamplesInitial Mass (mg)Temp. Range (°C)Lost Mass (%)Attribution
St-MgO3.32230–2002.41water molecules
200–8007.83structural dehydroxylation
Cm-MgO3.62730–2002.11water molecules
200–50013.05structural dehydroxylation
500–7002.66structural dehydroxylation
Table 5. Magnesium and chromium contents (mg of element/g of sample) in samples St-MgO and Cm-MgO and after removal of Cr3+.
SamplesMg (mg/g)Cr (mg/g)
St-MgO214.87n.d. *
St-05180.2146.42
St-1276.6630.67
Cm-MgO393.15n.d. *
Cm-05207.3963.43
Cm-1194.5043.56
* n.d.—not detected.
Table 6. Comparison of chromium’s removal capacities (mg/g) using other typical materials for removing Cr3+ and Cr6+ as contaminants.
SamplesRemoval Capacities (mg/g)References
Zeolites0.0057[31]
Aluminum–Magnesium Hydroxide (AMH)105.3 to 112.0[32]
Natural hydroxyapatite (HAp)1.382[33]
MgO and Montmorillonite1033.80[34]
Layered double hydroxides (Mg/Fe-LHD-BC)45.05[35]
Table 7. Crystallite size data and degree of crystallinity of MgO samples.
SamplesCrystallinity (%)Basal Distance
(d001 nm)
Crystallite Size (nm)
K = 0.9K = 1.3
St179.70.48411.616.7
St0581.00.48420.429.5
Cm174.50.4636.18.1
Cm0573.50.4746.99.9
Table 8. Colorimetric analysis of pigments in powder.
SamplesLa*b*C*h*
St1 Physchem 04 00005 i00146.52−2.35−0.632.54194.29
Cm1 Physchem 04 00005 i00237.88−2.15−0.142.16183.70
St05 Physchem 04 00005 i00334.59−2.46−0.042.35180.93
Cm05 Physchem 04 00005 i00435.81−3.12−0.613.17191.04
Table 9. Colorimetric analysis of pigments dispersed in colorless commercial paint.
SamplesLa*b*C*h
St148.45−0.713.603.67101.16
St0544.00−1.642.242.78126.22
Cm140.83−1.792.242.87128.65
Cm0537.33−3.120.043.47179.29
Table 10. Total color variation (ΔE) in the acid environment before exposure and after 24, 120, and 240 h of exposure.
SamplesΔE
(Initial Time)
ΔE
(after 24 h)
ΔE
(after 120 h)
ΔE
(after 240 h)
Incolor-0.591.032.27
St-MgO-0.400.692.49
St1-0.680.810.78
St05-0.330.571.96
Cm-MgO-0.320.782.27
Cm1-0.832.142.25
Cm05-1.532.312.52
Table 11. Total color variation (ΔE) in the alkaline environment before exposure and after 24, 120, and 240 h of exposure.
SamplesΔE0ΔE24 hΔE120 hΔE240 h
Incolor-0.150.482.19
St-MgO-0.360.942.39
St1-0.331.092.18
St05-0.601.322.75
Cm-MgO-1.881.953.51
Cm1-0.400.881.05
Cm05-0.300.341.44
Disclaimer/Publisher’s Note: The statements, opinions and data contained in all publications are solely those of the individual author(s) and contributor(s) and not of MDPI and/or the editor(s). MDPI and/or the editor(s) disclaim responsibility for any injury to people or property resulting from any ideas, methods, instructions or products referred to in the content.

