
Kinetics and Timescales in Bio–Nano Interactions

Department of Biochemistry, Federal University of São Paulo, São Paulo 04044-020, SP, Brazil
*
Author to whom correspondence should be addressed.
Physchem 2023, 3(4), 385-410; https://doi.org/10.3390/physchem3040026
Submission received: 30 September 2023
/
Revised: 25 October 2023
/
Accepted: 25 October 2023
/
Published: 28 October 2023
(This article belongs to the Section Biophysical Chemistry)
Abstract
:Engineered nanoparticles (NPs) have the potential to revolutionize disease diagnostics and treatment. However, NP interactions with proteins in biological fluids complicate their in vivo control. These interactions often lead to the formation of protein coronas around the NP surface, shaping NP fate and behavior within biological systems. To harness the full potential of NPs in biomedical applications, it is therefore essential to gain a comprehensive understanding of their interactions with proteins. Within this context, it must be recognized that traditional equilibrium-based descriptions of NP–protein interactions, which encompass parameters like equilibrium binding affinity and corona composition, do not provide sufficient detail to predict NP behavior in vivo. This limitation arises because the open in vivo system is a nonequilibrium state characterized by constantly changing concentrations and dynamic regulation of biological processes. In light of these considerations, this review explores the kinetics and timescales of NP–protein interactions, discussing their relevance, fundamental concepts, measurement techniques, typical ranges of association and dissociation rate constants, and dynamics of protein corona formation and dissociation. The review concludes by outlining potential areas for further research and development in this field.
1. Introduction
Engineered nanoparticles (NPs) offer unique capabilities for diagnosing and treating human diseases [1]. In drug delivery applications, NPs can be designed to carry therapeutic drug formulations through the bloodstream and deliver them to specific tissues and cells, thus optimizing therapeutic efficacy while minimizing off-target toxicity [2,3]. However, despite significant efforts to date, precise control over the in vivo behaviors of NPs remains a challenging task. Upon exposure to a biological fluid, NPs readily interact with proteins and other biomolecules present in the medium [4,5,6,7]. For some NP types, these interactions result in the formation of a stable, adsorbed protein corona on the NP surface, while for other NPs, only a transient corona might form. Regardless, NP–protein interactions remain crucial in determining NP fate and behavior in the complex biological environment [8,9,10,11,12,13].
There are a myriad of interdependent factors that govern NP–protein interactions and corona formation, including the identity of the interacting proteins, their affinity for the NP surface, the kinetics of binding and unbinding, and the protein conformational changes, among others. In response to this challenge, ongoing research in the field aims to elucidate the underlying mechanisms of NP–protein interactions with the ultimate goal of manipulating these interactions to achieve desired bioresponses [7,14,15,16,17].
It must be realized that a static or equilibrium-based description of NP–protein interactions, which focuses on parameters such as equilibrium binding affinity (KD) and corona composition, is insufficient to understand NP biobehavior in vivo. This is because the open in vivo system is a nonequilibrium state, where concentrations are in constant change and biological processes are dynamically regulated [16,18,19]. To illustrate, the rate constants governing binding and unbinding between proteins and NPs, along with the concentrations involved, exert a direct influence on the rate of protein adsorption and corona formation. Simultaneously, the rate constant of complex dissociation dictates the residence time of the bound protein on the NP surface. In this way, it becomes essential to consider the timeframes of both binding and unbinding events in relation to the timescales of relevant biological processes in order to gain a comprehensive understanding of how NPs impact biological function (Figure 1) [6,16,20,21,22,23].
This review is centered on the kinetics and timescales of bio–nano interactions. Specifically, we illustrate some relevant timescales in biology and nanomedicine (Section 2), provide a concise overview of the fundamentals of binding kinetics (Section 3), briefly describe a few measurement techniques (Section 4), discuss the kinetics of NP–protein interactions and the dynamics of protein corona formation (Section 5, Section 6 and Section 7), and conclude by providing a brief overview of potential areas requiring further development and exploration (Section 8).
2. Kinetics and Timescales in Biology
Biological processes are regulated by a complex network of interactions in both time and space. To illustrate the temporal aspects of biological regulation, Table 1 presents a selection of characteristic timescales observed in various biological contexts [18,24,25,26,27,28,29,30].
Before proceeding, it is instructive to address the concept of drug–receptor binding kinetics within the field of pharmacology, as it highlights the significant role of timescales in practical scenarios. Namely, the timescales associated with drug–receptor binding and unbinding have emerged as valuable predictors of in vivo drug efficacy, sometimes surpassing traditional equilibrium potency measures like binding affinity and half-maximal inhibitory concentration (IC50) [19,31,32]. Specifically, drugs exhibiting prolonged drug target residence times can elicit durable therapeutic effects, even when most of the drug has been eliminated from the body. Drug rebinding to its cognate receptor presents an additional mechanism that enhances the duration of target occupancy, consequently prolonging the clinical action of the drug [33,34]. On the other hand, when the plasma drug halflife exceeds the drug target residence time, target occupancy is primarily governed by simple mass balance effects [35]. The significance of the drug target residence time concept extends to drug toxicity. On one hand, a prolonged residence time enables the optimization of dosing schedules to minimize off-target toxicities. However, too long a drug target residence time could lead to on-target toxicity, making a shorter residence time desirable in such scenarios [19].
To conclude, research has shown that integrating drug–target binding and unbinding kinetics, alongside consideration of established pharmacokinetic parameters such as drug distribution, metabolism, and elimination, is paramount for optimizing the clinical effectiveness of therapeutic drugs within the dynamic in vivo system [19,31,32,33,34,36,37].
3. Fundamentals of Binding Kinetics
Here, we provide a brief overview of the kinetics of protein–protein interactions, which serves as a foundation to describe NP–protein interactions (Section 5, Section 6 and Section 7). We begin by introducing the simplest model of a single-step binding reaction (Figure 2A) involving receptor (R) and ligand (L) proteins:
where kon (units of M−1s−1) and koff (units of s−1) represent the association and dissociation rate constants of the forward and reverse reactions, respectively, and KD = koff/kon is the equilibrium binding affinity.
The rate of the forward reaction, kon, is constrained by diffusion and has an upper limit of approximately 109 M−1s−1, which is known as the Smoluchowski limit [38,39]. However, proteins impose strict geometric constraints in forming the correct binding interface, resulting in a maximum kon of around 105–106 M−1s−1, which is defined as the basal rate of association [39,40]. It is worth noting that additional processes, like favorable electrostatic interactions and desolvation of hydrophobic patches, can enhance the rate of association beyond the basal level, leading to kon values exceeding 106 M−1s−1 [41]. On the other hand, desolvation of polar/charged residues and conformational changes decrease the kon relative to the basal level, resulting in kon values lower than 105–106 M−1s−1 [39,40,41]. With regards to the unbinding rate, koff, it defines the residence time (tr) of the RL complex, where tr = 1/koff. The magnitude of the koff is controlled by short-range interactions at the binding interface, including hydrogen bonds, salt bridges, van der Waals forces, and hydrophobic interactions.
Under pseudo first-order conditions (i.e., [L] >> [R]), formation of the RL complex from the isolated components proceeds with an observed rate constant, kobs, as such:
The resulting observed association halftime, tobs, is expressed as tobs = ln 2/kobs. Thus, the speed of a binding reaction can be influenced by either kon, koff, or both, dependent upon the concentration of the ligand and the magnitude of the kinetic parameters. Three cases can be considered [42]: (i) for high-affinity interactions where [L] > KD, the reaction rate, kobs, predominantly relies on the product, kon[L]; (ii) for weak interactions where [L] < KD, the reaction rate is primarily dictated by koff; and (iii) when [L] ~ KD, then both kon[L] and koff contribute to kobs.
For more comprehensive insight into the kinetics of protein interactions, it is useful to consider the presence of an intermediate state within the reaction pathway (Figure 2B). This intermediate state, referred to as the encounter complex (EC), remains predominantly solvated and retains nearly native separations and orientations. Subsequent steps of desolvation and conformational changes within the EC lead to the formation of the final bound state [39,40,41]. These events can be represented as follows:
where RL* represents the EC, k1 is the diffusion-controlled rate of formation of the EC, k−1 is the rate of dissociation of the EC, k2 is the rate of conversion of the EC into the final bound state, and k−2 is the rate of dissociation of the bound state back to the EC. Values of k1 can theoretically span the range from ~105 M−1s−1 (the second-order basal rate of association, as defined above) to 109 M−1s−1 (the Smoluchowski rate constant).
For the two-step binding reaction described above (Equation (3)), the observed rate constant of complex formation is given by the following:
where K1 = k−1/k1 is the binding affinity of the EC. A plot of kobs vs. [L] thereby produces a hyperbolic curve from which the binding parameters can be extracted through fitting [43,44].
Under steady-state conditions, the overall rate constants of association and dissociation of the two-step binding reaction are governed by the kinetics of each discrete reaction step, as follows:
These equations delineate two limiting regimes [39,40]. For a diffusion-controlled reaction, the conformational rearrangement is fast relative to dissociation of the EC, that is, k2 >> k−1. Hence, kon can be approximated as kon ≈ k1, while koff ≈ k−1k−2/k2. On the other hand, when complex formation is reaction-limited, the intermediate step of conformational changes proceeds slowly, that is, k2 << k−1, and the approximations kon ≈ k2k1/k−1 = k2/K1 and koff ≈ k−2 apply. Furthermore, the expression for KD is given by the following:
For reaction-limited association, it becomes apparent that the overall KD equals the affinity of the encounter complex, K1, multiplied by the factor K2 (K2 < 1) accounting for the subsequent tightening steps of desolvation and conformational changes.
4. Measurement Techniques
This section provides a succinct overview of the primary experimental techniques used to evaluate binding kinetics. These include the manual mixing technique and stopped-flow spectroscopy as solution-based methods, as well as surface plasmon resonance (SPR) spectroscopy as a surface-based technique. For further in-depth information on these techniques (including data collection, modeling, and interpretation), readers are directed to specialized texts [44,45,46].
It should be acknowledged that there are additional methods that can provide highly specialized and valuable insights into interaction kinetics and the dynamics of protein corona formation. In particular, single-molecule-based methods can offer a detailed mechanistic understanding of protein–surface interactions, although their application in the study of NP–protein interactions is still emerging [47,48,49]. In addition, the application of super-resolution microscopy and single-molecule imaging enables the exploration of protein corona formation and evolution on a particle-by-particle basis [50,51]. This approach offers a unique opportunity to visualize and understand the issue of heterogeneity in protein adsorption. In future, widespread application of these advanced methods is expected to provide novel insights into NP–protein interactions, hence complementing the more conventional ensemble-based approaches.
4.1. Solution-Based Techniques
The simplest solution-based approach to study NP–protein interaction kinetics is the manual mixing technique. This method is especially well-suited for studying slow reactions with time constants ranging from several minutes to several hours. Interactions can be monitored in real-time by following changes in optical signals, such as fluorescence emission. Alternatively, the bound or unbound protein mass can be directly quantified using calorimetric assays at specific time points, typically following centrifugation to separate unbound proteins from NP–protein complexes. The manual mixing technique can be used to measure the kinetics of protein corona formation when it occurs slowly under given experimental conditions [52,53]. In general, however, this method has limited applicability in measuring NP–protein association kinetics due to the rapid nature of protein adsorption and corona formation. On the other hand, the manual mixing technique can be highly effective for examining protein dissociation from NP surfaces [54], which in the case of strong interactions, can last for several hours or even days. The dissociation reaction can be induced by either dispersing NP–protein complexes in a protein-free buffer solution or through competitive displacement of adsorbed labeled proteins via excess unlabeled proteins in a solution. It is important to recognize that these different methods may yield varying conclusions regarding the dissociation kinetics [55]. At any rate, the obtained signal change over time is typically analyzed by fitting an exponential function to extract the first-order dissociation rate constant, koff. Of note, modeling the dissociation reaction may require a combination of exponential functions for a satisfactory data fit. In such cases, it may or may not be possible to mechanistically assign each determined koff value to a specific NP–protein binding configuration or other underlying phenomena.
Fast interactions occurring within seconds or even milliseconds can be analyzed using mechanical mixing coupled with real-time optical detection. This can be readily accomplished using commercially available stopped-flow spectroscopy systems, capable of achieving dead times of a few milliseconds or less in conjunction with a time resolution on the order of approximately 1 millisecond. Fluorescence stopped-flow spectroscopy is ideal for evaluating fast NP–protein dissociation kinetics in the case of low-stability complexes, such as those formed with ultrasmall NPs (Section 6). Furthermore, the stopped-flow approach could prove valuable in assessing the short residence times of soft corona proteins on the surface of NPs, although to the best of our knowledge, this specific application has yet to be explored. Similarly as described above for the manual mixing technique, more than one exponential function may be required to fit the dissociation reaction. The stopped-flow method is also well-suited for studying NP–protein association reactions, which can occur extremely fast. Importantly, the millisecond time resolution afforded by the technique enables the potential identification of intermediate steps within the reaction pathway, along with a quantification of the rate constants of formation and dissociation of individual species. For example, given a two-step binding reaction as shown in Figure 2B, plotting the observable rate constant for complex formation (kobs) against the ligand concentration ([L]) would yield a hyperbolic curve. Employing the kobs equation (Equation (4)) to fit this experimental curve would then provide the affinity K1 of the EC, as well as the first-order rate constant k2 that governs the rate of final complex formation. The k−2 rate, in turn, would be best estimated through a competitive displacement assay. While stopped-flow spectroscopy can yield valuable insights into fast binding reactions, it does have certain limitations to consider: the technique relies on changes in optical signals, which may not occur in all interactions, thereby restricting its applicability, as well as low-throughput data collection and high sample consumption.
NMR spectroscopy stands as another important solution-based technique that can provide a wealth of information on the dynamics of NP–protein interactions [56,57,58,59,60,61]. It also can offer unique details about binding configurations, including interaction epitopes and local/global protein conformations [56,62,63]. For example, Ceccon et al. studied the global motions and exchange kinetics (kobs and koff) of the small protein ubiquitin on the surface of unilamellar liposomes [60]. Their findings revealed a residence time for bound ubiquitin of around 20 μs. Moreover, the bound ubiquitin exhibited internal rotation and wobbling motions on the micro- and nanosecond timescales, respectively. An application of NMR spectroscopy for studying NP–protein association kinetics is further mentioned in Section 5.3. Readers are referred to specialized texts for more in-depth information on this technique [56,57,59].
4.2. Surface-Based Techniques
Surface-based methods used to evaluate binding kinetics include label-free biosensor technologies such as SPR spectroscopy, biolayer interferometry, optical waveguide light-mode spectroscopy (OWLS), grating-coupled interferometry, and quartz crystal microbalances [64]. The label-free nature of these methods eliminates the need of conjugating extrinsic reporter molecules (like fluorescent probes) to the binding partners. Among the various available techniques, SPR is the best-known and most extensively used [45]. Therefore, the comments that follow pertain to SPR.
In SPR, one of the binding partners, termed the ‘ligand’, is immobilized on a sensor ‘chip’ within a flow cell, while buffer solution containing the ‘analyte’ continuously flows over the surface. Interactions between the applied analyte and immobilized ligand are monitored in real-time by detecting signal changes (refractive index changes) through the sensor ‘chip’. The apparent kon and koff interaction rate constants are then determined by fitting a suitable binding model equation to the obtained kinetic data.
The kinetic constants that can be determined using SPR cover a wide range, from around 102 to 106–107 M−1 s−1 for association rate constants and from 10−5 to 1 s−1 for dissociation rate constants. The exact range depends on the particular system and experimental conditions. Accurate measurement of very fast association reactions is hindered by mass transport limitations, which involve the diffusion-controlled delivery of the analyte from the bulk solution to the surface. Likewise, characterization of very fast dissociation reactions is hindered by analyte rebinding to the immobilized ligand (also a manifestation of mass transport limitation), that is, the analyte rebinds to the surface before it has time to diffuse away from it. Conversely, very slow dissociation reactions lasting from many hours to days are limited by the extended time required for data collection.
Previous studies have conducted systematic comparisons between SPR and solution-based techniques for quantifying biomolecular interactions [65]. It has been concluded that SPR is generally able to provide reliable results. However, this reliability depends on addressing several factors [45,66,67,68]. Firstly, SPR is susceptible to mass transport limitations, as already noticed. Secondly, SPR can be influenced by inherent sources of binding heterogeneity. These sources can include, among others, changes in the binding properties of the immobilized ligand due to interactions with the surface, effects of chemical crosslinking, avidity effects, and spatial variations in surface properties at the microscopic scale. Indeed, it has been shown that even biomolecular interactions conforming to a 1:1 binding scheme in a solution may exhibit significant binding heterogeneity when evaluated using SPR [66,67,68]. Nonetheless, these issues can be mitigated to some extent through well-planned experiments and the adoption of data analysis methods that account for surface heterogeneity [66,67].
To quantify NP–protein interactions, it is advisable to explore various immobilization strategies, including the use of both the NP and the protein as immobilized ligands. In the first scenario, multiple proteins can bind to a single immobilized NP. This set-up can be particularly useful for investigating both strong and weak protein interactions with the NP surface [6,69,70]. It is also crucial to carry out experiments with varying levels of surface immobilization. As a rule of thumb, it is best to immobilize the minimum possible amount of ligand (while ensuring a sufficient signal-to-noise ratio) to mitigate mass transport limitations and the potential for avidity effects.
As a final note, it is important to recall that NP–protein complexes may exhibit inherent sources of binding heterogeneity, as discussed in Section 5.2. Therefore, distinguishing the true binding heterogeneity intrinsic to the interaction from that introduced artificially by surface immobilization can present a challenge.
5. Kinetics of Protein Interactions with ‘large’ NPs
In this review we distinguish between two primary categories of NPs based on their size: ‘conventional’ or ‘large’ NPs with sizes typically greater than 10 nm, and ultrasmall NPs (usNPs) with sizes smaller than 3 nm [71,72]. In this section, we explore the kinetics of binding and unbinding of individual proteins with conventional NPs, while the dynamics of protein corona formation in complex biofluids are discussed in Section 7. Section 6 is dedicated to exploring protein interactions with usNPs.
5.1. Interaction Mechanism
It is instructive to consider NP–protein interactions in analogy to the kinetic mechanism of protein–protein complexation, as described in Section 3 (Figure 2). However, this analogy assumes only direct NP–protein interactions and neglects the occurrence of interprotein interactions and other secondary phenomena. Accordingly, NPs and proteins undergo random collisions in a solution until they bind in the proper orientation, forming a first-encounter complex with a second-order rate constant, k1. The magnitude of k1 is expected to approach the Smoluchowski diffusion limit, that is, k1 ≈ 108–109 M−1 s−1, depending on NP size. This is primary because NPs are considered spherical and uniform, which means that formation of the proper binding interface depends only on the orientational constraint imposed by the protein itself [73]. The encounter complex can undergo partial desolvation of polar groups and interfacial restructuring (local protein structural changes) characterized by the first-order rate constants k2, k3, and so on along the reaction pathway. The energy barriers associated with these processes slow down the overall association reaction. Simultaneously, the tightening steps of desolvation and interfacial restructuring collectively lower the free energy of the system toward a more stable final state. The final complex can be stabilized by a combination of van der Waals forces, hydrogen bonds, electrostatic interactions, and hydrophobic effects, with the relative importance of each interaction depending on the specific NP and protein characteristics [74].
Assuming a three-step binding reaction for simplicity (Figure 3), it can be hypothesized that the initial interfacial restructuring occurs rapidly (‘large’ k2), accompanied by modest alterations in the native protein structure, leading to reversible adsorption (‘large’ k−2). Subsequently, slower and more extensive structural rearrangements may take place (‘small’ k3), ultimately contributing to the ‘irreversible’ adsorption of proteins (‘small’ k−3). According to this view, proteins can undergo a transition from reversible to irreversible adsorption on the surface of NPs over time [75,76]. However, as emphasized in a recent comprehensive review, proper quantitative assessment of this reversible-to-irreversible transition is hindered by the scarcity of available published data [55]. Certainly, for certain NP types, the interactions may be best described as a two-step process, in which case slower protein denaturation steps are absent and a reversible NP–protein complex is formed. Another potential scenario involves the occurrence of some structural changes over time, but which may not contribute to further complex stability, thus preventing the transition to irreversible binding.
Secondary phenomena, including interprotein interactions and steric effects, add complexity to the adsorption process. For example, proteins that arrive late at the NP surface encounter limited available area for adsorption. Consequently, there may be a significant reduction in the value of k1 and, by extension, in the overall kon rate constant. Furthermore, these proteins have restricted space to spread out and form strong bonds with the NP surface, which may result in reversible adsorption [14].
In conclusion, the molecular mechanisms underlying NP–protein interactions are inherently complex, as they are influenced by numerous physicochemical and environmental factors. In this respect, kinetic studies play a crucial role in providing mechanistic insights into NP–protein complexation.
5.2. Dissociation Kinetics and Residence Times
According to the general model for NP–protein complexation presented above, the overall koff rate constant is a combination of the rate constants of the individual reaction steps. For ‘truly irreversible’ adsorption, the apparent koff should be around 10−5 s−1 or less, corresponding to a residence time of approximately 27 h or longer. In some cases, the individual off-rate constant of the last reaction step may serve as a reasonable approximation of koff. It is also possible that intermediate stages in the reaction pathway might potentially yield a stable complex within biologically relevant timescales. In this context, subsequent stages of conformational rearrangements could induce further protein denaturation without yielding a biologically advantageous extension in residence time.
Based on the current literature, it is clear that both reversible and irreversible complexation can occur between proteins and NPs. For instance, Wang et al. observed irreversible binding of transferrin to hydrophobic polystyrene (PS) NPs, whereas reversible binding was detected when using hydrophilic carboxyl-functionalized PS NPs [75]. In contrast, a previous study by Milani et al. reported that binding of transferrin to similar types of PS NPs was irreversible [77].
The distinction of NP–protein complexes as either ‘reversible’ or ‘irreversible’ is, of course, an oversimplification. There is actually a continuum of NP–protein complex residence times encompassing a biologically relevant range that extends from seconds to hours, or even days. Previous studies have conducted quantitative assessments of the binding and unbinding kinetics between individual proteins and ‘conventional’ NPs [6,54,61,77,78,79,80,81,82,83,84,85,86,87,88,89]. Figure 4A presents a compilation of the apparent kon and koff rate constants obtained from these investigations (for individual values, refer to Supplementary Table S1). In some studies, only koff values have been determined, and these are included in Figure 4B. The majority of measurements have been performed using SPR spectroscopy. Determination of the rate constants using various solution-based methods has yielded comparable outcomes, although with limited studies available in this regard.
Examining the koff values in Figure 4B for conventional (‘large’) NPs reveals a broad range, spanning from approximately 1 to 10−5 s−1. This translates to residence times spanning from 1 s to 28 h. It is interesting to note that, among the 58 entries in Figure 4B, 11 exhibited koff values greater than 10−2 s−1 characteristic of transient interactions (tr < 100 s), whereas only 7 entries displayed koff values smaller than 10−4 s−1, indicating more stable interactions (tr > 2.7 h). The majority of the data (40 entries) were associated with intermediate koff values between 10−2 and 10−4 s−1. Further examination of Supplementary Table S1 unveiled that, among the 11 cases pertaining to transient interactions, 7 corresponded to liposome or lipid NPs, 1 case was related to the soft corona, and only 3 were linked to other NP classes. These observations could potentially suggest that soft NPs, such as liposome and lipid NPs, tend to form less stable interactions with proteins when compared to other NP classes. However, the limited number of studies performed to date precludes making definitive conclusions regarding the influence of NP ‘softness’ and other crucial physicochemical parameters on the residence time of NP–protein complexes. Thus, additional studies are clearly needed to provide a more comprehensive understanding of these dynamics.
It is important to acknowledge certain limitations of SPR when it comes to determining dissociation kinetics, some of which are also relevant to other characterization techniques. Firstly, a given apparent koff rate constant obtained through SPR provides only an average representation of the dissociation process. In reality, the bound proteins can exhibit a range of koff values, which in turn can be influenced by several factors, such as NP surface heterogeneity, lateral interprotein interactions, distinct binding orientations, and steric effects. Secondly, the determination of the koff from SPR typically proceeds after completion of the association phase, which normally spans from a few minutes to about an hour. Hence, SPR experiments generally do not assess the impact of incubation time and long-term protein denaturation on the dissociation of NP–protein complexes. Thirdly, protein dissociation is measured in SPR via washing the NPs with pure buffer, but it should be noted that bound proteins may exhibit higher rates of dissociation if they are competitively displaced by other soluble proteins that have stronger binding affinities to the NP surface [14,55].
Several studies have reported the formation of protein multilayers on the surface of NPs [50,77,90,91,92]. The process of multilayer formation is mediated by interprotein interactions between a strongly bound first layer (‘hard’ corona) and a loosely bound second layer (‘soft’ corona). Milani et al. used fluorescence correlation spectroscopy size measurements to investigate protein multilayer formation on model PS NPs [77]. They reported that transferrin initially formed a strongly bound monolayer, followed by the formation of a weakly bound secondary layer. Notably, the residence time associated with the second layer was estimated to be in the range of seconds (koff >> 1 min−1), as determined by competitive displacement of a labeled soft corona with excess unlabeled transferrin. On the other hand, some authors argue against the prevalent occurrence of multilayer coronas for individual proteins [14,93].
Figure 5 provides a summary of the various factors discussed above that have the potential to influence the kinetics of protein dissociation from the surface of NPs.
5.3. Association Kinetics
The kinetics of NP–protein association (kon) have primarily been investigated using SPR spectroscopy. Again, it is important to acknowledge certain limitations linked to SPR, some of which might extend to other characterization techniques as well. Firstly, SPR cannot reliably measure very high rates of association, typically having a practical limit around 106–107 M−1s−1. Secondly, proteins may exhibit a range of association kinetics influenced by factors like NP surface heterogeneity, interprotein interactions, and steric effects, among others, but which might not be distinguishable individually. Thirdly, the limited temporal resolution achievable with SPR precludes the identification of intermediate steps within the reaction pathway. Hence, the experimental finding of a single apparent kon rate constant may oversimplify what could be a very complex binding reaction.
Figure 4A presents apparent kon values obtained for various proteins and conventional NPs, spanning a range from 2 × 10² to 7 × 10⁶ M−1 s−1. However, for the majority of the data, the kon values are lower than 105 M−1 s−1. These lower kon rates are significantly smaller than the estimated diffusion-controlled association rate of 108–109 M−1 s−1 for NP–protein interactions. In these cases, NP–protein association is reaction-limited, that is, binding must overcome one or more energy barriers associated with desolvation/ion removal and structural rearrangements.
The rate constants kon and koff, along with the concentrations of the interacting partners, fundamentally govern the timescale of NP–protein association (tobs). Assuming pseudo first-order kinetics for simplicity and strong interactions where [L] > KD, then tobs ≈ (kon[L])−1. For example, considering a protein concentration of 100 nM and a kon = 104 M−1 s−1, the resulting tobs would be 16 min. If the kon were 100-fold greater, the tobs would reduce to just 10 s. On the other hand, with a smaller kon of 103 M−1 s−1, tobs would extend up to 2.7 h. This extended duration could hold significant implications for the dynamics of hard protein corona formation in vivo, although the real scenario within biological fluids is undoubtedly more complicated. In contrast, in cases of soft corona formation, both tobs and tr would be small (in the order of minutes, seconds, or even less), meaning that the bound soft corona would undergo dynamic exchange with the other proteins in the solution.
To characterize the tobs of NP–protein association in cases involving protein mixtures, Xu et al. implemented the SOFAST-HMQC NMR technique combined with the use of a tryptophan reference standard [58]. Their experiments focused on the model proteins ubiquitin and GB3 competing for the surface of 15 nm gold NPs. For both proteins, a significant amount of binding occurred within the experiment dead time (< 5 min). Nevertheless, it was observed that initially adsorbed ubiquitin was slowly displaced by GB3, with GB3 adsorption and ubiquitin desorption taking place with similar time constants of approximately 140 min. This example highlights the ability of multidimensional NMR spectroscopy to resolve individual residues associated with different proteins, thus providing the potential for studying competitive binding kinetics within protein mixtures.
To conclude, knowledge of the kon provides insights into association mechanisms, such as whether a given interaction is diffusion- or reaction-controlled. However, more detailed mechanistic analysis requires monitoring the association process at a high time resolution (e.g., with stopped-flow spectroscopy) to identify individual reaction steps [86,94]. In practical scenarios, knowledge of the apparent kon is useful for estimating association times, as exemplified above. Unfortunately, accurately determining the kon for NP–protein interactions is not straightforward.
6. Kinetics of Protein Interactions with Ultrasmall NPs
Ultrasmall NPs (d < 3 nm) are characterized by dimensions comparable to or smaller than those of a typical globular protein of 3 to 6 nm in diameter [71,72,95]. Similarly as described above for large NPs, it is informative to consider usNP–protein interactions in analogy to protein–protein interactions [96,97,98]. Here, the analogy becomes even more pertinent due to the small size and high surface curvature of usNPs, which provide a limited binding interface for protein interactions. Hence, when proteins interact with usNPs, significant protein spreading and denaturation on the usNP surface are unlikely [99,100,101], and major lateral interactions between bound proteins are also improbable. In fact, usNPs with a diameter of 1.5 nm or less may be so small as to bind only to a single protein (Figure 6A) [95].
Ultrasmall NP–protein interactions often result in the formation of short-lived complexes (Figure 6A). For instance, Boselli et al. employed an agarose gel-shift assay to study the stability of ultrasmall gold NP (usGNP)–protein complexes formed in human plasma [102]. They found that 2 nm PEG-coated and carboxyl-terminated usGNPs exhibited minimal signs of protein interaction, whereas even a slight increment in particle size (from 2 to 3 nm) resulted in the formation of more stable complexes.
Using SPR and fluorescence stopped-flow spectroscopy, Lira et al. and Ferreira et al. carried out quantitative analyses of the binding kinetics of purified proteins with anionic usGNPs [73,96,103,104,105,106]. The proteins used in their studies included α-thrombin, CrataBL, ubiquitin, and factor XII (FXII). Their findings indicated koff values within the narrow range of 0.015 to 0.5 s−1, corresponding to tr values from 2 to 66 s (Supplementary Table S2). These outcomes align with the concept of transient and short-lived interactions between proteins and usNPs. Figure 4B, in particular, clearly illustrates the distinct ranges of koff and tr that are characteristic of ultrasmall versus conventional NPs. Of note, one should bear in mind that certain types of usNPs may exhibit enhanced binding stability and longer residence times, including functional usNPs [107,108,109,110], dendrimers with exceptionally high charge densities, or hydrophobic carbon NPs like fullerenes.
Lima et al. further assessed the residence times of usGNP–protein complexes qualitatively as a function of the incubation time [99]. The panel of proteins encompassed serum albumin, thrombin, chymotrypsin, trypsin, and FXII. Their findings demonstrated that interactions between proteins and usGNPs resulted in reversible complexes, regardless of incubation time (10 min vs. 24 h). In other words, there was no observed time-dependent enhancement in the stability (‘hardening’) of these interactions.
The near lack of irreversible nonspecific protein binding to usNPs presents an opportunity to engineer functional usNPs that can retain their functionality in complex biological fluid [107,109,110,111,112,113,114]. Moreover, the ability to attach multiple functional moieties to the usNP surface opens up the possibility to exploit avidity effects, enabling high-affinity and long-lasting interactions between functional usNPs and their receptors. In this context, Seiler et al. designed an effective inhibitor for the survivin protein by immobilizing tweezer macromolecules on the surface of usGNPs [110]. Characterization using SPR demonstrated that these functional usGNPs formed long-lasting complexes with their target receptors influenced by avidity effects, resulting in characteristic residence times of 0.45 and 2.3 h depending on the design (Figure 4B, dark green triangles).
Studies have also explored the association kinetics of usNP–protein interactions. In particular, Lira et al. and Ferreira et al. employed SPR spectroscopy to quantify the apparent kon for CrataBL and thrombin binding to model usGNPs that were surface-coated with either p-mercaptobenzoic acid (AuMBA) or glutathione (AuGSH), respectively [73,103]. While both surface ligands featured a COO--exposed surface group, GSH also possessed an additional zwitterionic group (COO-/NH3+) at the opposite end of the molecule. This distinction translated into a ~100-fold difference in the measured kon, namely, kon ~106 and 104 M−1s−1 for protein binding to AuMBA and AuGSH, respectively. The disparity in kon was attributed to the presence of a larger energy barrier for protein association with AuGSH. Computer simulations were employed to address the chemical nature of this barrier, revealing a greater energy penalty for the removal of interfacial ions from the more complex counterion atmosphere surrounding AuGSH. In another study, stopped-flow spectroscopy was used to characterize the association kinetics between ubiquitin and AuMBA with a millisecond time resolution [96]. The results supported a multi-step reaction mechanism. In essence, complexation proceeded via formation of an electrostatically stabilized and weakly bound EC characterized by an affinity constant K1 of approximately 9 μM. EC formation was followed by discrete tightening steps of partial desolvation/ion removal and structural rearrangement, which collectively enhanced the affinity of the final bound state by nearly 100-fold, leading to an apparent KD of 0.1 μM. Furthermore, it is interesting to note that the dissociation rate constant of the EC can be estimated from the expression k−1 = K1 × k1, with k1 ≈ 108 M−1s−1. For the present case, this gave k−1 ≈ 900 s−1, which translated into a residence time for the EC of only 10−3 s.
From Figure 4A, it becomes evident that certain usGNP–protein interactions can exhibit relatively high overall kon rate constants (>106 M−1s−1), resulting in considerable binding affinities (low nM range) while displaying short residence times (few seconds). Therefore, under conditions of high particle concentration ([usGNP] > KD ≥ [protein]), which are common in some in vitro assays, most proteins are complexed with usGNPs driven by simple mass balance effects. On the other hand, under conditions of large excess protein, such as in vivo, usGNPs undergo constant binding and unbinding events with different proteins rather than forming long-lasting complexes with any single protein. In this scenario, the koff (or tr) can become as important as the KD in shaping the safety profile and bioresponses of the usGNPs (Figure 6B). A case in point is the interaction between AuMBA and FXII, a constituent of the contact system of coagulation. Lira et al. showed that transient AuMBA–FXII interactions (KD ~200 nM; tr ~10 s) were capable of activating FXII and triggering the coagulation cascade in human plasma [106]. Notably, the activation of FXII took place despite a ~1500-fold lower concentration of FXII relative to serum albumin. The cell uptake of usNPs, particularly under conditions of excess protein, constitutes another domain where specific ranges of koff (or tr) can hold significance. In this context, Muraca et al. prepared tiopronin-coated usGNPs, which demonstrated transient protein interactions, and investigated their cellular uptake [115]. Their findings unveiled a significant increase in cellular uptake as the serum concentration changed from 10 to 50%. This phenomenon was attributed to the establishment of sufficiently long-lived interactions between the usGNPs and specific serum proteins, leading to receptor-mediated uptake of usGNP–protein complexes (Figure 6C). Overall, manipulating the residence time of usNP–protein interactions by precisely controlling the size and surface composition of usNPs could open up exciting new prospects in nanomedicine. For example, interactions could remain sufficiently transient to mitigate particle toxicity yet persist long enough to facilitate cellular entry via receptor-mediated mechanisms [115].
Figure 6.
Ultrasmall NP–protein interactions and residence times. (A) Impact of NP size on the residence time (tr) of NP–protein interactions. (B) Potential influence of tr on the safety profile and bioresponses of usNPs in conditions of excess protein. The parameter τ represents the time beyond which usNP–protein interactions begin to affect protein structure and function. Pristine proteins are shown in light red, while modified proteins are shown in dark red. Ultrasmall NPs bound to proteins are depicted in yellow, while unbound particles are shown in blue. The figure illustrates a single protein type for simplicity, but a similar concept applies to biological fluids. (C) Potential impact of tr on receptor-mediated cellular uptake of usNPs. The figure illustrates usGNP binding to specific soluble proteins, which then interact with membrane receptors to initiate endocytosis within a characteristic timescale of τuptake. Hypothesis 1: cell uptake is unlikely when tr < τuptake. Hypothesis 2: cell uptake becomes possible when tr > τuptake. Reprinted with permission from ref. [115] (C).

7. Dynamics of Protein Corona Formation in Complex Biofluids
In this section, we address the kinetics of protein corona formation on conventional NPs immersed in complex biofluids, such as fetal bovine serum (FBS), human serum, and human plasma. Despite the intricate nature of biological fluids, it remains valuable from a mechanistic standpoint to consider the dynamic aspects of protein corona formation in terms of similar principles to those outlined above in Section 5.
Typically, the adsorbed corona is categorized as either ‘hard’ or ‘soft’, reflecting proteins either firmly or transiently bound to the NP surface [77,116,117,118]. Additional characteristics of hard and soft coronas are illustrated in Figure 7. From a practical standpoint, proteins that remain attached to the NP surface during centrifugation and washing constitute the hard corona, whereas those proteins that are loosely bound and can be removed during these procedures are identified as part of the soft corona. In a more quantitative approach, the protein corona can be globally characterized in terms of a distribution of apparent koff and tr values, as illustrated below.
In 2007, Cedervall et al. published a landmark study, which explicitly introduced the concept of the protein corona [6]. In their work, the authors employed SPR spectroscopy to monitor the overall dissociation of plasma proteins from the surface of copolymer NPs (Figure 8A). The obtained data were best fitted assuming two independent dissociation processes, representing ‘weakly’ and ‘strongly’ associated proteins (Supplementary Table S3). More recently, Stordy et al. employed biolayer interferometry to investigate the dissociation of plasma proteins from the surface of gold and liposome NPs [69]. The dissociation kinetics were also modeled assuming independent weak and strong binding modes. Interestingly, the study explicitly investigated the influence of incubation time (from 10 to 120 min) on the apparent koff values. For gold NPs, the dissociation rates decreased as a function of incubation time until approximately 40 min, beyond which the rates stabilized (Figure 8B and Supplementary Table S3). Specifically, for strongly associated proteins, the koff rate constant decreased from 1.8 × 10⁻⁴ to ~10−7 s−1. In other words, it took about 40 min for a truly ‘irreversible’ protein corona to form on the surface of the gold NPs. For weakly associated proteins in turn, the koff rate constant reduced to 3.4 × 10⁻⁴ s−1 after 120 min of incubation, resulting in an average tr of 0.8 h. For liposomes, the trends were similar, except the dissociation rates took much longer to stabilize (Supplementary Table S3).
Recently, Latreille et al. expanded the investigation of protein corona dissociation kinetics to a model in vivo system employing zebrafish larvae (Figure 8C) [119]. This research introduced differential dynamic microscopy (DDM) in fluorescence-imaging mode for quantifying protein adsorption on NP surfaces. The experiments involved precoating of PS NPs with fluorescently labeled serum proteins, injection of precoated NPs into zebrafish larvae, and subsequent analysis using DDM. It was observed that, within a period of 3 h, the number of preadsorbed labeled proteins on the NP surface decreased by 40%. This decrease indicated an exchange dynamic with circulating blood proteins characterized by a timescale of 67 min. The authors concluded that the protein corona was long-lived but dynamic in nature.
Apart from examining the dissociation kinetics of the NP protein corona, other studies have focused on how fast a hard protein corona can develop on the surface of NPs [120,121]. Weiss et al., in particular, utilized a microfluidic device that enabled reducing incubation times down to 2 s [120]. Interestingly, their results showed that formation of the hard corona could be kinetically divided into two separate phases, with a transition time between phases at around 30 s (Figure 8D). The adsorption kinetics of phase I was relatively slower than that of phase II. The authors proposed a cooperative mechanism wherein the proteins adsorbed during phase I facilitated the subsequent adsorption process in phase II. These findings suggest a complex kinetic mechanism underlying the formation of a hard protein corona.
To gain a more comprehensive understanding of the protein corona, it is essential to identify its individual protein components and observe how the system evolves over time. According to the Vroman model [122,123,124,125], the process initiates with the preferential adsorption of smaller proteins present at higher concentrations, which attach to the NP surface at higher rates. Subsequently, these initially adsorbed proteins are replaced by less abundant but more strongly binding proteins. Importantly, the Vroman model also establishes that larger proteins can accelerate the displacement of smaller ones, which otherwise would not desorb so readily on their own [14]. Over time, a stable adsorbed layer is formed, whose composition typically differs from that of the bulk solution. Additionally, the adsorbed proteins may undergo denaturation, as already discussed.
Several mathematical models have been developed to simulate the dynamics of protein corona formation and the Vroman effect [20,85,126,127,128]. In one such model by Dell’Orco et al., the time evolution of the interaction between three human plasma proteins (HSA, fibrinogen, and HDL) and a copolymer NP was numerically calculated using experimentally determined association and dissociation rate constants [85]. Later, Sahneh et al. derived a set of analytical simplifying equations that replicated nearly all of Dell’Orco’s previous findings [126]. Overall, the simulations and calculations revealed that, during the first 20 s, a metastable corona composition was established, with HSA covering most of the NP surface, followed by HDL and fibrinogen. However, after 4 h, an equilibrium state was attained, with HDL becoming the dominant component, followed by HSA (Figure 9).
The validity of the Vroman effect was critically examined by Tenzer et al., who conducted a comprehensive experimental investigation of the time evolution of the protein corona composition on silica and polystyrene NPs [121]. These authors employed quantitative proteomics to obtain time-resolved profiles of human plasma coronas from time points as early as 0.5 min. Contrary to predictions of the classic Vroman model, the types of proteins forming the corona remained relatively constant over time, but their quantities varied at different time points during plasma exposure (Figure 10). For example, certain proteins exhibited low abundance at both the beginning and end of plasma exposure but reached peak abundance at intermediate times (‘peak’-shaped profile); conversely, other proteins showed the exact opposite behavior (‘cup’-shaped profile) [121,129]. An independent investigation led by Weiss et al. supported the conclusions of the Tenzer et al. study [120]. Using gel electrophoresis, Weiss et al. showed that human serum was adsorbed irreversibly on silica NPs after just 2 s of exposure and that the adsorbed layer did not significantly change in composition over time. Moreover, Hadjidemetriou et al. also observed ‘peak’- or ‘cup’-shaped binding kinetics of corona proteins formed in vivo on the surface of liposomal NPs [130]. Collectively, these intriguing findings suggest novel binding kinetics, which challenge more simplified models and underscore the intricate nature of NP–protein interactions within complex biological environments. Potential confounding effects include lateral interprotein interactions, cooperative adsorption, steric effects, protein clustering, and so on. Moreover, Zhdanov proposed a complementary kinetic model for the formation of protein corona within complex biofluids [127]. This model posits an exchange mechanism for protein adsorption, namely, the concerted replacement of attached proteins by proteins from a solution.
The hard protein corona of NPs has received significant attention in research, while the soft corona remains comparatively less understood. To address this gap, new technological advances have recently emerged to analyze the soft corona [50,70,87,117,131]. On the one hand, techniques have been devised to separate and identify the proteins comprising the soft corona of NPs within complex biofluids [70,87,131,132]. However, there is still a need to better understand the kinetics governing the formation and dissociation of the soft corona. A recent study by Mohammad-Beigi et al. contributed valuable insights into this aspect [87]. First, these authors identified apolipoprotein H (ApoH) as a major component of the soft corona on silica NPs. Using SPR spectroscopy, they were further able to measure the apparent KD, kon, and koff for ApoH binding to a preformed FBS hard corona (Figure 11). The results yielded an apparent KD of 17 μM and a koff of 0.048 s−1, corresponding to an ApoH residence time of 21 s on the hard corona. Despite these latest advances, additional work is needed to characterize the composition, architecture, and dynamics of the soft corona, as well as its biological significance.
8. Conclusions and Outlook
This review underscored key aspects of NP–protein binding kinetics, encompassing (i) the role of kinetics in providing insights into the molecular nature of interactions; (ii) common measurement techniques, along with their limitations; (iii) characteristic association and dissociation rate constants governing interactions between individual proteins and NPs; (iv) and dynamics of protein corona formation and dissociation. Despite significant progress in the field, several important questions remain unresolved. Listed below are a few examples of potential areas requiring further development and exploration.
Measurement techniques—Surface-based techniques have predominantly been utilized to quantify NP–protein binding kinetics. However, experiments can vary significantly in the way they are implemented, they are susceptible to potential artefactual sources of binding heterogeneity [67,68], and their reliability is difficult to assess. In this scenario, validation of results becomes particularly important, especially in cases where multiple kon and koff rate constants are reported, and these are attributed to various factors like multiple binding sites, structural changes during binding, and protein multilayers. On a broader scale, the field is in urgent need of new powerful yet user-friendly analytical approaches and characterization techniques that can accurately measure binding affinity and kinetics [7,133,134,135,136].
KD vs. koff—The dissociation rate constant, koff, is as important a parameter to characterize as the binding affinity, KD [137]. Furthermore, it should be pointed out that determining the precise KD for NP–protein interactions is challenging and highly prone to error [137,138,139]. This complexity arises from various factors, including the multisite nature of interactions, uncertainties in quantifying NP concentrations, the heterogeneity in NPs size and surface chemistry, and the dependence of KD determination on the assumption of specific binding models. In contrast, assessing the koff is simpler and more reliable, especially with the use of solution-based techniques. Determination of the koff does not require assuming a binding model, and the dissociation reaction follows a first-order process that is unaffected by NP concentration. Furthermore, the finding of multiple koff values could offer valuable insights into the occurrence of distinct protein binding configurations on the NP surface. Therefore, measuring the koff alongside KD should be established as a standard procedure in the characterization of NP–protein interactions.
Hard protein corona—Further investigations focusing on the time evolution of protein corona formation are necessary. It must be emphasized that treating the protein corona as a ‘single entity’ and evaluating its overall dynamics offers limited predictive insight into NP biobehavior. Instead, it is imperative to delineate the binding and unbinding kinetics of individual proteins on the NP surface, with a specific focus on biologically relevant timescales. Moreover, some studies have suggested that the time evolution of protein corona formation might extend beyond the predictions of the Vroman model [121]. Thus, further investigations are necessary for a comprehensive understanding of this phenomenon. Finally, exploring the evolution of corona composition under conditions of limited NP concentration and excess plasma, which mimics the in vivo situation, is important [4]. This scenario has been observed to favor the binding of fewer types of proteins displaying higher NP surface affinity [140].
Soft protein corona—Recent technological advancements have enabled the identification of the protein composition within the soft corona [70,87,131,132]. Looking ahead, it is also important to understand the dynamics of soft corona formation and dissociation. For example, it is conceivable that residence times of 1 s or 1 min, although both characteristic of soft coronas, could yield significantly distinct biological outcomes.
Linking binding kinetics to biological response—With the availability of more data on NP–protein association and dissociation kinetics, it becomes essential to delineate the impact of specific kinetic ranges on biological outcomes. Notably, the current ranges of determined kon and koff rate constants already span a broad spectrum (Figure 4 and Supplementary Tables S1–S3), and specific values of these constants hold the potential to shape subsequent bioresponses. To exemplify, it is conceivable that a sufficiently prolonged residence time would enable an NP–protein complex to fulfill its intended function (such as endocytosis or signal transduction), but too long a residence time could induce toxic effects stemming from protein denaturation or interference with biochemical pathways. Furthermore, the kinetics of corona formation and evolution need to be systematically linked to NP biodistribution and therapeutic efficacy studies to gain a comprehensive understanding of how the dynamic protein corona influences these critical aspects of nanomedicine [130,141,142,143,144,145].
In conclusion, it is only through a comprehensive understanding of NP–protein interactions, including the kinetics and timescales of protein association and dissociation events, that NPs can be engineered to function predictably within the complex and dynamic in vivo environment.
Supplementary Materials
The following supporting information can be downloaded at: https://www.mdpi.com/article/10.3390/physchem3040026/s1, Table S1. Kinetic parameters of protein interactions with large NPs; Table S2. Kinetic parameters of protein interactions with ultrasmall NPs; Table S3. Kinetic parameters of serum and plasma interactions with large NPs.
Author Contributions
A.F.L. performed the literature review and prepared the figures and tables. A.A.S. performed the literature review and conceptualized and wrote the manuscript. All authors have read and agreed to the published version of the manuscript.
Funding
This work was supported by the São Paulo Research Foundation (FAPESP) under Grant 2023/01909-4 and by the National Council for Scientific and Technological Development (CNPq) under Grant 312891/2020-2.
Data Availability Statement
Not applicable.
Conflicts of Interest
The authors declare no conflict of interest.
References
- Pelaz, B.; Alexiou, C.; Alvarez-Puebla, R.A.; Alves, F.; Andrews, A.M.; Ashraf, S.; Balogh, L.P.; Ballerini, L.; Bestetti, A.; Brendel, C. Diverse applications of nanomedicine. ACS Nano 2017, 11, 2313–2381. [Google Scholar] [CrossRef]
- Mitchell, M.J.; Billingsley, M.M.; Haley, R.M.; Wechsler, M.E.; Peppas, N.A.; Langer, R. Engineering precision nanoparticles for drug delivery. Nat. Rev. Drug Discov. 2021, 20, 101–124. [Google Scholar] [CrossRef]
- Poon, W.; Kingston, B.R.; Ouyang, B.; Ngo, W.; Chan, W.C. A framework for designing delivery systems. Nat. Nanotech. 2020, 15, 819–829. [Google Scholar] [CrossRef] [PubMed]
- Lundqvist, M.; Cedervall, T. Three decades of research about the corona around nanoparticles: Lessons learned and where to go now. Small 2020, 16, 2000892. [Google Scholar] [CrossRef]
- Hajipour, M.J.; Safavi-Sohi, R.; Sharifi, S.; Mahmoud, N.; Ashkarran, A.A.; Voke, E.; Serpooshan, V.; Ramezankhani, M.; Milani, A.S.; Landry, M.P. An Overview of Nanoparticle Protein Corona Literature. Small 2023, 19, 2301838. [Google Scholar] [CrossRef] [PubMed]
- Cedervall, T.; Lynch, I.; Lindman, S.; Berggård, T.; Thulin, E.; Nilsson, H.; Dawson, K.A.; Linse, S. Understanding the nanoparticle–protein corona using methods to quantify exchange rates and affinities of proteins for nanoparticles. Proc. Nat. Acad. Sci. USA 2007, 104, 2050–2055. [Google Scholar] [CrossRef] [PubMed]
- Baimanov, D.; Cai, R.; Chen, C. Understanding the chemical nature of nanoparticle–protein interactions. Bioconj. Chem. 2019, 30, 1923–1937. [Google Scholar] [CrossRef] [PubMed]
- Kim, W.; Ly, N.K.; He, Y.; Li, Y.; Yuan, Z.; Yeo, Y. Protein corona: Friend or foe? Co-opting serum proteins for nanoparticle delivery. Adv. Drug Deliv. Rev. 2022, 192, 114635. [Google Scholar] [CrossRef] [PubMed]
- Xiao, Q.; Zoulikha, M.; Qiu, M.; Teng, C.; Lin, C.; Li, X.; Sallam, M.A.; Xu, Q.; He, W. The effects of protein corona on in vivo fate of nanocarriers. Adv. Drug Deliv. Rev. 2022, 186, 114356. [Google Scholar] [CrossRef]
- Cai, R.; Chen, C. The crown and the scepter: Roles of the protein corona in nanomedicine. Adv. Mat. 2019, 31, 1805740. [Google Scholar] [CrossRef]
- Wang, Y.-F.; Zhou, Y.; Sun, J.; Wang, X.; Jia, Y.; Ge, K.; Yan, Y.; Dawson, K.A.; Guo, S.; Zhang, J. The Yin and Yang of the protein corona on the delivery journey of nanoparticles. Nano Res. 2023, 16, 715–734. [Google Scholar] [CrossRef]
- Pinals, R.L.; Chio, L.; Ledesma, F.; Landry, M.P. Engineering at the nano-bio interface: Harnessing the protein corona towards nanoparticle design and function. Analyst 2020, 145, 5090–5112. [Google Scholar] [CrossRef] [PubMed]
- Schöttler, S.; Landfester, K.; Mailänder, V. Controlling the stealth effect of nanocarriers through understanding the protein corona. Angew. Chem. Int. Ed. 2016, 55, 8806–8815. [Google Scholar] [CrossRef] [PubMed]
- Nienhaus, K.; Nienhaus, G.U. Mechanistic Understanding of Protein Corona Formation around Nanoparticles: Old Puzzles and New Insights. Small 2023, 19, 2301663. [Google Scholar] [CrossRef] [PubMed]
- Ren, J.; Andrikopoulos, N.; Velonia, K.; Tang, H.; Cai, R.; Ding, F.; Ke, P.C.; Chen, C. Chemical and biophysical signatures of the protein corona in nanomedicine. J. Am. Chem. Soc. 2022, 144, 9184–9205. [Google Scholar] [CrossRef]
- Dawson, K.A.; Yan, Y. Current understanding of biological identity at the nanoscale and future prospects. Nat. Nanotech. 2021, 16, 229–242. [Google Scholar] [CrossRef]
- Walkey, C.D.; Chan, W.C. Understanding and controlling the interaction of nanomaterials with proteins in a physiological environment. Chem. Soc. Rev. 2012, 41, 2780–2799. [Google Scholar] [CrossRef] [PubMed]
- Shamir, M.; Bar-On, Y.; Phillips, R.; Milo, R. SnapShot: Timescales in cell biology. Cell 2016, 164, 1302–1302.e1. [Google Scholar] [CrossRef] [PubMed]
- Copeland, R.A. The drug–target residence time model: A 10-year retrospective. Nat. Rev. Drug Discov. 2016, 15, 87–95. [Google Scholar] [CrossRef] [PubMed]
- Vilanova, O.; Mittag, J.J.; Kelly, P.M.; Milani, S.; Dawson, K.A.; Rädler, J.O.; Franzese, G. Understanding the kinetics of protein–nanoparticle corona formation. ACS Nano 2016, 10, 10842–10850. [Google Scholar] [CrossRef]
- Sousa, A.A. Impact of soft protein interactions on the excretion, extent of receptor occupancy and tumor accumulation of ultrasmall metal nanoparticles: A compartmental model simulation. RSC Adv. 2019, 9, 26927–26941. [Google Scholar] [CrossRef]
- Barrán-Berdón, A.L.; Pozzi, D.; Caracciolo, G.; Capriotti, A.L.; Caruso, G.; Cavaliere, C.; Riccioli, A.; Palchetti, S.; Lagana, A. Time evolution of nanoparticle–protein corona in human plasma: Relevance for targeted drug delivery. Langmuir 2013, 29, 6485–6494. [Google Scholar] [CrossRef] [PubMed]
- Sahneh, F.D.; Scoglio, C.M.; Monteiro-Riviere, N.A.; Riviere, J.E. Predicting the impact of biocorona formation kinetics on interspecies extrapolations of nanoparticle biodistribution modeling. Nanomedicine 2015, 10, 25–33. [Google Scholar] [CrossRef]
- Batista, F.D.; Neuberger, M.S. Affinity dependence of the B cell response to antigen: A threshold, a ceiling, and the importance of off-rate. Immunity 1998, 8, 751–759. [Google Scholar] [CrossRef]
- Kontermann, R.E. Strategies to extend plasma half-lives of recombinant antibodies. BioDrugs 2009, 23, 93–109. [Google Scholar] [CrossRef]
- Milo, R.; Jorgensen, P.; Moran, U.; Weber, G.; Springer, M. BioNumbers—The database of key numbers in molecular and cell biology. Nuclei Acids Res. 2010, 38, D750–D753. [Google Scholar] [CrossRef]
- Schaller, J.; Gerber, S.; Kaempfer, U.; Lejon, S.; Trachsel, C. Human Blood Plasma Proteins: Structure and Function; John Wiley & Sons: Hoboken, NJ, USA, 2008. [Google Scholar]
- Strasser, A.; Wittmann, H.-J.; Seifert, R. Binding kinetics and pathways of ligands to GPCRs. Trends Pharm. Sci. 2017, 38, 717–732. [Google Scholar] [CrossRef]
- Wagaman, A.S.; Coburn, A.; Brand-Thomas, I.; Dash, B.; Jaswal, S.S. A comprehensive database of verified experimental data on protein folding kinetics. Prot. Sci. 2014, 23, 1808–1812. [Google Scholar] [CrossRef] [PubMed]
- Goldstein, J.L.; Brown, M.S. The LDL receptor. Arterios. Thromb. Vasc. Biol. 2009, 29, 431–438. [Google Scholar] [CrossRef] [PubMed]
- Tonge, P.J. Drug–target kinetics in drug discovery. ACS Chem. Neurosc. 2018, 9, 29–39. [Google Scholar] [CrossRef]
- van der Velden, W.J.; Heitman, L.H.; Rosenkilde, M.M. Perspective: Implications of ligand–receptor binding kinetics for therapeutic targeting of G protein-coupled receptors. ACS Pharm. Transl. Sci. 2020, 3, 179–189. [Google Scholar] [CrossRef] [PubMed]
- de Witte, W.E.; Danhof, M.; van der Graaf, P.H.; de Lange, E.C. In vivo target residence time and kinetic selectivity: The association rate constant as determinant. Trends Pharm. Sci. 2016, 37, 831–842. [Google Scholar] [CrossRef] [PubMed]
- Vauquelin, G. Effects of target binding kinetics on in vivo drug efficacy: Koff, kon and rebinding. Br. J. Pharm. 2016, 173, 2319–2334. [Google Scholar] [CrossRef]
- Dahl, G.; Akerud, T. Pharmacokinetics and the drug–target residence time concept. Drug Discov. Today 2013, 18, 697–707. [Google Scholar] [CrossRef]
- Copeland, R.A. Evolution of the drug-target residence time model. Exp. Opin. Drug Discov. 2021, 16, 1441–1451. [Google Scholar] [CrossRef]
- Daryaee, F.; Tonge, P.J. Pharmacokinetic–pharmacodynamic models that incorporate drug–target binding kinetics. Curr. Opin. Chem. Biol. 2019, 50, 120–127. [Google Scholar] [CrossRef]
- Smoluchowski, M. Mathematical theory of the kinetics of the coagulation of colloidal solutions. Z. Phys. Chem. 1917, 92, 129–168. [Google Scholar]
- Schreiber, G.; Haran, G.; Zhou, H.-X. Fundamental aspects of protein−protein association kinetics. Chem. Rev. 2009, 109, 839–860. [Google Scholar] [CrossRef]
- Zhou, H.-X.; Bates, P.A. Modeling protein association mechanisms and kinetics. Curr. Opin. Struct. Biol. 2013, 23, 887–893. [Google Scholar] [CrossRef] [PubMed]
- Schreiber, G. Kinetic studies of protein–protein interactions. Curr. Opin. Struct. Biol. 2002, 12, 41–47. [Google Scholar] [CrossRef] [PubMed]
- Gianni, S.; Jemth, P. How Fast Is Protein–Ligand Association? Trends Biochem. Sci. 2017, 42, 847–849. [Google Scholar] [CrossRef]
- Kiel, C.; Selzer, T.; Shaul, Y.; Schreiber, G.; Herrmann, C. Electrostatically optimized Ras-binding Ral guanine dissociation stimulator mutants increase the rate of association by stabilizing the encounter complex. Proc. Nat. Acad. Sci. USA 2004, 101, 9223–9228. [Google Scholar] [CrossRef]
- Bagshaw, C.R. Biomolecular Kinetics: A Step-by-Step Guide; CRC Press: Boca Raton, FL, USA, 2017. [Google Scholar]
- Schasfoort, R.B. Handbook of Surface Plasmon Resonance; Royal Society of Chemistry: Croydon, UK, 2017. [Google Scholar]
- Zheng, X.; Bi, C.; Li, Z.; Podariu, M.; Hage, D.S. Analytical methods for kinetic studies of biological interactions: A review. J. Pharm. Biomed. Anal. 2015, 113, 163–180. [Google Scholar] [CrossRef]
- Weltz, J.S.; Schwartz, D.K.; Kaar, J.L. Surface-mediated protein unfolding as a search process for denaturing sites. ACS Nano 2016, 10, 730–738. [Google Scholar] [CrossRef] [PubMed]
- Lyu, K.; Chen, H.; Gao, J.; Jin, J.; Shi, H.; Schwartz, D.K.; Wang, D. Protein desorption kinetics depends on the timescale of observation. Biomacromolecules 2022, 23, 4709–4717. [Google Scholar] [CrossRef] [PubMed]
- Dominguez-Medina, S.; Kisley, L.; Tauzin, L.J.; Hoggard, A.; Shuang, B.; DS Indrasekara, A.S.; Chen, S.; Wang, L.-Y.; Derry, P.J.; Liopo, A.; et al. Adsorption and unfolding of a single protein triggers nanoparticle aggregation. ACS Nano 2016, 10, 2103–2112. [Google Scholar] [CrossRef] [PubMed]
- Feiner-Gracia, N.; Beck, M.; Pujals, S.; Tosi, S.; Mandal, T.; Buske, C.; Linden, M.; Albertazzi, L. Super-resolution microscopy unveils dynamic heterogeneities in nanoparticle protein corona. Small 2017, 13, 1701631. [Google Scholar] [CrossRef]
- Pujals, S.; Feiner-Gracia, N.; Delcanale, P.; Voets, I.; Albertazzi, L. Super-resolution microscopy as a powerful tool to study complex synthetic materials. Nat. Rev. Chem. 2019, 3, 68–84. [Google Scholar] [CrossRef]
- Khan, S.; Gupta, A.; Verma, N.; Nandi, C. Kinetics of protein adsorption on gold nanoparticle with variable protein structure and nanoparticle size. J. Chem. Phys. 2015, 143, 164709. [Google Scholar] [CrossRef]
- Satzer, P.; Svec, F.; Sekot, G.; Jungbauer, A. Protein adsorption onto nanoparticles induces conformational changes: Particle size dependency, kinetics, and mechanisms. Eng. Life Sci. 2016, 16, 238–246. [Google Scholar] [CrossRef]
- Deng, Z.J.; Liang, M.; Toth, I.; Monteiro, M.J.; Minchin, R.F. Molecular interaction of poly (acrylic acid) gold nanoparticles with human fibrinogen. ACS Nano 2012, 6, 8962–8969. [Google Scholar] [CrossRef] [PubMed]
- Latreille, P.-L.; Le Goas, M.; Salimi, S.; Robert, J.; De Crescenzo, G.; Boffito, D.C.; Martinez, V.A.; Hildgen, P.; Banquy, X. Scratching the surface of the protein corona: Challenging measurements and controversies. ACS Nano 2022, 16, 1689–1707. [Google Scholar] [CrossRef]
- Assfalg, M.; Ragona, L.; Pagano, K.; D’Onofrio, M.; Zanzoni, S.; Tomaselli, S.; Molinari, H. The study of transient protein–nanoparticle interactions by solution NMR spectroscopy. Biochim. Biophys. Acta Prot. Proteom. 2016, 1864, 102–114. [Google Scholar] [CrossRef]
- An, Y.; Sedinkin, S.L.; Venditti, V. Solution NMR methods for structural and thermodynamic investigation of nanoparticle adsorption equilibria. Nanoscale Adv. 2022, 4, 2583–2607. [Google Scholar] [CrossRef] [PubMed]
- Xu, J.X.; Alom, M.S.; Fitzkee, N.C. Quantitative measurement of multiprotein nanoparticle interactions using NMR spectroscopy. Anal. Chem. 2021, 93, 11982–11990. [Google Scholar] [CrossRef]
- Randika Perera, Y.; Hill, R.A.; Fitzkee, N.C. Protein interactions with nanoparticle surfaces: Highlighting solution NMR techniques. Israel J. Chem. 2019, 59, 962–979. [Google Scholar] [CrossRef] [PubMed]
- Ceccon, A.; Tugarinov, V.; Bax, A.; Clore, G.M. Global dynamics and exchange kinetics of a protein on the surface of nanoparticles revealed by relaxation-based solution NMR spectroscopy. J. Am. Chem. Soc. 2016, 138, 5789–5792. [Google Scholar] [CrossRef] [PubMed]
- Ceccon, A.; Lelli, M.; D’Onofrio, M.; Molinari, H.; Assfalg, M. Dynamics of a globular protein adsorbed to liposomal nanoparticles. J. Am. Chem. Soc. 2014, 136, 13158–13161. [Google Scholar] [CrossRef]
- Wang, A.; Vo, T.; Le, V.; Fitzkee, N.C. Using hydrogen–deuterium exchange to monitor protein structure in the presence of gold nanoparticles. J. Phys. Chem. B 2014, 118, 14148–14156. [Google Scholar] [CrossRef]
- Srinivasan, K.; Parimal, S.; Lopez, M.M.; McCallum, S.A.; Cramer, S.M. Investigation into the molecular and thermodynamic basis of protein interactions in multimodal chromatography using functionalized nanoparticles. Langmuir 2014, 30, 13205–13216. [Google Scholar] [CrossRef]
- Saftics, A.; Kurunczi, S.; Peter, B.; Szekacs, I.; Ramsden, J.J.; Horvath, R. Data evaluation for surface-sensitive label-free methods to obtain real-time kinetic and structural information of thin films: A practical review with related software packages. Adv. Coll. Int. Sci. 2021, 294, 102431. [Google Scholar] [CrossRef] [PubMed]
- Day, Y.S.; Baird, C.L.; Rich, R.L.; Myszka, D.G. Direct comparison of binding equilibrium, thermodynamic, and rate constants determined by surface-and solution-based biophysical methods. Prot. Sci. 2002, 11, 1017–1025. [Google Scholar] [CrossRef] [PubMed]
- Svitel, J.; Balbo, A.; Mariuzza, R.A.; Gonzales, N.R.; Schuck, P. Combined affinity and rate constant distributions of ligand populations from experimental surface binding kinetics and equilibria. Biophys. J. 2003, 84, 4062–4077. [Google Scholar] [CrossRef] [PubMed]
- Zhao, H.; Gorshkova, I.I.; Fu, G.L.; Schuck, P. A comparison of binding surfaces for SPR biosensing using an antibody–antigen system and affinity distribution analysis. Methods 2013, 59, 328–335. [Google Scholar] [CrossRef] [PubMed]
- Zhao, H.; Boyd, L.F.; Schuck, P. Measuring protein interactions by optical biosensors. Curr. Prot. Prot. Sci. 2017, 88, 20.2.1–20.2.25. [Google Scholar] [CrossRef]
- Stordy, B.; Zhang, Y.; Sepahi, Z.; Khatami, M.H.; Kim, P.M.; Chan, W.C. Conjugating ligands to an equilibrated nanoparticle protein corona enables cell targeting in serum. Chem. Mat. 2022, 34, 6868–6882. [Google Scholar] [CrossRef]
- Baimanov, D.; Wang, J.; Zhang, J.; Liu, K.; Cong, Y.; Shi, X.; Zhang, X.; Li, Y.; Li, X.; Qiao, R.; et al. In situ analysis of nanoparticle soft corona and dynamic evolution. Nat. Commun. 2022, 13, 5389. [Google Scholar] [CrossRef]
- Sousa, A.A.; Schuck, P.; Hassan, S.A. Biomolecular interactions of ultrasmall metallic nanoparticles and nanoclusters. Nanoscale Adv. 2021, 3, 2995–3027. [Google Scholar] [CrossRef]
- Zarschler, K.; Rocks, L.; Licciardello, N.; Boselli, L.; Polo, E.; Garcia, K.P.; De Cola, L.; Stephan, H.; Dawson, K.A. Ultrasmall inorganic nanoparticles: State-of-the-art and perspectives for biomedical applications. Nanomed. Nanotech. Biol. Med. 2016, 12, 1663–1701. [Google Scholar] [CrossRef] [PubMed]
- Lira, A.L.; Ferreira, R.S.; Torquato, R.J.; Zhao, H.; Oliva, M.L.V.; Hassan, S.A.; Schuck, P.; Sousa, A.A. Binding kinetics of ultrasmall gold nanoparticles with proteins. Nanoscale 2018, 10, 3235–3244. [Google Scholar] [CrossRef] [PubMed]
- Nel, A.E.; Mädler, L.; Velegol, D.; Xia, T.; Hoek, E.M.; Somasundaran, P.; Klaessig, F.; Castranova, V.; Thompson, M. Understanding biophysicochemical interactions at the nano–bio interface. Nat. Mater. 2009, 8, 543–557. [Google Scholar] [CrossRef]
- Wang, H.; Ma, R.; Nienhaus, K.; Nienhaus, G.U. Formation of a monolayer protein corona around polystyrene nanoparticles and implications for nanoparticle agglomeration. Small 2019, 15, 1900974. [Google Scholar] [CrossRef]
- Wang, A.; Vangala, K.; Vo, T.; Zhang, D.; Fitzkee, N.C. A three-step model for protein–gold nanoparticle adsorption. J. Phys. Chem. C 2014, 118, 8134–8142. [Google Scholar] [CrossRef]
- Milani, S.; Baldelli Bombelli, F.; Pitek, A.S.; Dawson, K.A.; Radler, J. Reversible versus irreversible binding of transferrin to polystyrene nanoparticles: Soft and hard corona. ACS Nano 2012, 6, 2532–2541. [Google Scholar] [CrossRef] [PubMed]
- Canoa, P.; Simón-Vázquez, R.; Popplewell, J.; González-Fernández, Á. A quantitative binding study of fibrinogen and human serum albumin to metal oxide nanoparticles by surface plasmon resonance. Biosens. Bioelectr. 2015, 74, 376–383. [Google Scholar] [CrossRef] [PubMed]
- Canovi, M.; Lucchetti, J.; Stravalaci, M.; Re, F.; Moscatelli, D.; Bigini, P.; Salmona, M.; Gobbi, M. Applications of surface plasmon resonance (SPR) for the characterization of nanoparticles developed for biomedical purposes. Sensors 2012, 12, 16420–16432. [Google Scholar] [CrossRef] [PubMed]
- das Dores Aguiar, C.; Coelho, Y.L.; de Paula, H.M.C.; Santa Rosa, L.N.; Virtuoso, L.S.; de Oliveira Mendes, T.A.; dos Santos Pires, A.C.; da Silva, L.H.M. Thermodynamic and kinetic insights into the interactions between functionalized CdTe quantum dots and human serum albumin: A surface plasmon resonance approach. Int. J. Biol. Macromol. 2021, 184, 990–999. [Google Scholar] [CrossRef] [PubMed]
- Gobbi, M.; Re, F.; Canovi, M.; Beeg, M.; Gregori, M.; Sesana, S.; Sonnino, S.; Brogioli, D.; Musicanti, C.; Gasco, P. Lipid-based nanoparticles with high binding affinity for amyloid-β1–42 peptide. Biomaterials 2010, 31, 6519–6529. [Google Scholar] [CrossRef]
- Patra, A.; Ding, T.; Engudar, G.; Wang, Y.; Dykas, M.M.; Liedberg, B.; Kah, J.C.Y.; Venkatesan, T.; Drum, C.L. Component-specific analysis of plasma protein corona formation on gold nanoparticles using multiplexed surface plasmon resonance. Small 2016, 12, 1174–1182. [Google Scholar] [CrossRef]
- Shibata, H.; Yoshida, H.; Izutsu, K.-I.; Haishima, Y.; Kawanishi, T.; Okuda, H.; Goda, Y. Interaction kinetics of serum proteins with liposomes and their effect on phospholipase-induced liposomal drug release. Int. J. Pharm. 2015, 495, 827–839. [Google Scholar] [CrossRef]
- Röcker, C.; Pötzl, M.; Zhang, F.; Parak, W.J.; Nienhaus, G.U. A quantitative fluorescence study of protein monolayer formation on colloidal nanoparticles. Nat. Nanotech. 2009, 4, 577–580. [Google Scholar] [CrossRef] [PubMed]
- Dell’Orco, D.; Lundqvist, M.; Oslakovic, C.; Cedervall, T.; Linse, S. Modeling the time evolution of the nanoparticle-protein corona in a body fluid. PLoS ONE 2010, 5, e10949. [Google Scholar] [CrossRef]
- Pan, H.; Qin, M.; Meng, W.; Cao, Y.; Wang, W. How do proteins unfold upon adsorption on nanoparticle surfaces? Langmuir 2012, 28, 12779–12787. [Google Scholar] [CrossRef]
- Mohammad-Beigi, H.; Hayashi, Y.; Zeuthen, C.M.; Eskandari, H.; Scavenius, C.; Juul-Madsen, K.; Vorup-Jensen, T.; Enghild, J.J.; Sutherland, D.S. Mapping and identification of soft corona proteins at nanoparticles and their impact on cellular association. Nat. Commun. 2020, 11, 4535. [Google Scholar] [CrossRef] [PubMed]
- Prasad, J.; Viollet, S.; Gurunatha, K.L.; Urvoas, A.; Fournier, A.C.; Valerio-Lepiniec, M.; Marcelot, C.; Baris, B.; Minard, P.; Dujardin, E. Directed evolution of artificial repeat proteins as habit modifiers for the morphosynthesis of (111)-terminated gold nanocrystals. Nanoscale 2019, 11, 17485–17497. [Google Scholar] [CrossRef]
- de Macedo, E.F.; Santos, N.S.; Nascimento, L.S.; Mathey, R.; Brenet, S.; de Moura, M.S.; Hou, Y.; Tada, D.B. Interaction between Nanoparticles, Membranes and Proteins: A Surface Plasmon Resonance Study. Int. J. Mol. Sci. 2022, 24, 591. [Google Scholar] [CrossRef] [PubMed]
- Brahmkhatri, V.P.; Singh, A.; Chakraborty, A.; Sharma, R.S.; Chandra, K.; Atreya, H.S. Multilayer protein corona on gold nanorod surface: First evidence of soft corona protein-protein interactions using solution NMR spectroscopy. Appl. Surf. Sci. Adv. 2022, 11, 100272. [Google Scholar] [CrossRef]
- Piella, J.; Bastús, N.G.; Puntes, V. Size-dependent protein–nanoparticle interactions in citrate-stabilized gold nanoparticles: The emergence of the protein corona. Bioconj. Chem. 2017, 28, 88–97. [Google Scholar] [CrossRef]
- Weiss, A.C.; Krüger, K.; Besford, Q.A.; Schlenk, M.; Kempe, K.; Förster, S.; Caruso, F. In situ characterization of protein corona formation on silica microparticles using confocal laser scanning microscopy combined with microfluidics. ACS Appl. Mat. Int. 2019, 11, 2459–2469. [Google Scholar] [CrossRef]
- Wang, H.; Lin, Y.; Nienhaus, K.; Nienhaus, G.U. The protein corona on nanoparticles as viewed from a nanoparticle-sizing perspective. Wiley Interdisc. Rev. Nanomed. Nanobiotech. 2018, 10, e1500. [Google Scholar] [CrossRef]
- Engel, M.F.; van Mierlo, C.P.; Visser, A.J. Kinetic and structural characterization of adsorption-induced unfolding of bovine α-lactalbumin. J. Biol. Chem. 2002, 277, 10922–10930. [Google Scholar] [CrossRef]
- Kopp, M.; Kollenda, S.; Epple, M. Nanoparticle–protein interactions: Therapeutic approaches and supramolecular chemistry. Acc. Chem. Res. 2017, 50, 1383–1390. [Google Scholar] [CrossRef]
- Ferreira, R.S.; Lira, A.L.; Sousa, A.A. Quantitative mechanistic model for ultrasmall nanoparticle–protein interactions. Nanoscale 2020, 12, 19230–19240. [Google Scholar] [CrossRef]
- Gupta, A.; Ndugire, W.; Hirschbiegel, C.-M.; Grigely, L.; Rotello, V.M. Interfacing Nanomaterials with Biology through Ligand Engineering. Acc. Chem. Res. 2023, 56, 2151–2169. [Google Scholar] [CrossRef] [PubMed]
- De, M.; You, C.-C.; Srivastava, S.; Rotello, V.M. Biomimetic interactions of proteins with functionalized nanoparticles: A thermodynamic study. J. Am. Chem. Soc. 2007, 129, 10747–10753. [Google Scholar] [CrossRef] [PubMed]
- Lima, A.F.; Guido, V.S.; Mina, N.; Torquato, R.J.; Sousa, A.A. Time Evolution of Ultrasmall Gold Nanoparticle–Protein Interactions. Langmuir 2023, 39, 6823–6836. [Google Scholar] [CrossRef] [PubMed]
- Yin, M.-M.; Chen, W.-Q.; Lu, Y.-Q.; Han, J.-Y.; Liu, Y.; Jiang, F.-L. A model beyond protein corona: Thermodynamics and binding stoichiometries of the interactions between ultrasmall gold nanoclusters and proteins. Nanoscale 2020, 12, 4573–4585. [Google Scholar] [CrossRef]
- Yin, M.-M.; Dong, P.; Chen, W.-Q.; Xu, S.-P.; Yang, L.-Y.; Jiang, F.-L.; Liu, Y. Thermodynamics and mechanisms of the interactions between ultrasmall fluorescent gold nanoclusters and human serum albumin, γ-globulins, and transferrin: A spectroscopic approach. Langmuir 2017, 33, 5108–5116. [Google Scholar] [CrossRef]
- Boselli, L.; Polo, E.; Castagnola, V.; Dawson, K.A. Regimes of biomolecular ultrasmall nanoparticle interactions. Angew. Chem. 2017, 129, 4279–4282. [Google Scholar] [CrossRef]
- Ferreira, R.S.; Lira, A.L.; Torquato, R.J.; Schuck, P.; Sousa, A.A. Mechanistic insights into ultrasmall gold nanoparticle–protein interactions through measurement of binding kinetics. J. Phy. Chem. C 2019, 123, 28450–28459. [Google Scholar] [CrossRef]
- Lira, A.L.; Ferreira, R.S.; Oliva, M.L.V.; Sousa, A.A. Regulation of thrombin activity with ultrasmall nanoparticles: Effects of surface chemistry. Langmuir 2020, 36, 7991–8001. [Google Scholar] [CrossRef] [PubMed]
- Lira, A.L.; Ferreira, R.S.; Torquato, R.J.; Oliva, M.L.V.; Schuck, P.; Sousa, A.A. Allosteric inhibition of α-thrombin enzymatic activity with ultrasmall gold nanoparticles. Nanoscale Adv. 2019, 1, 378–388. [Google Scholar] [CrossRef] [PubMed]
- Lira, A.L.; Mina, N.; Bonturi, C.R.; Nogueira, R.S.; Torquato, R.J.; Oliva, M.L.V.; Sousa, A.A. Anionic Ultrasmall Gold Nanoparticles Bind to Coagulation Factors and Disturb Normal Hemostatic Balance. Chem. Res. Tox. 2022, 35, 1558–1569. [Google Scholar] [CrossRef] [PubMed]
- Knittel, L.L.; Schuck, P.; Ackerson, C.J.; Sousa, A.A. Zwitterionic glutathione monoethyl ester as a new capping ligand for ultrasmall gold nanoparticles. RSC Adv. 2016, 6, 46350–46355. [Google Scholar] [CrossRef]
- Perrins, R.D.; McCarthy, L.-A.; Robinson, A.; Spry, K.L.; Cognet, V.; Ferreira, A.; Porter, J.; Rodriguez, M.Á.; Lopez, D.; Perera, I. Targeting Ultrasmall Gold Nanoparticles with cRGD Peptide Increases the Uptake and Efficacy of Cytotoxic Payload. Nanomaterials 2022, 12, 4013. [Google Scholar] [CrossRef]
- Ruks, T.; Loza, K.; Heggen, M.; Prymak, O.; Sehnem, A.L.; Oliveira, C.L.; Bayer, P.; Beuck, C.; Epple, M. Peptide-conjugated ultrasmall gold nanoparticles (2 nm) for selective protein targeting. ACS Appl. Bio Mat. 2021, 4, 945–965. [Google Scholar] [CrossRef]
- Seiler, T.; Lennartz, A.; Klein, K.; Hommel, K.; Figueroa Bietti, A.; Hadrovic, I.; Kollenda, S.; Sager, J.; Beuck, C.; Chlosta, E.; et al. Potentiating tweezer affinity to a protein interface with sequence-defined macromolecules on nanoparticles. Biomacromolecules 2023, 24, 3666–3679. [Google Scholar] [CrossRef]
- Knittel, L.L.; Zhao, H.; Nguyen, A.; Miranda, A.; Schuck, P.; Sousa, A.A. Ultrasmall gold nanoparticles coated with zwitterionic glutathione monoethyl ester: A model platform for the incorporation of functional peptides. J. Phys. Chem. B 2020, 124, 3892–3902. [Google Scholar] [CrossRef]
- Luo, D.; Wang, X.; Zeng, S.; Ramamurthy, G.; Burda, C.; Basilion, J.P. Targeted gold nanocluster-enhanced radiotherapy of prostate cancer. Small 2019, 15, 1900968. [Google Scholar] [CrossRef]
- Song, X.-R.; Goswami, N.; Yang, H.-H.; Xie, J. Functionalization of metal nanoclusters for biomedical applications. Analyst 2016, 141, 3126–3140. [Google Scholar] [CrossRef]
- Hada, A.-M.; Craciun, A.-M.; Focsan, M.; Borlan, R.; Soritau, O.; Todea, M.; Astilean, S. Folic acid functionalized gold nanoclusters for enabling targeted fluorescence imaging of human ovarian cancer cells. Talanta 2021, 225, 121960. [Google Scholar] [CrossRef]
- Muraca, F.; Boselli, L.; Castagnola, V.; Dawson, K.A. Ultrasmall gold nanoparticle cellular uptake: Influence of transient bionano interactions. ACS Appl. Bio Mat. 2020, 3, 3800–3808. [Google Scholar] [CrossRef]
- Casals, E.; Pfaller, T.; Duschl, A.; Oostingh, G.J.; Puntes, V. Time evolution of the nanoparticle protein corona. ACS Nano 2010, 4, 3623–3632. [Google Scholar] [CrossRef]
- Galdino, F.E.; Picco, A.S.; Capeletti, L.B.; Bettini, J.; Cardoso, M.B. Inside the protein corona: From binding parameters to unstained hard and soft coronas visualization. Nano Lett. 2021, 21, 8250–8257. [Google Scholar] [CrossRef] [PubMed]
- García-Álvarez, R.; Vallet-Regí, M. Hard and soft protein corona of nanomaterials: Analysis and relevance. Nanomaterials 2021, 11, 888. [Google Scholar] [CrossRef] [PubMed]
- Latreille, P.L.; Rabanel, J.M.; Le Goas, M.; Salimi, S.; Arlt, J.; Patten, S.A.; Ramassamy, C.; Hildgen, P.; Martinez, V.A.; Banquy, X. In Situ Characterization of the Protein Corona of Nanoparticles In Vitro and In Vivo. Adv. Mat. 2022, 34, 2203354. [Google Scholar] [CrossRef]
- Weiss, A.C.; Kempe, K.; Förster, S.; Caruso, F. Microfluidic examination of the “hard” biomolecular corona formed on engineered particles in different biological milieu. Biomacromolecules 2018, 19, 2580–2594. [Google Scholar] [CrossRef]
- Tenzer, S.; Docter, D.; Kuharev, J.; Musyanovych, A.; Fetz, V.; Hecht, R.; Schlenk, F.; Fischer, D.; Kiouptsi, K.; Reinhardt, C.; et al. Rapid formation of plasma protein corona critically affects nanoparticle pathophysiology. Nat. Nanotech. 2013, 8, 772–781. [Google Scholar] [CrossRef] [PubMed]
- Latour, R.A. Fundamental principles of the thermodynamics and kinetics of protein adsorption to material surfaces. Coll. Surf. B Bioint. 2020, 191, 110992. [Google Scholar] [CrossRef] [PubMed]
- Vroman, L.; Adams, A.; Fischer, G.; Munoz, P. Interaction of high molecular weight kininogen, factor XII, and fibrinogen in plasma at interfaces. Blood 1980, 55, 156–159. [Google Scholar] [CrossRef]
- Vroman, L.; Adams, A.L. Findings with the recording ellipsometer suggesting rapid exchange of specific plasma proteins at liquid/solid interfaces. Surf. Sci. 1969, 16, 438–446. [Google Scholar] [CrossRef]
- Rabe, M.; Verdes, D.; Seeger, S. Understanding protein adsorption phenomena at solid surfaces. Adv. Coll. Int. Sci. 2011, 162, 87–106. [Google Scholar] [CrossRef]
- Darabi Sahneh, F.; Scoglio, C.; Riviere, J. Dynamics of nanoparticle-protein corona complex formation: Analytical results from population balance equations. PLoS ONE 2013, 8, e64690. [Google Scholar] [CrossRef]
- Zhdanov, V.P. Late stage of the formation of a protein corona around nanoparticles in biofluids. Phys. Rev. E 2022, 105, 014402. [Google Scholar] [CrossRef] [PubMed]
- Zhdanov, V.P. Formation of a protein corona around nanoparticles. Curr. Opin. Coll. Int. Sci. 2019, 41, 95–103. [Google Scholar] [CrossRef]
- Docter, D.; Westmeier, D.; Markiewicz, M.; Stolte, S.; Knauer, S.; Stauber, R. The nanoparticle biomolecule corona: Lessons learned–challenge accepted? Chem. Soc. Rev. 2015, 44, 6094–6121. [Google Scholar] [CrossRef] [PubMed]
- Hadjidemetriou, M.; Al-Ahmady, Z.; Kostarelos, K. Time-evolution of in vivo protein corona onto blood-circulating PEGylated liposomal doxorubicin (DOXIL) nanoparticles. Nanoscale 2016, 8, 6948–6957. [Google Scholar] [CrossRef] [PubMed]
- Weber, C.; Simon, J.; Mailänder, V.; Morsbach, S.; Landfester, K. Preservation of the soft protein corona in distinct flow allows identification of weakly bound proteins. Acta Biomat. 2018, 76, 217–224. [Google Scholar] [CrossRef] [PubMed]
- Kari, O.K.; Ndika, J.; Parkkila, P.; Louna, A.; Lajunen, T.; Puustinen, A.; Viitala, T.; Alenius, H.; Urtti, A. In situ analysis of liposome hard and soft protein corona structure and composition in a single label-free workflow. Nanoscale 2020, 12, 1728–1741. [Google Scholar] [CrossRef]
- Del Pino, P.; Pelaz, B.; Zhang, Q.; Maffre, P.; Nienhaus, G.U.; Parak, W.J. Protein corona formation around nanoparticles–from the past to the future. Mat. Horiz. 2014, 1, 301–313. [Google Scholar] [CrossRef]
- Li, L.; Mu, Q.; Zhang, B.; Yan, B. Analytical strategies for detecting nanoparticle–protein interactions. Analyst 2010, 135, 1519–1530. [Google Scholar] [CrossRef] [PubMed]
- Carrillo-Carrion, C.; Carril, M.; Parak, W.J. Techniques for the experimental investigation of the protein corona. Curr. Opin. Biotechnol. 2017, 46, 106–113. [Google Scholar] [CrossRef]
- Morsbach, S.; Gonella, G.; Mailänder, V.; Wegner, S.; Wu, S.; Weidner, T.; Berger, R.; Koynov, K.; Vollmer, D.; Encinas, N.; et al. Engineering proteins at interfaces: From complementary characterization to material surfaces with designed functions. Angew. Chem. Int. Ed. 2018, 57, 12626–12648. [Google Scholar] [CrossRef]
- Hühn, J.; Fedeli, C.; Zhang, Q.; Masood, A.; Del Pino, P.; Khashab, N.M.; Papini, E.; Parak, W.J. Dissociation coefficients of protein adsorption to nanoparticles as quantitative metrics for description of the protein corona: A comparison of experimental techniques and methodological relevance. Int. J. Biochem. Cell Biol. 2016, 75, 148–161. [Google Scholar] [CrossRef] [PubMed]
- Sousa, A.A. Biophysical Characterization of Nanoparticle-Protein Interactions by Fluorescence Quenching Titration: Limitations, Pitfalls, and Application of a Model-Free Approach for Data Analysis. In Reviews in Fluorescence 2017; Springer: Berlin/Heidelberg, Germany, 2018; pp. 53–73. [Google Scholar]
- Sousa, A.A. A note on the use of steady–state fluorescence quenching to quantify nanoparticle–protein interactions. J. Fluoresc. 2015, 25, 1567–1575. [Google Scholar] [CrossRef] [PubMed]
- Fedeli, C.; Segat, D.; Tavano, R.; Bubacco, L.; De Franceschi, G.; de Laureto, P.P.; Lubian, E.; Selvestrel, F.; Mancin, F.; Papini, E. The functional dissection of the plasma corona of SiO 2-NPs spots histidine rich glycoprotein as a major player able to hamper nanoparticle capture by macrophages. Nanoscale 2015, 7, 17710–17728. [Google Scholar] [CrossRef] [PubMed]
- Abbina, S.; Takeuchi, L.E.; Anilkumar, P.; Yu, K.; Rogalski, J.C.; Shenoi, R.A.; Constantinescu, I.; Kizhakkedathu, J.N. Blood circulation of soft nanomaterials is governed by dynamic remodeling of protein opsonins at nano-biointerface. Nat. Commun. 2020, 11, 3048. [Google Scholar] [CrossRef]
- Bertrand, N.; Grenier, P.; Mahmoudi, M.; Lima, E.M.; Appel, E.A.; Dormont, F.; Lim, J.-M.; Karnik, R.; Langer, R.; Farokhzad, O.C. Mechanistic understanding of in vivo protein corona formation on polymeric nanoparticles and impact on pharmacokinetics. Nat. Commun. 2017, 8, 777. [Google Scholar] [CrossRef]
- Zhang, Z.; Guan, J.; Jiang, Z.; Yang, Y.; Liu, J.; Hua, W.; Mao, Y.; Li, C.; Lu, W.; Qian, J. Brain-targeted drug delivery by manipulating protein corona functions. Nat. Commun. 2019, 10, 3561. [Google Scholar] [CrossRef]
- Lazarovits, J.; Sindhwani, S.; Tavares, A.J.; Zhang, Y.; Song, F.; Audet, J.; Krieger, J.R.; Syed, A.M.; Stordy, B.; Chan, W.C. Supervised learning and mass spectrometry predicts the in vivo fate of nanomaterials. ACS Nano 2019, 13, 8023–8034. [Google Scholar] [CrossRef]
- Li, H.; Wang, Y.; Tang, Q.; Yin, D.; Tang, C.; He, E.; Zou, L.; Peng, Q. The protein corona and its effects on nanoparticle-based drug delivery systems. Acta Biomat. 2021, 129, 57–72. [Google Scholar] [CrossRef] [PubMed]
Figure 1.
The significance of kinetics and timescales in bio–nano interactions.

Figure 2.
Free energy profiles characteristic of (A) one-step and (B) two-step binding reactions between receptor (R) and ligand (L) proteins. The free energy of binding is indicated by ΔGD. See text for additional details.
Figure 2.
Free energy profiles characteristic of (A) one-step and (B) two-step binding reactions between receptor (R) and ligand (L) proteins. The free energy of binding is indicated by ΔGD. See text for additional details.

Figure 3.
Illustration of a three-step binding reaction between protein and NP. (A) Schematic representation and (B) free energy profile of the three-step binding reaction.
Figure 3.
Illustration of a three-step binding reaction between protein and NP. (A) Schematic representation and (B) free energy profile of the three-step binding reaction.

Figure 4.
Compilation of NP–protein interaction kinetics data. (A) kon and koff rate constants for both large and ultrasmall NPs. Dashed lines delineate distinct KD values in the kon–koff plot. (B) Compilation of koff rate constants and corresponding tr values for large and ultrasmall NPs, including studies with koff data only. Dark green triangles refer to interactions between functional usGNPs and their target receptor (see text for details). Specific values of the rate constants are provided in Supplementary Tables S1 and S2.

Figure 5.
Potential factors that may influence the kinetics of protein dissociation from the surface of NPs.
Figure 5.
Potential factors that may influence the kinetics of protein dissociation from the surface of NPs.

Figure 7.
Schematic illustration of hard and soft protein coronas and their main characteristics. (A) Protein multilayers: The first adsorbed layer constitutes the hard corona, while additional layers form the soft corona. (B) Protein monolayer: Both the hard and soft coronas originate from the same proteins within a single adsorbed layer. In this case, it may be hypothesized that neighboring proteins might restrict the ‘hardening’ of soft corona proteins by constraining their unfolding on the particle surface. (C) Primary characteristics of hard and soft protein coronas.

Figure 8.
Kinetics of protein corona formation and dissociation. (A) Dissociation kinetics of plasma proteins from copolymer NPs determined using SPR spectroscopy. Left: cartoon of immobilized NPs with interacting proteins and flowing buffer. Right: SPR data presented for more hydrophilic (blue) and hydrophobic (red) copolymer particles. Data were fitted (black lines) assuming independent weak and strong binding modes (Supplementary Table S3). (B) Dissociation kinetics of plasma proteins from gold NPs obtained through biolayer interferometry as a function of incubation time. Values of koff were derived assuming weak and strong binding modes (koff1 and koff2, respectively). (C) In vivo dissociation kinetics of fluorescently labeled serum proteins from silica NPs obtained using differential dynamic microscopy. (D) Kinetics of hard protein corona formation. Polyacrylamide gel electrophoresis was utilized to identify hard protein coronas formed from human serum and human blood as a function of incubation time. The graph illustrates the linearized relative protein band intensities plotted against the incubation time. Two kinetic phases can be discerned, with a transition time between phases at around 30 s (vertical lines). Reprinted or adapted with permission from ref. [6] (A), ref. [69] (B), ref. [119] (C), and ref. [120] (D).

Figure 9.
Mathematical modeling of protein corona formation process. (A) Schematics of protein corona formation. Proteins of type i attach to the NP surface with association and dissociation rate constants of ki,on and ki,off. On average, a maximum number of ni proteins of type i can occupy the NP surface. (B) Results from numerical simulations illustrating the time evolution of corona formation on copolymer NPs. HSA (red), HDL (blue), and fibrinogen (green) were used as model proteins in the simulations. Left and middle panels capture the first 0.05 and 20 s of simulation, respectively, while right panel depicts 20,000 s of simulation where a stable equilibrium has been reached. Reprinted with permission from ref. [126] (A) and ref. [85] (B).

Figure 10.
Temporal evolution of corona proteins on NPs. Four distinct protein groups were identified based on their time-dependent abundances. Reprinted with permission from ref. [129].
Figure 10.
Temporal evolution of corona proteins on NPs. Four distinct protein groups were identified based on their time-dependent abundances. Reprinted with permission from ref. [129].

Figure 11.
Quantitative assessment of soft protein corona association and dissociation kinetics. (A) Silica NPs were surface immobilized and precoated with an FBS hard corona. Apolipoprotein H (ApoH) was then flowed over the surface to interact with the corona-coated particles. (B) SPR binding traces for ApoH. (C) Results of a two-dimensional fit used to calculate the binding parameters. Reprinted with permission from ref. [87].


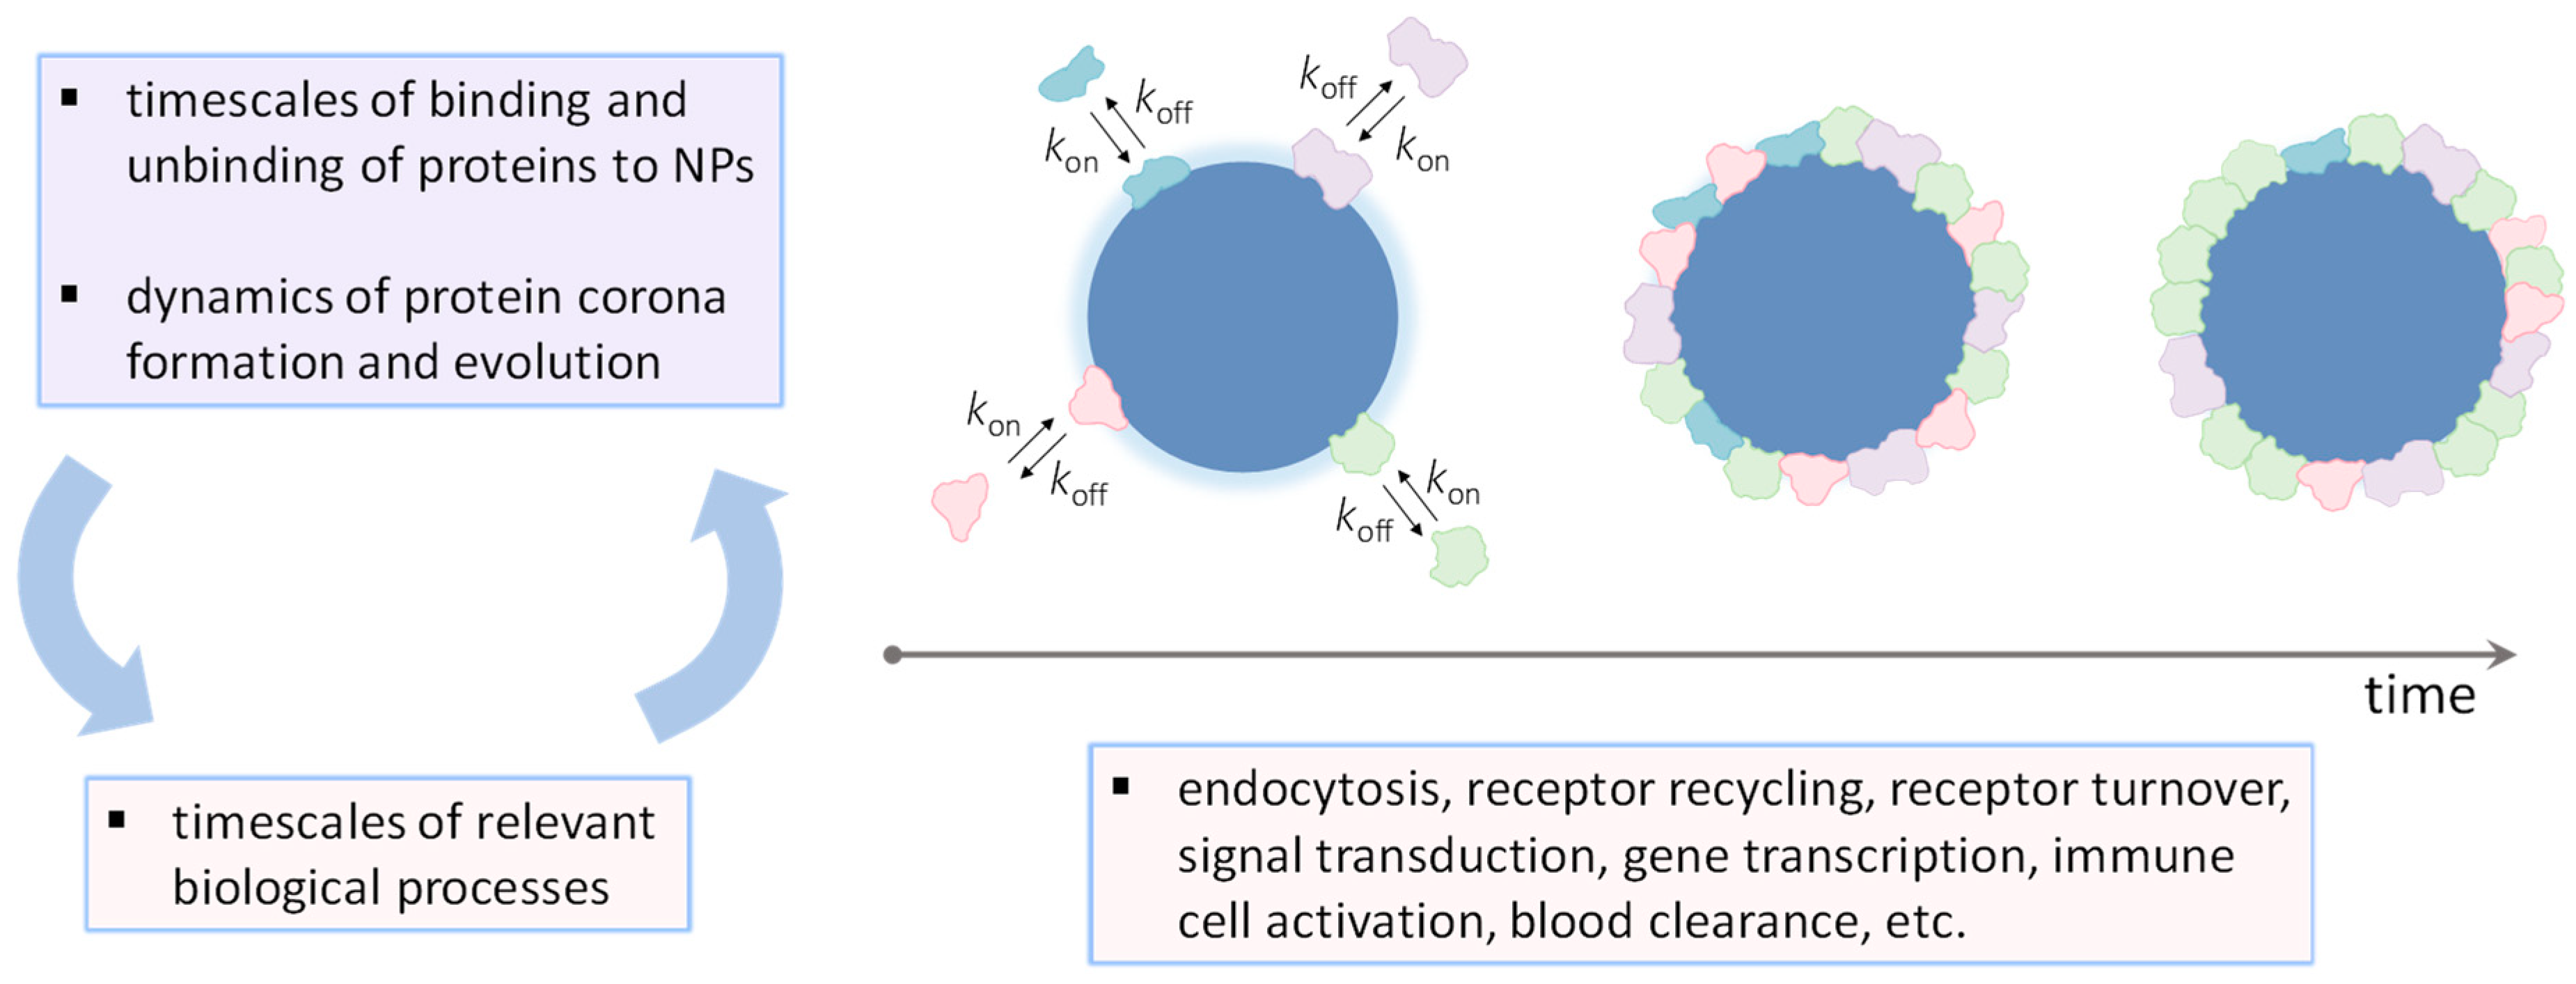
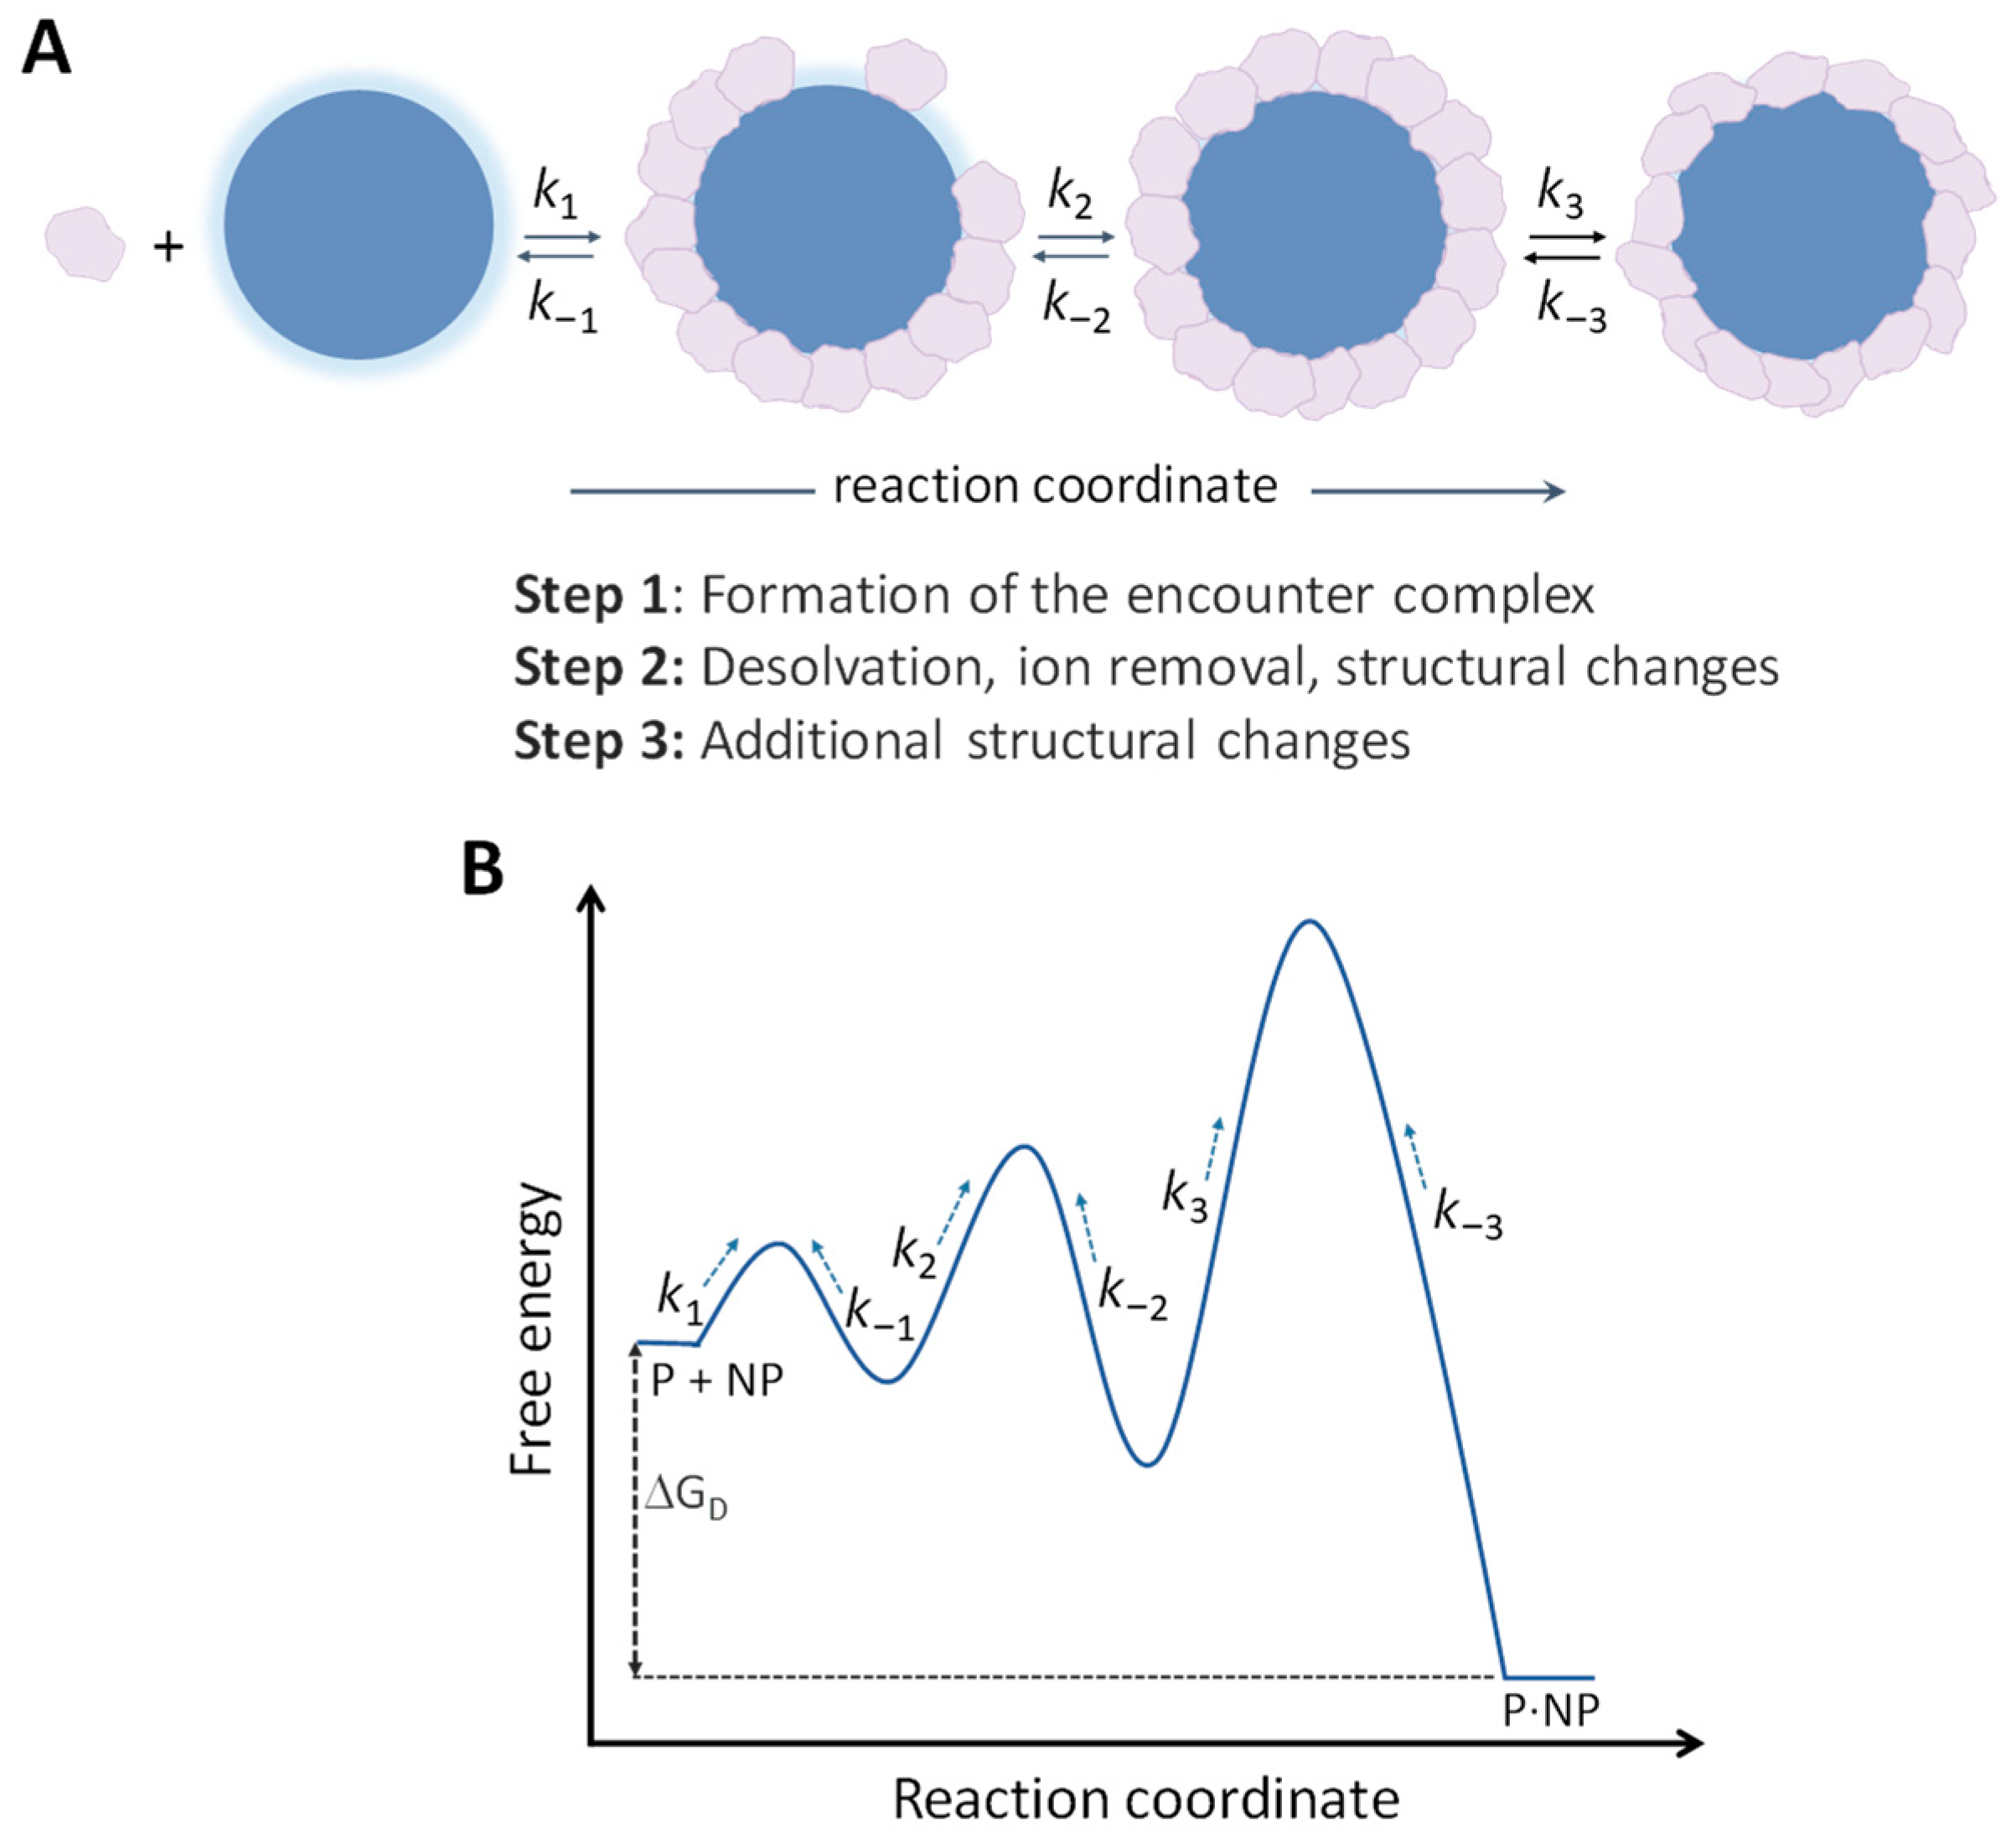
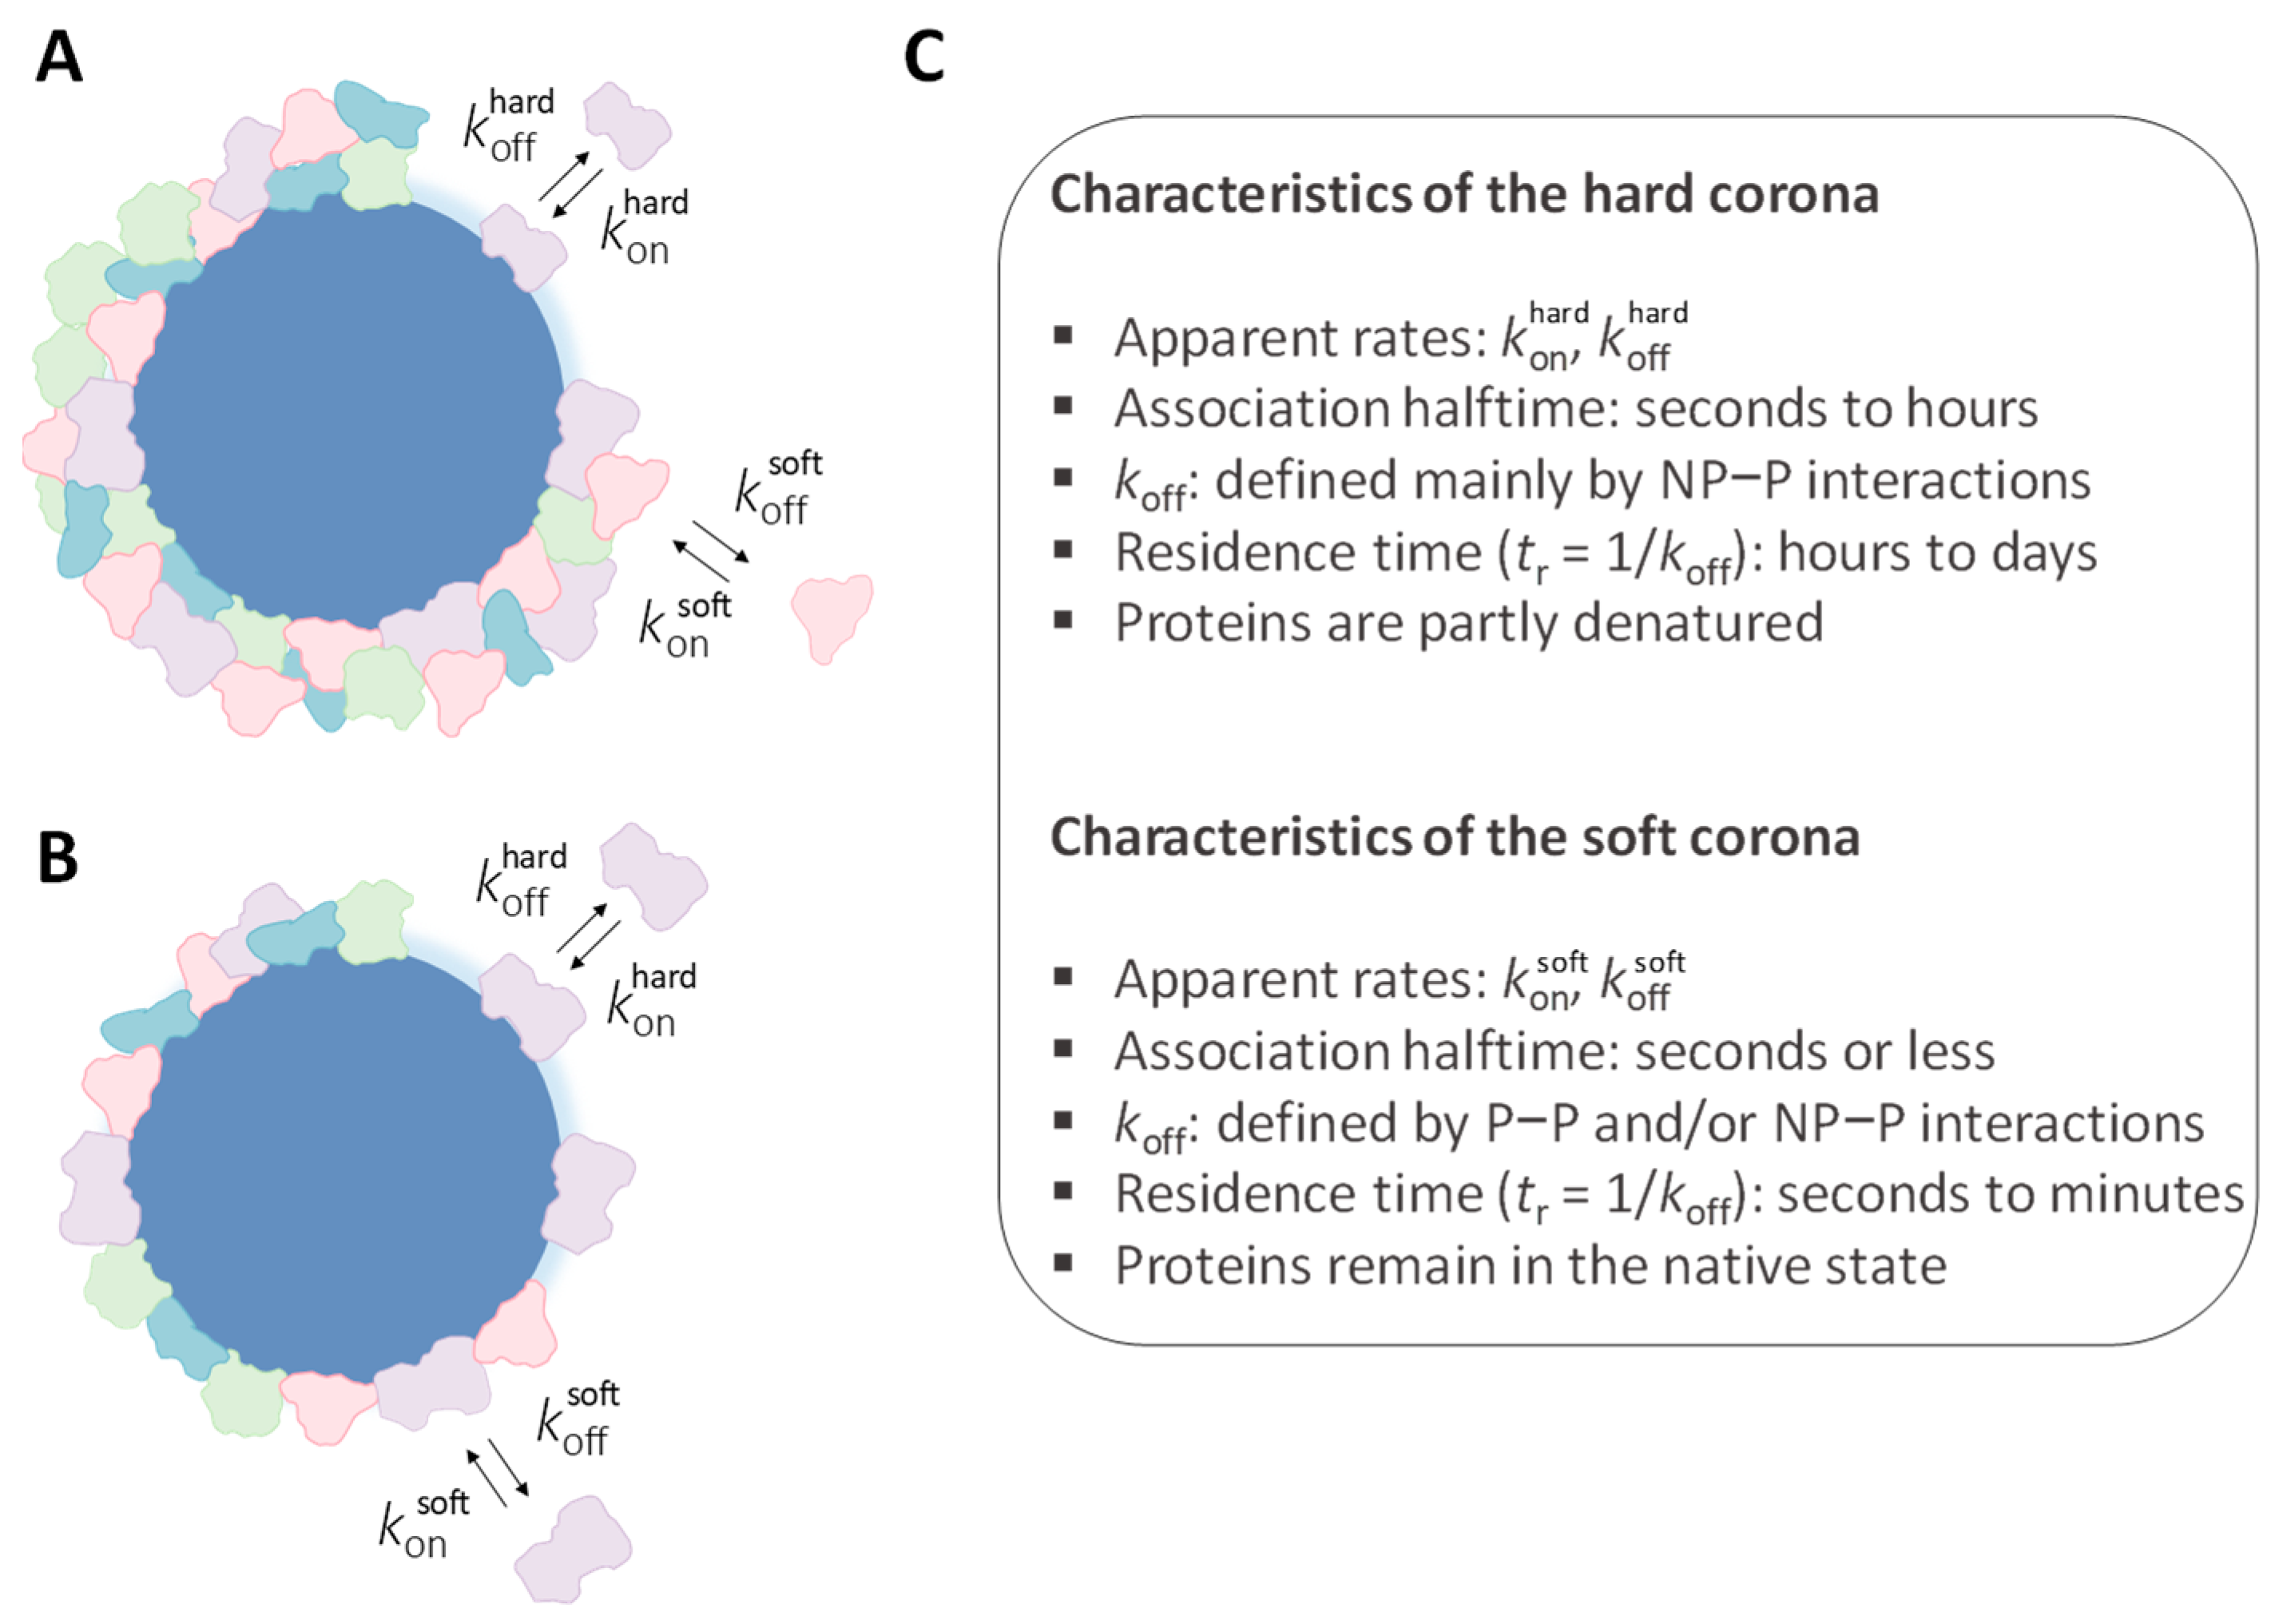
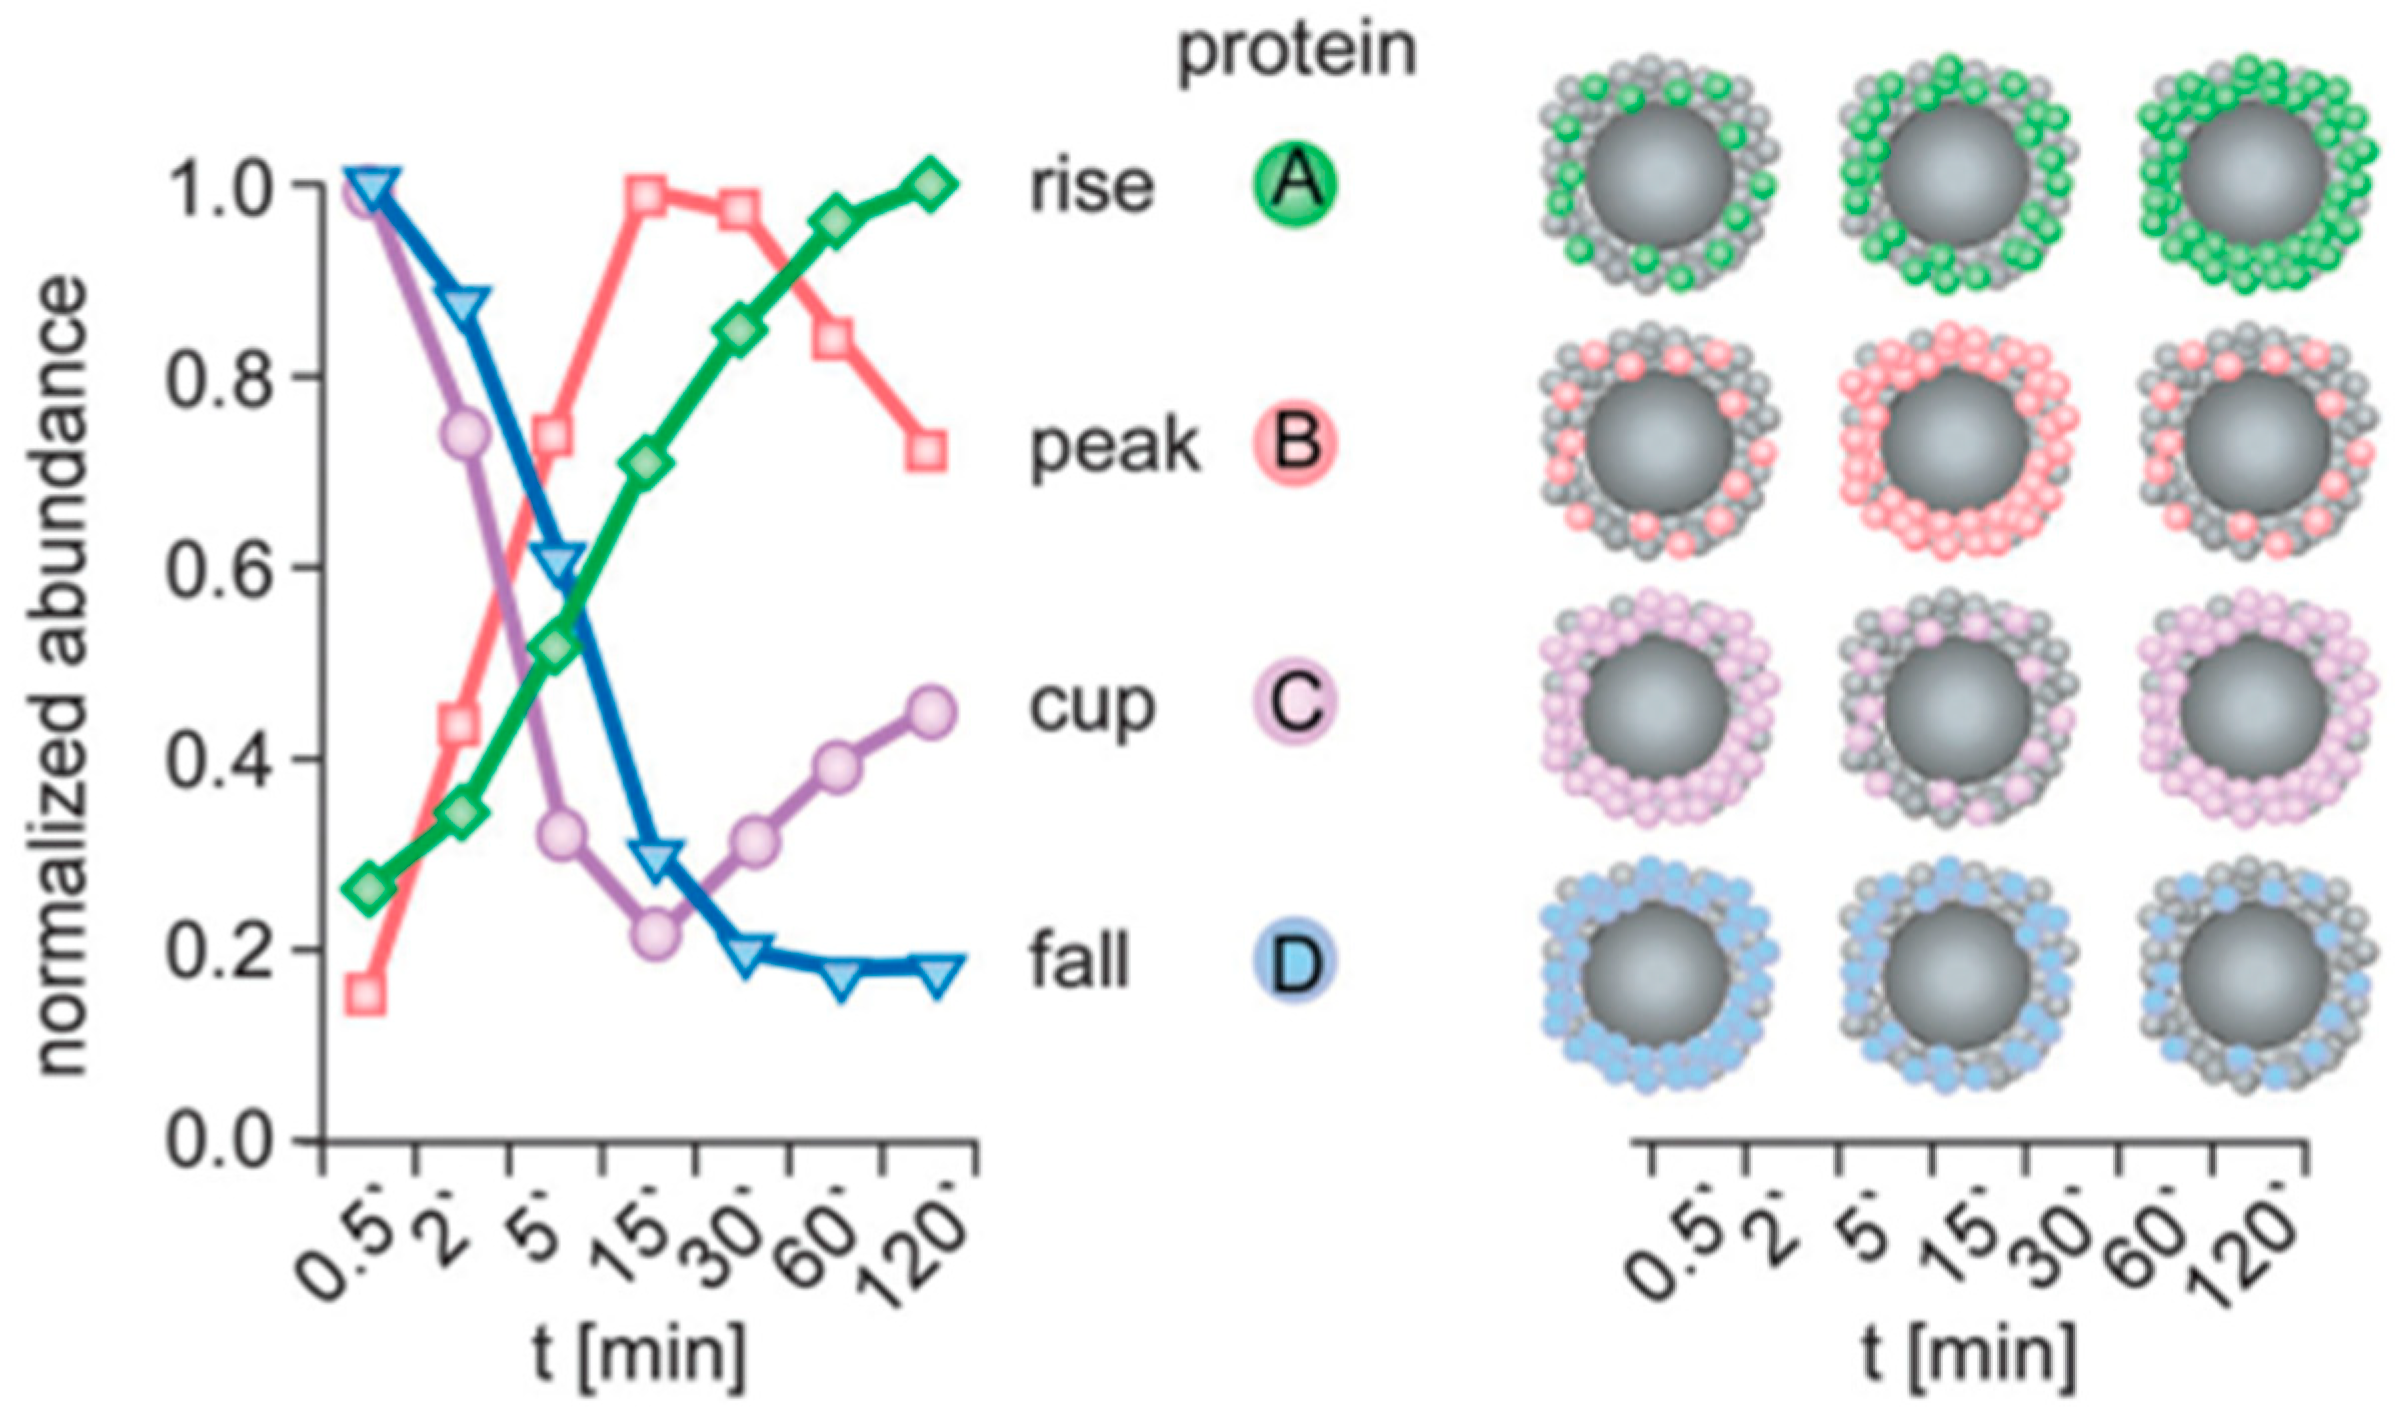
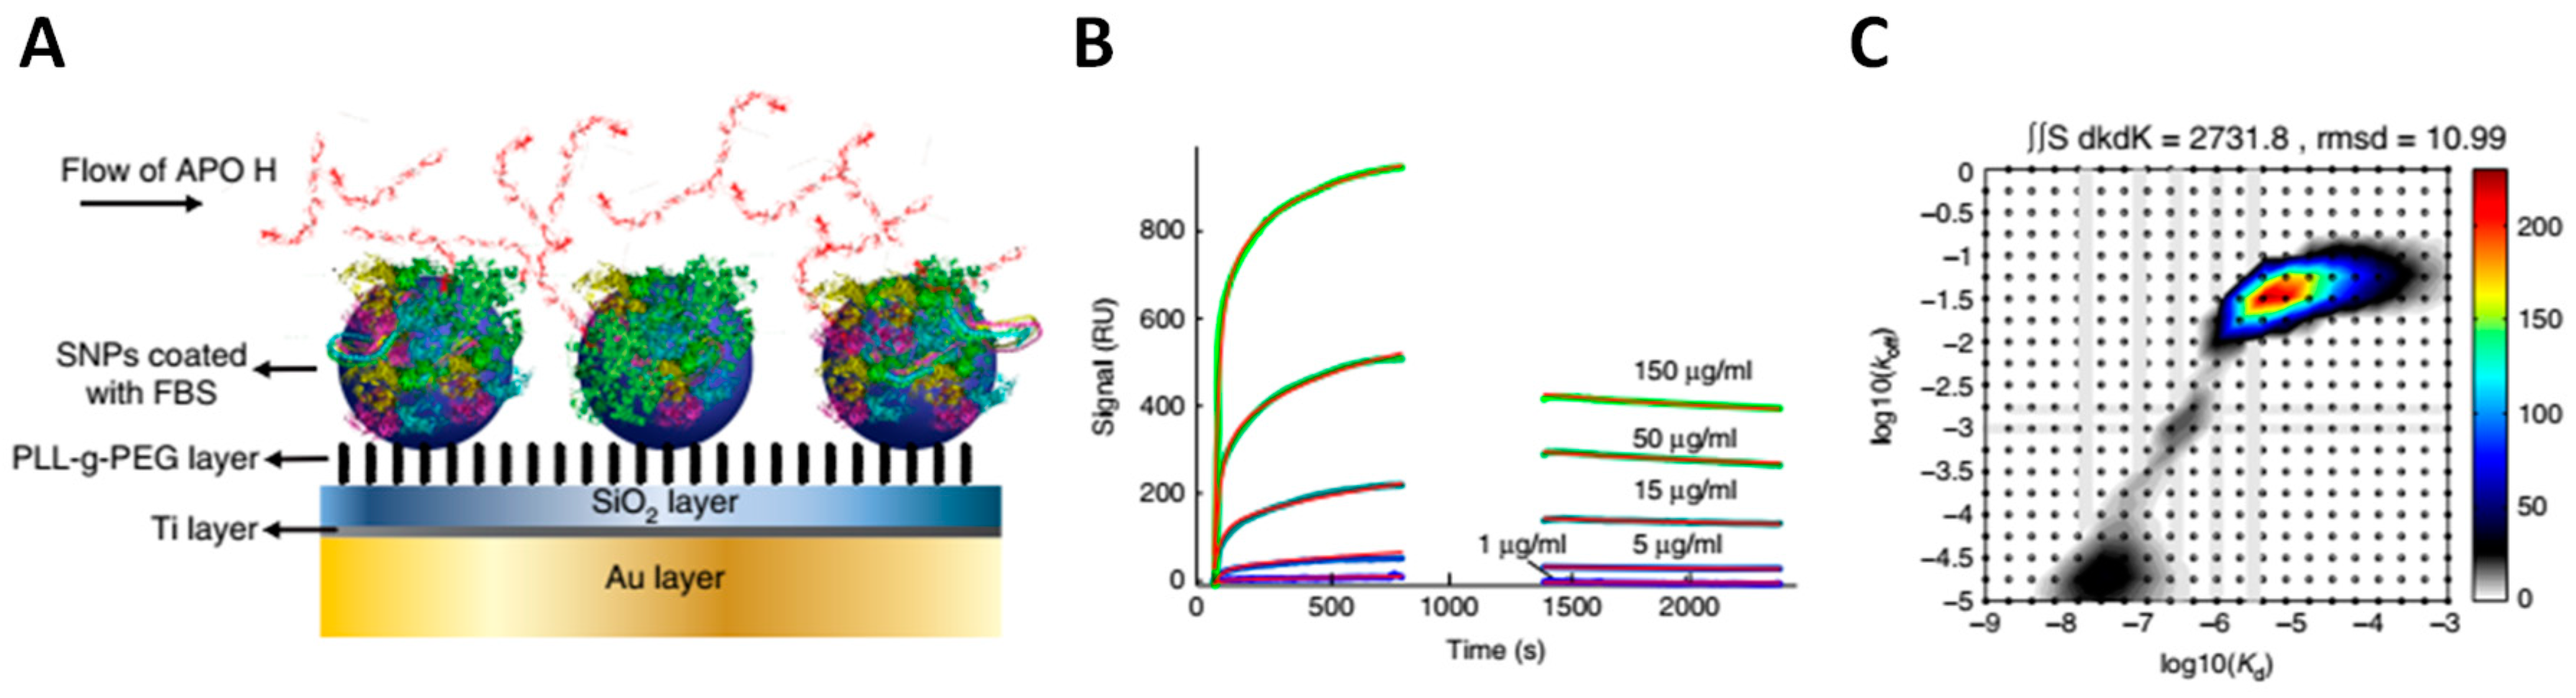
Table 1.
Selection of characteristic timescales observed in various biological contexts.
| Event | Timescale | Comment | Ref. |
|---|---|---|---|
| Protein diffusion | 1–10 s | Protein diffusion across a 10 μm diameter cell | [18] |
| Cell movement | 1 μm/min | HeLa cells | [18] |
| Cell cycle | 1 day | HeLa cells | [18] |
| Protein folding | 1 ms to 1 min | Most proteins fold on timescales of the order of milliseconds | [18,29] |
| Natural antibody-antigen residence time (RT) | 1 h | Longer RTs do not provide selective advantage | [24] |
| Clathrin-mediated endocytosis | 1 min | HeLa cells | [18] |
| Cellular uptake and lysosomal degradation of LDL particles | 60 min | Fibroblasts | [30] |
| LDL receptor recycling | 10 min | Time between LDLR internalization and recycling to the plasma membrane | [30] |
| Turnover of plasma membrane | 0.5 h to 2 h | Time it takes for cells to endocytose the area equivalent of their entire plasma membrane | [26] |
| Plasma halflives (t1/2) of large proteins (MW > 60 kDa) | Several hours to days | HSA and IgGs have exceptionally long t1/2; in humans, HSA has a t1/2 of 19 days and IgGs of 1–4 weeks | [25,27] |
| Plasma halflives of small proteins (MW < 60 kDa), e.g., growth factors | A few minutes to a few hours | Clearance through degradation and renal filtration | [25,27] |
| Residence time for drug–receptor binding | 0.2 min to 35 h | Residence times for selected therapeutically relevant drugs bound to their GPCR targets | [28] |
| Plasma halflives of therapeutic drugs and protein biologics | A few minutes to a few hours | Clearance through renal filtration, degradation, and hepatic elimination | [25] |
Disclaimer/Publisher’s Note: The statements, opinions and data contained in all publications are solely those of the individual author(s) and contributor(s) and not of MDPI and/or the editor(s). MDPI and/or the editor(s) disclaim responsibility for any injury to people or property resulting from any ideas, methods, instructions or products referred to in the content. |
© 2023 by the authors. Licensee MDPI, Basel, Switzerland. This article is an open access article distributed under the terms and conditions of the Creative Commons Attribution (CC BY) license (https://creativecommons.org/licenses/by/4.0/).
Share and Cite
MDPI and ACS Style
Lima, A.F.; Sousa, A.A. Kinetics and Timescales in Bio–Nano Interactions. Physchem 2023, 3, 385-410. https://doi.org/10.3390/physchem3040026
AMA Style
Lima AF, Sousa AA. Kinetics and Timescales in Bio–Nano Interactions. Physchem. 2023; 3(4):385-410. https://doi.org/10.3390/physchem3040026
Chicago/Turabian StyleLima, André F., and Alioscka A. Sousa. 2023. "Kinetics and Timescales in Bio–Nano Interactions" Physchem 3, no. 4: 385-410. https://doi.org/10.3390/physchem3040026