Article

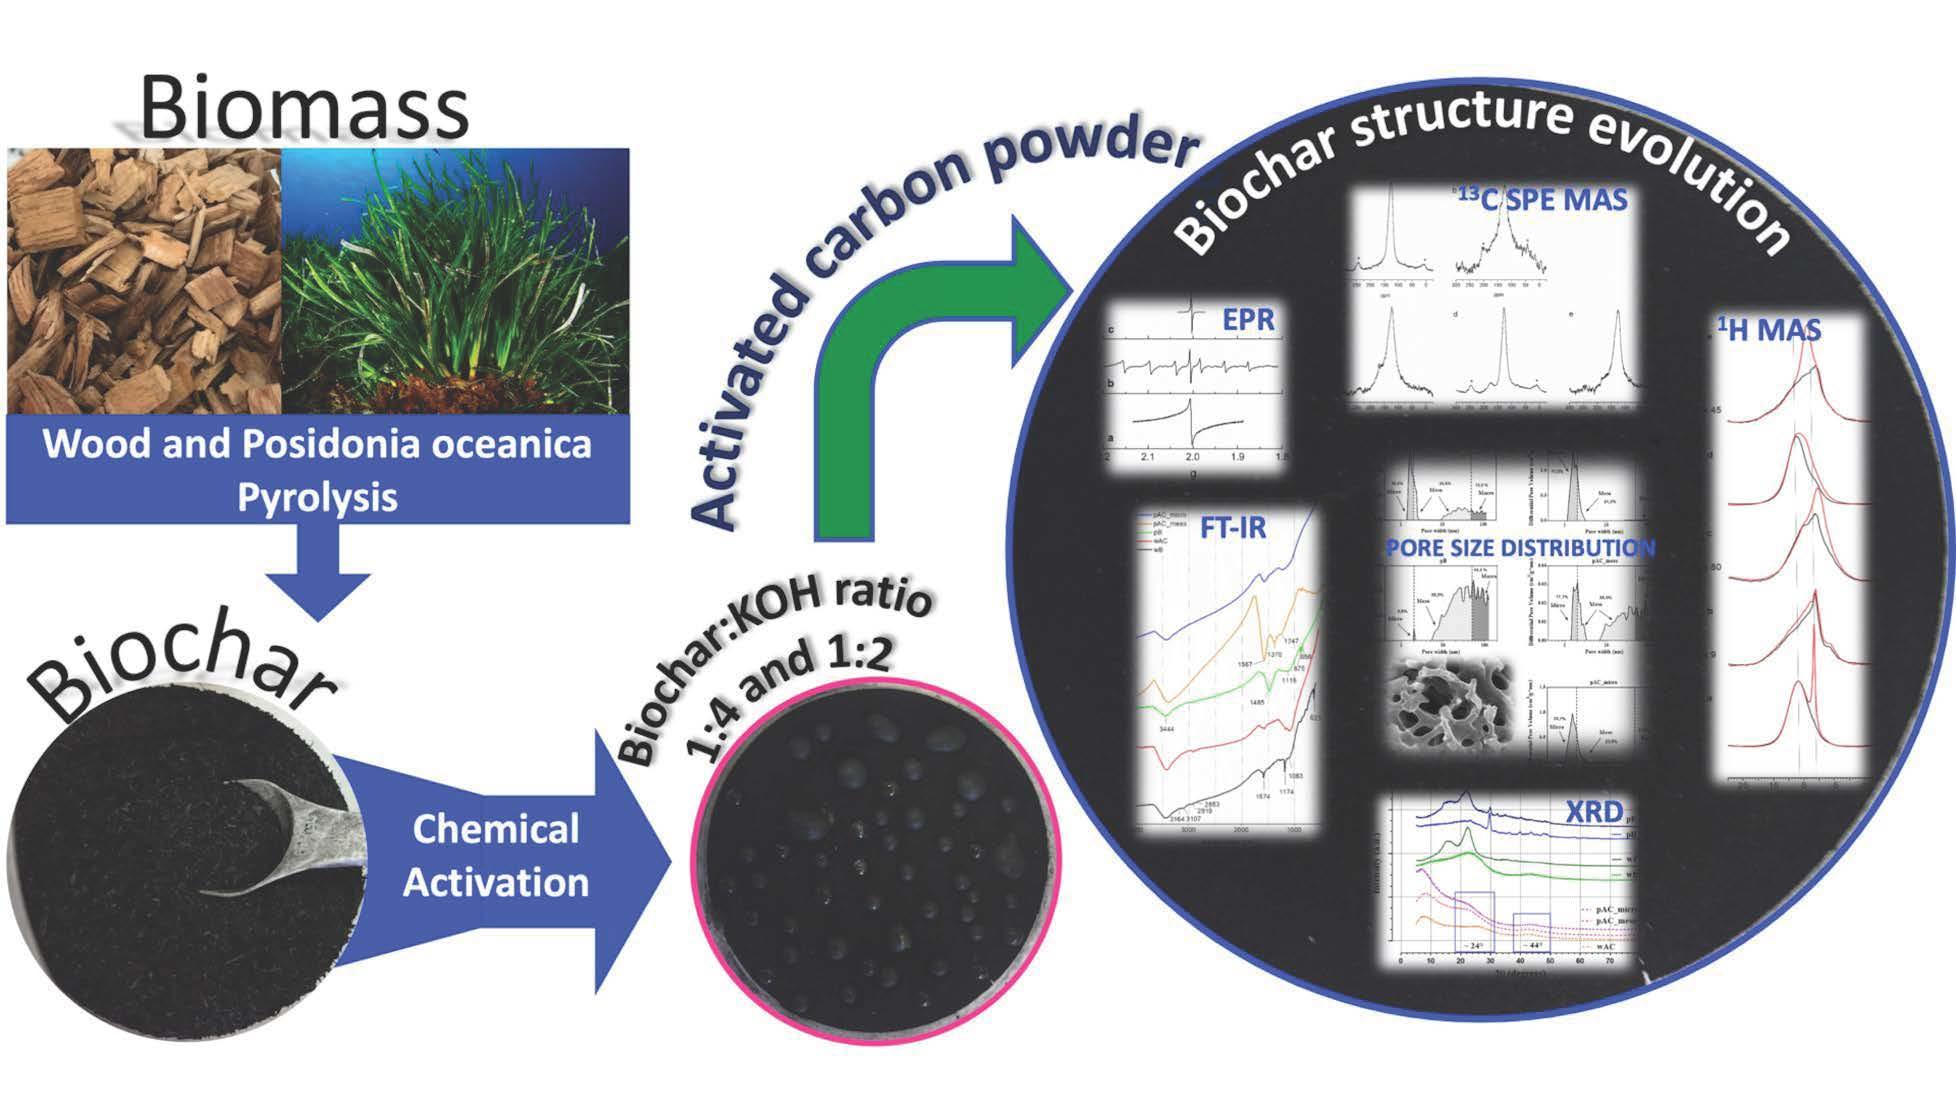
The Effect of Activation on the Structure of Biochars Prepared from Wood and from Posidonia Oceanica: A Spectroscopic Study

1
Istituto di Chimica dei Composti OrganoMetallici, Consiglio Nazionale delle Ricerche—CNR, Via G. Moruzzi 1, 56124 Pisa, Italy
2
Centro per l’Integrazione della Strumentazione Scientifica dell’Università di Pisa (CISUP), Lungarno Pacinotti 43/44, 56126 Pisa, Italy
3
Istituto di Tecnologie Avanzate per l′Energia “Nicola Giordano”, Consiglio Nazionale delle Ricerche—CNR, Via Salita S. Lucia sopra Contesse 5, 98126 Messina, Italy
4
Dipartimento di Chimica e Chimica Industriale, Università di Pisa, Via G. Moruzzi 13, 56124 Pisa, Italy
*
Author to whom correspondence should be addressed.
Physchem 2022, 2(3), 286-304; https://doi.org/10.3390/physchem2030021
Submission received: 5 May 2022 / Revised: 21 July 2022 / Accepted: 5 September 2022 / Published: 8 September 2022
(This article belongs to the Section Experimental and Computational Spectroscopy)

Abstract

:
The structure of two biochars and of their activated carbons was investigated by Electron Paramagnetic Resonance, Solid State Nuclear Magnetic Resonance, and Fourier Transform Infrared spectroscopies, together with X-ray diffraction and nitrogen adsorption/desorption isotherm measurements. The biochars were obtained from wood and Posidonia Oceanica by slow pyrolysis up to 600 °C, whereas the activated carbons were prepared from the biochars by impregnation with KOH, heating up to 800 °C. Two different KOH:biochar mass ratios were tested in the case of Posidonia, namely 4:1 and 2:1, while only the 4:1 ratio was used for wood. When the larger ratio was used, activation significantly increased the microporosity of the starting biochar, also creating bottle-neck pores not accessible to water molecules, and induced the formation of larger condensed aromatic networks arranged in interconnected conducting domains. In the case of Posidonia, activation using the 2:1 ratio mainly created mesopores and induced an increase in organic radical content by almost four orders of magnitude. This huge increase was related to the presence of minerals in the starting biochar.

Graphical Abstract

1. Introduction

Porous carbon materials show promising properties when used as catalyst supports, adsorbents, and electrode materials in supercapacitors, inter alia [1,2]. Numerous characteristics, including adjustable microstructure, large specific surface area, high thermal and chemical stability, make these materials attractive. There are additional advantages when biomasses are used to produce porous carbons, such as moderate costs, wide availability, and energy/environmental benefits. These porous carbons are usually generated by the carbonization of the original biomass through pyrolysis and its further chemical and/or physical activation, which allows the production of materials with high surface areas. In fact, the biochar derived from pyrolysis often exhibits relatively low porosity with surface areas lower than 200 m2/g, whereas activation results in materials with surface areas as large as 700–3000 m2/g [3]. Understanding the activation mechanism is extremely important for designing carbon materials with desired properties.
Among the various activation methods [4], chemical activation employing KOH as the activating reagent is very promising because of the moderate activation temperature, high yields, narrow distributions of micropores, and extremely high surface areas [3,5,6]. Activation is generally achieved by mixing the biochar with KOH, followed by carbonization. The porosity and the elemental composition of the activated carbons (ACs) depend on the activation parameters, including KOH:biochar mass ratio and carbonization temperature and time. Moreover, mixing the biochar with KOH can be achieved either by impregnation with a KOH aqueous solution or the simple mechanical mixing of the solids. Numerous studies have focused on KOH activation mechanisms on carbon-based materials such as coal [7], graphene [8], carbon nanotubes [9], and, more recently, a biochar [3]. In this last case, KOH:biochar mass ratios ranging between 1:8 and 1:1 were explored with carbonization temperatures between 400–800 °C. Although the main activation steps of a carbonaceous material are widely accepted, a deep understanding of the process is still lacking due to the large number of activation parameters and the different reactivities of the precursors. With the present level of knowledge it is still not possible to predict which activation conditions will yield an activated carbon with targeted properties.
This work aims at adding to the understanding of the KOH activation process of biochars. We focused on biochars derived from two different biomasses, wood and Posidonia Oceanica, heated to 600 °C, and on the activated carbons prepared from the two biochars by impregnation with KOH carbonized at 800 °C. Two different KOH:biochar mass ratios were tested in the case of Posidonia, namely 4:1 and 2:1, and the sole 4:1 ratio was explored for wood. In a previous study conducted on some of the samples presented here [10], activation was found to induce a considerable increase in surface area, carbon content, and H2 adsorption. Here, a structural study is presented, where a collection of techniques, including Electron Paramagnetic Resonance (EPR), high resolution solid state 13C and 1H Nuclear Magnetic Resonance (ssNMR), and Fourier Transform-Infrared (FT-IR) spectroscopies, was employed. They are all powerful and complementary methods for studying the structure of carbonaceous materials [11,12,13,14,15,16,17,18,19]. In particular, EPR was exploited to obtain information on the chemical structure and concentration of the trapped organic radicals, ssNMR gave us insights into the presence of functional groups, aromatic cluster sizes, and porosity, and FT-IR flanked ssNMR in the identification of functional groups. For the samples examined, nitrogen adsorption-desorption data were used to estimate the pore size distribution using the density functional theory method. Finally, X-ray diffraction allowed us to identify a mineral, i.e. calcium carbonate, present in the Posidonia biochar, and inductively coupled plasma optical emission spectroscopy (ICP-OES) detected the calcium content. The analysis of all the data allowed us to correlate activation parameters like KOH:biochar mass ratio, type of the original biomass, and presence of minerals to the final structural properties.

2. Experiment

2.1. The Samples

The samples investigated are listed in Table 1 together with some properties, i.e. Langmuir surface area and elemental composition. They are two biochars, prepared from wood, wB, and from Posidonia Oceanica, pB, and three activated carbons, prepared either from wood, wAC, or from Posidonia Oceanica with different impregnation conditions resulting in meso- and micro-porous samples, pAC_meso and pAC_micro. The preparation of the samples was already described in Ref. [10]. For convenience, it is also briefly reported here. The biochars wB and pB were prepared by pyrolysis of fresh biomasses, i.e. wood chips (wF) and Posidonia Oceanica (pF), respectively, under a 100 mL/min argon flow at a heating rate of 5 °C/min up to 600 °C. The samples were then kept at 600 °C for 1 h. They were subsequently allowed to cool to room temperature under a nitrogen flow. The activated carbons were prepared by chemical activation of the biochars. In particular, the biochar was impregnated with KOH in a KOH:biochar mass ratio of 4:1 for both wood (wAC) and Posidonia (pAC_micro), and 2:1 for Posidonia only (pAC_meso). To this end, suitable amounts of a 6 M aqueous KOH solution were used. The water eventually evaporated by raising the temperature to 80 °C and then the mixture was heated to 800 °C for 1 h under argon atmosphere. After cooling to room temperature, the samples were washed with an HCl aqueous solution (1 M) until pH 7, and subsequently dried in an oven at 60 °C. wB, wAC, pB, and pAC_meso were obtained from feedstocks with particle sizes between 0.3 and 0.4 mm, whereas pAC_micro was obtained from Posidonia particles sieved to a size range of 0.2–0.3 mm.

2.2. Elemental Analysis, X-ray Diffraction and Nitrogen Adsorption/Desorption Measurements

X-ray diffraction data, Langmuir surface areas and elemental compositions for all the samples, except for pAC_meso and pAC_micro, were already published in Ref. [10] and are reported here for convenience. The samples considered were characterized in terms of: (i) elemental analysis using CHNS-O Elemental Analyzer (Thermo Fisher Scientific, Flash EA 1112, Waltham, MA, USA); (ii) X-ray diffraction analysis to identify the crystalline phases, using a Philips X’Pert X-ray diffractometer (model PW3710) operating with Cu/Kα radiation source at a wavelength equal to 1.5406 Å, 40 kV, and 30 mA; (iii) nitrogen adsorption−desorption isotherm measurements at −195.8 °C to determine the surface area and pore size distribution, using a Micromeritics ASAP 2020 instrument. Preliminary outgassing was performed for each sample to clean the surface from moisture and contaminants. The treatment consisted in applying a vacuum of 5 mmHg for 1 h at 90 °C, followed by heating up to 350 °C for 4 h under a vacuum of 100 mmHg. The surface area was calculated by means of the Langmuir method, whereas the pore size distribution was estimated using both the Barret–Joyner–Halenda (BJH) equation during the desorption phase and the Density Functional Theory (DFT) method, assuming a slit pore geometry [20,21].

2.3. ICP-OES Measurements

In order to quantify the amount of Mn, Fe, Mg, and Ca in the pB sample, ICP-OES measurements were performed. The measurements were carried out with an Optima 8000 ICP-OES (Perkin Elmer, Waltham, MA, USA) operating at 1500 W and equipped with an autosampler S10, MiraMist® Nebulizer (Perkin Elmer) and a cyclonic chamber. Argon (420.069 nm) was used as the internal standard. Mn, Fe, Mg, and Ca were examined at 257.610 nm, 238.204 nm, 285.213 nm, and 317.933 nm wavelengths, respectively. The mineralization was carried out in a Milestone Start D microwave digestor (FKV S.r.l., Torre Boldone, Italy). A sequential digestion of 150 mg of the pB sample was conducted first with 6 mL HNO3 (for trace analysis >69%) and 2 mL H2O2 (analytical grade, >30%), then with 2 mL HF (analytical grade, 40%) [22]. After the addition of H3BO3 (1.74 g, 98%, solid), ultrapure water (PureLab Pro, 18.2 MΩ⋅cm) was added to the 50 mL final volume in a PP flask. Metal content was determined by comparison with calibration curves obtained by commercial standard solutions (Fluka TraceCERT©) properly diluted in 2% HNO3.

2.4. EPR and NMR Measurements

In order to examine the radicals in the samples, EPR measurements were carried out on a Varian (Palo Alto, CA, USA) E112 spectrometer operating at the X band and interfaced to an IPC 610/P566C industrial grade Advantech computer by means of a home-made acquisition board [23]. The EPR spectra were recorded at ambient temperature. A microwave power of 5 mW, a modulation amplitude of 0.5 G and a modulation frequency of 100 kHz were used. A sample of the free radical 2,2-diphenyl-1-picrylhydrazyl was utilized as a standard for estimating the radical content in the samples.
The solid-state NMR experiments were conducted on a Bruker Avance Neo-500 spectrometer equipped with a 4 mm Magic Angle Spinning (MAS) probe. The operating 1H and 13C frequencies were 500.13 and 125.77 MHz, respectively; the 90° pulse on 1H was 3.7 μs, on 13C it was 3.8 μs. 1H spectra were recorded by applying a sequence for background suppression [24], using a recycle delay of 10 s and accumulating 64 scans. 13C spectra were recorded by applying the single pulse excitation (SPE) sequence with a recycle delay of 60 s and a number of scans ranging between 700 and 2000. The Cross Polarization (CP) spectra on wB and pAC_meso were acquired using the ramped CP sequence, where the RF-field amplitude for 1H was linearly ramped from 50% up to 100% of its nominal value. The contact time was 2 ms, the recycle delay 10 s, and the number of transients was 600. The 1H decoupling strength during acquisition of the 13C SPE and CP spectra was 67 kHz. In all experiments the samples were spun at 15 kHz, apart from the 13C spectra of wAC where the spinning speed was set to 10 kHz because the higher speed was not stable. For this sample, no decoupling was applied during acquisition because of arcing. The chemical shifts were externally referenced to the 13C resonance of adamantane at 38.48 ppm.

2.5. FT-IR Spectroscopy

The FT-IR spectra were recorded on a Perkin Elmer Spectrum 100 FT-IR spectrometer using the transmission mode. Pellets, prepared by grinding each sample (ca. 1 mg) with KBr (ca. 200 mg), were used. Each spectrum was obtained at a resolution of 4 cm−1 in the 4000–400 wavenumber range accumulating 64 scans. The second derivative of the spectra was calculated using a 55-point Savitzky–Golay procedure.

3. Results

3.1. XRD Analysis

XRD diffraction patterns of the fresh biomasses of wood and Posidonia (wF and pF), biochars (wB and pB), and activated carbons (wAC, pAC_meso, and pAC_micro) are shown in Figure 1. In both cases, the X-ray pattern of the fresh biomass exhibits two major peaks at approximately 16° and 22°, corresponding to the (101) and (002) crystal planes, associated with the crystalline region of cellulose [25].
In addition, the Posidonia Oceanica pattern shows another peak at about 29.3° and less intense peaks between 35° and 50°, which can be ascribed to calcite, a typical component of marine biomasses [26,27]. Unlike the fresh samples, the biochars do not exhibit the cellulose peaks, indicating that cellulose was destroyed by pyrolysis. A broad band is observable in the region below 2θ = 30° due to the formation of amorphous carbonaceous structures. Only in the pB sample are additional peaks present, as shown in Figure 1 (light blue solid line), which confirm the presence of calcite also after pyrolysis. These peaks are not observed for the activated carbons (Figure 1).
The high intensity in the low angle region (2θ = 5–15°), observed only in the activated carbons, may be attributed to the development of an abundant microporous structure [28]. All activated carbons feature two broad humps, approximately centered at 2θ = 24  and 44°, that can be ascribed to the graphitic planes (002) and (100), respectively. The broadness of the signals suggests a low long-range order [28].

3.2. Elemental Composition and Pore Size Distribution

The elemental composition and surface area values of the biochars and of the activated carbons, as derived from nitrogen adsorption-desorption measurements, are reported in Table 1, where the elemental composition of the fresh biomasses is also reported for comparison. The data show that, as expected, pyrolysis causes an increase in the relative carbon content and a significant reduction in the relative H content. As far as the oxygen content is concerned, an increase is observed for Posidonia after pyrolysis, in contrast with what is normally observed. This can be ascribed to the presence of calcite. The data also show that the activation process induces a substantial increase in the carbon content compared to the corresponding biochars, whereas the oxygen content decreases. The KOH:biochar ratio significantly affects the oxygen content, the pAC_meso sample, obtained using the smaller KOH:biochar ratio, showing a remarkably high oxygen content compared to the activated carbons obtained using the larger ratio.
The two biochars, wB and pB, show quite different surface areas. In the former sample the surface area is equal to 425 m2/g, whereas in the latter it is only 41 m2/g. The low surface area in pB is probably due to the presence of inorganic minerals inhibiting micropore development [4]. The pore size distributions, shown in Figure 2, were derived from nitrogen adsorption-desorption measurements using the DFT method. They are consistent with the surface area values. Indeed, a higher contribution of micropores (40%) was observed in the wB sample compared to pB (0.8%).
Activation causes a significant increase in surface area. Both nitrogen adsorption measurement and pore size distribution analysis (Figure 2) highlight a mainly meso-microporous structure in all the activated carbons. The amount of the activating agent used for the synthesis of the three activated carbons, wAC, pAC_micro, pAC_meso, strongly affects the pore size distribution. In fact, when the KOH:biochar ratio of 4:1 is used, samples characterized by a dominant microporous structure are obtained. Indeed, in wAC and pAC_micro, the microporous volume is preponderant, contributing to 77.0 and 70.7% of the total pore volume, respectively. For these samples, the surface areas are the largest observed, i.e. 2835 and 2365 m2/g. Instead, the KOH:biochar ratio equal to 2:1, used for the preparation of pAC_meso, leads to a predominantly mesoporous structure, with pore dimensions between 2 to 50 nm (55% of the total pore volume), the microporous volume being only 17.1% of the total pore volume. Correspondingly, for this sample the surface area is only equal to 479 m2/g, which is anyway much higher than that of the corresponding biochar.

3.3. ICP-OES Measurements
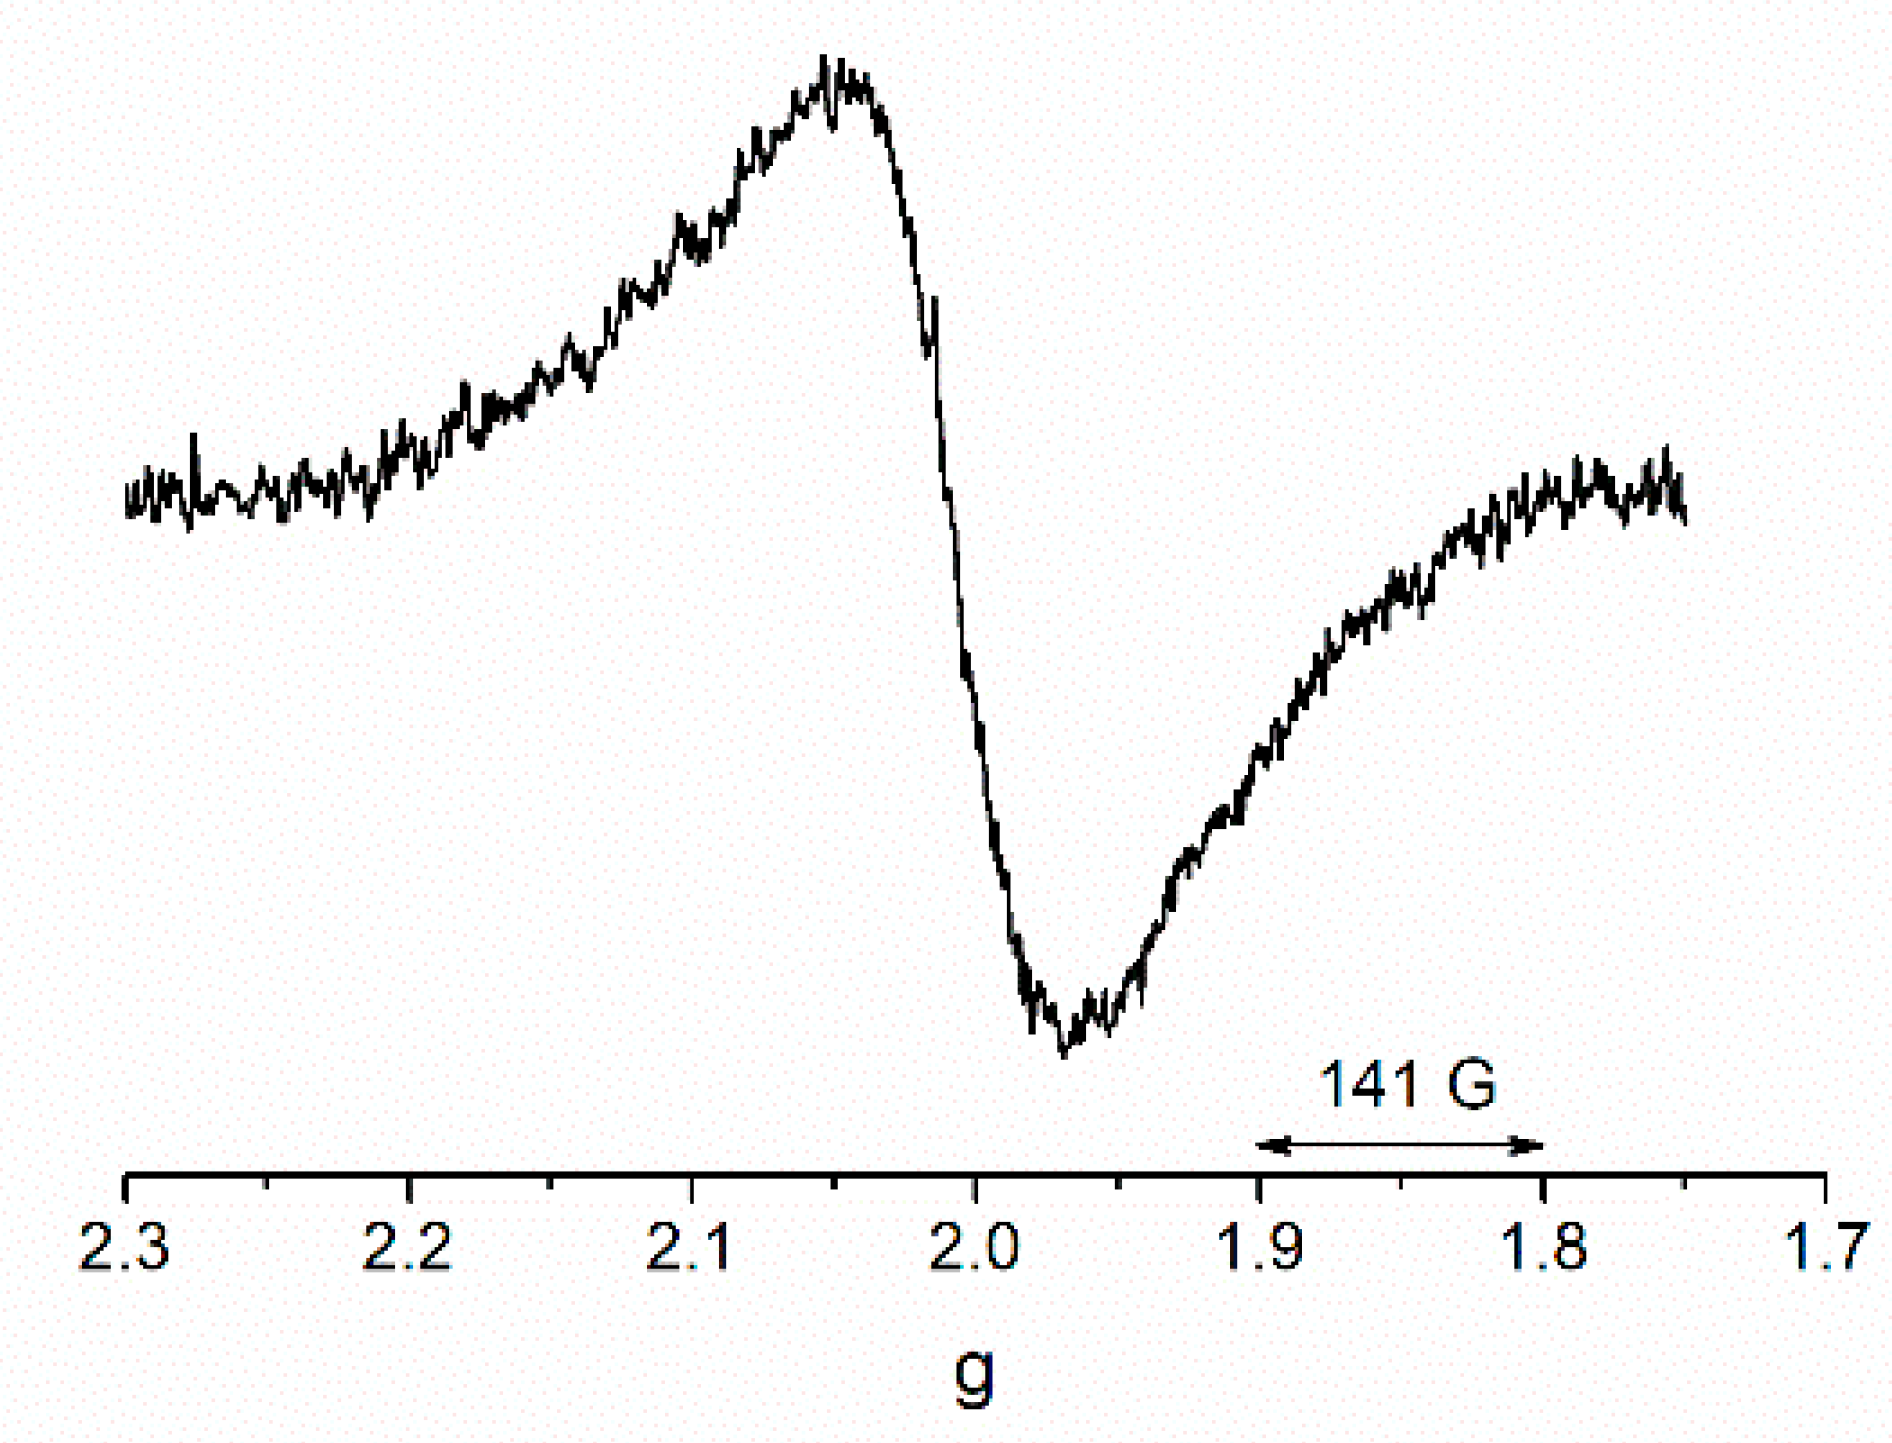
The ICP-OES measurements show that in sample pB the amounts of Mn, Fe, Mg, and Ca are 0.261 ± 0.002, 0.798 ± 0.006, 11.32 ± 0.08, and 107.4 ± 0.1 mg/g, respectively. Among the metals examined, Ca occurs in the largest amount, followed by Mg, Fe, and Mn. Although these values are lower than those reported in Ref. [26], where similar samples are investigated, they highlight the high metal content, and Ca in particular. The discrepancy with the literature data is ascribable to seasonal/geographical variations. The presence of Mn and Fe is not surprising since Mn2+ and Fe3+ precipitates are known to intimately coexist in marine media and have been observed in marine particles [29].

3.4. EPR

EPR was used to investigate the paramagnetic species present in the different samples. The spectra observed are displayed in Figure 3. Sample wB exhibits a symmetric resonance with a g factor of 2.004 (Figure 3a), resulting from the superposition of a broad and a narrow Lorentzian function, characterized by peak-to-peak widths of 81 and 25 G, respectively, with the broad component contributing to the signal with a relative weight of 0.92. Similar line shapes were reported for wood biochars [11] and in some anthracites [12]. This line shape is probably due to unpaired electrons delocalized on the aromatic ring systems of the char interacting with oxygen through dipolar interaction, with the broad and narrow components being due to organic radicals in micropores and in larger pores, respectively.
Sample pB shows a symmetric Lorentzian signal centered at a g value of 2.0055, displaying a peak-to-peak width of 3.5 G, together with a sextet pattern centered at g = 2.009 and characterized by a hyperfine splitting constant of 90 G (Figure 3b). The former signal can be ascribed to organic radicals on the aromatic structures of the biochar, whereas the sextet is due to Mn2+ ions [29,30]. It should be pointed out that the two signals discussed above lie on top of a very broad and featureless signal, removed in Figure 3b by baseline correction, probably due to Fe3+ ions. The narrow line width of the signal due to the organic radicals indicates that these are located in meso- and macropores. We cannot exclude that some radicals are located in micropores, giving rise to a broad component.
As far as the activated carbons obtained through the impregnation of the biochars using the higher KOH:biochar ratio are concerned, no EPR signal was detected, probably because these samples are structured in interconnected conducting domains where the microwave cannot penetrate [12,31]. An EPR signal was detected for wAC diluted in KBr at a concentration of 1.7 wt%, where the conducting domains are located at larger distances, thus inhibiting conduction. This symmetric signal, displayed in Figure 4, exhibits a peak-to-peak width of 129 G and is attributable to the organic radicals in micropores. On the other hand, for the activated carbon prepared using the lower KOH:biochar ratio, pAC_meso, a signal from the organic radical was observable. This signal is characterized by a g value of 2.0026 and a peak-to-peak width of about 2.5 G. In this sample, the Mn2+ pattern and the Fe3+ baseline distortion were absent because these ions were washed out in the activation process. The shift of the signal with respect to pB (g = 2.0055) suggests that the structure of the organic radicals is altered by activation. The higher g value is compatible with oxygen centered radicals, whereas the lower one is indicative of aromatic hydrocarbons made of two to five condensed rings [14].
The organic radical contents, determined from integration of the signal detected in samples wB, pB, and pAC_meso, are reported in Table 2. The sample pB exhibits a much lower content compared to wB, the two values differing by four orders of magnitude.

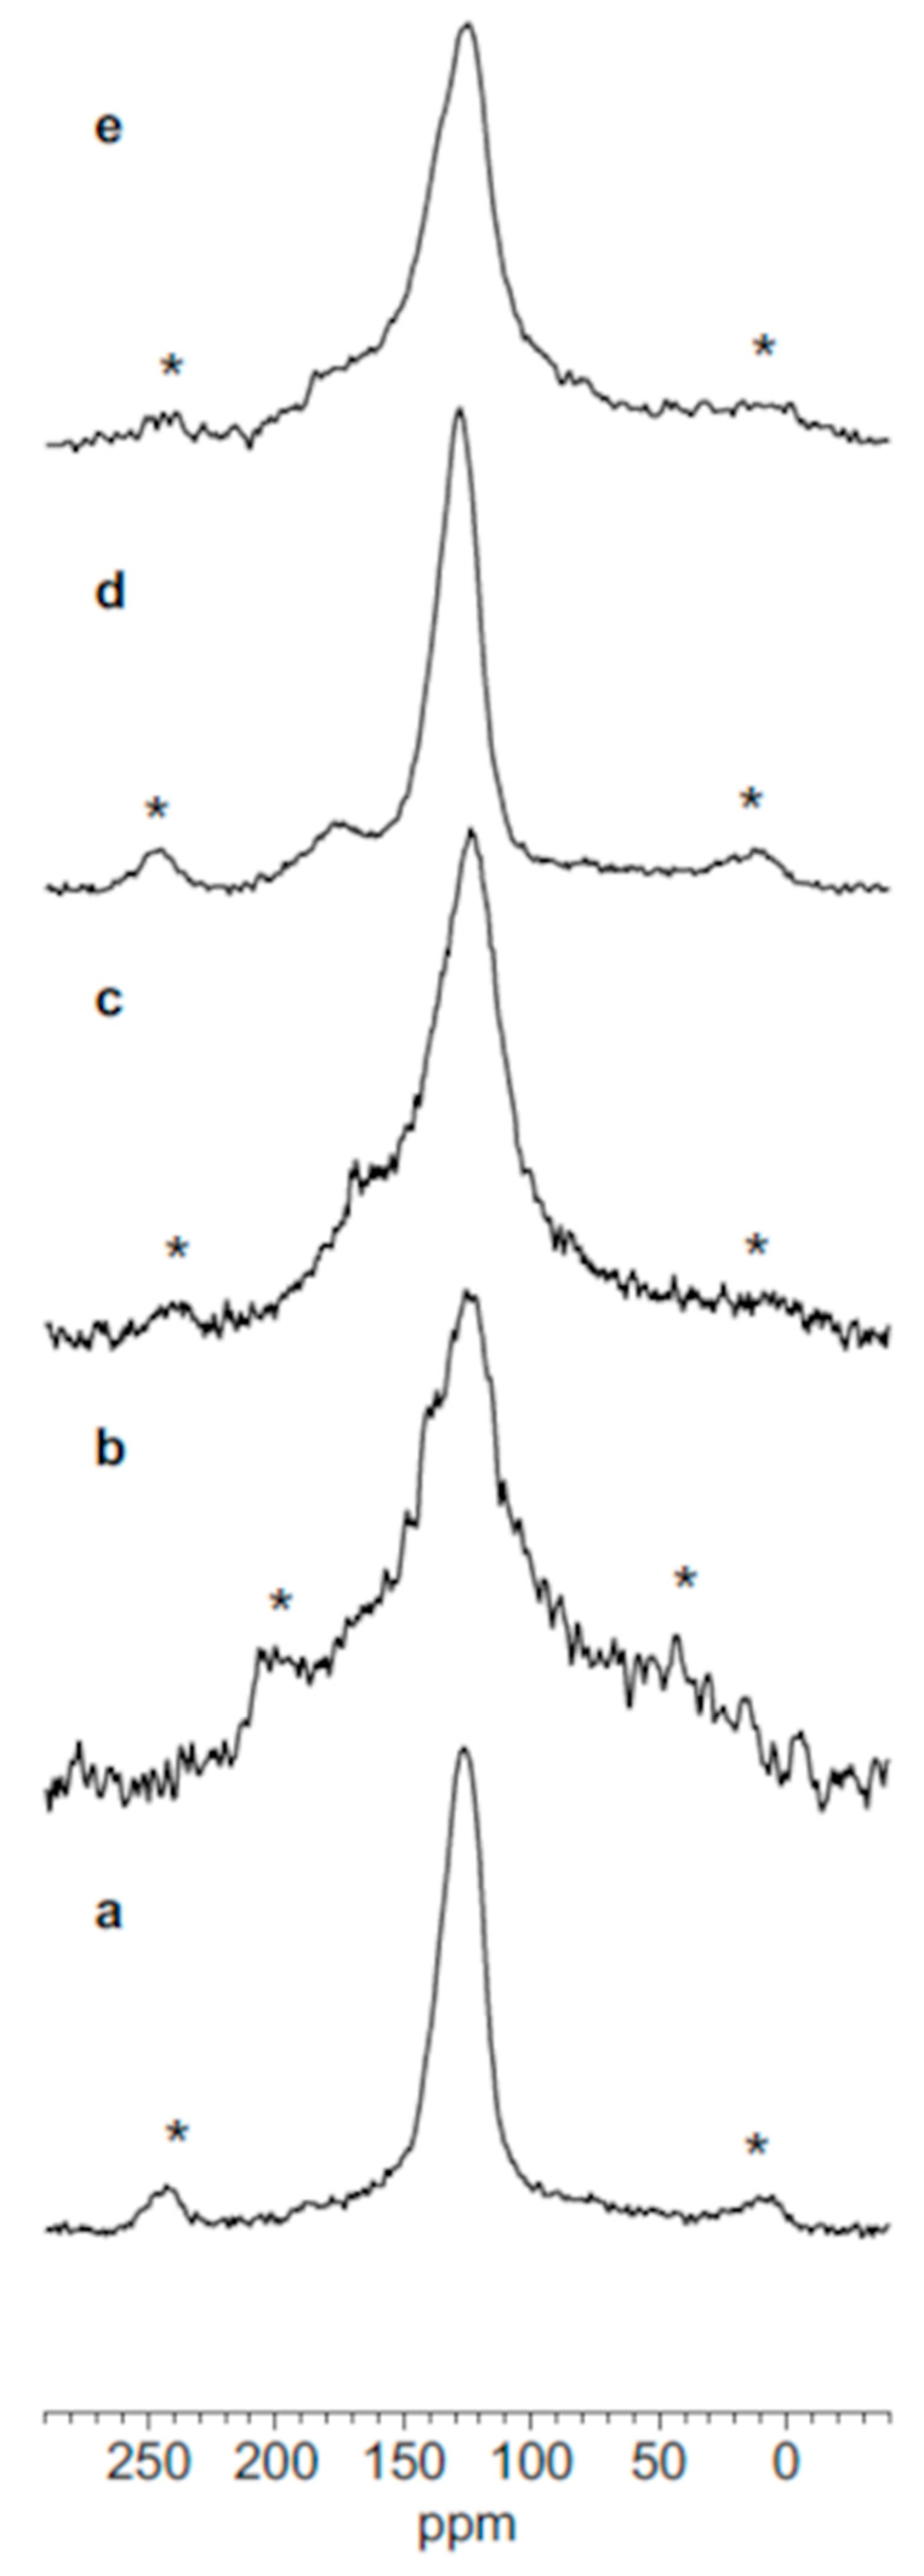
3.5. Solid State NMR

Figure 5 shows the 13C SPE MAS spectra of the samples under investigation. A broad arene/alkene spectral envelope, approximately centered at 125 ppm, dominates all the spectra. Additionally, in Posidonia samples, a low intensity signal centered at 167 ppm for the biochar (Figure 5c) and one at 175 ppm for pAC_meso (Figure 5d) can be detected. The former signal is due to the carbon atoms in calcite [32], whereas the latter is due to carboxyl carbon atoms [33,34]. It is worth noting that, when studying the wAC sample, we experienced difficulties in adjusting the tuning and matching conditions on the probe together with arcing phenomena, which are related to sample conductivity. This results in broader line widths and a low signal-to-noise ratio.
The envelope of the main signal in the 13C SPE MAS spectra is narrower in wB and pAC_meso compared to the other samples. The line width of the main signal was not significantly affected by the spinning speed (data not shown), which suggests that the signals are inhomogeneously broadened due to the variety of the local fields experienced by the carbon atoms, as commonly observed in carbonaceous materials [35].
Only for wB and pAC_meso was it possible to collect CP MAS spectra, the remaining samples giving no detectable signal. Figure 6 compares the 13C CP MAS spectra of these samples with the corresponding SPE spectra. The CP MAS spectra do not show major differences with respect to the corresponding SPE spectra, with the exception of the intensity attenuation of the 175 ppm peak compared to the main arene/alkene envelope in the CP spectrum of pAC_meso (Figure 6c,d), as expected for carboxylic carbon atoms. The absence of major differences suggests that for these samples the carbons close to protons are alkenylic and aromatic, with resonances occurring in the broad region centered at 125 ppm.
1H MAS spectra, shown in Figure 7, gave further insight into the structure of the examined materials. Spectra were recorded on the as-prepared samples and on the samples heated to 150 °C for 12 h. The as-prepared wB sample shows a broad peak at 7 ppm and a narrow one centered at 1.7 ppm, the latter signal contributing to 10% of the total intensity (Figure 7a, red line). The 7-ppm signal is ascribable to protons in arene-alkene-like structures, whereas the other is due to adsorbed water. In fact, after heating, the intensity of this signal decreased significantly (Figure 7a, black line), increasing again after sample exposure to a humid atmosphere (data not shown). The relatively facile water adsorption observed for these materials should not be surprising since pyrolysis results in some degree of porosity accessible to water molecules. A chemical shift of 1.7 ppm for water is unusually low, however, similar values have been observed for water molecules adsorbed on microporous carbons. These values have been explained considering that molecules close to a carbonaceous surface experience a locally reduced magnetic field because of the circulation of delocalized π electrons in the aromatic carbon structure [36,37,38].
In the case of wAC, the spectra of the as-prepared sample and of the heated one are not significantly different (Figure 7b), indicating that in the applied heating conditions only a negligible amount of water is removed, thus suggesting that water is mainly located in bottle-neck pores. Furthermore, in this sample, in addition to the 1.7 ppm peak, a signal at −3 ppm can be distinguished; this peak is attributable to water molecules located in smaller pores compared to those characterized by the 1.7 ppm chemical shift. The presence of the two distinct water peaks in wAC indicates that water molecules in the two types of pores undergo chemical exchange, if any, on a time scale much longer than the inverse of the difference between the frequencies of the two signals, i.e. 0.4 ms. Based on density functional theory calculations of the chemical shift of an adsorbate located in a circumcoronene slit pore [36], the pore size estimated for the −3 ppm signal would approximately be 1 nm.
In the spectra of pB, displayed in Figure 7c, in addition to a broad featureless aromatic peak around 7 ppm, a broad signal resonating at about 1 ppm is clearly observed, which decreases in intensity upon heating, and is thus ascribable to adsorbed water. A broad shoulder at smaller chemical shift is made more evident upon drying and can be tentatively ascribed to hydroxyl protons in metal hydroxides.
In the Posidonia-activated carbon pAC_meso, a signal at 7 ppm and a smaller one at 1.7 ppm can be observed in the dry sample (Figure 7d, black line), the former being due to the aromatic protons and the latter to water adsorbed in micropores. The decrease in the signal intensity in the range 4–5 ppm upon heating (Figure 7d) suggests that only adsorbed water present in mesopores of the as-prepared sample is removed by heating.
In pAC_micro (Figure 7e), a signal at about 4 ppm can be observed in the as-prepared sample, but not in the dry one; the chemical shift, closer to that of bulk water, suggests that clusters of water molecules are adsorbed on the external surface of the char particles [39]. For this sample, adsorption on the external surface is expected to be more relevant because of its smaller feedstock particle size, which is 0.2–0.3 mm and not 0.3–0.4 mm as for the other samples. The spectrum of the dry sample (Figure 7e, black line) is quite similar to that of wAC (Figure 7b, black line), but the signals below 2 ppm due to water in micropores are less defined because somewhat broader. This may be due to a slightly broader pore distribution. In both wAC and pAC_micro, the signal at 7 ppm is quite broad, confirming the similarity of these samples.

3.6. FT-IR

The FT-IR spectra of the samples under investigation are shown in Figure 8. The intensities of the peaks are quite weak and the spectra suffer from strong baseline effects, as often observed in biochars and activated carbons [40]. A band at about 3400 cm−1 is observed for all the samples, and is ascribed to the stretching of hydroxyl groups of adsorbed water. Signals due to aromatic and alkenyl C-H stretching are observed in the 3100–3000 cm−1 region, and signals due to the stretching of aliphatic C-H groups occur in the interval 3000–2800 cm−1, accompanied by a signal at about 1380 cm−1 due to methyl groups. Although these signals are not always evident, they are clearly revealed when the spectra are converted into their second-derivative, as shown in the Supporting Information (Figures S1–S5). The persistence of aliphatic C-H groups is noteworthy and indicates that not all the aliphatic C-H bonds are broken during pyrolysis, nor during the subsequent activation. The fact that no aliphatic C-H signals are detected in the NMR spectra is probably due to the lower sensitivity of NMR compared to IR, and to their very low content. Together with the aromatic C-H stretching peaks, in some cases absorptions due to aromatic C-H deformations are visible in the spectral region ranging between 900–600 cm−1.
In the spectrum of wB, in the region below 2000 cm−1, two relatively more intense signals emerge at 1574 and 1174 cm−1. The former peak reflects the aromatic carbon-carbon stretching, whereas the signal centered at 1174 cm−1 can be assigned to the stretching of C-O groups. As already noted for the aliphatic C-H signals, these groups are not observable in the NMR spectra, probably because of their low content. The sharp signal at 621 cm−1 could be due to out-of-plane C–C–C inter-ring bending modes in polyaromatic structures or to a mineral contaminant.
The spectrum of wAC is very similar to that exhibited by graphene, except for residual intensity from the bands at 1574 cm−1 and 1174 cm−1 detected in wB [41,42]. The reduction of the band at 1174 cm−1 is expected because oxygen atoms were largely removed by activation.
The pB spectrum differs from the wB and the wAC spectra, showing a relatively strong and broad band at 1485 cm−1 and a narrow peak at 875 cm−1. These peaks have been observed in submicrometric calcite particles [43]. The calcite signals are absent in the activated carbons prepared from Posidonia, that is, pAC_meso and pAC_micro, indicating that the activation process followed by washing with an HCl aqueous solution removes the calcite originally present in the pB sample.
The spectra exhibited by the two activated carbons of Posidonia are quite different from one another. In fact, the spectrum of pAC_micro strongly resembles that displayed by graphene, and is hence quite similar to that of wAC. On the other hand, the spectrum of pAC_meso is dominated by the signals from the asymmetric and symmetric O-C=O stretch at 1575 cm−1 and 1378 cm−1.

4. Discussion

The most relevant information obtained from each characterization technique is summarized in Table 3.

4.1. Structure of the Pyrolyzed Biomasses

The analysis of the XRD, 13C ssNMR, and FT-IR spectra indicates that, in the pyrolysis process at 600 °C, cellulose is destroyed. As a result of pyrolysis, an amorphous char is formed, as indicated by the broad band in the region below 30° in XRD spectra (Figure 1). In the case of wB, the high efficiency of cross-polarization in the 13C ssNMR CP MAS experiments suggested the presence of small condensed aromatic structures rather than large polycondensed aromatic networks (Figure 6a). For this sample, polyaromatic structures are revealed also by FT-IR (Figure 8). On the basis of the relatively high H/C ratio, also pB is expected to be characterized by small polyaromatic domains. In this case, however, the cross-polarization process is inefficient, and no CP MAS signal is detected. This inefficiency is likely due to enhanced 1H and 13C relaxation during cross-polarization, which might decrease the magnitude of magnetization that can be transferred from the 1H to the 13C spins. This effect might indeed be relevant in this sample where relaxation could be accelerated by paramagnetic species, such as Mn2+ and Fe3+. The presence of these metal ions was quantified by ICP-OES measurements and detected by EPR for pB (Figure 3b). In fact, a major difference between wB and pB resides in the more relevant presence of an inorganic component in the latter. ICP-OES measurements indicate a relevant amount of Ca, in agreement with XRD (Figure 1), 13C ssNMR (Figure 5c), and FT-IR (Figure 8) spectra which show that this sample contains calcite. Calcite is already present in the fresh biomass, as detected by XRD, and is not removed by pyrolysis. Calcite may also favor the presence of Mn2+, which is known to substitute Ca2+ in the calcite crystalline lattice [44]. This explains the Mn2+ signal observed in the EPR spectrum of pB (Figure 3b). Furthermore, the minerals present in pB are likely to limit the process of organic radical formation, as observed in similar systems [14,15]. This is probably the reason for the significantly lower organic radical content in pB compared to wB.
The two biochars also show quite different porous structures. The Langmuir surface area is ten times higher in wB with respect to pB. This is consistent with the pore size distribution (Figure 2), which indicates a significantly more abundant microporosity in wB, whereas pB shows a meso-/macropore structure. The presence of micropores in wB is also revealed by the broad component in the EPR spectrum (Figure 3a), whereas organic radicals in larger pores give rise to the narrow signal observed in pB (Figure 3b).

4.2. Structure of the KOH ACs

Activation with a KOH:biochar ratio of 4 causes significant changes in the carbonaceous structure. A first hint of major changes involves the H/C and O/C ratios, which decrease approximately by two and ten times, respectively. This chemical composition change is related to the formation of graphitic planes, which are clearly revealed by the broad humps at about 24° and 44° in the XRD spectra. The cross-polarization inefficiency observed for both wAC and pAC_micro suggests the occurrence of large polycondensed aromatic networks, in agreement with FT-IR (Figure 8), which indicates the presence of graphene-like structures. Furthermore, the absence of an EPR signal in these ACs demonstrates that conductive aromatic domains are formed, suggesting that the graphitic planes are interconnected.
The ACs derived from the wood and Posidonia obtained with the larger KOH:biochar ratio show comparable Langmuir surface areas and pore size distributions which differ from the starting biochars. A prevalence of micropores is highlighted by nitrogen adsorption/desorption experiments and is also reflected in the 1H chemical shift values of water in the ssNMR spectra (Figure 7b,e). These also show that, in these samples, water is located in bottle-neck pores. In the case of pAC_micro, characterized by a smaller particle size, water is also adsorbed on the particle surface. It can thus be inferred that drastic activation conditions level off the structural differences between the materials from the two biomasses.
It is worth to point out that the activation process followed by washing with an HCl aqueous solution removes calcite as well as Mn2+ and Fe3+ ions from the pB sample. The removal of calcite is evident from the comparison of the FT-IR spectrum of pB with those of pAC_meso and pAC_micro, whereas the removal of the ions inferred from the EPR spectra of pB and of pAC_meso.

4.3. Effect of KOH:Biochar Ratio on the ACs Structures

The KOH:biochar ratio used in the activation process has a strong influence on the structure of the resulting AC. This was highlighted by the two activation treatments with different KOH:biochar ratios (4 and 2), performed on pB, giving rise to the pAC_micro and pAC_meso samples, respectively. pAC_meso shows a much larger O/C ratio compared to pAC_micro. The higher oxygen content in pAC_meso may be ascribed to the presence of carboxyl groups, detected by 13C ssNMR (Figure 5d) and FT-IR (Figure 8). These groups may derive from the insertion of KOH hydroxyl groups in the vacancies present in the structure. In fact, a study concerning the activation of a biomass at relatively low KOH:biochar ratios showed that the yield of all the O-containing species, especially O-C=O groups, increased upon increasing the ratio up to 1 [3]. Other studies exploring larger ratios showed that the C-O bond decomposed to a larger extent with increasing the ratio [45,46,47], in agreement with the absence of O-C=O signals in the FT-IR data of wAC and pAC_micro. In addition, in contrast to pAC_micro, pAC_meso shows an intense narrow EPR spectrum (Figure 3c), indicating that pAC_meso is not conductive. As a matter of fact, the 13C ssNMR spectra (Figure 6c) suggest the presence of small aromatic systems, for which CP is much more efficient than in the case of large polycondensed aromatic networks. Porosity is also affected by the different KOH:biochar ratios, with the prevalence of meso- and macropores at the smaller ratio. This type of porosity is confirmed by the water 1H chemical shift in the ssNMR spectrum.

5. Conclusions

The structure of wood and Posidonia biochars and their activated carbons was investigated by XRD, EPR, ssNMR, and FT-IR spectroscopies, together with nitrogen adsorption/desorption measurements and elemental composition analysis. The combined use of these different techniques provided a detailed structural characterization of the biochars and activated carbons, yielding information of relevance for applications.
Overall, the data point to the key role of the KOH:biochar ratio in affecting structural features of the activated carbons, with negligible effects resulting from the type of biomass. Indeed, the comparison of the structural features derived with the different methods for the different samples indicates that the larger ratio leads to large condensed aromatic structures with scarce functional groups bound to the aromatic planes. These planes are arranged in interconnected conducting domains within a largely microporous structure. On the contrary, the lower ratio leads to small condensed aromatic structures with carboxylic groups bound to the aromatic planes. Here, the aromatic planes are not arranged in interconnected conducting domains and are probably surrounded by an amorphous phase within an overall mesoporous structure.
The different structural features accessed by the two KOH:biochar ratios impact on the possible applications of the resulting activated carbons. In fact, the larger ratio leads to materials potentially suitable in the field of electrochemical energy storage, for which a partially graphitic structure, abundant microporosity, conductivity, and absence of oxygen-containing functional groups are important features for enhancing the carbon-based electrochemical process [28,48]. On the other hand, the smaller ratio gives rise to materials showing characteristics suitable for their use as adsorbents [2,49].

Supplementary Materials

The following supporting information can be downloaded at: https://www.mdpi.com/article/10.3390/physchem2030021/s1, Figure S1: FT-IR spectrum of sample wB and its second derivative. Figure S2: FT-IR spectrum of sample wAC and its second derivative. Figure S3: FT-IR spectrum of sample pB and its second derivative. Figure S4: FT-IR spectrum of sample pAC_meso and its second derivative. Figure S5: FT-IR spectrum of sample pAC_micro and its second derivative.

Author Contributions

Conceptualization, S.P. and C.F.; Formal analysis, S.P., S.M., A.M. and E.P.; Methodology, S.P., S.M., C.P., A.M., V.C., E.P. and C.F.; Supervision, S.P.; Writing—original draft, S.P., S.M., A.M. and C.F.; Writing—review & editing, S.P., S.M., C.P., A.M., V.C., E.P. and C.F. All authors have read and agreed to the published version of the manuscript.

Funding

This research received no external funding.

Institutional Review Board Statement

Not applicable.

Informed Consent Statement

Not applicable.

Data Availability Statement

The data presented in this study are available on request from the corresponding author.

Acknowledgments

The authors acknowledge Regione Toscana POR FESR 2014–2020 for the project FELIX (Fotonica ed Elettronica Integrate per l’Industria), grant no. 6455.

Conflicts of Interest

The authors declare no conflict of interest.

References

  1. Tian, W.; Zhang, H.; Duan, X.; Sun, H.; Shao, G.; Wang, S. Porous Carbons: Stucture-Oriented Design and Versatile Applications. Adv. Funct. Mater. 2020, 30, 1909265. [Google Scholar] [CrossRef]
  2. Mu’azu, N.D.; Jarrah, N.; Zubair, M.; Alagha, O. Removal of Phenolic Compounds fromWater Using Sewage Sludge-Based Activated Carbon Adsorption: A Review. Int. J. Environ. Res. Public Health 2017, 14, 1094. [Google Scholar] [CrossRef]
  3. Chen, W.; Gong, M.; Li, K.; Xia, M.; Chen, Z.; Xiao, H.; Fang, Y.; Chen, Y.; Yang, H.; Chen, H. Insight into KOH Activation Mechanism During Biomass Pyrolysis: Chemical Reactions Between O-Containing Groups and KOH. Appl. Energy 2020, 278, 115730. [Google Scholar] [CrossRef]
  4. Leng, L.; Xiong, Q.; Yang, L.; Li, H.; Zhou, Y.; Zhang, W.; Jiang, S.; Li, H.; Huang, H. An Overview on Engineering the Surface Area and Porosity of Biochars. Sci. Total Environ. 2021, 763, 144204. [Google Scholar] [CrossRef]
  5. Wang, J.; Kaskel, S. KOH Activation of Carbon-Based Materials for Energy Storage. J. Mater. Chem. 2012, 22, 23710. [Google Scholar] [CrossRef]
  6. Zheng, Y.; Wang, J.; Li, D.; Liu, C.; Lu, Y.; Lin, X. Insights into the KOH/KMnO4 Activation Mechanism of Oxygen-Enriched Hierarchical porous Biochar Derived from Biomass Waste by in-Situ Pyrolysis for Methylene Blue Enhanced Adsorption. J. Anal. Appl. Pyrolysis 2021, 158, 1052. [Google Scholar] [CrossRef]
  7. Lillo-Ródenas, M.A.; Cazorla-Amorós, D.; Linares-Solano, A. Understanding Chemical Reactions between Carbons and NaOH and KOH: An Insight into the Chemical Activation Mechanism. Carbon 2003, 41, 267–275. [Google Scholar] [CrossRef]
  8. Zhu, Y.; Murali, S.; Stoller, M.D.; Ganesh, K.J.; Cai, W.; Ferreira, P.J.; Pirkle, A.; Wallace, R.M.; Cychosz, K.A.; Thommes, M.; et al. Carbon-Based Supercapacitors Produced by Activation of Graphene. Science 2011, 332, 1537–1541. [Google Scholar] [CrossRef]
  9. Raymundo-Piñero, E.; Azaïs, P.; Cacciaguerra, T.; Cazorla-Amorós, D.; Linares-Solano, A.; Béguin, F. KOH and NaOH Activation Mechanisms of Multiwalled Carbon Nanotubes with Different Structural Organisation. Carbon 2005, 43, 786–795. [Google Scholar] [CrossRef]
  10. Pedicini, R.; Maisano, S.; Chiodo, V.; Conte, G.; Policicchio, A.; Agostino, R.G. Posidonia Oceanica and Wood Chips Activated Carbon as Interesting Materials for Hydrogen Storage. Int. J. Hydrog. Energy 2020, 45, 14038–14047. [Google Scholar] [CrossRef]
  11. Grinberg, O.Y.; Williams, B.B.; Ruuge, A.E.; Grinberg, S.A.; Wilcox, D.E.; Swartz, H.M.; Freed, J.H. Oxygen Effects on the EPR Signals from Wood Charcoals: Experimental Results and the Development of a Model. J. Phys. Chem. B 2007, 111, 13316–13324. [Google Scholar] [CrossRef] [PubMed]
  12. Konchits, A.A.; Shanina, B.D.; Valakh, M.Y.; Yanchuk, I.B.; Yukhymchuk, V.O.; Alexeev, A.D.; Vasilenko, T.A.; Molchanov, A.N.; Kirillov, A.K. Local Structure, Paramagnetic Properties, and Porosity of Natural Coals: Spectroscopic studies. J. Appl. Phys. 2012, 112, 043504. [Google Scholar] [CrossRef]
  13. Bährle, C.; Custodis, V.; Jeschke, G.; van Bokhoven, J.A.; Vogel, F. In Situ Observation of Radicals and Molecular Products during Lignin Pyrolysis. ChemSusChem 2014, 7, 2022–2029. [Google Scholar] [CrossRef] [PubMed]
  14. Trubetskaya, A.; Jensen, P.A.; Jensen, A.D.; Glarborg, P.; Hofmann Larsen, F.; Larsen Andersen, M. Characterization of Free Radicals by Electron Spin Resonance Spectroscopy in Biochars from Pyrolysis at High Heating Rates and at High Temperatures. Biomass Bioenergy 2016, 94, 117–129. [Google Scholar] [CrossRef]
  15. Bourke, J.; Manley-Harris, M.; Fushimi, C.; Dowaki, K.; Nunoura, T.; Antal, M.J., Jr. Do All Carbonized Charcoals Have the Same Chemical Structure? 2. A Model of the Chemical Structure of Carbonized Charcoal. Ind. Eng. Chem. Res. 2007, 46, 5954–5967. [Google Scholar] [CrossRef]
  16. Baccile, N.; Falco, C.; Titirici, M.-M. Characterization of Biomass and its Derived Char Using 13C-Solid State Nuclear Magnetic Resonance. Green Chem. 2014, 16, 4839–4869. [Google Scholar] [CrossRef]
  17. Bardet, M.; Hediger, S.; Gerbaud, G.; Gambarelli, S.; Jacquot, J.F.; Foray, M.F.; Gadelle, A. Investigation with 13C NMR, EPR and Magnetic Susceptibility Measurements of Char Residues Obtained by Pyrolysis of Biomass. Fuel 2007, 86, 1966–1976. [Google Scholar] [CrossRef]
  18. Knicker, H.; Velasco-Molina, M.; Knicker, M. 2D Solid-State HETCOR 1H-13C NMR Experiments with Variable Cross Polarization Times as a Tool for a Better Understanding of the Chemistry of Cellulose-Based Pyrochars—A Tutorial. Appl. Sci. 2021, 11, 8569. [Google Scholar] [CrossRef]
  19. Kloss, S.; Zehetner, F.; Dellantonio, A.; Hamid, R.; Ottner, F.; Liedtke, V.; Schwanninger, M.; Gerzabek, M.H.; Soja, G. Characterization of Slow Pyrolysis Biochars: Effects of Feedstocks and Pyrolysis Temperature on Biochar Properties. J. Environ. Qual. 2012, 41, 990–1000. [Google Scholar] [CrossRef]
  20. Seaton, N.A.; Walton, J.P.R.B.; Quirke, N. A New Analysis Method for the Determination of the Pore Size Distribution of Porous Carbons from Nitrogen Adsorption Measurements. Carbon 1989, 27, 853–861. [Google Scholar] [CrossRef]
  21. Ustinov, E.A.; Do, D.D. Application of Density Functional Theory to Analysis of Energetic Heterogeneity and Pore Size Distribution of Activated Carbons. Langmuir 2004, 20, 3791–3797. [Google Scholar] [CrossRef] [PubMed]
  22. Reza, M.T.; Lynam, J.G.; Uddin, M.H.; Coronella, C.J. Hydrothermal Carbonization: Fate of Inorganics. Biomass Bioenergy 2013, 49, 86–94. [Google Scholar] [CrossRef]
  23. Ambrosetti, R.; Ricci, D. A Fast Time Averaging Data Acquisition-System for the PC-AT bus. Rev. Sci. Instrum. 1991, 62, 2281–2287. [Google Scholar] [CrossRef]
  24. Cory, D.G.; Ritchey, W.M. Suppression of Signals from the Probe in Bloch Decay Spectra. J. Magn. Reson. 1988, 80, 128–132. [Google Scholar] [CrossRef]
  25. Mimmo, T.; Panzacchi, P.; Baratieri, M.; Davies, C.A.; Tonon, G. Effect of Pyrolysis Temperature on Miscanthus (Miscanthus × giganteus) Biochar Physical, Chemical and Functional Properties. Biomass Bioenergy 2014, 62, 149–157. [Google Scholar] [CrossRef]
  26. Chiodo, V.; Zafarana, G.; Maisano, S.; Freni, S.; Urbani, F. Pyrolysis of Different Biomass: Direct Comparison among Posidonia Oceanica, Lacustrine Alga and White-Pine. Fuel 2016, 164, 220–227. [Google Scholar] [CrossRef]
  27. Borysiak, S.; Doczekalska, B. X-ray Diffraction Study of Pine Wood Treated with NaOH. Fibres Text. East. Eur. 2005, 13, 87–89. [Google Scholar]
  28. Sun, F.; Wang, L.; Peng, Y.; Gao, J.; Pi, X.; Qu, Z.; Zhao, G.; Qin, Y. Converting Biomass Waste into Microporous Carbon with Simultaneously High Surface Area and Carbon Purity as Advanced Electrochemical Energy Storage Materials. Appl. Surf. Sci. 2018, 436, 486–494. [Google Scholar] [CrossRef]
  29. Boughriet, A.; Cordier, C.; Deram, L.; Ouddane, B.; Chamley, H.; Wartel, W. Coprecipitation/Accumulation/Distribution of Manganese and Iron, and Electrochemical Characteristics of Mn in Calcareous Seawater. Fresenius’ J. Anal. Chem. 1995, 352, 341–353. [Google Scholar] [CrossRef]
  30. Lu, D.-Y.; Gao, X.-L.; Chi, Y.; Wang, H.-G.; Yand, X.; Qiao, T. Preliminary Study on the Correlation Between the Trace Mn2+ and the Calcite Polymorph in Gallstones Containing Calcium Carbonate from the Northeast China via Electron Spin Resonance. J. Trace Elem. Med. Biol. 2020, 60, 126494. [Google Scholar] [CrossRef]
  31. Jeschke, G. Electron Paramagnetic Resonance: Recent Developments and Trends. Curr. Opin. Solid State Mater. Sci. 2003, 7, 181–188. [Google Scholar] [CrossRef]
  32. Papenguth, H.W.; Kirkpatrick, R.J.; Montez, B.; Sandberg, P.A. 13C MAS NMR Spectroscopy of Inorganic and Biogenic Carbonates. Am. Mineral. 1989, 74, 1152–1158. [Google Scholar]
  33. Brewer, C.E.; Schmidt-Rohr, K.; Satrio, J.A.; Brown, R.C. Characterization of Biochar from Fast Pyrolysis and Gasification Systems. Environ. Prog. Sustain. Energy 2009, 28, 386–396. [Google Scholar] [CrossRef]
  34. Cao, X.; Pignatello, J.J.; Li, Y.; Lattao, C.; Chappell, M.A.; Chen, N.; Miller, L.F.; Mao, J. Characterization of Wood Chars Produced at Different Temperatures Using Advanced Solid-State 13C NMR Spectroscopic Techniques. Energy Fuels 2012, 26, 5983–5991. [Google Scholar] [CrossRef]
  35. Althaus, S.M.; Mao, K.; Kennedy, G.J.; Pruski, M. Solid-State NMR Studies of Fossil Fuels using One- and Two-Dimensional Methods at High Magnetic Field. Energy Fuels 2012, 26, 4405–4412. [Google Scholar] [CrossRef]
  36. Forse, A.C.; Griffin, J.M.; Presser, V.; Gogotsi, Y.; Grey, C.P. Ring Current Effects: Factors Affecting the NMR Chemical Shift of Molecules Adsorbed on Porous Carbons. J. Phys. Chem. C 2014, 118, 7508–7514. [Google Scholar] [CrossRef]
  37. Cervini, L.; Lynes, O.D.; Akien, G.R.; Kerridge, A.; Barrow, N.S.; Griffith, J.M. Factors Affecting the Nucleus-independent Chemical Shift in NMR Studies of Microporous Carbon Electrode Materials. Energy Storage Mater. 2019, 21, 335–346. [Google Scholar] [CrossRef]
  38. Szewczyk, I.; Rokicińska, A.; Michalik, M.; Chen, J.; Jaworski, A.; Aleksis, R.; Pell, A.J.; Hedin, N.; Slabon, A.; Kuśtrowski, P. Electrochemical Denitrification and Oxidative Dehydrogenation of Ethylbenzene over N-doped Mesoporous Carbon: Atomic Level Understanding of Catalytic Activity by 15N NMR Spectroscopy. Chem. Mater. 2020, 32, 7263–7273. [Google Scholar] [CrossRef]
  39. Le Bozec, G.; Giraudet, S.; Le Polles, L.; Le Cloirec, P. 1H NMR Investigations of Activated Carbon Loaded with Volatile Organic Compounds: Quantification, Mechanisms, and Diffusivity Determination. Langmuir 2017, 33, 1605–1613. [Google Scholar] [CrossRef]
  40. Chia, C.H.; Gong, B.; Joseph, S.D.; Marjo, C.E.; Munroe, P.; Rich, A.M. Imaging of Mineral-Enriched Biochar by FTIR, Raman and SEM-EDX. Vib. Spectrosc. 2012, 62, 248–257. [Google Scholar] [CrossRef]
  41. Lian, P.; Zhu, X.; Liang, S.; Li, Z.; Yang, W.; Wang, H. Large Reversible Capacity of High Quality Graphene Sheets as an Anode Material for Lithium-Ion Batteries. Electrochim. Acta 2010, 55, 3909–3914. [Google Scholar] [CrossRef]
  42. Kalahal, P.B.; Kulkarni, A.S.; Sajjan, A.M.; Khan, T.M.Y.; Anjum Badruddin, I.; Kamangar, S.; Banapurmath, N.R.; Ayachit, N.H.; Naik, M.L.; Marakatti, V.S. Fabrication and Physicochemical Study of B2SA-Grafted Poly (vinyl Alcohol)–Graphene Hybrid Membranes for Dehydration of Bioethanol by Pervaporation. Membranes 2021, 11, 110. [Google Scholar] [CrossRef] [PubMed]
  43. Facchinetto, S.E.; Bortolotto, T.; Neumann, G.E.; Vieira, J.C.B.; de Menezes, B.B.; Giacomelli, C.; Schmidt, V. Synthesis of Submicrometer Calcium Carbonate Particles from Inorganic Salts Using Linear Polymers as Crystallization Modifiers. J. Braz. Chem. Soc. 2017, 28, 547–556. [Google Scholar] [CrossRef]
  44. Wartel, M.; Skiker, M.; Auger, Y.; Boughriet, A. Interaction of Mn2+ with Carbonates in Seawater: Assessment of the Solubility Product of MnCO3 and Mn Distribution Coefficient between the Liquid Phase and CaCO3 Particles. Mar. Chem. 1990, 29, 99–117. [Google Scholar] [CrossRef]
  45. Chunlan, L.; Shaoping, X.; Yixiong, G.; Shuqin, L.; Changhou, L. Effect of Pre-Carbonization of Petroleum Cokes on Chemical Activation Process with KOH. Carbon 2005, 43, 2295–2301. [Google Scholar] [CrossRef]
  46. Zornitta, R.L.; Barcelos, K.M.; Nogueira, F.G.E.; Ruotolo, L.A.M. Understanding the Mechanism of Carbonization and KOH Activation of Polyaniline Leading to Enhanced Electrosorption Performance. Carbon 2020, 156, 346–358. [Google Scholar] [CrossRef]
  47. Zhang, Z.; Zhou, Z.; Peng, H.; Qin, Y.; Li, G. Nitrogen- and Oxygen-Containing Hierarchical Porous Carbon Frameworks for High-Performance Supercapacitors. Electrochim. Acta 2014, 134, 471–477. [Google Scholar] [CrossRef]
  48. Kolanowski, Ł.; Graś, M.; Bartkowiak, M.; Doczekalska, B.; Lota, G. Electrochemical Capacitors Based on Electrodes Made of Lignocellulosic Waste Materials. Waste Biomass Valorization 2020, 11, 3863–3871. [Google Scholar] [CrossRef]
  49. Shen, Y.; Zhou, Y.; Fu, Y.; Zhang, N. Activated Carbons Synthesized from Unaltered and Pelletized Biomass Wastes for Bio-tar Adsorption in Different Phases. Renew. Energy 2020, 146, 1700–1709. [Google Scholar] [CrossRef]
Figure 1. X-ray diffraction patterns of fresh biomasses (pF and wF), biochars (pB and wB), and activated carbons (pAC_meso, pAC_micro, and wAC). The patterns of pF, pB, wB, and wAC were published in Ref. [10].
Physchem 02 00021 g001
Figure 2. Pore size distribution of the biochars and activated carbons.
Physchem 02 00021 g002
Figure 3. EPR spectra of samples wB (a), pB (b), and pAC_meso (c). In (a), the broad (blue dashed line) and the narrow (red dotted line) spectral components discussed in the text are also reported, together with their sum (black dashed dotted line). In (b) the displayed spectrum was baseline corrected, thus eliminating a broad component mentioned in the text.
Physchem 02 00021 g003
Figure 4. EPR spectrum of sample wAC diluted in KBr at a concentration of 1.7 wt%.
Physchem 02 00021 g004
Figure 5. 13C SPE MAS spectra of wB (a), wAC (b), pB (c), pAC_meso (d), and pAC_micro (e). Sidebands are marked with asterisks.
Physchem 02 00021 g005
Figure 6. Comparison of 13C CP MAS and SPE spectra of wB (a,b, respectively) and of pAC_meso (c,d, respectively). Sidebands are marked with asterisks.
Physchem 02 00021 g006
Figure 7. 1H MAS spectra of wB (a), wAC (b), pB (c), pAC_meso (d), and pAC_micro (e) as prepared (red lines) and after heating at 150 °C for 12 h (black lines). The vertical lines serve as a visual guide for the positions 1.7 and 7 ppm.
Physchem 02 00021 g007
Figure 8. FT-IR spectra of the samples indicated.
Physchem 02 00021 g008
Table 1. Langmuir surface area and elemental composition of the samples under investigation.
SampleLangmuir Surface Area (m2/g) aElemental Composition (wt%) aAsh (wt%) a
CHNO
wF 47.16.30.339.82.0
pF 40.36.01.125.714.0
wB42569.21.80.228.2
wAC283595.61.20.03.2
pB41582.81.837.5
pAC_meso47980.82.31.515.4
pAC_micro236592.12.00.75.2
a Data for samples wF and pF, wB, pB, and wAC are taken from Ref. [10].
Table 2. Organic radical content of the samples examined.
SampleOrganic Radical Content (Spin/g)
wB8.7 × 1019
pB1.0 × 1016
pAC_meso5.3 × 1019
Table 3. Most relevant structural information emerging from each characterization technique for the samples under investigation.
SampleH/C Molar RatioO/C Molar RatioPorosity %XRDEPR13C ssNMR1H ssNMRFT-IR
micromesomacro
wB0.310.3140.045.015.0Absence of cellulose and of graphitic planesObservable signal: absence of interconnected conducting domains;
broad signal: meso-microporosity
Absence of cellulose;
CP efficiency: presence of small aromatic networks
Porosity accessible to waterAbsence of cellulose;
presence of C-O groups
wAC0.150.0377.021.21.8Abundant microporous structure;
presence of graphitic planes
No signal: presence of interconnected conducting domainsCP inefficiency: presence of large aromatic networksWater located in bottle-neck poresPresence of graphene-like structures
pB0.580.480.865.034.2Absence of cellulose and of graphitic planes;
presence of calcite
Observable signal: absence of interconnected conducting domains;
narrow signal: macro-mesoporosity;
presence of Mn2+ and Fe3+
Absence of cellulose;
presence of calcite
Porosity accessible to waterAbsence of cellulose;
presence of calcite
pAC_meso0.340.1417.155.027.9Abundant microporous structure;
presence of graphitic planes
Observable signal: absence of interconnected conducting domains;
narrow signal: macro-mesoporosity
Presence of carboxylic groups;
CP efficiency: small aromatic networks
Porosity accessible to waterPresence of carboxylic groups
pAC_micro0.260.0470.723.95.3Abundant microporous structure;
presence of graphitic planes
No signal: presence of interconnected conducting domainsCP inefficiency: presence of large aromatic networksWater located in bottle-neck pores and on the external surfacePresence of graphene-like structures
Publisher’s Note: MDPI stays neutral with regard to jurisdictional claims in published maps and institutional affiliations.

