
Long-Term Tillage and Irrigation Management Practices: Impact on Carbon Budgeting and Energy Dynamics under Rice–Wheat Rotation of Indian Mid-Himalayan Region

 , ,
, ,
Abstract
:1. Introduction
2. Materials and Methods
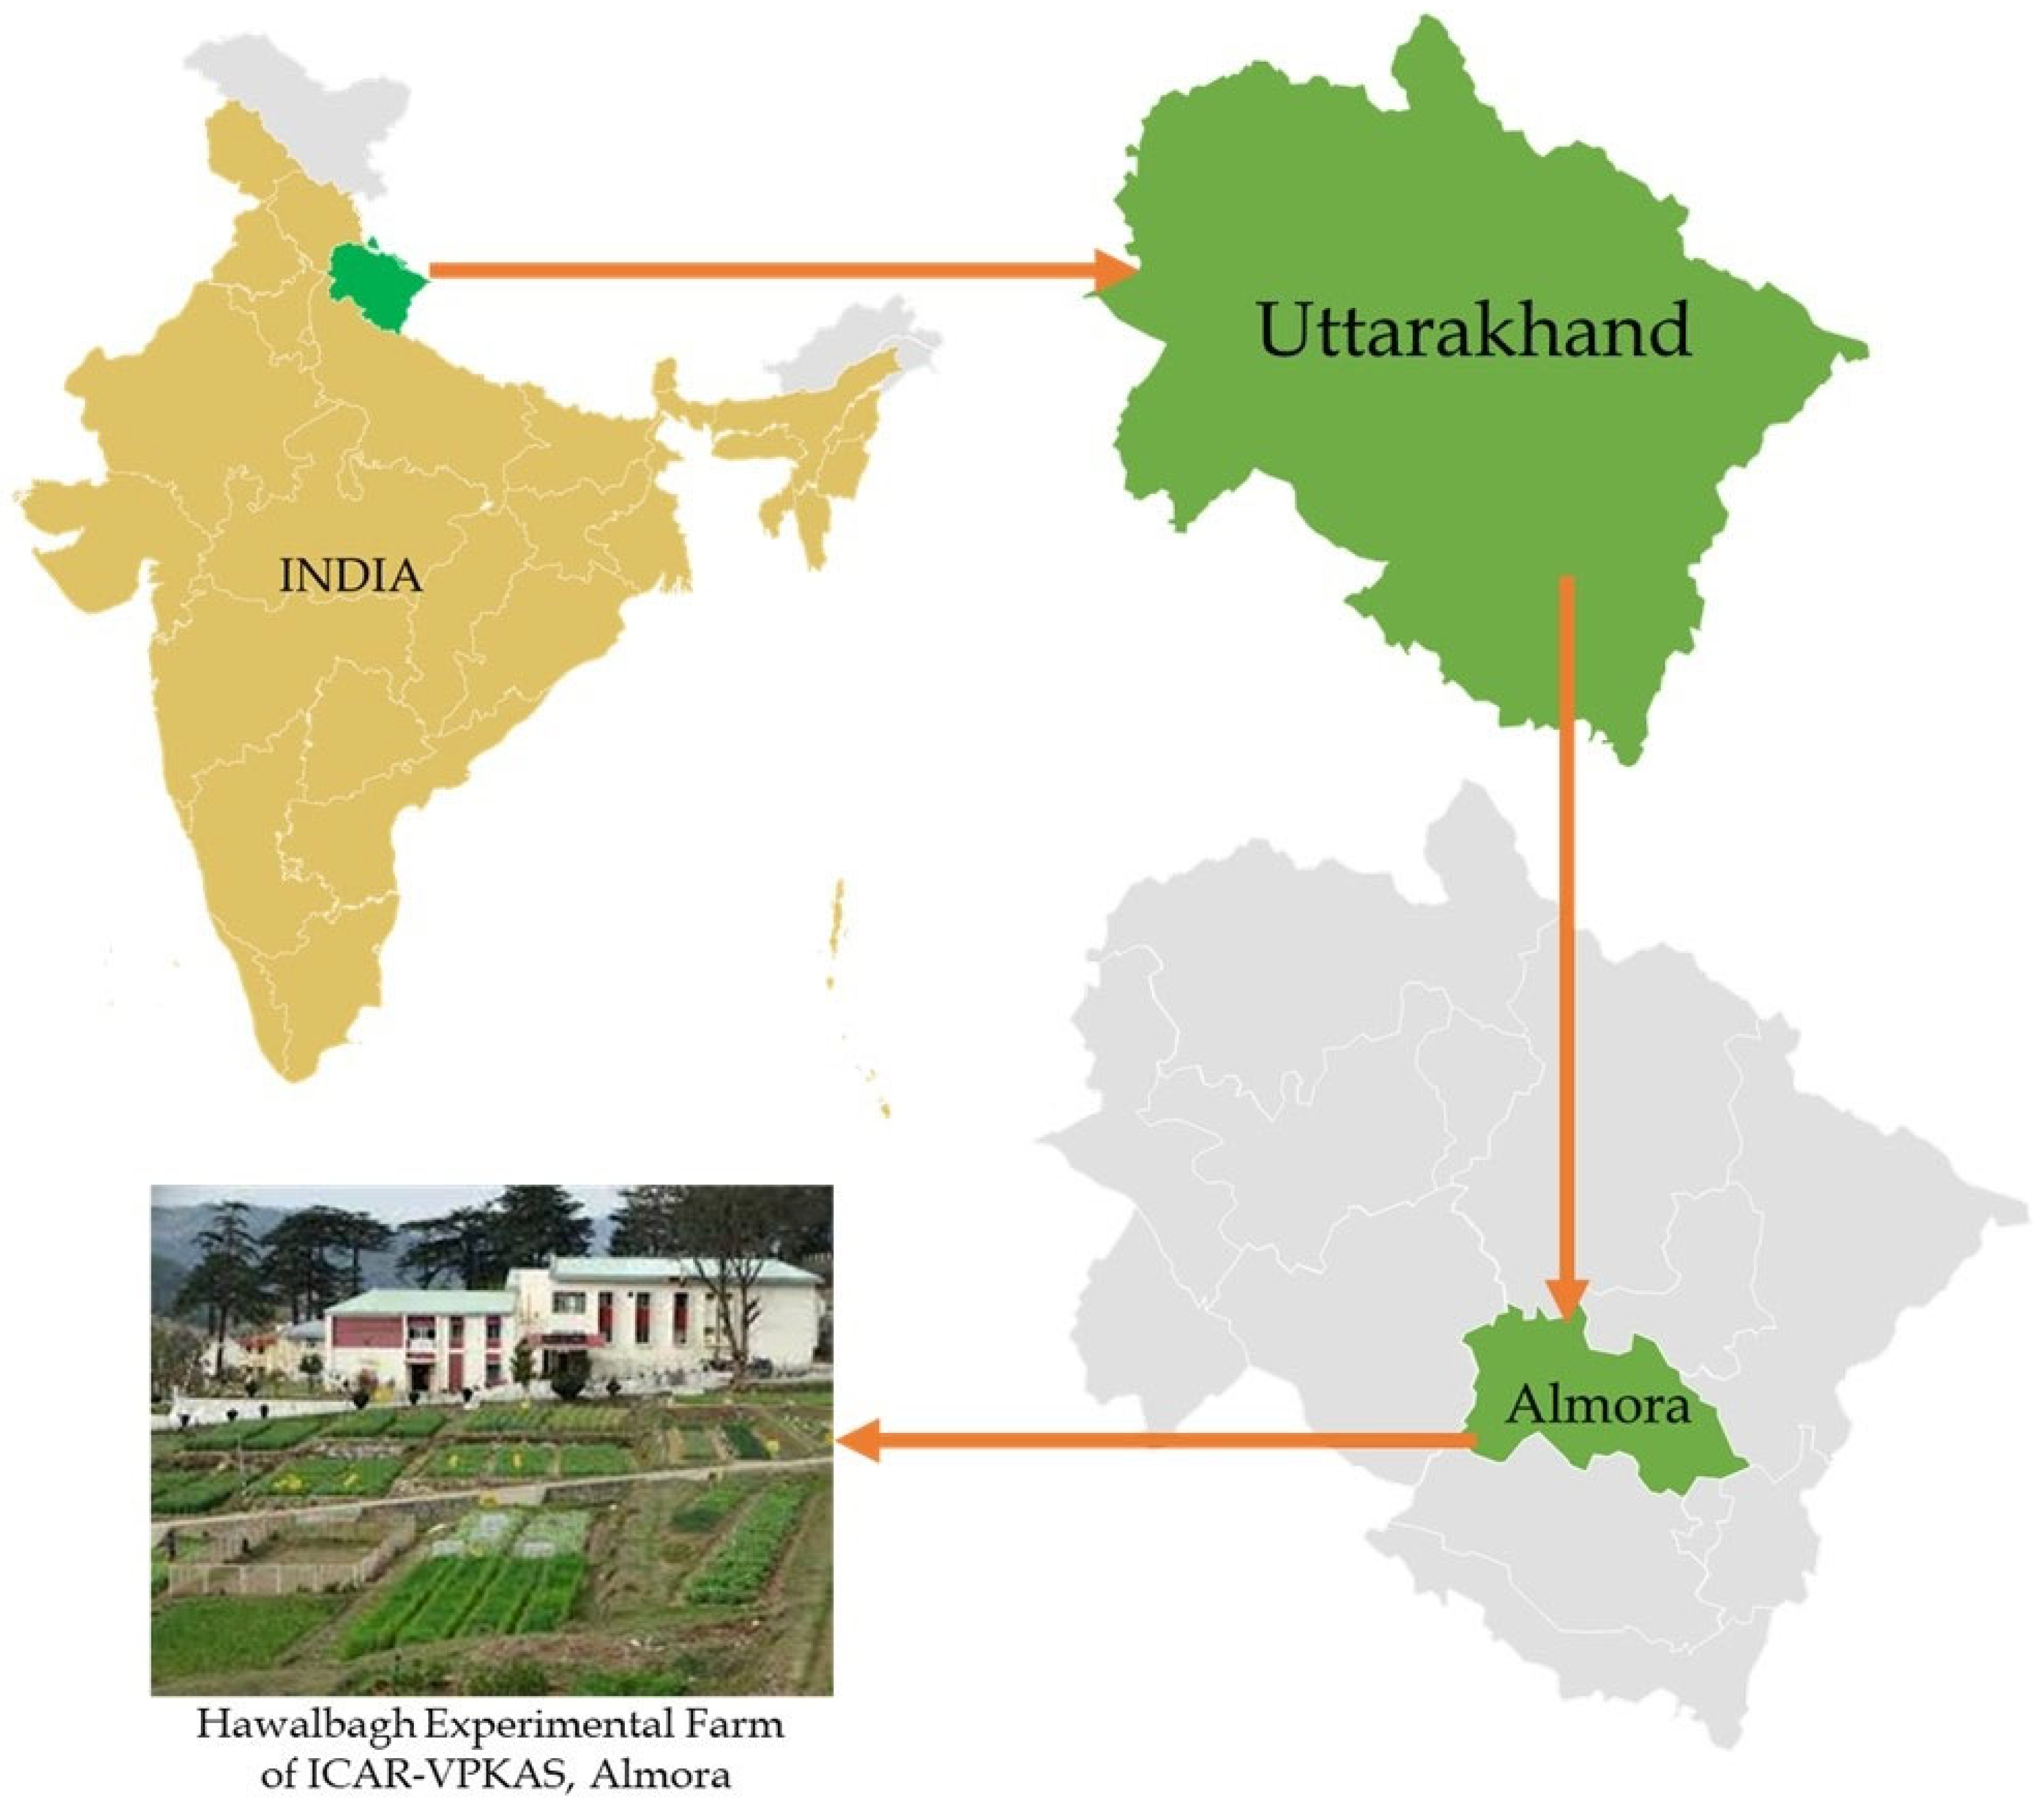
2.1. Site Details, Experiment Design and Crop Management
2.2. Energy and Carbon Use Indices

| Particulars | Unit | Energy Equivalents (MJ Unit−1) | References | |
|---|---|---|---|---|
| Inputs | ||||
| Human power | Man-hr | 1.96 | [17] | |
| Women-hr | 1.56 | |||
| Diesel | Litre | 56.31 | [17] | |
| Farm machinery | kg | 62.70 | [17] | |
| Seed | Rice | kg | 15.2 | [17,18,19] |
| Wheat | 15.2 | |||
| Chemical fertilizers | N | kg | 60.60 | [17] |
| P2O5 | 11.10 | |||
| K2O | 6.70 | |||
| Water for irrigation | m3 | 1.02 | [20] | |
| Electricity | kWh | 11.93 | ||
| Chemicals | Herbicides | kg | 238 | [21] |
| Insecticides | 199 | |||
| Fungicides | 92 | |||
| Outputs | ||||
| Grain yield | Rice | kg | 14.70 | [17] |
| Wheat | 15.70 | |||
| Straw/leaves/roots/stubbles yield | Rice | 12.50 | ||
| Wheat | 12.50 | |||
| Parameters | Formulas/Equations | References |
|---|---|---|
| Energy use indices | Energy use efficiency (EUE) = Energy output (MJ ha−1)/Energy input (MJ ha−1) | [17] |
| Specific energy (SE) (MJ kg−1) = Total energy input (MJ ha−1)/Grain + straw yield (kg ha−1) | ||
| Energy productivity (EP) (kg MJ−1) = Economic yield (kg ha−1)/Energy input (MJ ha−1) | ||
| Energy profitability (PE) = Net energy return (MJ ha−1)/Energy input (MJ ha−1) | ||
| Net energy return (NER) (MJ ha−1) = Energy output (MJ ha−1)—Energy input (MJ ha−1) | ||
| Carbon use indices | Carbon output (kg CE ha−1) = Total biomass (economic yield + by product yield) × 0.44 * | [15,22] |
| Carbon input (kg CE ha−1) = (Sum of total GHG emissions in CO2 eq.) × 12/44 | ||
| Carbon use efficiency = Carbon output/carbon input | ||
| Carbon footprint (kg CE kg−1 grain) = Total carbon emission or input (kg CE ha−1)/System grain yield (kg ha−1) | ||
| GHGs emissions | ; Where GHG emissions are the total carbon emissions; AIi is the agricultural input factors applied, e.g., Diesel, electricity, fertilizer and pesticide and EFi is the appropriate carbon emission conversion coefficient for each factor of AIi. | [23,24] |
| GHG N2O emission = FN × EF × [44/28]; Where GHGN2O represents direct N2O emissions from the application of N fertilizer (C eq. per unit); FN is the quantity of N fertilizer (kg) applied for crop production; EF is the emission factor of N2O emissions induced by N fertilizer application; 44/28 presents the molecular weight of N2 in relation to N2O. | ||
| GHG CH4 emissions = EF × T Where CH4 is the methane emissions from rice cultivation (kg CH4 ha−1), EF is the adjusted daily emission factor (kg CH4 ha−1 day−1), and T is the cultivation period of rice (days). | ||
| GWP | GWP = (CO2 emission × 1) + (CH4 emission × 25) + (N2O emission × 298) | [25] |
2.3. Greenhouse Gas (GHGs) Emission
| Particulars | Unit | GHG Coefficients (kg CO2 eq. Unit−1) | References |
|---|---|---|---|
| Diesel | Litre | 2.68 | [27] |
| Electricity | kWh | 0.994 | |
| Machinery | MJ | 0.074 | [28] |
| Nitrogen (N) | kg | 4.96 | [29] |
| Phosphorus (P2O5) | 0.73 | ||
| Potassium (K2O) | 0.54 | ||
| Herbicides | kg | 6.30 | [15] |
| Insecticides | 5.10 | ||
| Fungicides | 3.90 | ||
| Emission factor for N2O emissions for rice | kg N2O-N kg−1 N input | 0.51 | [30] |
| Emission factor for N2O emissions for wheat | 0.33 | ||
| CH4 emissions | kg CH4 ha−1 day−1 | 3.12 | [31] |
2.4. Data Processing and Statistical Analyses
3. Results
3.1. Biomass Yield
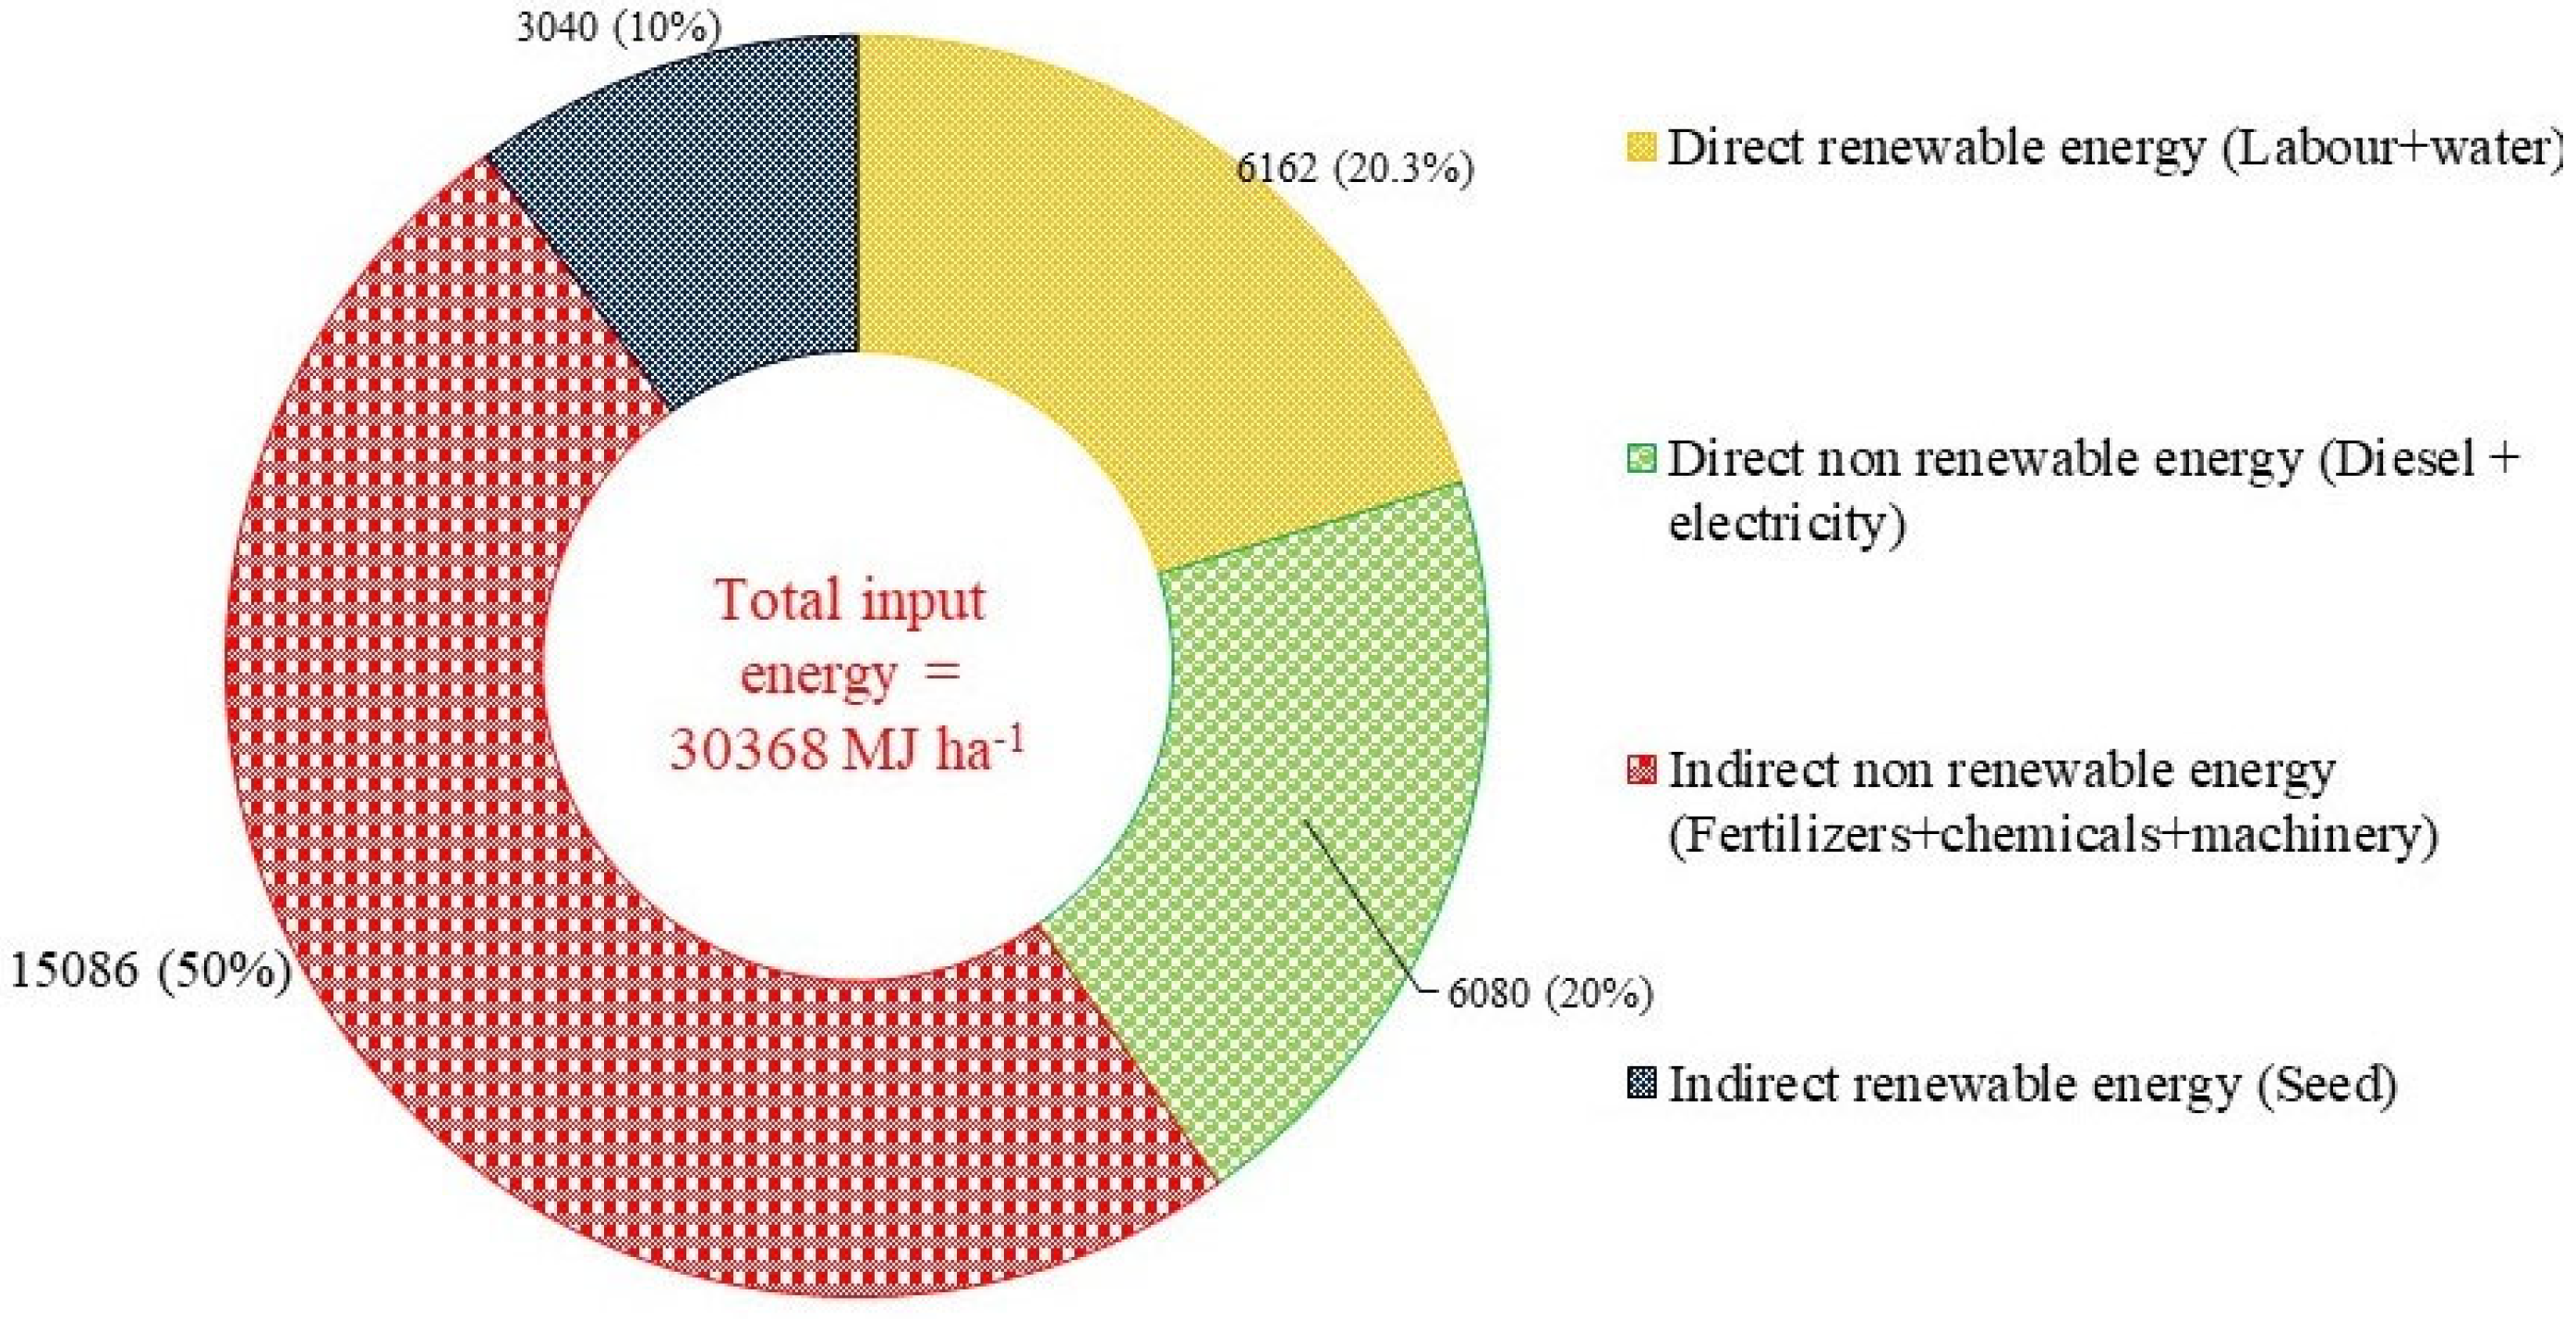
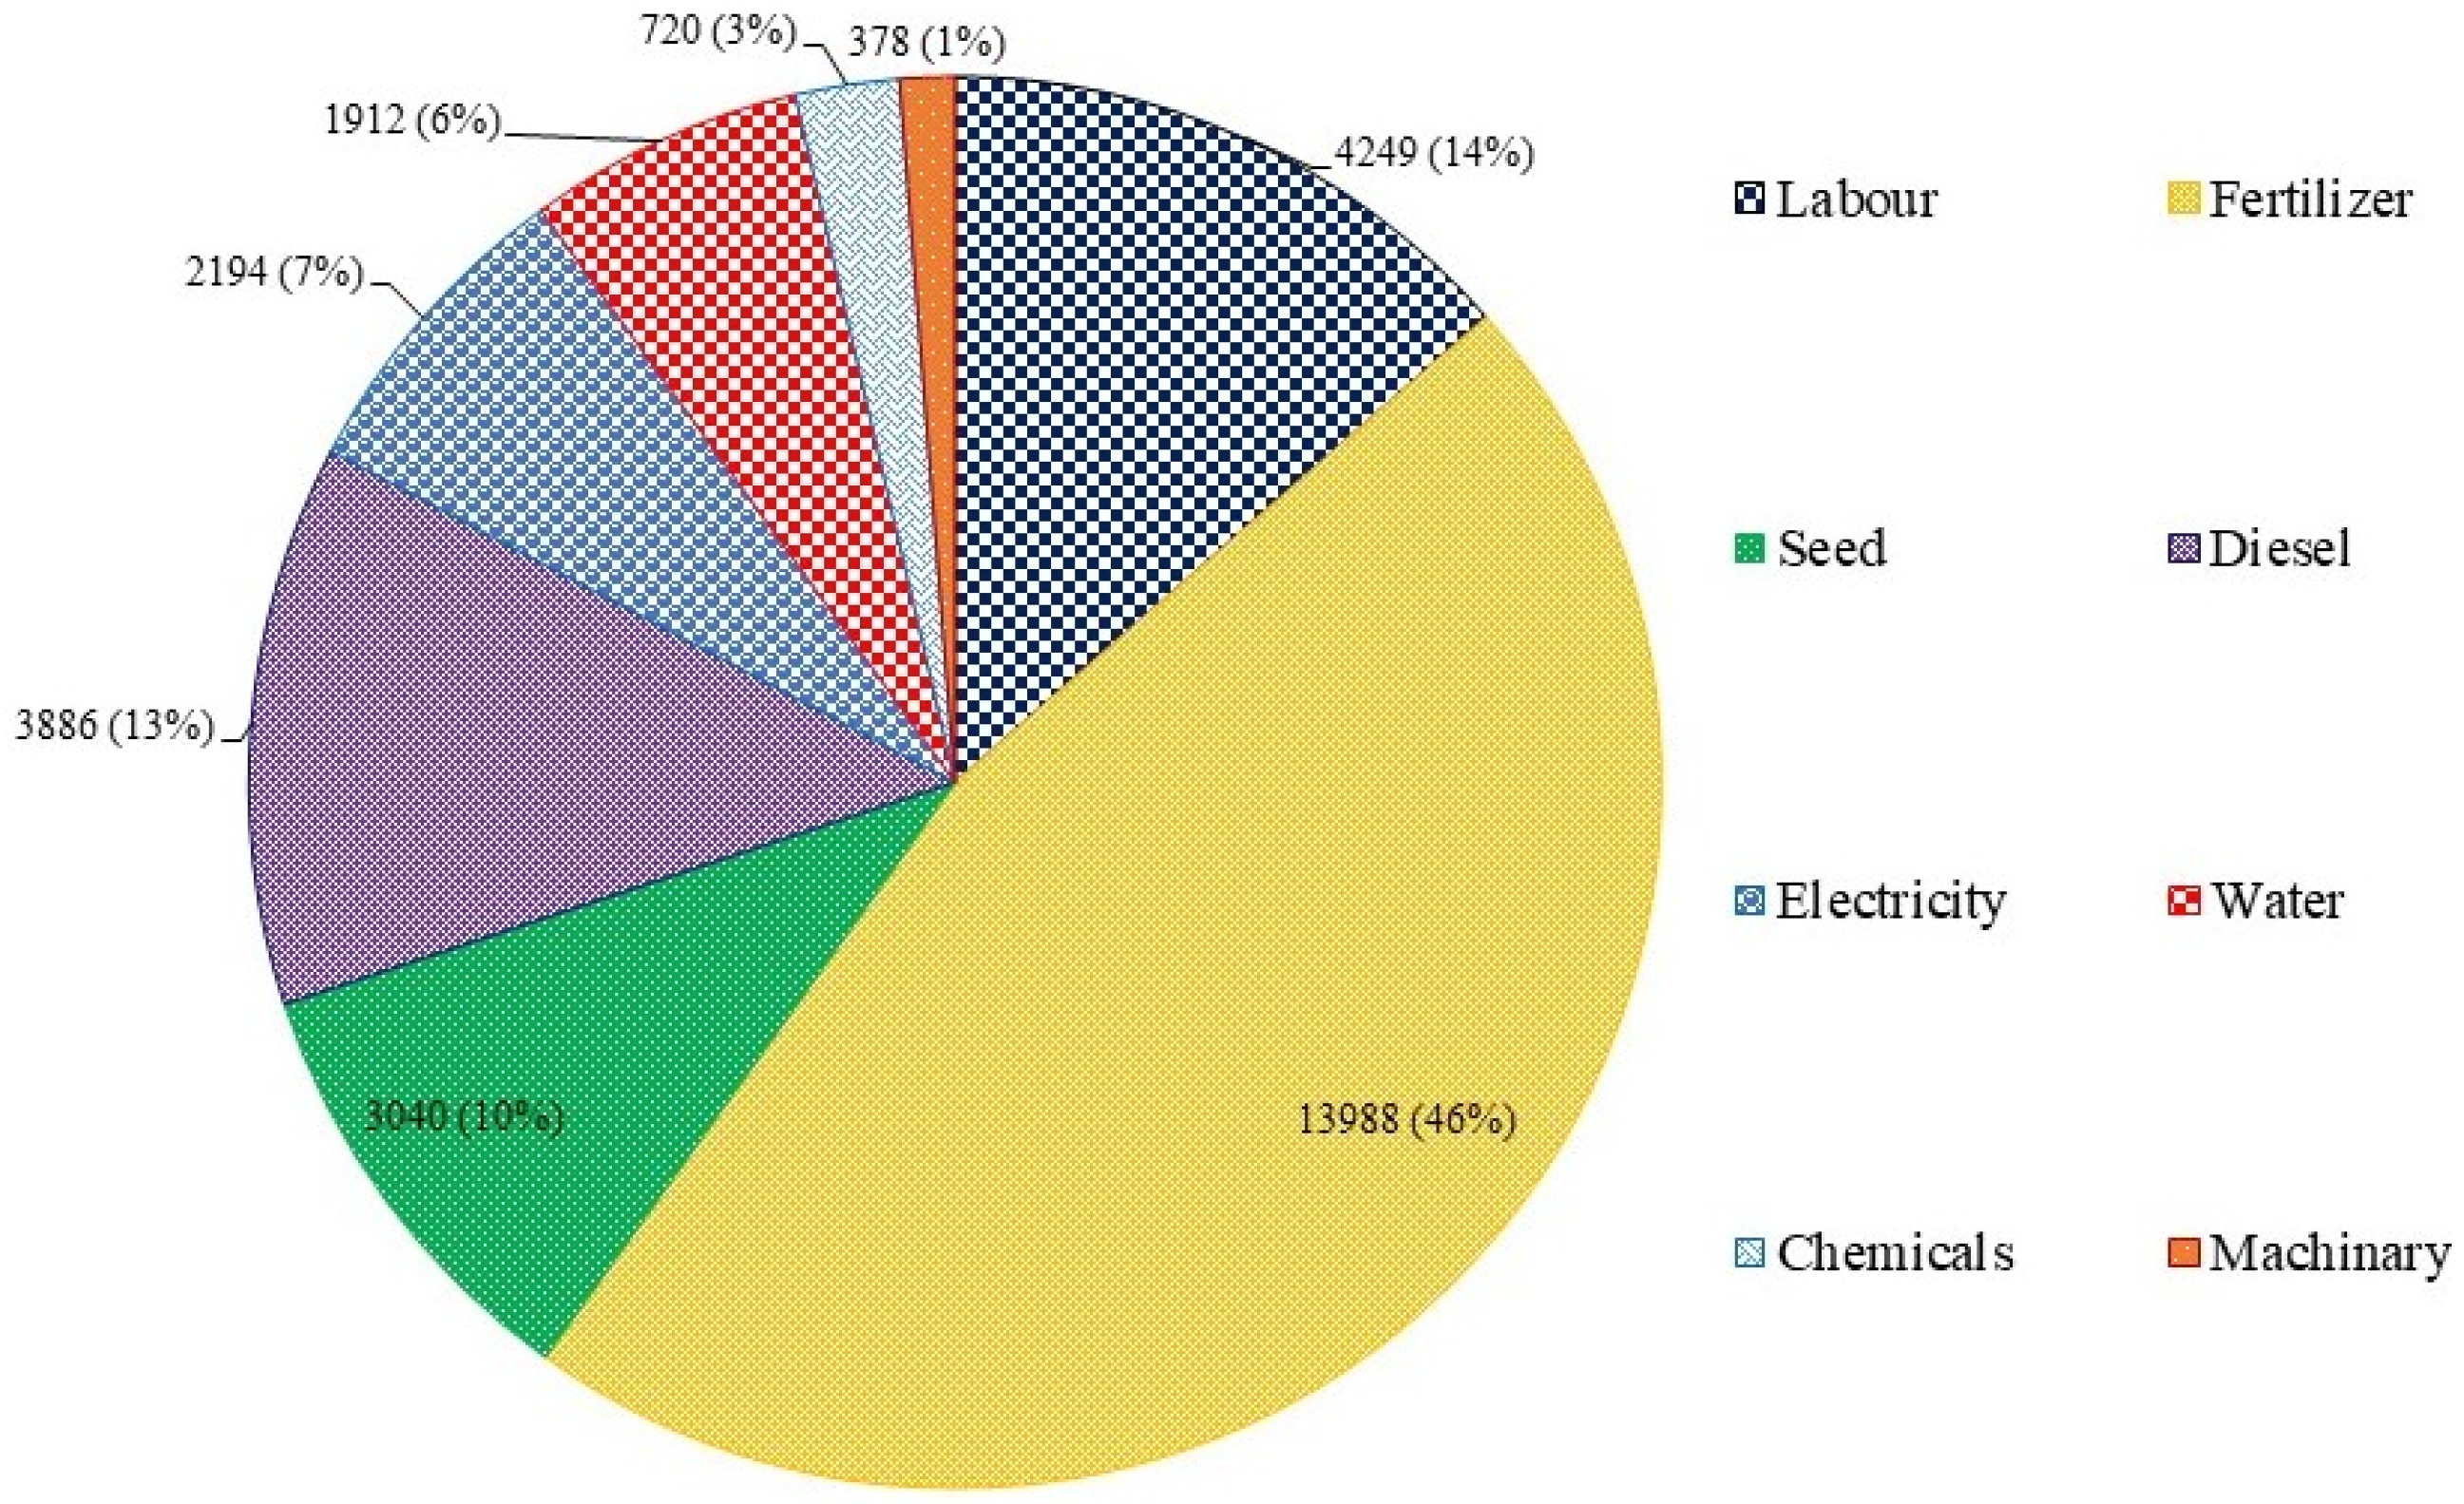
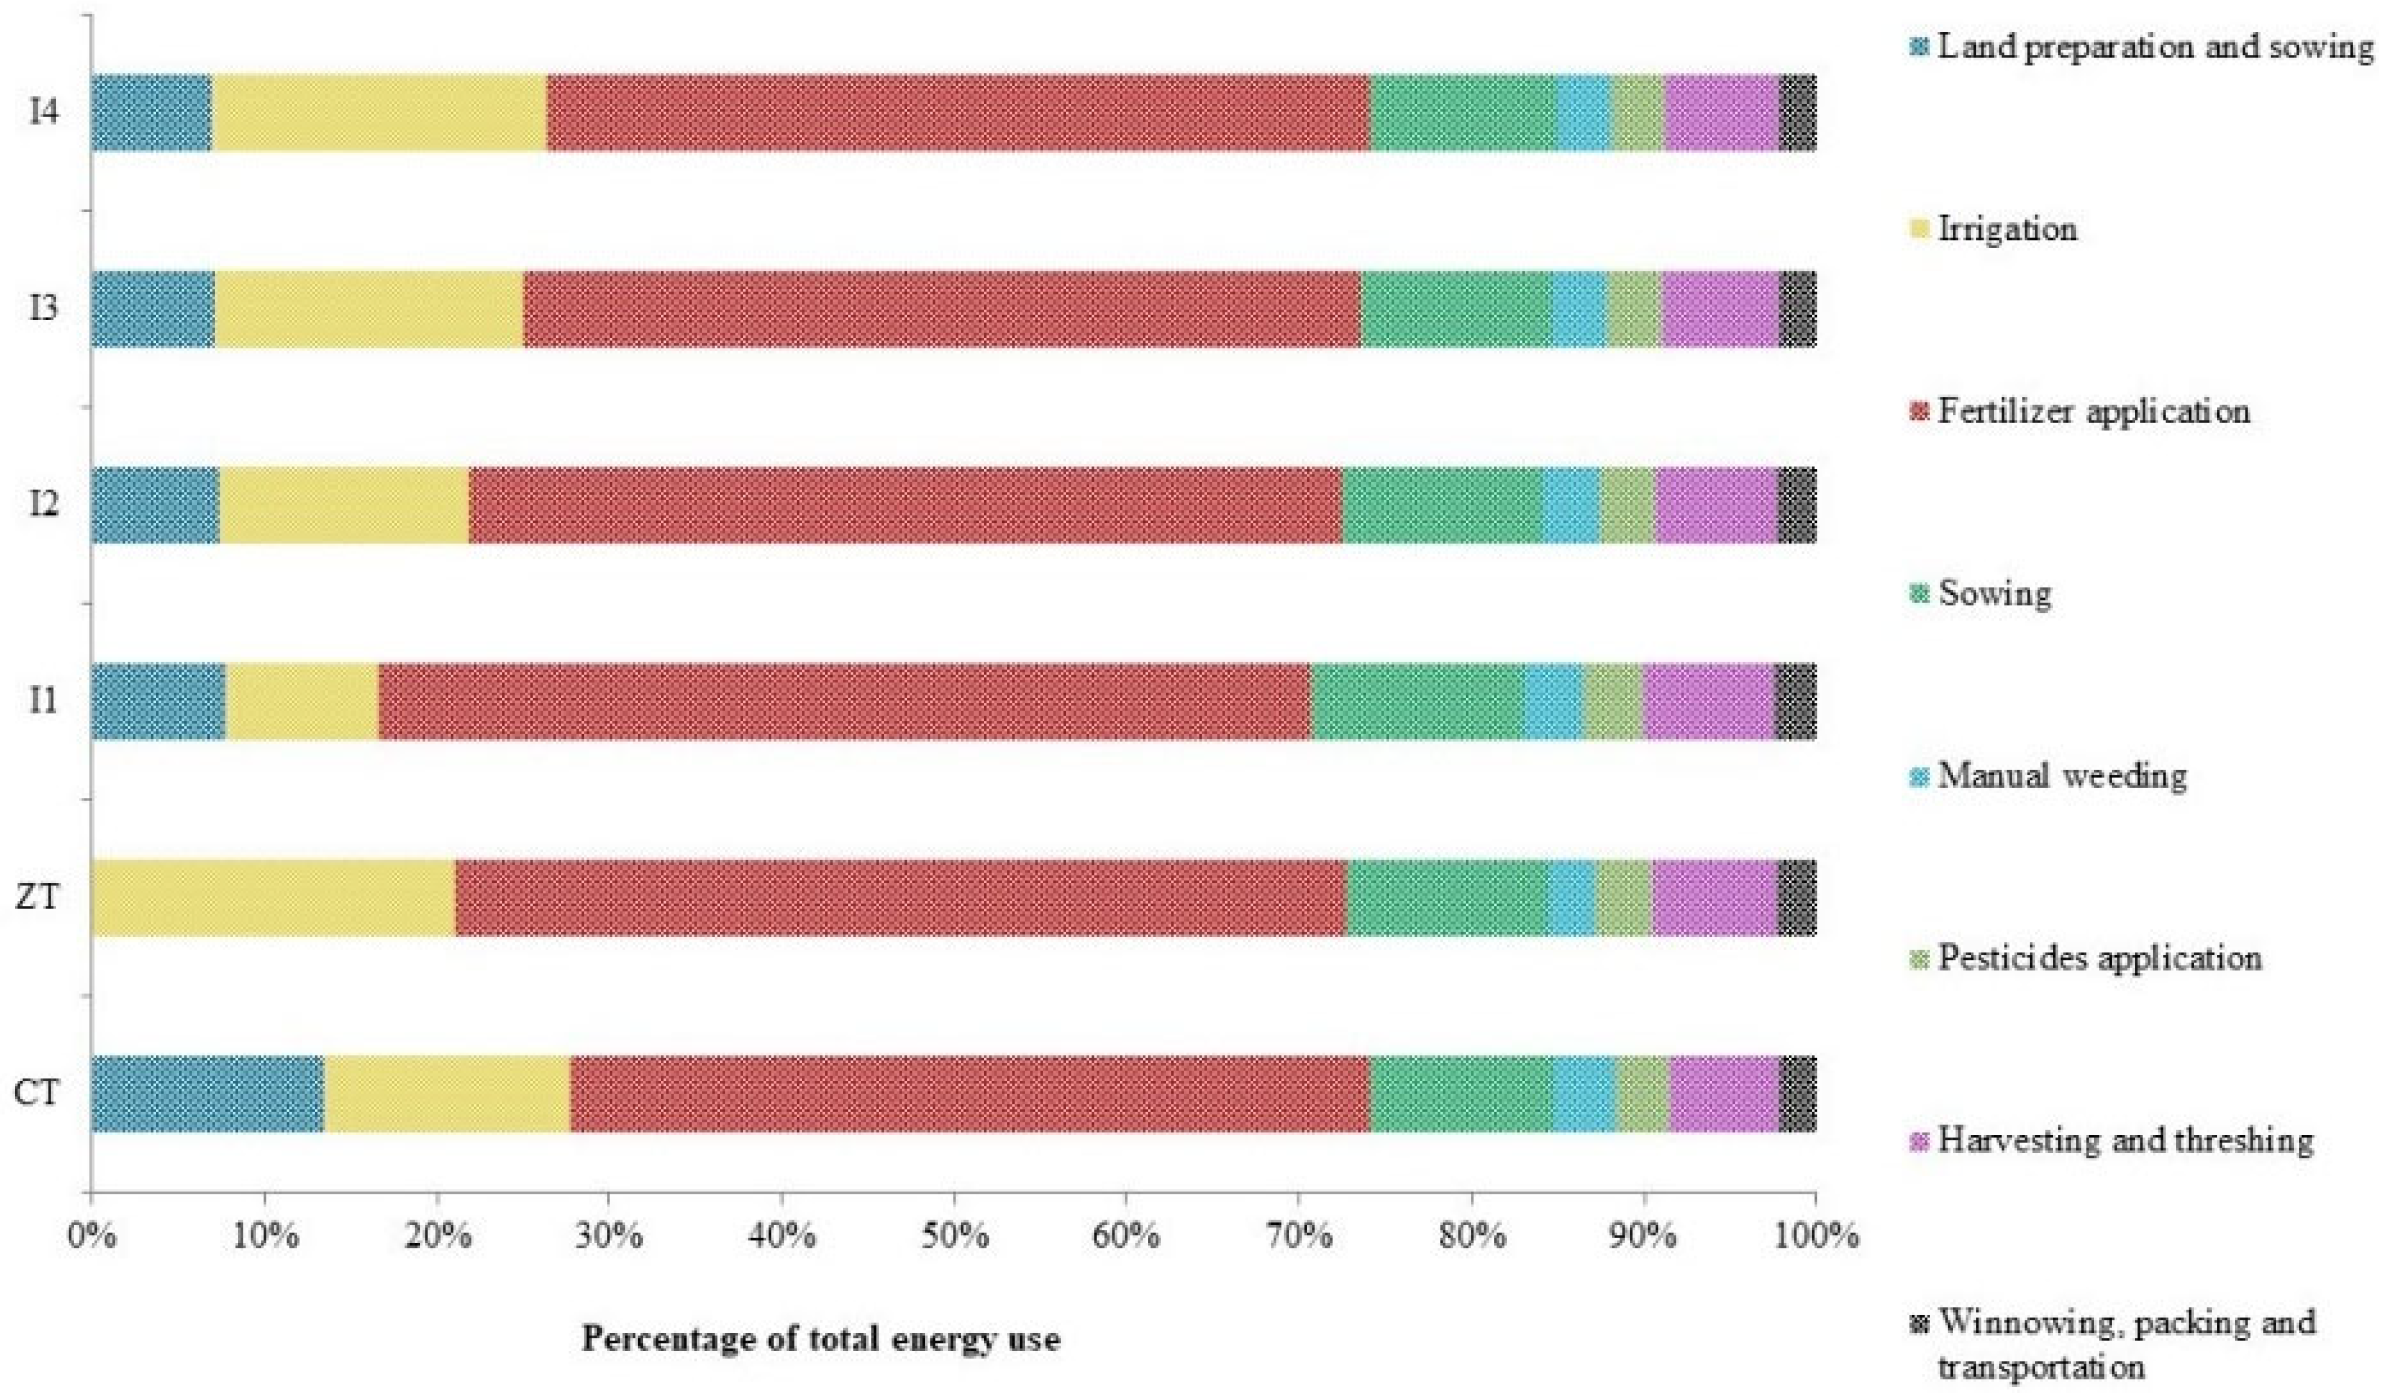
3.2. Energy Consumption Pattern and Indices
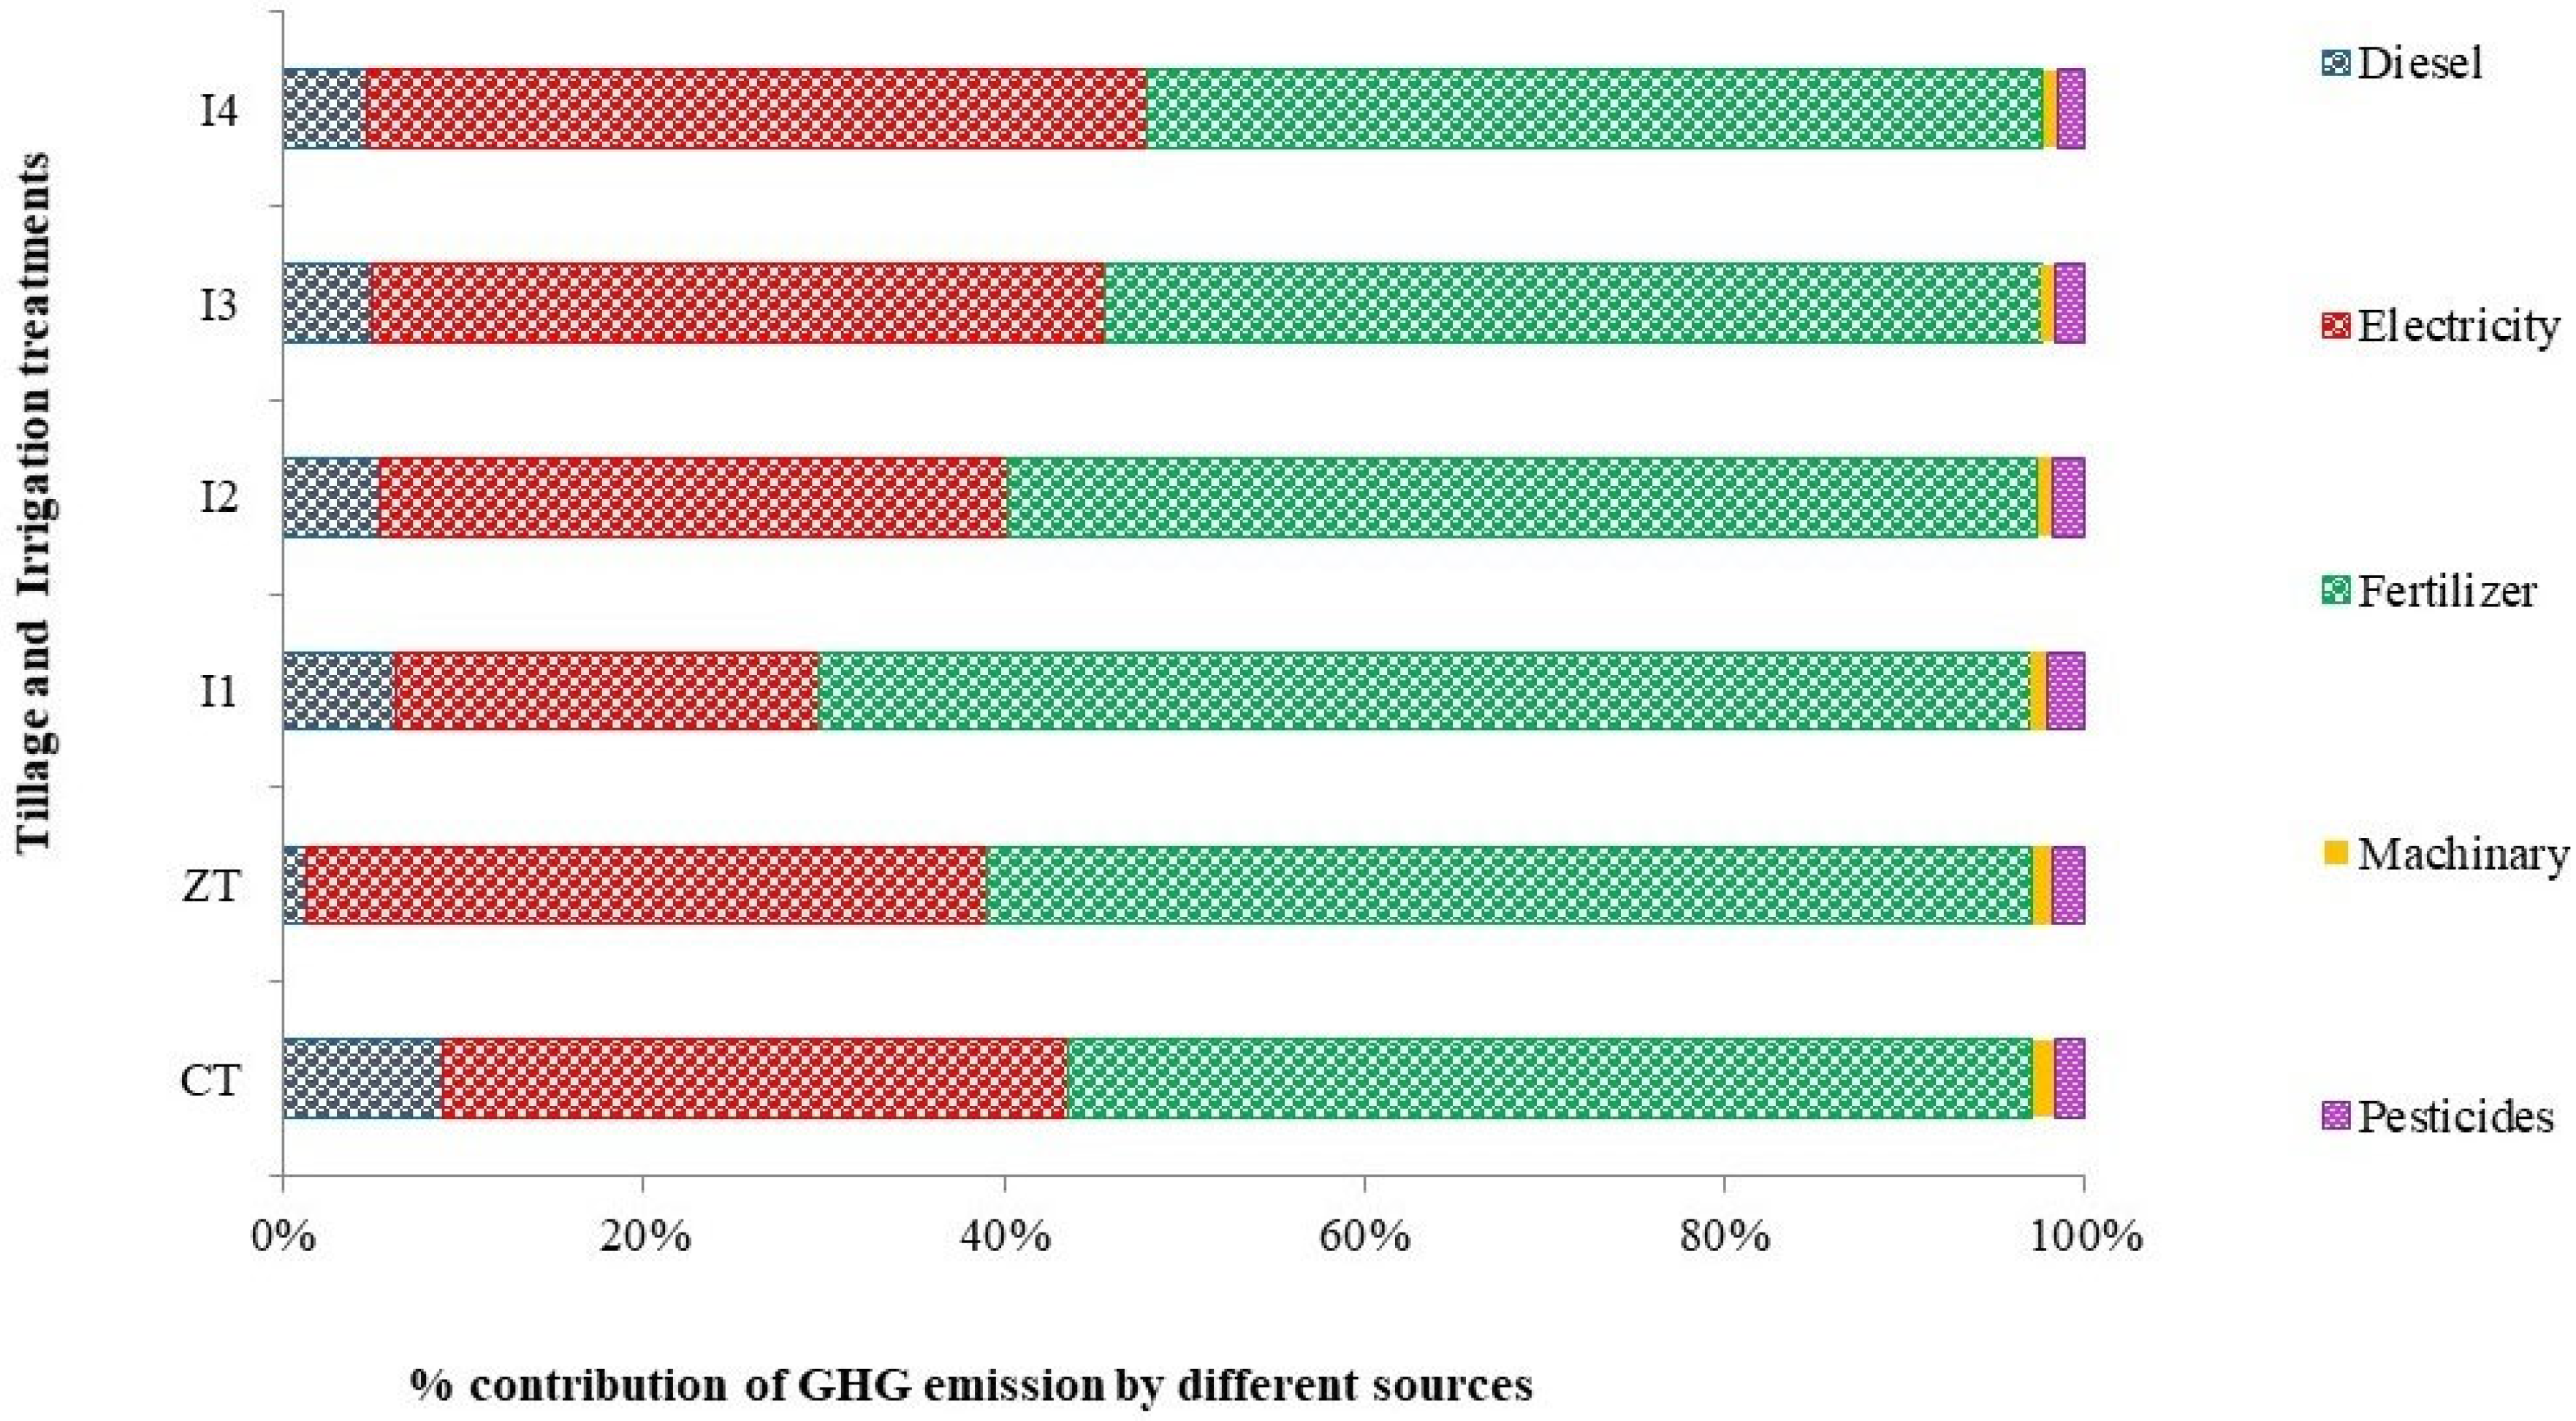
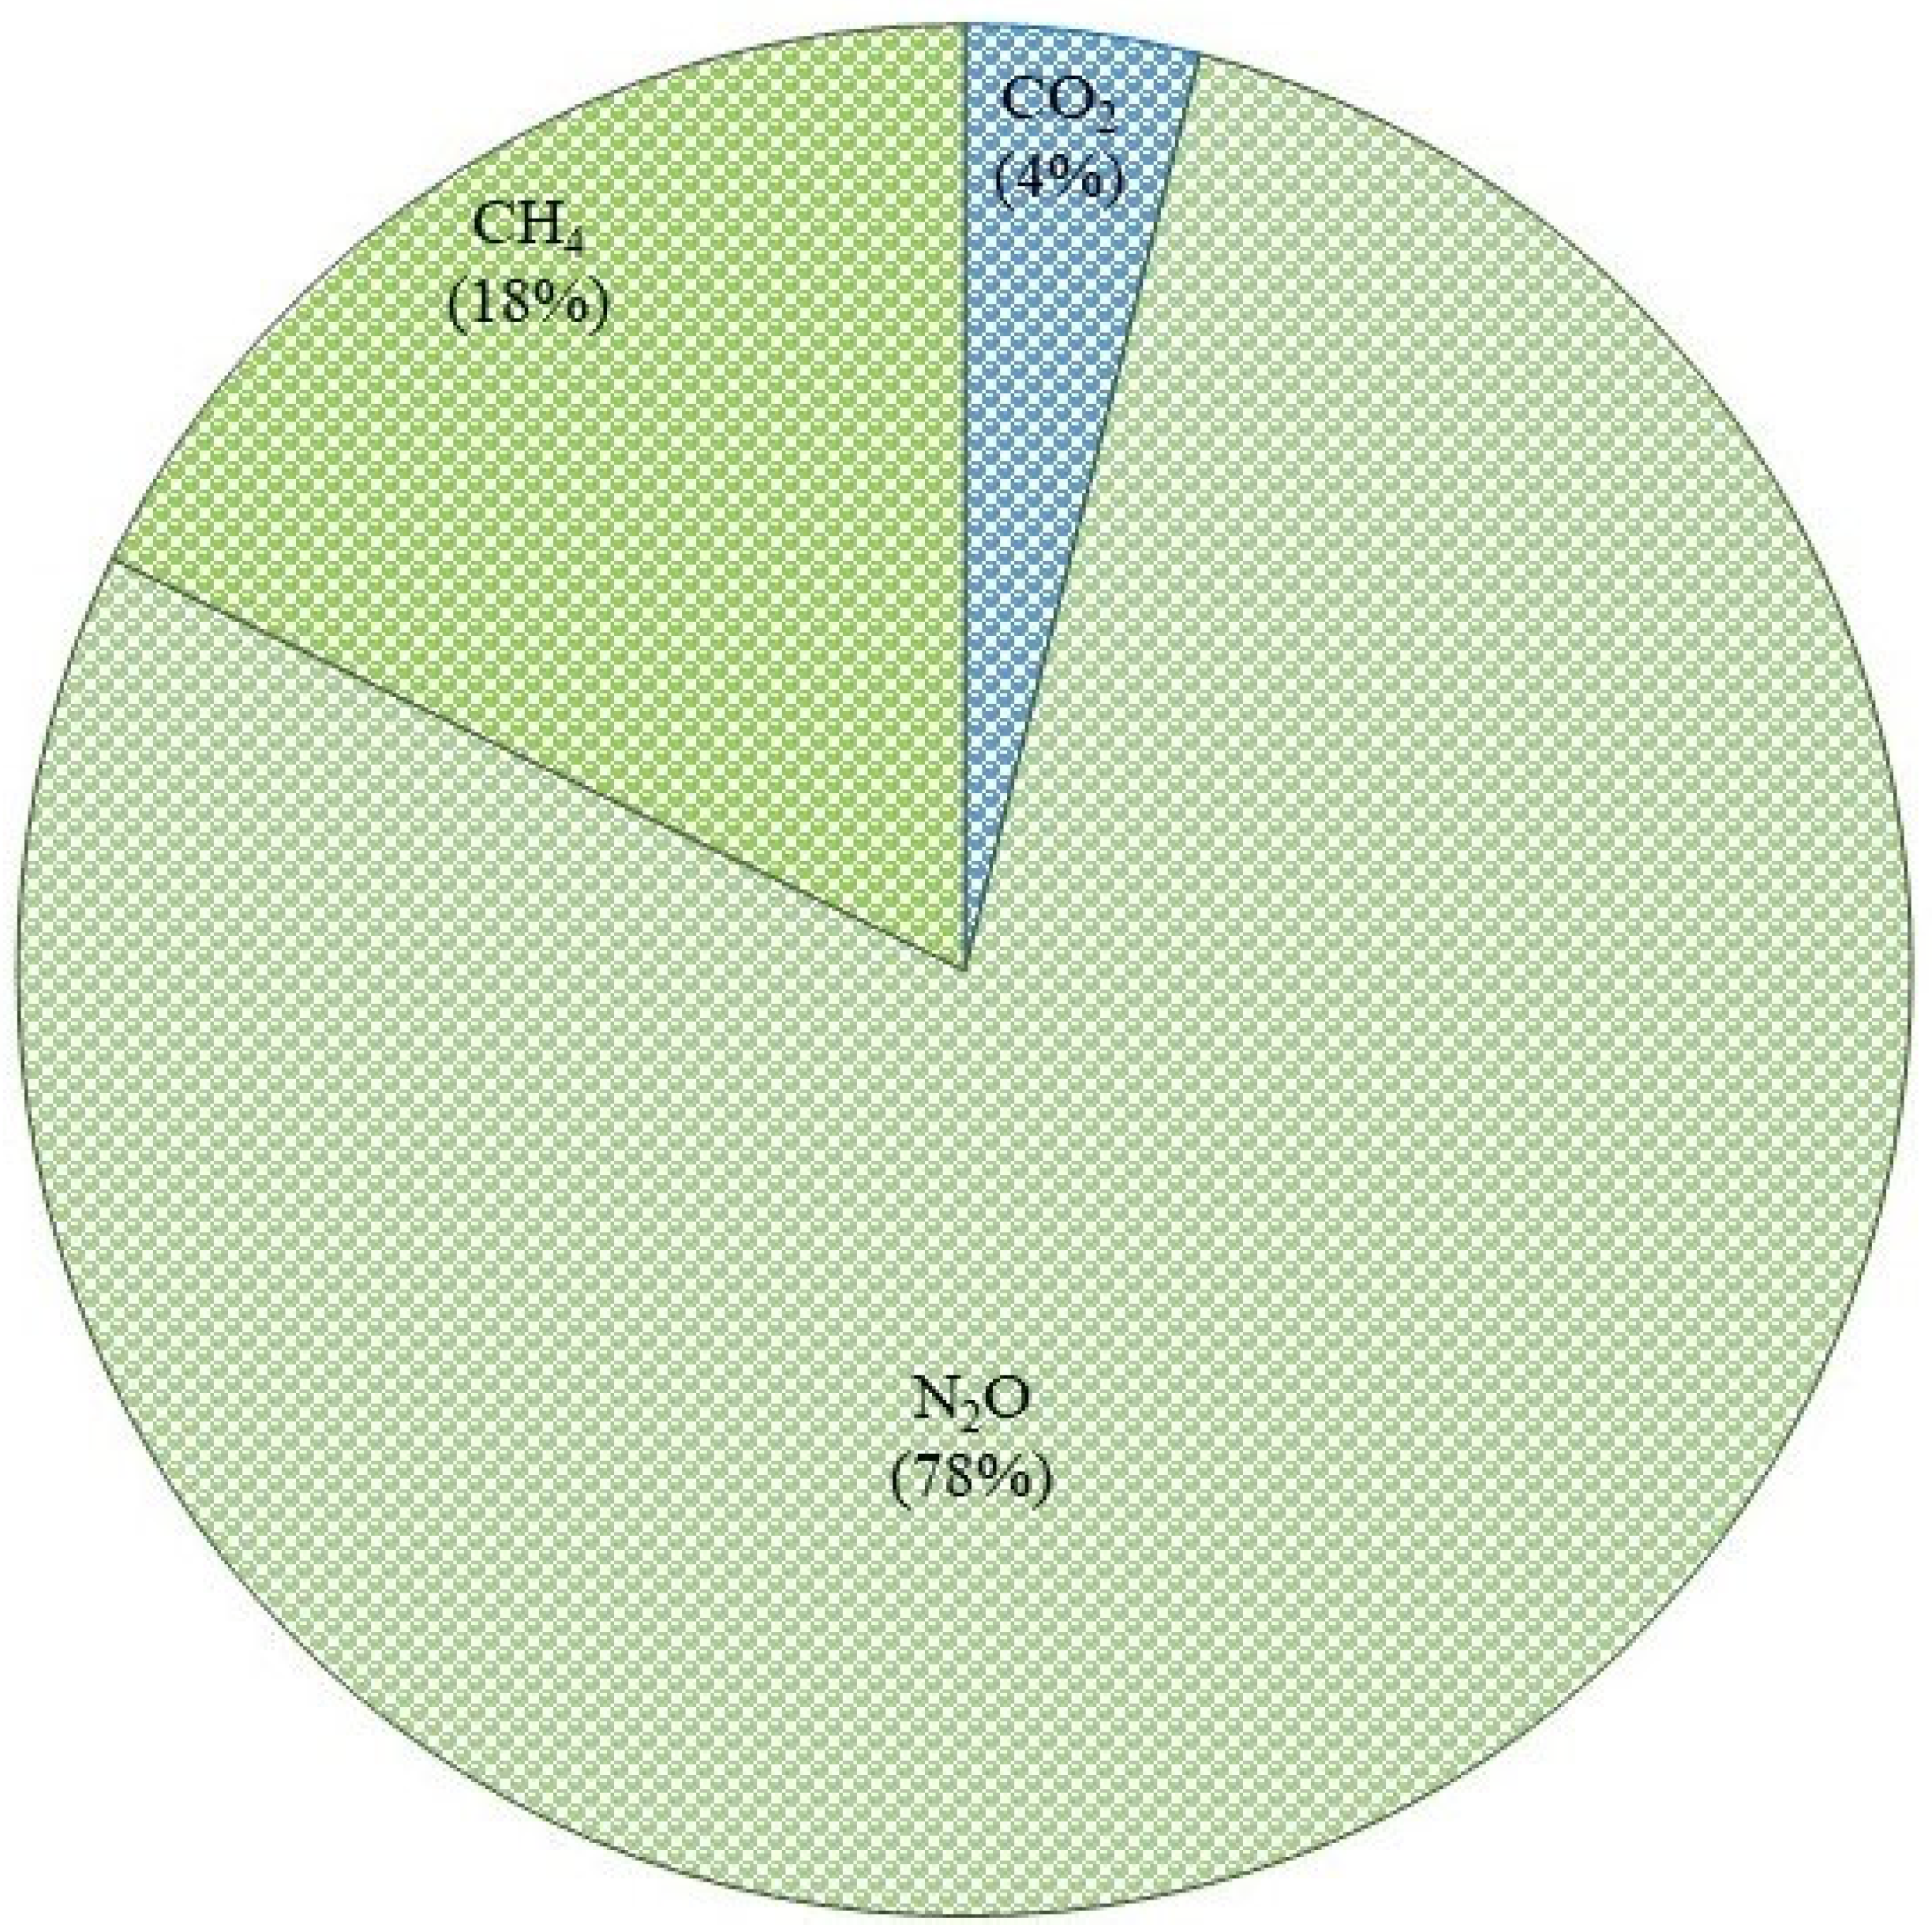
3.3. Greenhouse Gasses (GHGs) Emission and Carbon Budgeting
4. Discussion
4.1. Energy Dynamics
4.2. GHGs Emissions and Carbon Sustainability
5. Conclusions
Author Contributions
Funding
Institutional Review Board Statement
Informed Consent Statement
Data Availability Statement
Acknowledgments
Conflicts of Interest
References
- Yusuf, A.M.; Abubakar, A.B.; Mamman, S.O. Relationship between greenhouse gas emission, energy consumption, and economic growth: Evidence from some selected oil-producing African countries. Environ. Sci. Pollut. Res. 2020, 27, 15815–15823. [Google Scholar] [CrossRef] [PubMed] [Green Version]
- Pratibha, G.; Srinivas, I.; Rao, K.V.; Raju, B.M.K.; Thyagaraj, C.R.; Korwar, G.R.; Venkateswarlu, B.; Shanker, A.K.; Choudhary, D.K.; Rao, K.S.; et al. Impact of conservation agriculture practices on energy use efficiency and global warming potential in rainfed pigeonpea-castor systems. Eur. J. Agron. 2015, 66, 30–40. [Google Scholar] [CrossRef]
- Kazemi, H.; Bourkheili, S.H.; Kamkar, B.; Soltani, A.; Gharanjic, K.; Nazari, N.M. Estimation of greenhouse gas (GHG) emission and energy use efficiency (EUE) analysis in rainfed canola production (case study: Golestan province, Iran). Energy 2016, 116, 694–700. [Google Scholar] [CrossRef]
- Feng, J.; Li, F.; Zhou, X.; Xu, C.; Ji, L.; Chen, Z.; Fang, F. Impact of agronomy practices on the effects of reduced tillage systems on CH4 and N2O emissions from agricultural fields: A global metaanalysis. PLoS ONE 2018, 13, e0196703. [Google Scholar] [CrossRef] [Green Version]
- Jat, H.S.; Datta, A.; Choudhary, M.; Sharma, P.C.; Jat, M.L. Conservation Agriculture: Factors and drivers of adoption and scalable innovative practices in Indo-Gangetic plains of India—A review. Int. J. Agric. Sustain. 2020, 19, 40–55. [Google Scholar] [CrossRef]
- Choudhary, M.; Rana, K.S.; Bana, R.S.; Ghasal, P.C.; Choudhary, G.L.; Jakhar, P.; Verma, R.K. Energy budgeting and carbon footprint of pearl millet-mustard cropping system under conventional and conservation agriculture in rainfed semi-arid agro-ecosystem. Energy 2017, 141, 1052–1058. [Google Scholar] [CrossRef]
- Nawaz, A.; Farooq, M.; Nadeem, F.; Siddique, K.H.; Lal, R. Rice-wheat cropping systems in South Asia: Issues, options and opportunities. Crop Pasture Sci. 2019, 70, 395–427. [Google Scholar] [CrossRef]
- Bhattacharyya, R.; Pandey, S.C.; Bisht, J.K.; Bhatt, J.C.; Gupta, H.S.; Tuti, M.D.; Mahanta, D.; Mina, B.L.; Singh, R.D.; Chandra, S.; et al. Tillage and irrigation effects on soil aggregation and carbon pools in the Indian sub-Himalayas. Agron. J. 2013, 105, 101–112. [Google Scholar] [CrossRef]
- Panday, S.C.; Choudhary, M.; Singh, S.; Meena, V.S.; Mahanta, D.; Yadav, R.P.; Pattanayak, A.; Bisht, J.K. Increasing farmer’s income and water use efficiency as affected by long-term fertilization under a rainfed and supplementary irrigation in a soybean-wheat cropping system of Indian mid-Himalaya. Field Crops Res. 2018, 219, 214–221. [Google Scholar] [CrossRef]
- Choudhary, M.; Panday, S.C.; Meena, V.S.; Singh, S.; Yadav, R.P.; Pattanayak, A.; Mahanta, D.; Bisht, J.K.; Stanley, J. Long-term tillage and irrigation management practices: Strategies to enhance crop and water productivity under rice-wheat rotation of Indian mid-Himalayan Region. Agric. Water Manag. 2020, 232, 106067. [Google Scholar] [CrossRef]
- Gupta, M.; Bali, A.S.; Sharma, S.; Dixit, A.K. Potential role and influence of zero tillage technology on energy saving in rice (Oryza sativa)-wheat (Triticum aestivum) system. Indian J. Agric. Sci. 2007, 77, 657–659. [Google Scholar]
- Arunrat, N.; Pumijumnong, N. Practices for reducing greenhouse gas emissions from rice production in Northeast Thailand. Agriculture 2017, 7, 4. [Google Scholar] [CrossRef] [Green Version]
- Panday, S.C.; Singh, R.D.; Sahai, S.; Singh, K.P.; Prakash, V.; Kumar, A.; Kumar, M.; Srivastava, A.K. Effect of tillage and irrigation on yield, profitability, water productivity and soil health in rice (Oryza sativa)-wheat (Triticum aestivum) cropping system in north-west Himalayas. Indian J. Agric. Sci. 2008, 78, 1018–1022. [Google Scholar]
- Yadav, R.P.; Panday, S.C.; Kumar, J.; Bisht, J.K.; Meena, V.S.; Choudhary, M.; Shyam Nath Parihar, M.; Meena, R.P. Climatic Variation and Its Impacts on Yield and Water Requirement of Crops in Indian Central Himalaya. In Climatic Variation and Its Impacts on Yield and Water Requirement of Crops in Indian Central; InTechOpen: London, UK, 2020. [Google Scholar] [CrossRef]
- Lal, R. Carbon emission from farm operations. Environ. Int. 2004, 30, 981–990. [Google Scholar] [CrossRef]
- West, T.O.; Marland, G. A synthesis of carbon sequestration, carbon emissions, and net carbon flux in agriculture: Comparing tillage practices in the United States. Agric. Ecosyst. Environ. 2002, 91, 217–232. [Google Scholar] [CrossRef]
- Devasenapathy, P.; Senthilkumar, G.; Shanmugam, P.M. Energy management in crop production. Indian J. Agron. 2009, 54, 80–90. [Google Scholar]
- Rahman, S.; Rahman, S. Energy productivity and efficiency of maize accounting for the choice of growing season and environmental factors: An empirical analysis from Bangladesh. Energy 2013, 49, 339–346. [Google Scholar] [CrossRef] [Green Version]
- Yadav, S.N.; Chandra, R.; Khura, T.K.; Chauhan, N.S. Energy input-output analysis and mechanization status for cultivation of rice and maize crops in Sikkim. Agric. Eng. Int. CIGR J. 2013, 15, 108–116. [Google Scholar]
- Mobtaker, H.G.; Keyhani, A.; Mohammadi, A.; Rafiee, S.H.; Akram, A. Sensitivity analysis of energy inputs for barley production in Hamedan Province of Iran. Agric. Ecosyst. Environ. 2010, 137, 367–372. [Google Scholar] [CrossRef]
- Gündoğmuş, E. Energy use on organic farming: A comparative analysis on organic versus conventional apricot production on small holdings in Turkey. Energy Conv. Manag. 2006, 47, 3351–3359. [Google Scholar] [CrossRef]
- Gathala, M.; Kumar, V.; Sharma, P.C.; Saharawat, Y.; Jat, H.S.; Singh, M.; Kumar, A.; Jat, M.L.; Humphreys, E.; Sharma, D.K.; et al. Optimizing intensive cereal-based cropping systems addressing current and future drivers of agricultural change in the northwestern Indo-Gangetic Plains of India. Agric. Ecosyst. Environ. 2013, 177, 85–97. [Google Scholar] [CrossRef]
- IPCC. IPCC Guidelines for National Greenhouse Gas Inventories, National Greenhouse Gas Inventories Programme; IGES: Kanagawa, Japan, 2006. [Google Scholar]
- IPCC. Climate Change 2014: Synthesis Report. Contribution of Working Groups I, II and III to the Fifth Assessment Report of the Intergovernmental Panel on Climate Change; Pachauri, R.K., Meyer, L.A., Eds.; IPCC: Geneva, Switzerland, 2014; 151p. [Google Scholar]
- Zhang, Z.S.; Guo, L.J.; Liu, T.Q.; Li, C.F.; Cao, C.G. Effects of tillage practices and straw returning methods on greenhouse gas emissions and net ecosystem economic budget in rice—Wheat cropping systems in central China. Atmos. Environ. 2015, 122, 636–644. [Google Scholar] [CrossRef]
- Soltani, A.; Rajabi, M.H.; Zeinali, E.; Soltani, E. Energy inputs and greenhouse gases emissions in wheat production in Gorgan, Iran. Energy 2013, 50, 54–61. [Google Scholar] [CrossRef]
- US-EIA. Fuel Emission Factors. 2011. Available online: www.eia.gov/oiaf/1605/emission_factors.html (accessed on 21 March 2022).
- Pishgar-Komleh, S.H.; Omid, M.; Heidari, M.D. On the study of energy use and GHG (greenhouse gas) emissions in greenhouse cucumber production in Yazd province. Energy 2013, 59, 63–71. [Google Scholar] [CrossRef]
- EPA. 2011. Available online: https://www.epa.gov/sites/default/files/2015-07/documents/emission-factors_2014.pdf (accessed on 21 March 2022).
- Tirol-Padre, A.; Rai, M.; Kumar, V.; Gathala, M.; Sharma, P.C.; Sharma, S.; Nagar, R.K.; Deshwal, S.; Singh, L.K.; Jat, H.S.; et al. Quantifying changes to the global warming potential of rice wheat systems with the adoption of conservation agriculture in northwestern India. Agric. Ecosyst. Environ. 2016, 21, 125–137. [Google Scholar] [CrossRef]
- Yan, X.; Ohara, T.; Akimoto, H. Development of region specific emission factors and estimation of methane emission from rice fields in the East, Southeast and South Asian countries. Glob. Change Biol. 2003, 9, 237–254. [Google Scholar] [CrossRef]
- Gomez, K.A.; Gomez, A.A. Statistical Procedures for Agricultural Research; John Wiley & Sons: New Delhi, India, 1984. [Google Scholar]
- Stanley, J.; Subbanna, A.R.N.S.; Gupta, J.P.; Mishra, K.K.; Pattanayak, A. Integrated management of Whitegrubs in Uttrakhand Himalayas. In Proceedings of National Agronomy Congress on “Redesigning Agronomy for Nature Conservation and Economic Empowerment”, GBPUA & T, Pantnagar, India, 20–22 February 2018; p. 662; Dhyani, V.C., Pramanick, B., Kesarwani, A., Chutarvedi, S., Singh, G., Pandey, D.S., Kewalanand Shukla, A., Chandra, S., Mahapatra, B.S., Eds.; Pantnagar Agronomy Society under the Aegis of Departmant of Agronomy GBPUA&T: Pantnagar, India, 2018; pp. 571–573. [Google Scholar]
- Gathala, M.K.; Timsina, J.; Saiful, I.M.; Krupnik, T.J.; Bose, T.R.; Islam, N.; Rahman, M.; Hossain, I.; Harun-Ar-Rashid Ghosh, A.K.; Hasan, M.K.; et al. Productivity, profitability, and energetics: A multi-criteria assessment of farmers’ tillage and crop establishment options for maize in intensively cultivated environments of South Asia. Field Crops Res. 2016, 186, 32–46. [Google Scholar] [CrossRef]
- Jat, M.L.; Gathala, M.K.; Ladha, J.K.; Saharawat, Y.S.; Jat, A.S.; Kumar, V.; Sharma, S.K.; Kumar, V.; Gupta, R. Evaluation of precision land leveling and double zero-till systems in the rice-wheat rotation: Water use, productivity, profitability and soil physical properties. Soil Tillage Res. 2009, 105, 112–121. [Google Scholar] [CrossRef]
- AghaAlikhani, M.; Kazemi, H.; Habibzadeh, F. Energy use pattern in rice production: A case study from Mazandaran province. Energy Convers. Manag. 2013, 69, 157–163. [Google Scholar] [CrossRef]
- Jat, H.S.; Jat, R.D.; Nanwal, R.K.; Lohan, S.K.; Yadav, A.K.; Poonia, T.; Sharma, P.C.; Jat, M.L. Energy use efficiency of crop residue management for sustainable energy and agriculture conservation in NW India. Renew. Energy 2020, 155, 1372–1382. [Google Scholar] [CrossRef]
- Alimagham, S.M.; Soltani, A.; Zeinali, E.; Kazemi, H. Energy flow analysis and estimation of greenhouse gases (GHG) emissions in different scenarios of soybean production (Case study: Gorgan region, Iran). J. Clean. Prod. 2017, 149, 621–628. [Google Scholar] [CrossRef]
- Tuti, M.D.; Prakash, V.; Pandey, B.M.; Bhattacharyya, R.; Mahanta, D.; Bisht, J.K. Energy budgeting of colocasia-based cropping systems in the Indian sub-Himalayas. Energy 2012, 45, 986–993. [Google Scholar] [CrossRef]
- Chaudhary, V.P.; Singh, K.K.; Pratibh, G.; Bhattacharyya, R.; Shamim, M.; Srinivas, I.; Patel, A. Energy conservation and greenhouse gas mitigation under different production systems in rice cultivation. Energy 2017, 130, 307–317. [Google Scholar] [CrossRef]
- Lal, B.; Gautam, P.; Nayak, A.K.; Panda, B.B.; Bihari, P.; Tripathi, R. Energy and carbon budgeting of tillage for environmentally clean and resilient soil health of rice-maize cropping system. J. Clean. Prod. 2019, 226, 815–830. [Google Scholar] [CrossRef]


| Treatment | Treatment Description |
|---|---|
| Tillage management (Scenario—I) | |
| CT | Conventional tillage |
| ZT | Zero tillage |
| Irrigation management (Scenario—II) | |
| I-1 | Pre-sowing (PS) irrigation |
| I-2 | Pre-sowing (PS) irrigation + active tillering (AT)/crown root initiation (CRI) stage |
| I-3 | Pre-sowing (PS) irrigation + active tillering (AT)/crown root initiation (CRI) stage + panicle initiation (PI)/flowering (FL), stage |
| I-4 | Pre-sowing (PS) irrigation + active tillering (AT)/crown root initiation (CRI) stage + panicle initiation (PI)/flowering (FL), stage + grain filling (GF) stage |
| Cropping system and experimental details | |
| Experimentation period | 2001 to 2016 |
| Cropping system | Rice (Oryza sativa L.)—Wheat (Triticum aestivum L.) |
| Experimental design | Split plot design |
| Crop varieties used | Rice (VL Dhan 82) Wheat (VL Wheat 804) |
| Replication | 4 |
| Sowing time | Rice (First to second week of June) Wheat (Last of week of October to first week of November) |
| Fertilizer applied (N-P2O5-K2O kg ha−1) | For both crops (100–60–40) |
| Fertilizer type | Nitrogen (urea) = 46% N Nitrogen and Phosphorous (diammonium phosphate) = 18% Nitrogen and 46% Phosphorus (P2O5) Potassium (muriate of potash) = 60% K2O |
| Irrigation application rate | 50 mm per irrigation |
| Harvesting time | Rice (Last week of October) Wheat (Last week of April/May) |
| Treatments † | Total Biomass Yield (kg ha−1) | ||
|---|---|---|---|
| Rice | Wheat | Rice–Wheat System | |
| Tillage | |||
| CT | 6352 ± 444 a | 9470 ± 611 a | 15,822 ± 840 a |
| ZT | 6143 ± 509 a | 9299 ± 698 a | 15,442 ± 699 a |
| Irrigation | |||
| I-1 | 5579 ± 504 c | 7684 ± 387 c | 13,264 ± 540 d |
| I-2 | 6098 ± 332 bc | 9191 ± 835 b | 15,288 ± 705 c |
| I-3 | 6416 ± 652 ab | 9943 ± 829 ab | 16,359 ± 942 b |
| I-4 | 6896 ± 417 a | 10,721 ± 574 a | 17,618 ± 891 a |
| Treatments † | Land Preparation | Irrigation | Fertilizer Application | Seed and Sowing | Manual Weeding | Pesticides Application | Harvesting and Threshing | Winnowing, Packing and Transportation | Total Input Energy |
|---|---|---|---|---|---|---|---|---|---|
| Tillage | |||||||||
| CT | 4080 (13.4) a | 4325 (14.2) | 14,114 (46.5) | 3228 (10.6) | 1098 (3.60) | 919 (3.62) | 1974 (6.50) | 628 (2.07) | 30,366 |
| ZT | 0 | 4325 (16.7) | 14,114 (54.5) | 3228 (12.5) | 706 (2.61) | 919 (3.55) | 1974 (7.62) | 628 (2.43) | 25,894 |
| Irrigation | |||||||||
| I-1 | 2040 (7.81) | 2306 (8.83) | 14,114 (54.1) | 3228 (12.4) | 902 (3.52) | 919 (3.52) | 1974 (7.56) | 628 (2.41) | 26,111 |
| I-2 | 2040 (7.33) | 4037 (14.5) | 14,114 (50.7) | 3228 (11.6) | 902 (3.24) | 919 (3.30) | 1974 (7.09) | 628 (2.26) | 27,842 |
| I-3 | 2040 (7.04) | 5190 (17.9) | 14,114 (48.7) | 3228 (11.1) | 902 (3.11) | 919 (3.17) | 1974 (6.81) | 628 (2.17) | 28,995 |
| I-4 | 2040 (6.90) | 5766 (19.5) | 14,114 (47.7) | 3228 (10.9) | 902 (3.13) | 919 (3.11) | 1974 (6.68) | 628 (2.12) | 29,571 |
| Treatments † | Energy Input (MJ ha−1) | Energy Output (MJ ha−1) | Energy Use Efficiency | Specific Energy (MJ kg−1) | Energy Productivity (kg MJ−1) | Net Energy Return (MJ ha−1) | Energy Profitability |
|---|---|---|---|---|---|---|---|
| Tillage | |||||||
| CT | 30,366 | 214,603 ± 10,454 a | 7.05 ± 0.34 b | 1.93 ± 0.01 a | 0.19 ± 0.004 b | 184,237 ± 10,454 a | 6.06 ± 0.35 b |
| ZT | 25,894 | 209,728 ± 8895 a | 8.08 ± 0.36 a | 1.69 ± 0.08 b | 0.23 ± 0.006 a | 183,834 ± 8895 a | 7.07 ± 0.34 a |
| Irrigation | |||||||
| I-1 | 26,111 | 179,833 ± 6649 d | 6.92 ± 0.25 c | 1.68 ± 0.08 c | 0.19 ± 0.007 d | 153,722 ± 6649 d | 5.92 ± 0.25 c |
| I-2 | 27,842 | 207,321 ± 8967 c | 7.47 ± 0.32 b | 1.77 ± 0.08 bc | 0.21 ± 0.005 c | 179,479 ± 8967 c | 6.48 ± 0.32 b |
| I-3 | 28,995 | 222,151 ± 11,951 b | 7.68 ± 0.40 b | 1.83 ± 0.11 b | 0.22 ± 0.005 b | 193,157 ± 11,951 b | 6.70 ± 0.40 b |
| I-4 | 29,571 | 239,356 ± 11,130 a | 8.11 ± 0.39 a | 1.96 ± 0.09 a | 0.23 ± 0.004 a | 209,785 ± 11,130 a | 7.14 ± 0.39 a |
| Treatments | Diesel | Electricity | Fertilizer | Machinery | Pesticides | GHGs Emission | Total CO2 eq. Emissions | ||
|---|---|---|---|---|---|---|---|---|---|
| CO2 | N2O | CH4 | |||||||
| kg CO2 Equivalent ha−1 | |||||||||
| Tillage | |||||||||
| CT | 185 | 731 | 1122 | 27 | 34 | 2099 | 132 | 359 | 2590 |
| ZT | 24 | 731 | 1122 | 22 | 34 | 1933 | 132 | 359 | 2424 |
| Irrigation | |||||||||
| I-1 | 105 | 390 | 1122 | 15 | 34 | 1665 | 132 | 359 | 2156 |
| I-2 | 105 | 682 | 1122 | 16 | 34 | 1959 | 132 | 359 | 2450 |
| I-3 | 105 | 877 | 1122 | 17 | 34 | 2155 | 132 | 359 | 2646 |
| I-4 | 105 | 974 | 1122 | 17 | 34 | 2252 | 132 | 359 | 2743 |
Publisher’s Note: MDPI stays neutral with regard to jurisdictional claims in published maps and institutional affiliations. |
© 2022 by the authors. Licensee MDPI, Basel, Switzerland. This article is an open access article distributed under the terms and conditions of the Creative Commons Attribution (CC BY) license (https://creativecommons.org/licenses/by/4.0/).
Share and Cite
Choudhary, M.; Panday, S.C.; Meena, V.S.; Yadav, R.P.; Singh, S.; Parihar, M.; Mishra, P.K.; Bisht, J.K.; Pattanayak, A. Long-Term Tillage and Irrigation Management Practices: Impact on Carbon Budgeting and Energy Dynamics under Rice–Wheat Rotation of Indian Mid-Himalayan Region. Conservation 2022, 2, 388-401. https://doi.org/10.3390/conservation2020026
Choudhary M, Panday SC, Meena VS, Yadav RP, Singh S, Parihar M, Mishra PK, Bisht JK, Pattanayak A. Long-Term Tillage and Irrigation Management Practices: Impact on Carbon Budgeting and Energy Dynamics under Rice–Wheat Rotation of Indian Mid-Himalayan Region. Conservation. 2022; 2(2):388-401. https://doi.org/10.3390/conservation2020026
Chicago/Turabian StyleChoudhary, Mahipal, Suresh C. Panday, Vijay S. Meena, Ram P. Yadav, Sher Singh, Manoj Parihar, Pankaj K. Mishra, Jaideep K. Bisht, and Arunava Pattanayak. 2022. "Long-Term Tillage and Irrigation Management Practices: Impact on Carbon Budgeting and Energy Dynamics under Rice–Wheat Rotation of Indian Mid-Himalayan Region" Conservation 2, no. 2: 388-401. https://doi.org/10.3390/conservation2020026