Article

Environmental Fragility Zoning Using GIS and AHP Modeling: Perspectives for the Conservation of Natural Ecosystems in Brazil

by
Luciano Cavalcante de Jesus França
1,*,
Luis Filipe Lopes
2,
Marcelino Santos de Morais
3,
Gerson dos Santos Lisboa
4,
Samuel José Silva Soares da Rocha
5,
Vicente Toledo Machado de Morais Junior
6,
Reynaldo Campos Santana
7 and
Danielle Piuzana Mucida
3
1
Department of Engineering and Computing—DEC, Federal Institute of Minas Gerais (IFMG), Bambuí 38900-000, Brazil
2
Centre for Applied Ecology “Professor Baeta Neves” (CEABN), InBIO, School of Agriculture, University of Lisbon, 1349-017 Lisbon, Portugal
3
Department of Geography, Federal University of the Jequitinhonha and Mucuri Valleys (UFVJM), Diamantina 39100-000, Brazil
4
Faculty of Science and Technology, Federal University of Goiás, Goiânia 74968-755, Brazil
5
Department of Forest Science, Federal University of Lavras (UFLA), Lavras 37200-000, Brazil
6
Department of Forest Engineering, Federal University of Viçosa (UFV), Viçosa 36570-900, Brazil
7
Department of Forest Engineering, Federal University of the Jequitinhonha and Mucuri Valleys (UFVJM), Diamantina 39100-000, Brazil
*
Author to whom correspondence should be addressed.
Conservation 2022, 2(2), 349-366; https://doi.org/10.3390/conservation2020024
Submission received: 28 April 2022 / Revised: 19 May 2022 / Accepted: 2 June 2022 / Published: 7 June 2022

Abstract

:
The degradation of natural ecosystems triggers global environmental, economic, and social problems. To prevent this, it is necessary to identify the aptitude of priority areas for conservation or use by considering land fragility from multiple environmental and spatial perspectives. We applied the concept of environmental fragility to a hydrographic basin in southeastern Brazil that establishes (i) potential fragility levels according to slope, soil classes, geological domains, drainage hierarchy, and rainfall information using an algebraic map, and (ii) emerging fragility levels via the addition of the land-use parameters. The methodological approach involved the integration of the analytic hierarchy process (AHP) and weighted linear combination (WLC) into a geographic information system (GIS). The medium and slightly low fragility classes predominated in terms of potential (~60%), and emerging (~70%) environmental fragility models used to model the basin. The model indicated that high and extremely high potential fragilities were concentrated in the upper basin, a region that is considered a global biodiversity hotspot. The areas with high/extremely high classes of emerging fragility in the upper basin decreased, indicating that the natural cover classes and land-use types are not in danger. We also introduce acceptable conservation practices for land management and use according to the environmental fragility categories established in the present work. The methodology applied in this study can be replicated in other global ecoregions. It provides low-cost territorial and environmental zoning and flexible replication and can be adjusted by administrators who are interested in land-use planning.

1. Introduction

Disturbances to natural ecosystems, especially those that are anthropic, can introduce real threats to a habitat’s health and to the functioning of the global system [1,2]. Land degradation affects the well-being of 1.5 billion people worldwide [3,4]. This process, which is related to the long-term loss of ecosystem services and functions, is prejudicial to society and development.
Scientific investigations evaluating the environmental fragility of natural and anthropic landscapes are fundamental to local to global mitigation plans and to minimize the adverse impacts of these disturbances. However, few studies have focused on understanding the environmental fragility (EF) of natural and anthropized landscapes. Environmental fragility (EF) originates from a landscape’s ecodynamic units [5] and links the susceptibility of environments to soil erosion, sedimentation, and ground ruptures and, consequently, ecosystem degradation [6]. In this sense, natural ecosystems are in a dynamic balance concerning the exchange of energy and matter and can be altered by human intervention, which generates temporary or permanent imbalances [7].
Potential environmental fragility (PEF) enables the assessment of a geosystem’s natural dynamic balance. It only considers the landscape’s natural attributes (e.g., geological domains, soil, rainfall, slope, river hierarchies), and emergent environmental fragility (EEF) is the result of applying potential fragility and land-use cover [6]. Usually, studies consider qualitative parameter analysis and map algebra [8].
PEF and EEF models can be combined with multi-criteria approaches to improve their accuracy, an example of such a combination being the analytic hierarchy process (AHP) [9]. The model assigns weights to spatial data, ensuring greater consistency during analyses [10]. AHP allows different stakeholders to evaluate different criteria to determine relative importance based on weighted and paired comparisons [11]. Moreover, the methodological geographic information system (GIS) approach has established a set of powerful tools related to fragility and has served as a breakthrough to support public policymakers [7,12] in determining geohazards and creating prevention measures [13,14,15].
GIS-AHP integration results in geographic intelligence models for complex decision-making related to the environment [14]. We based this paper on the assumption that potential and emerging environmental fragilities affecting territorial unity could be identified in landscapes when analyzed by multi-criteria decision algorithms in GIS-AHP.
The contributions of this study are related to the proposal of a methodological framework that is applied to map fragile areas in Brazil. Due to a lack of scientific research, this research is fundamental to help solve problems related to the management and conservation of watersheds that are at risk of environmental degradation. We conducted the study on a sizeable hydrographic basin in the Espinhaço Range Biosphere Reserve (ERBR), Brazil, an important global biodiversity hotspot for species, endemism, and conservation priorities.
Therefore, the main contributions of this study are the proposition of landscape indicators and the introduction of methodological approaches that are focused on the environmental fragility model that has been applied to the hydrographic basin in the Jequitinhonha River in southeastern Brazil.

2. Materials and Methods

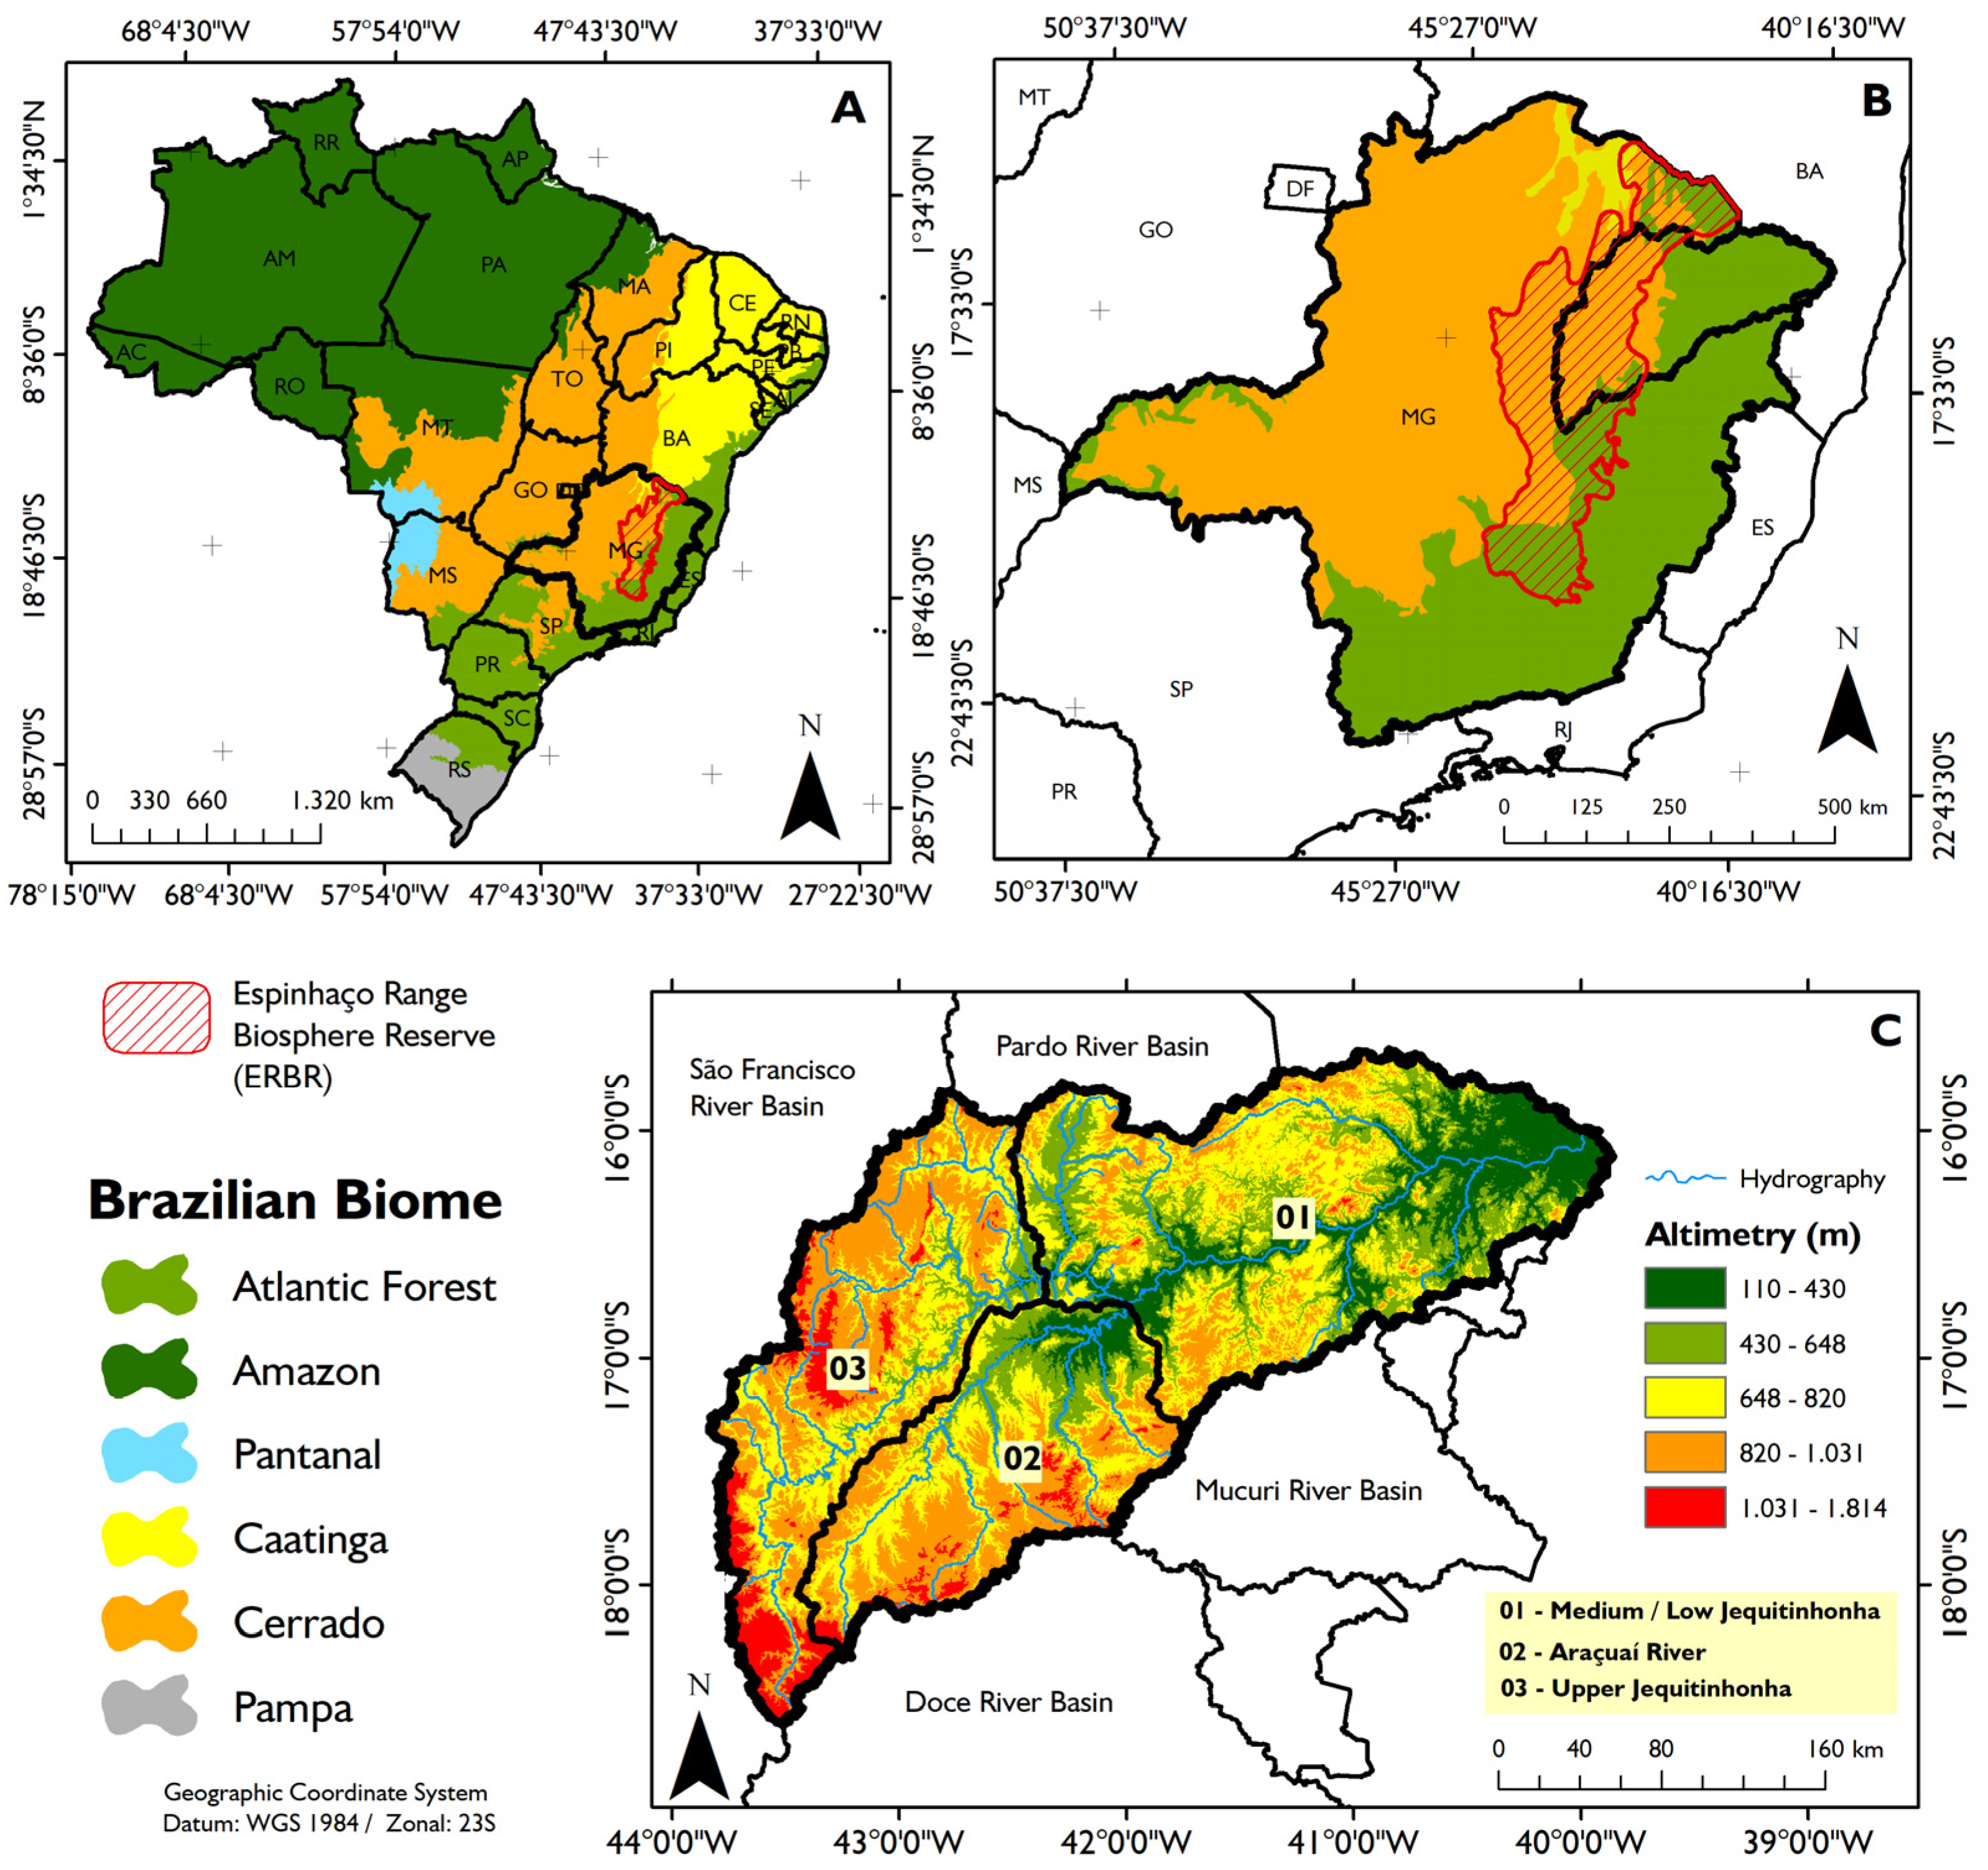
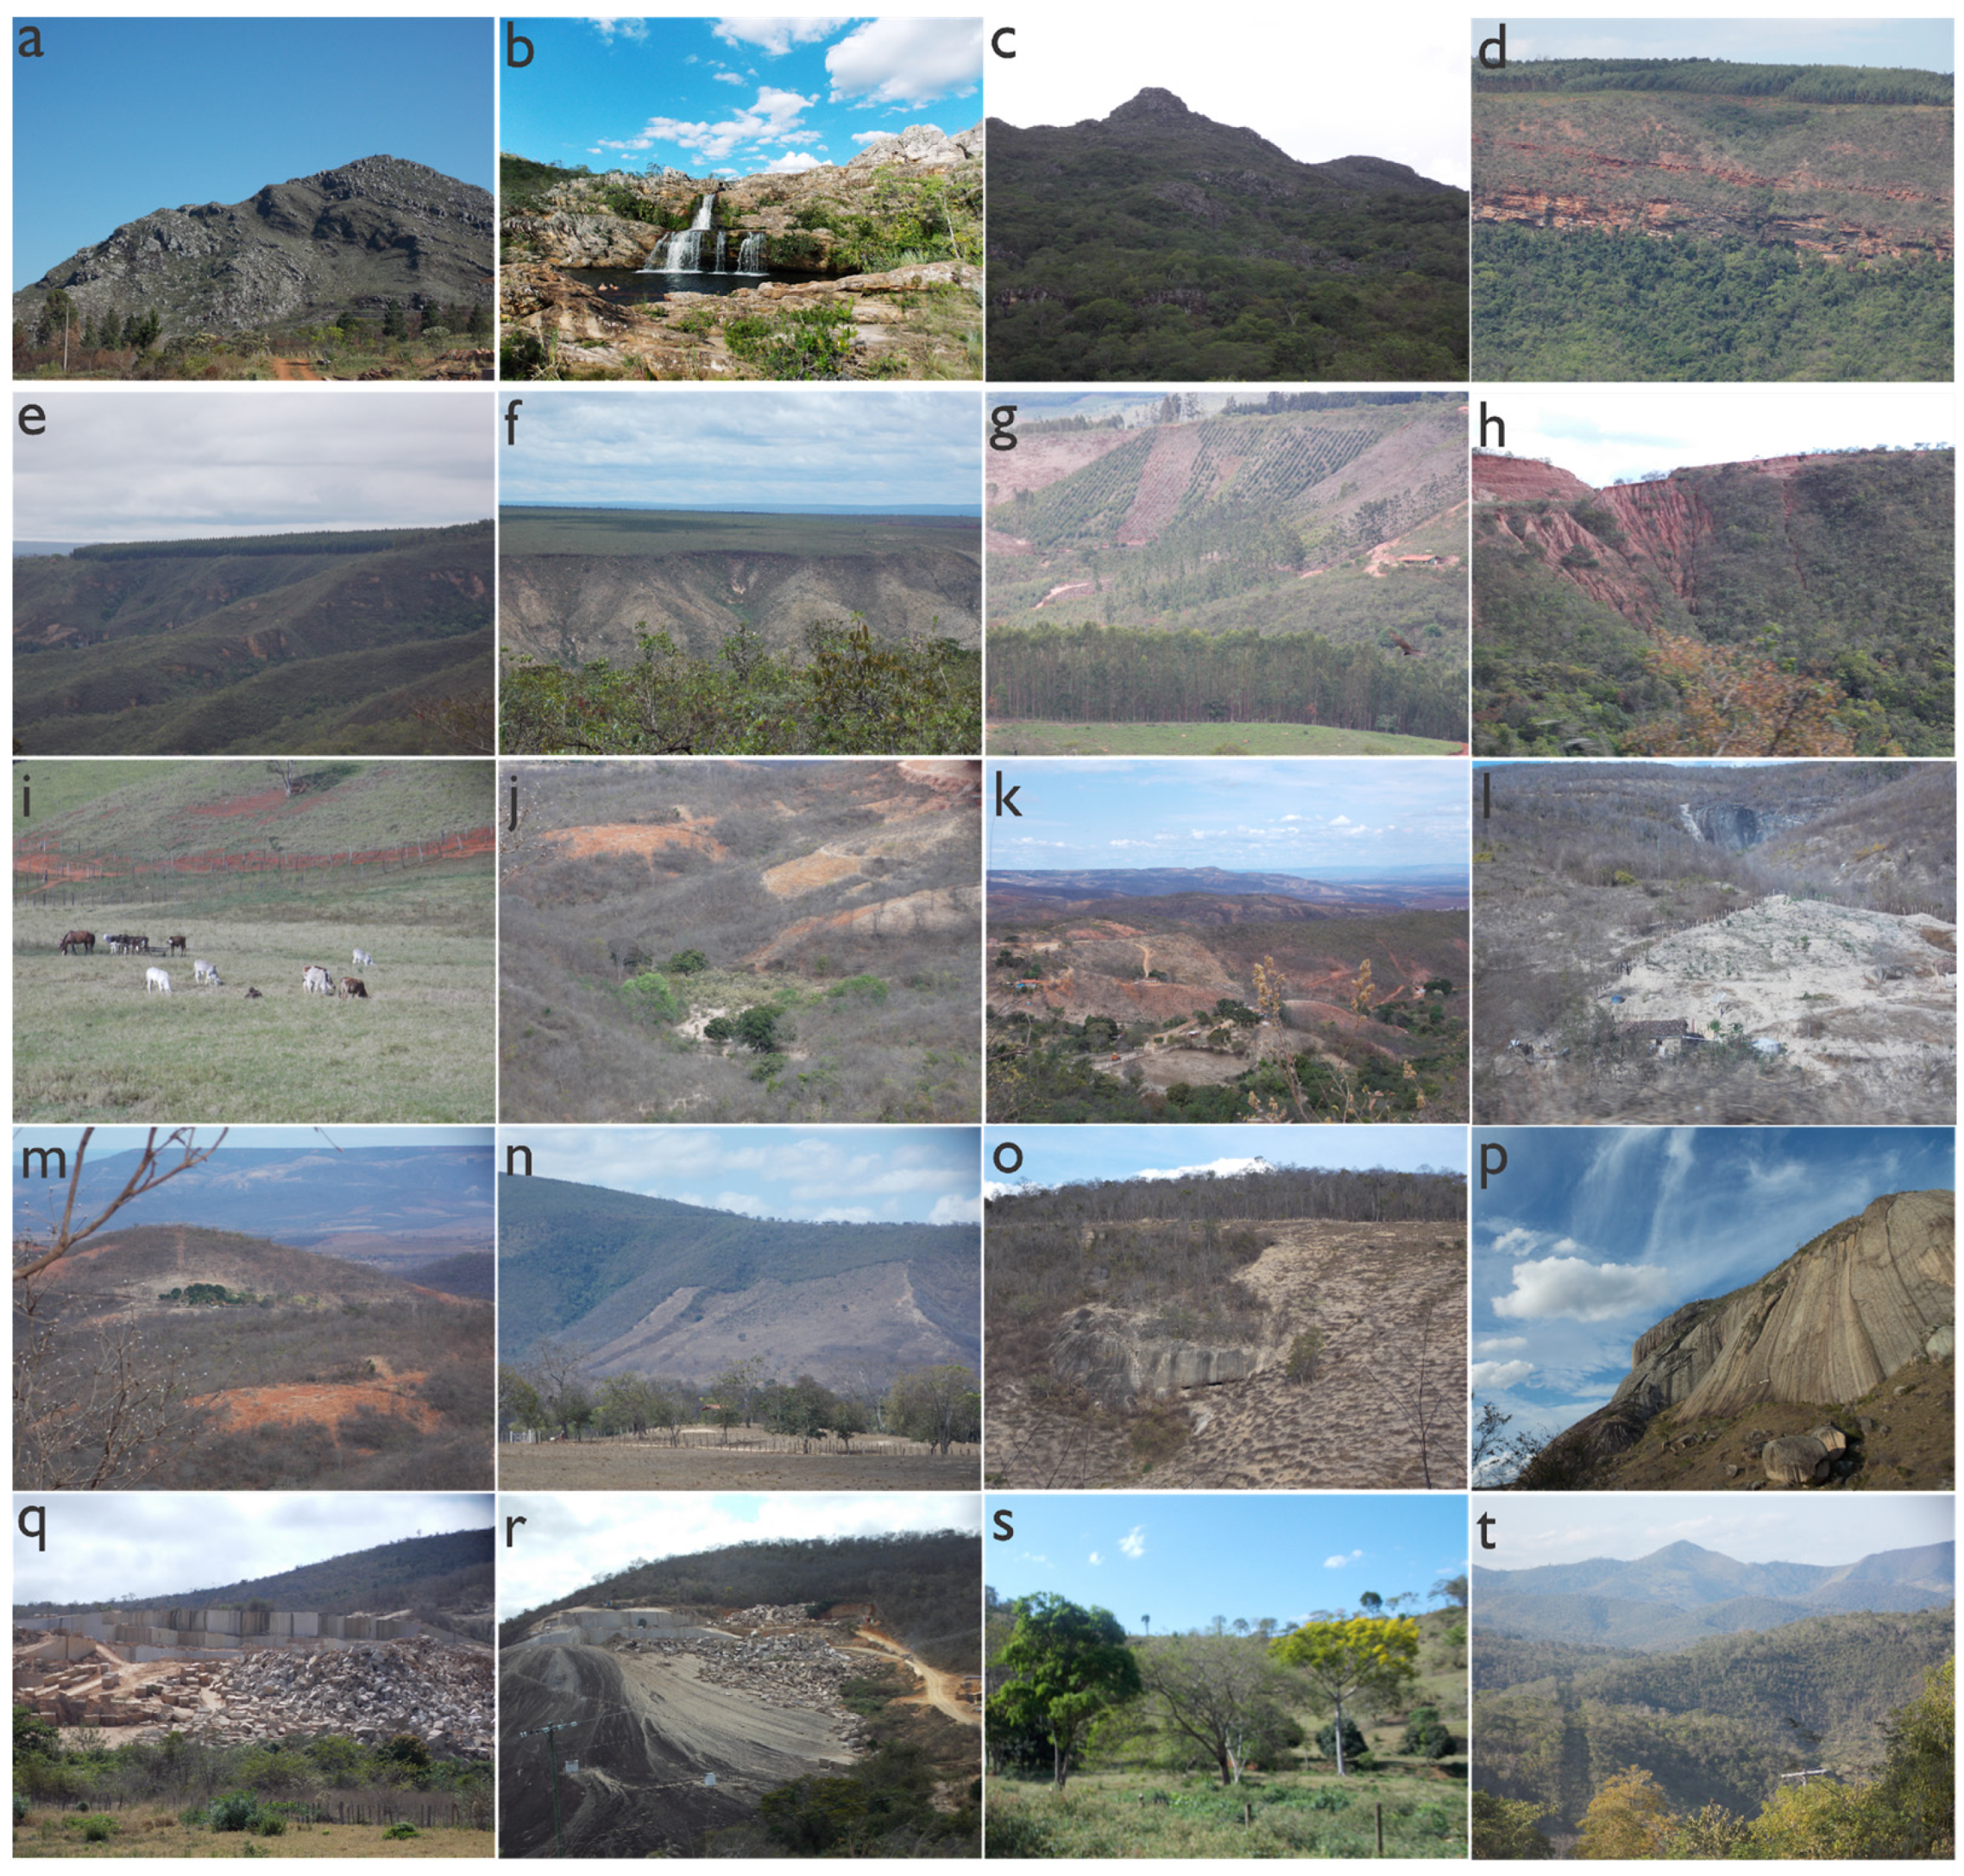
2.1. The Jequitinhonha River Hydrographic Basin: Physical Environment

We analyzed the Jequitinhonha River Hydrographic Basin (JRHB), which has an area of 66.319 km2 and is located in the state of Minas Gerais in southeastern Brazil (Figure 1). According to the Köppen classification, the climate varies between Cwb (dry winter and temperate summer), Cwa (dry winter and hot summer), and As (dry summer) [16]. The region has an altitudinal gradient that ranges from 100 m (downstream) to more than 1800 m (upstream) (Figure 1B). The estimated population is 789,862, and most of the population lives in rural areas. The Jequitinhonha River and its tributaries supply 70 of the 82 municipalities around the basin [17].
We present the landscape characterization in Figure 2 and highlight the heterogeneity in the physiography along the basin. Images (a), (b), and (c) feature of the rocky outcrops and the “Campos Rupestres” of the Upper Jequitinhonha; images (d), (e), and (f) show the areas of the Upper Jequitinhonha with eucalyptus forests; image (g) shows the sloping area of the Upper/Middle Jequitinhonha as well as the forests on the upland or plateau areas and the agricultural areas on the slopes; image (h) shows a sloping site in the Upper/Middle Jequitinhonha areas, which experiences problems related to erosion processes caused by the highways installed on top of the hill; image (i) shows local livestock activity in the Low Jequitinhonha area; images (j), (k), (l), and (m) show the semiarid zone between the Middle/Low Jequitinhonha areas that experience intense anthropic use; images (n) and (o) show sloping areas with low or no vegetation cover; images (q) and (r) show the ornamental rock mining activity in the Low Jequitinhonha area; images (s) and (t) show human-influenced forested areas in the Low Jequitinhonha area.

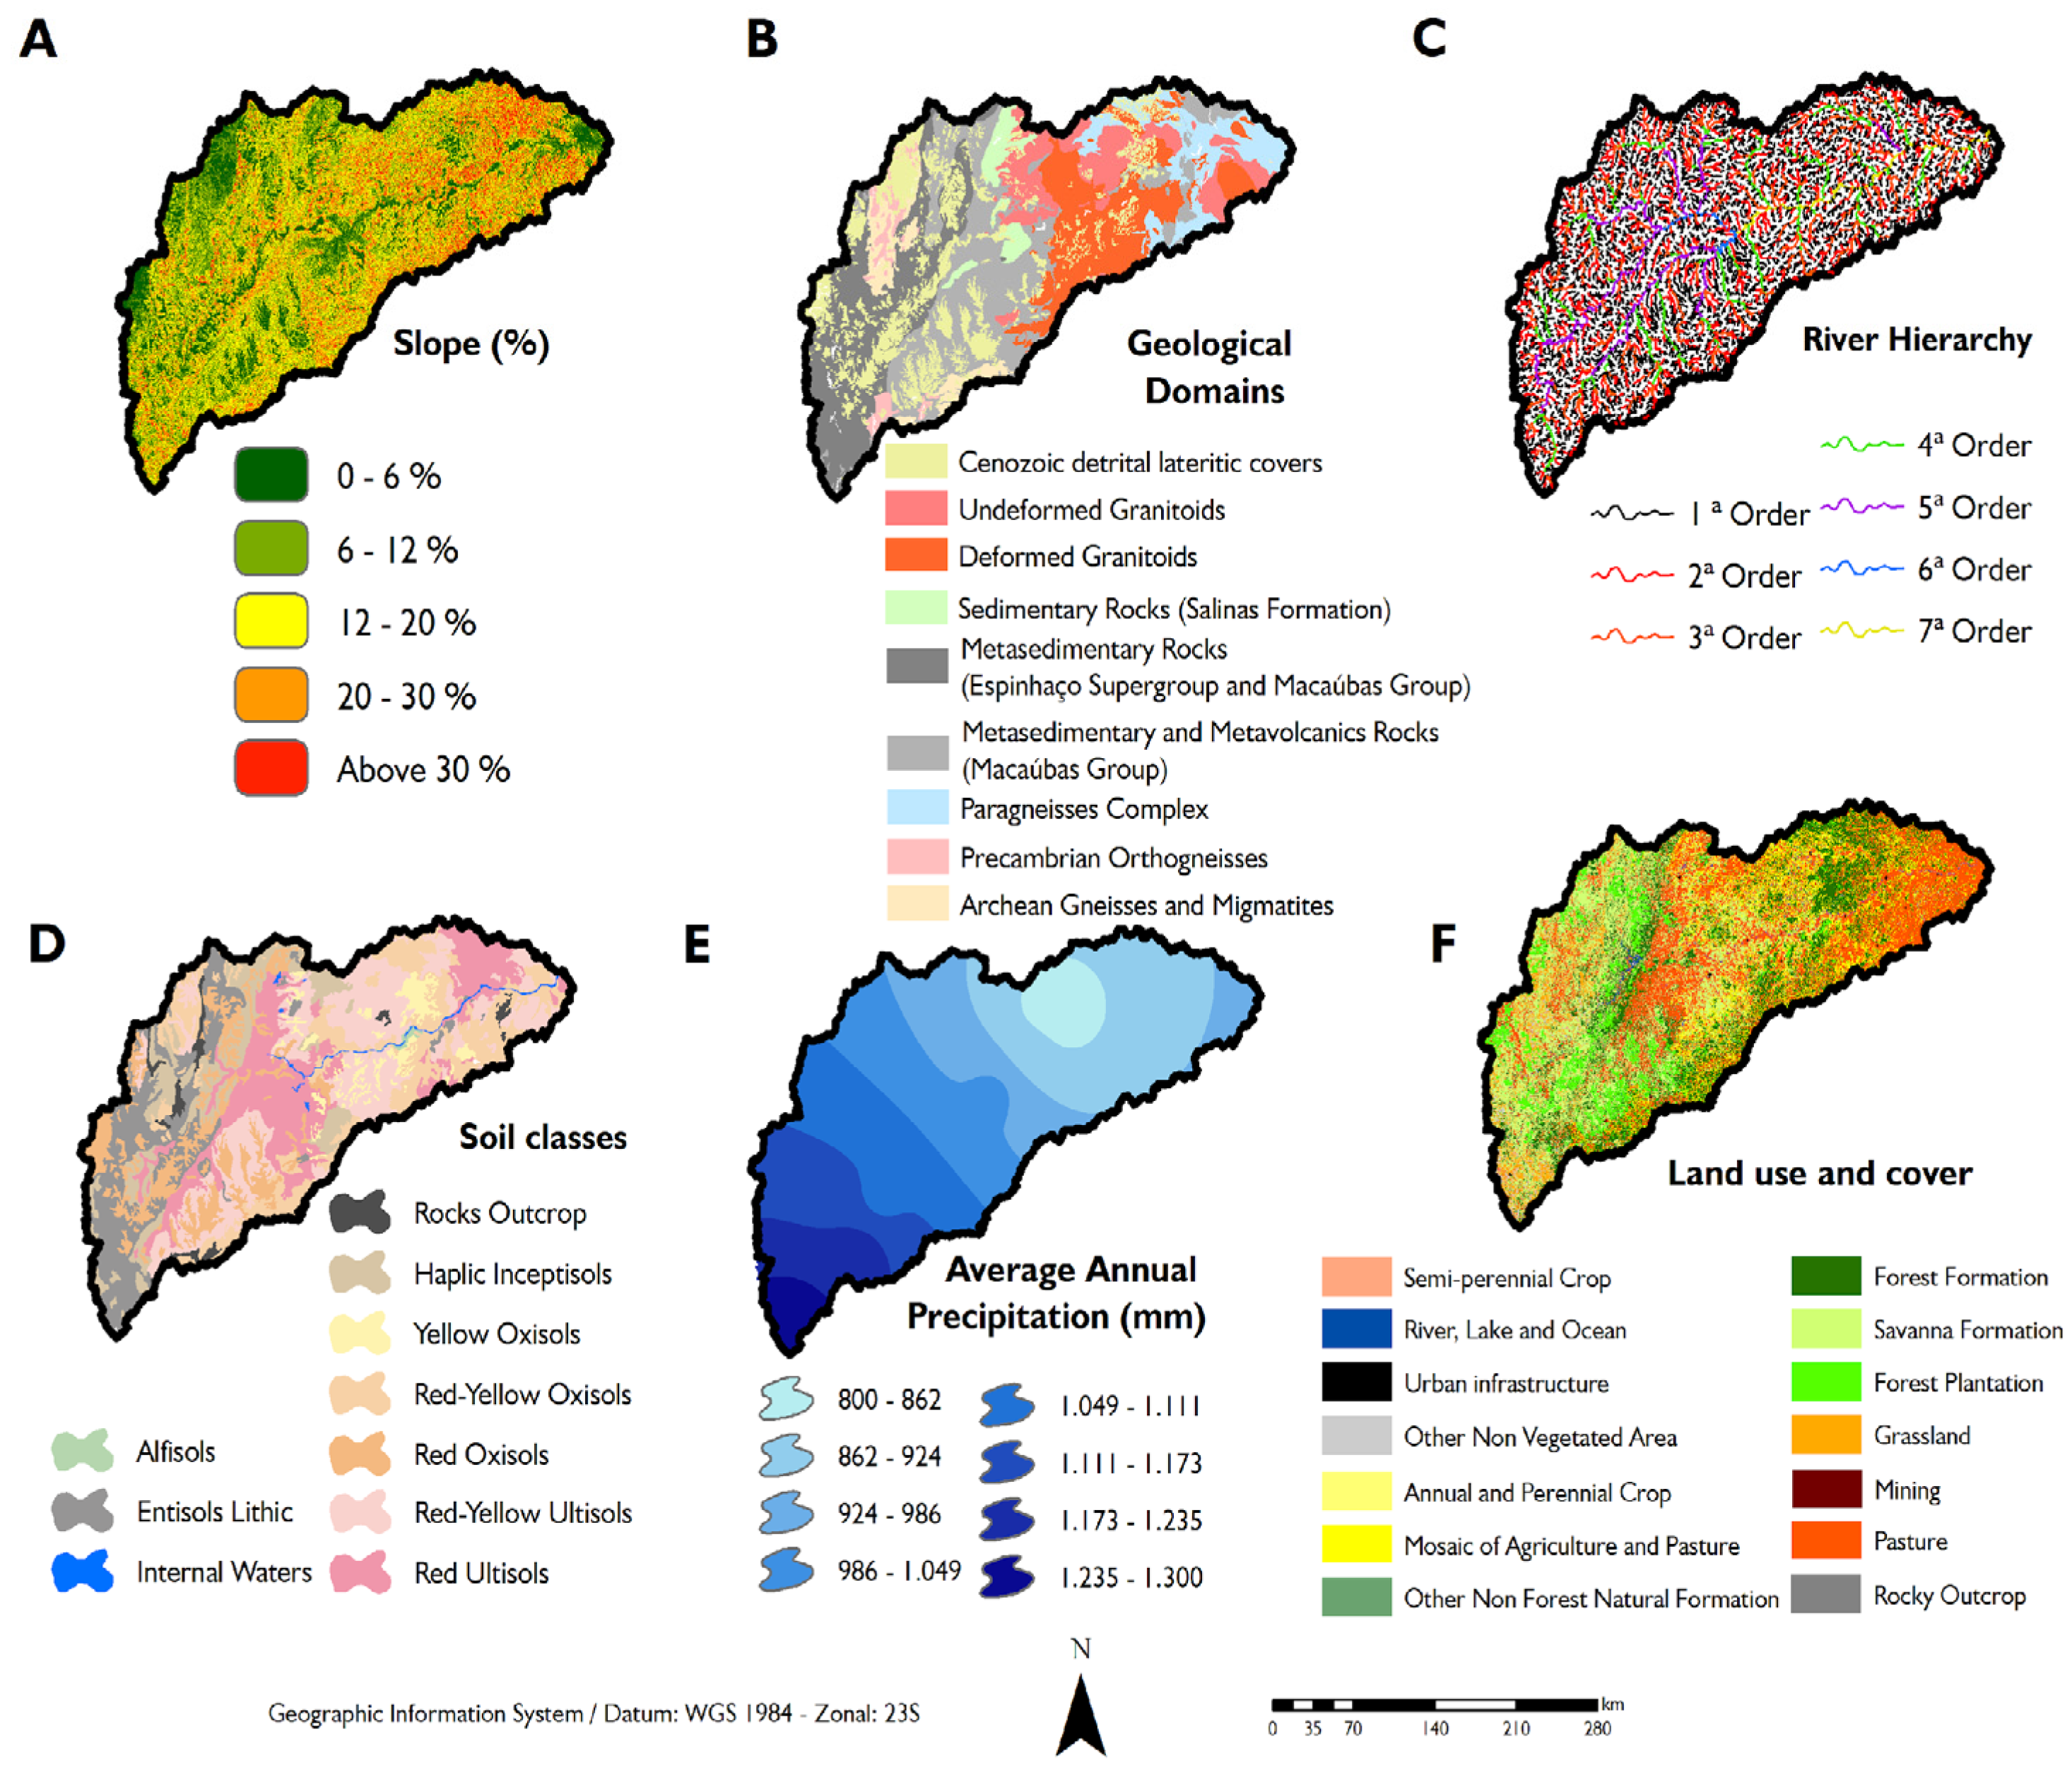
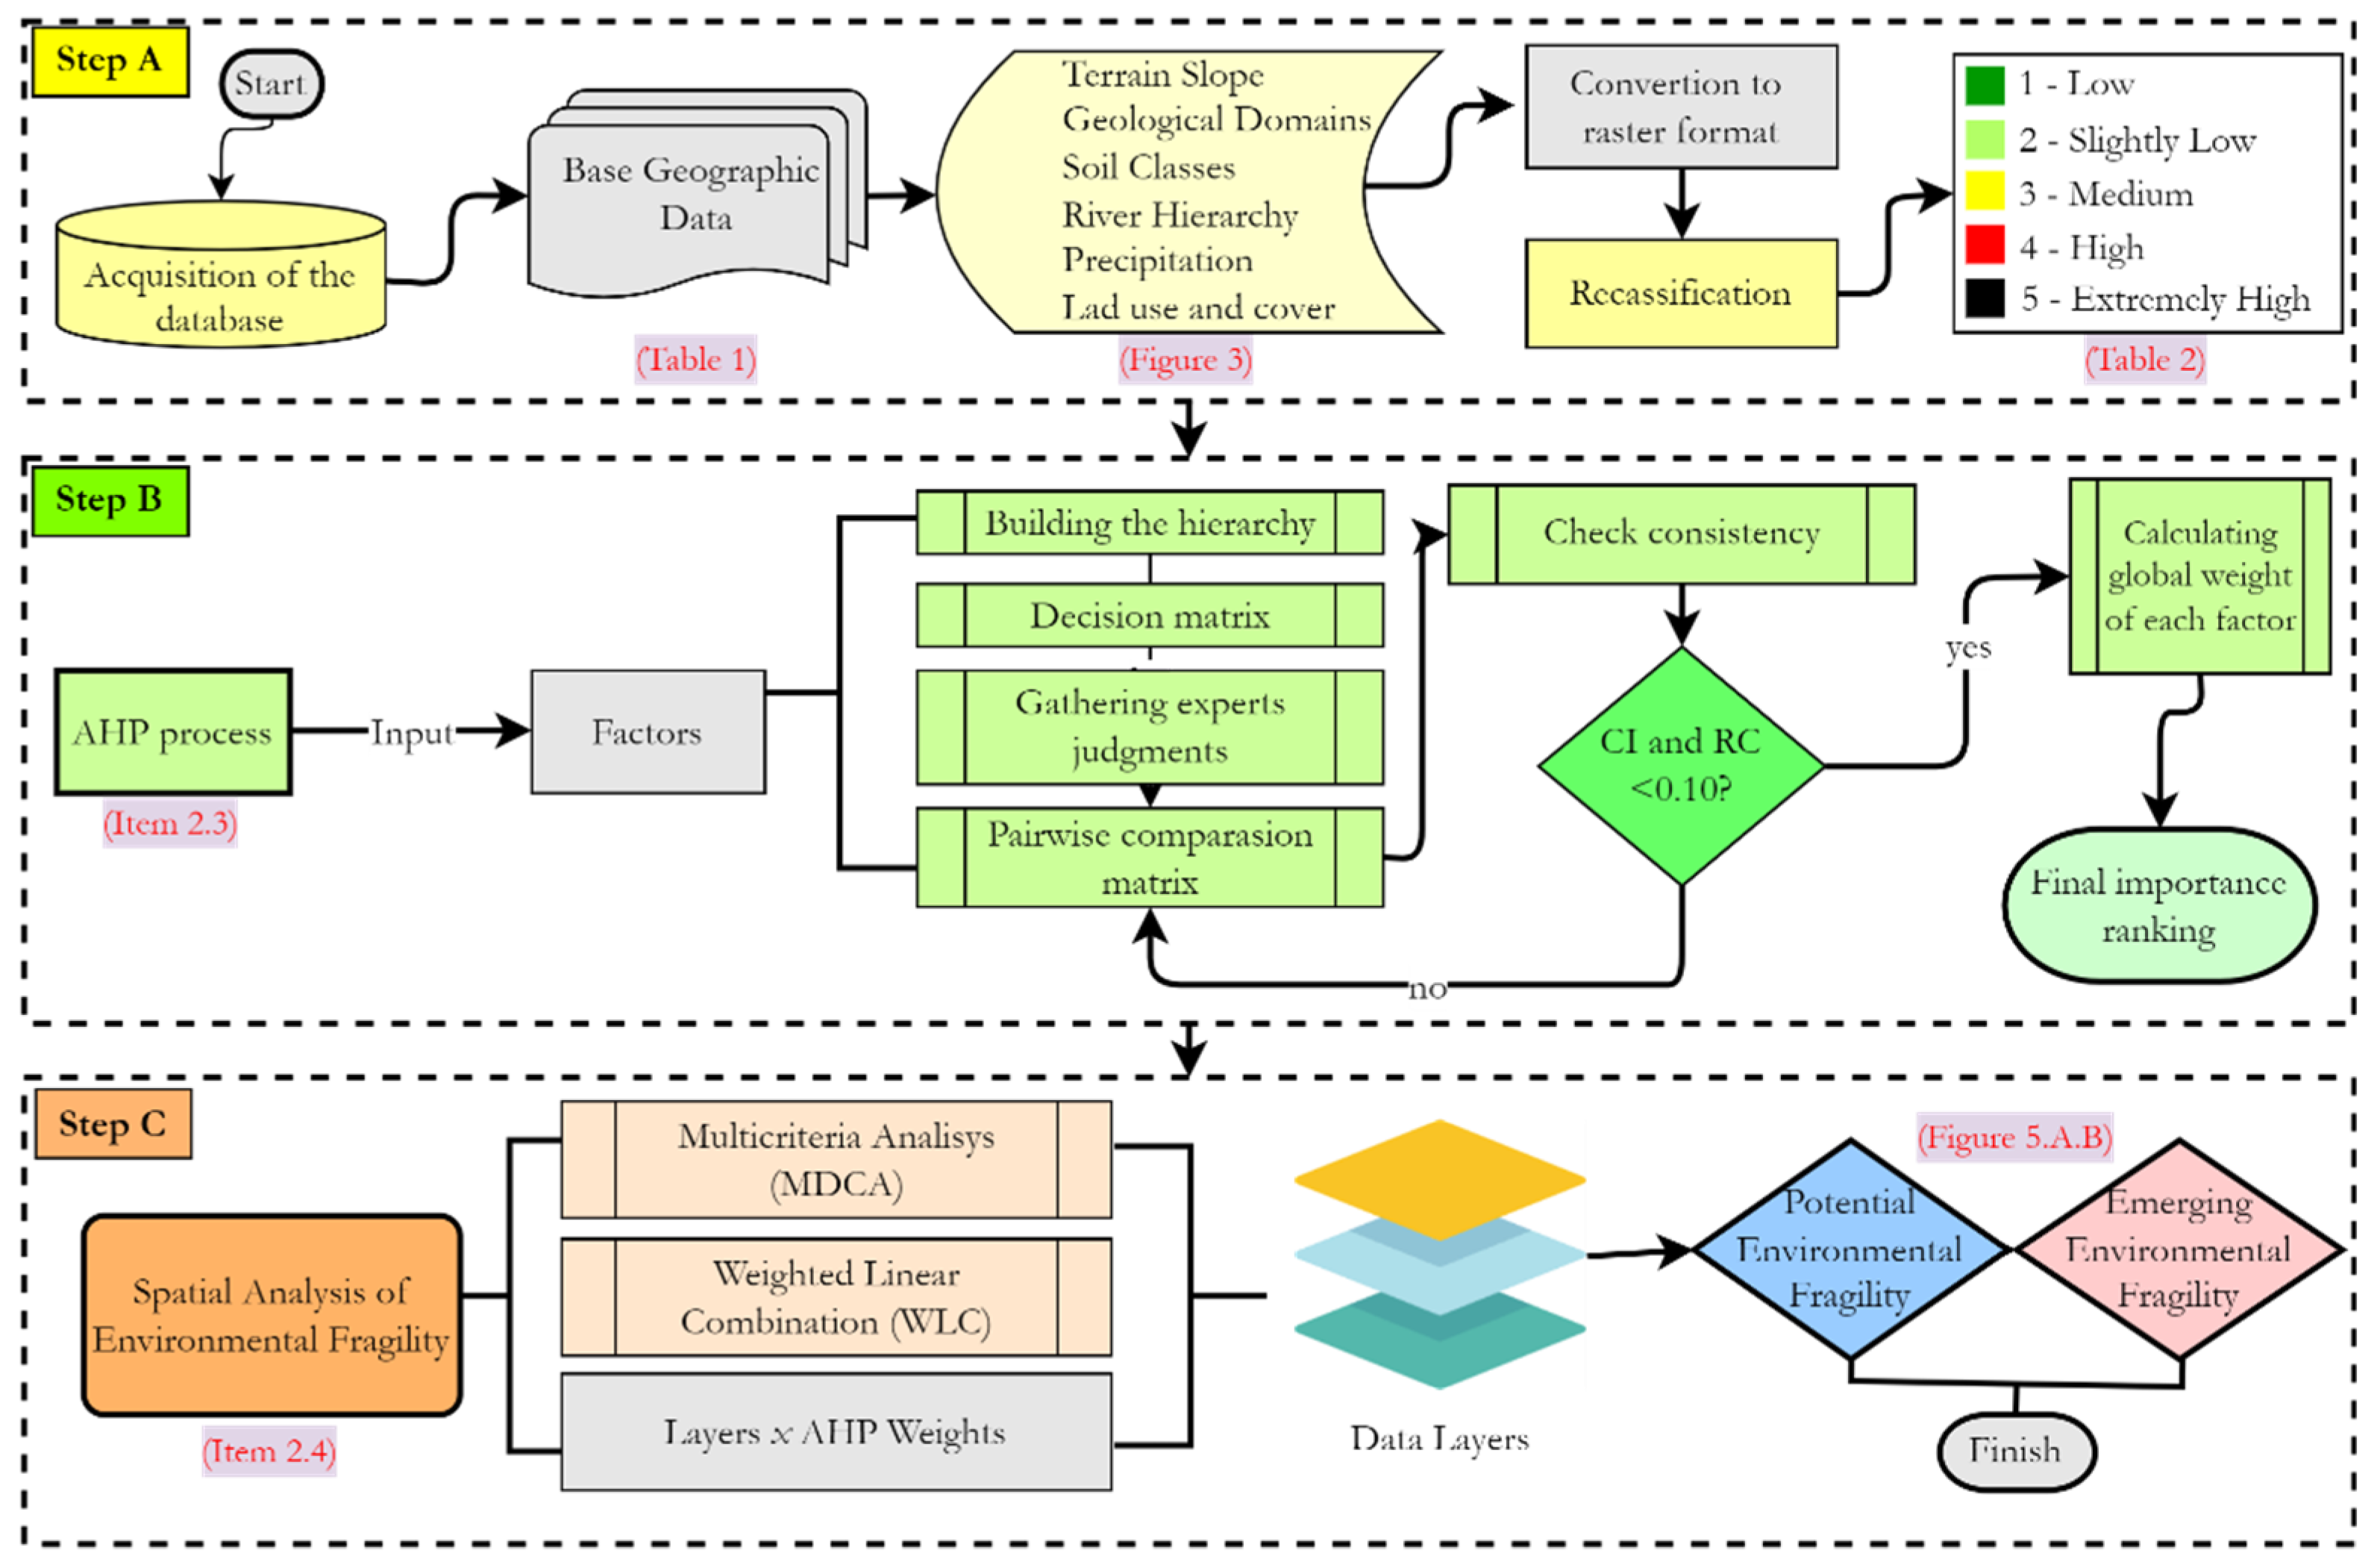
2.2. Geo-Spatial Data Layers and Processing

The study determined the potential environmental fragility (PEF) and emerging environmental fragility (EEF) using the methods adapted from [6,18]. We used five free information plans (geospatial data layers) from the databases of government agencies for the PEF: (i) the digital elevation model (DEM/SRTM) obtained from Earth Explorer (USGS); (ii) soil classes obtained from the State Environment Foundation (FEAM); (iii) geological domains obtained from Geological Survey of Brazil (CPRM); (iv) precipitation from the Isoietas of Average Annual Precipitation between 1977 and 2006 obtained from CPRM; (v) fluvial hierarchy obtained from the DEM/SRTM and collected using the Strahler method. For EEF mapping, we added the (vi) land use land cover information plan for the year 2018 from MapBiomas. We processed and analyzed the data in a GIS environment using ArcGIS 10.5 software [19]. WGS 1984 was used as the geodesic reference, and the Universal Transverse Mercator projection system was used for the 23S zone. Table 1 shows the acquisition sources of the geospatial data layers used in this study.
The slope presented five subdivisions for the JRHB (Figure 3A). Rugged terrain (12 to 30%) was the predominant class, covering 25.4% of the total area (16,606.84 km2). Declivities in the slope from 6 to 12%; from 0 to 6%; from 20 to 30%; greater than 30% represent territorial extension percentages of 24.2%, 22.8%, 18.3%, and 9.2%, respectively (Figure 3A). Seven lithological classes were formed by Precambrian and Cambrian rocks and by Cenozoic detrital lateritic cover (Figure 3B).
The fluvial hierarchy was up to the seventh order, and first and second-order streams were predominant, accounting for 11,058.10 and 5491.64 km, respectively (Figure 3C). For the soil classes, red ultisols make up 22.98% of the area (~15,238.04 km2), red-yellow ultisols make up 19.98% of the area (~13,253.57 km2), and lithic entisols make up 14% of the area (~9035.3 km2) (Figure 3D). The isohyets indicate average annual precipitation, with historical series ranging from 800 mm in the Middle/Low Jequitinhonha area to 1300 mm in the Upper Jequitinhonha area (Figure 3E).
Regarding the land use cover, the following classes are predominant: pastures (39.18% or 25,576.02 km2), savanna formations (21.07% or 13,758.73 km2), forest formations (17.25% or 11,262.93 km2), mosaics of agricultural areas and pastures (6.90% or 4506.01 km2), semi-perennial crops (5.79% or 3780.69 km2), forest plantations (4.20% or 2745.19 km2), and grasslands (4.20% or 2745.19 km2) (Figure 3F).
The weights attributed to each information plan were implemented according to technical fundamentals and specialized literature [6,12,18,20,21]. The weights followed a five-degree scale: 1 (low), 2 (slightly low), 3 (medium), 4 (high), and 5 (extremely high), that determined fragility related to soil resistance, erosion processes, sedimentation, and the risk of degradation (Table 2).

2.3. Determination of Weight by AHP and Consistency Check

We used the AHP method for multi-criteria decision-making and compared pairs of components based on a scale from 1 to 9 [9,22,23]. We checked the consistency rate of the AHP assessment using the consistency index calculation [23] (Equation (1)), where CI = consistency index; n = number of indicators evaluated; λMax = eigenvector.
I C = λ M a x n n 1
The arithmetic mean of the eigenvector (λMax) was calculated [10,24]. The consistency ratio (CR), which is the ratio value of the consistency index (CI) and the random index (RI), was determined (Equation (2)). The RI is a constant value and depends on the following matrix dimension: the number of evaluated indicators (n) [9,23].
C R = I C I R
The method must respect three mathematical assumptions: reciprocity (if aij = x, then aji = 1/x, with 1/9 ≤ x ≤ 9); homogeneity (if the elements i and j are considered equally important, then aij = aji = 1; in addition, ai = 1 for all i); the matrix must be consistent if the ratio is ≤0.1 or 10% (9.23). The results will also be consistent if the primary paired comparison matrix is λmaxn [25].
The collected data were data from the pairwise comparison of all of the elements in the suggested hierarchical model. Three decision makers were gathered for an interview session where they were given a questionnaire survey to fill out. Each question on the survey was a pairwise comparison comprising two elements at the same level. An example is “How important is Criterion 1 compared to Criterion 2?”. This applied to all of the criteria and sub-criteria. The step-by-step procedure for the AHP is described in [10].

2.4. Input Data and Multi-Criteria Analysis (MCA)

There were many steps that were performed in GIS to determine the final layers required for the study (e.g., clip, extract, overlay, convert, reclassify, map algebra, etc.). In GIS, each criterion was classified into different classes, and each class was assigned a suitability score value based on the views of experts and previous literature in the field.
We prepared the PEF and EEF synthesis maps by establishing the AHP and multi-criteria analysis (MCA) weights by considering the weighted overlap for the criteria. The weighted linear combination (WLC) was used as the multi-criteria process due to its convenience and efficiency [26,27]. Each standardized criterion was multiplied by its respective weight obtained via the AHP model and then added (operations conducted pixel by pixel) to perform the WLC and create the final maps. The output information plan for the PEF and EEF (Raster Calculator function), with five fragility classes was determined according to Equation (3):
S = i = 1 n w i × x i
S = the final EF value (for PEF and EEF); wi = the weight of the factor for the i-th criterion obtained via the AHP method; xi = the normalized or standardized cell value of the i-th criterion.
We used the Jenks method to reclassify the output map, identifying small breaks in the data sets by grouping similar values [27,28]. We generated the input maps for the analysis in the multi-criteria model for JRHB using its appropriate classes, quantified areas, and other pertinent information to understand the characteristics that condition environmental fragility. The steps related to this study’s methodological procedures are in Figure 4. The step-by-step procedure for hybrid GIS-AHP is available in [10].
We also introduced an environmental zoning proposition section with the best practices for land use that are focused on conservation according to the results of the EEF mapping. The risk of degradation and the potential for landscape resilience subside and offer alternatives related to environmental conservation and socioeconomic progress [7,12,29,30,31]. Table 3 presents a description of the abbreviations used throughout the study.

3. Results

3.1. Plan Information’s Weights

The categories weighted on the scale that ranged from low to extremely high fragility are related to soil resistance, erosion processes, sedimentation, and the risk of degradation (Table 2).
We scored the individual characteristics for each criterion and the external factors that may have a greater or lesser influence on it. The PEF and EEF weights for each information plan are in presented Table 4 and were implemented according to technical fundamentals and specialized literature for each criterion [18,32].

3.2. Analytical Hierarchy Process (AHP)

The importance of each criterion in the AHP model was organized according to the priority hierarchy. The results of the paired comparison matrix are presented in Table 5. We identified land use land cover as the most relevant EF criterion, with an importance of 40% (weight = 0.40). In order of importance, the order was slope (27% or weight = 0.27), rainfall (16% or weight = 0.16); fluvial hierarchy (10% or weight = 0.10); soil classes (5% or 0.05), and geological domains (2% or weight = 0.02).
The consistency index (CI) and the consistency ratio (CR) were 0.09 and 0.07, respectively, acceptable coherence and reliability values (<0.10). The λmax value of 6.45 (n = 6) corroborated the adequacy of the weightings after they had been performed once λmaxn. The other criteria and their weights in order of importance are presented in Table 6.

3.3. Potential and Emergent Environmental Fragility

We created MCA models and generated the PEF (Figure 5A) and the EFF (Figure 5B) maps for the Jequitinhonha Basin. The medium-class PEF areas were the most representative, corresponding to 30% (19,244.07 km2) of the total JRHB (Table 7A).The extremely high-class PEF areas occurred in a smaller proportion, totaling 5.3% (3416.15 km2). High-class PEF sites occupied 16.4% (10,519.63 km2) of the basin. The low and slightly low classes corresponded to 12,430.57 km2 and 18,540.93 km2, respectively.
PEF mapping highlighted that the slope criterion is a conditioning factor for fragility. In the JRHB, 12 to 20% slopes occupy 25.4%. Considering the entire area, 9.2% showed declines above 30%, meaning that they were classified as having extremely high fragility.
The final EEF map (Figure 5B), which was generated from the overlap analysis between the PEF data and the land use cover criterion, provides a better perspective on the environmental impact that anthropic actions have on the area. Figure 5B shows the spatial distribution of the EEF. Table 5 displays the quantification of the EFF areas in the JRHB.
Medium-class EEF areas are predominant in the basin, occupying approximately 34,503.55 km2 or 53.78% of the total area. Medium-class areas remained predominant in both EF mappings, with 30% for PEF and an increase to 53.78% for EEF (Table 7). This class is directly related to the degree of land protection.

4. Discussion

4.1. Thematic Layer and AHP Model Analysis

The AHP model in this study determined the importance of the different criteria in the JRHB (Table 6). The qualitative and quantitative assessments supported the MCA-WLC review. “Land use land cover” (40% importance) is directly related to the impacts of soil, vegetation cover, and land resources [7,33,34]. In Brazil, pasture expansion has been very intense in the last 40 years, causing concerns about food security, climate change, and biodiversity loss [35]. The JRHB presents expansive pasture and silviculture areas that consist of high capital and technology and that affect the land-use capability [36]. In terms of the physical attributes, “slope” (27% model evaluation) relates to erosion processes and mass movement [37] and is especially complemented by “rainfall” (16% importance) in soil degradation processes [38]. “Fluvial hierarchy” (10% importance) and “soil classes” (5%) have low levels of relevance due to the large scale in the mapping of Minas Gerais (1:500,000), and “geological domains” (2%) have a low level of importance due to the static and primary indicator. Nonetheless, geology is fundamental to understanding the levels of stability when analyzed with altimetry and slopes. In this context, these criteria control the runoff in a hydrographic basin and affect the intensity of the weather and soil erosion [39].

4.2. PEF and EEF Practical Implications

The PEF and EEF synthesis maps were obtained by the AHP based on data obtained from the information from internal plans (Table 4) and the weights that were implemented for the multi-criteria analysis (MCA) (Table 6). The weighted linear combination (WLC) was used as the multi-criteria process (Equation (3)), and the Raster Calculation function was used. The spatial modeling of the PEF and EEF index demonstrated that there are sites that meet all of the criteria; there are cells that achieve the maximum index (5) and minimum index (1) simultaneously.
The PEF analysis indicated that the JRHB presents a medium level of vulnerability to soil erosion and environmental degradation. The medium class of PEF requires attention regarding the development of anthropic land practices. The category accounted for 30% of the PEF assessment territory, with the EEF being high due to direct influence from important anthropic activities and the level of land protection.
The Upper Jequitinhonha area has high-level PEF classes due to the medium-textured soils, such as entisols, and numerous peatlands area [40] as well as the exposed rocks belonging to the Espinhaço Supergroup and Macaúbas Group. In this portion of the basin, there are many first- and second-order streams. In this sector, rainfall is more intense, and there is a rugged terrain slope. Many sites with high PEF classes are also related to sloping terrain. Part of these sites make up areas of restricted use (ARU) (>25° and <45°) and permanent preservation areas (PPA) for slopes (>45°) according to the Brazilian Forest Code [41], which assigns these areas to be ARUs and PPs for the protection and conservation of native vegetation due to their susceptibility to erosion processes.
The PEF is related to environmental susceptibility without the influence of anthropogenic interventions or disturbances. When the dynamic balance is broken, the system may collapse, making it susceptible to environmental degradation [4,42]. The PEF criteria are associated with stable environments (dynamic balance) that are therefore less affected by the structure and function of human activities. Despite their stability, they have the potential to become unstable given natural characteristics and anthropization, and this can be better understood by the EEF analysis.
The study found that 53.78% of the areas in the basin have a medium EEF level and that only 2.57% of the basin is classified as having a low EFF. Compared to the PEF mapping, there was a significant increase in the medium class and a considerable reduction in the low category. This result demonstrates the impact that changes in land use can have on the environment, especially when there are agricultural and pasture activities occurring in the region. Pastures represent the predominant land use by area in Brazil, with an estimated 167,478,780 ha, followed by agriculture, which covers 64,753,699 ha [43,44].
The second most prevalent EEF class is slightly low, occupying 33.36% of the basin and found in areas with low natural susceptibility to erosion. Its occurrence is mainly associated with agriculture (annual perennial and semi-perennial crops), natural vegetation (riparian and natural forest fragments), planted forests, and savanna formations.
Medium-class EEF areas have a larger area compared to medium-class EEF areas due to agriculture, pastures, and planted forests. The study also found areas with high and extremely high fragility for PEF and EEF, especially in the Upper Jequitinhonha areas. Part of this high fragility is associated with the rocky outcrop mosaic in the regions, which includes shallow soils where the sensitive and fragile “Campos Rupestres” ecosystems are located [27,45,46]. These complexes present a high level of species richness in the Espinhaço Range, where there are more than 5000 vascular flora species [47] and numerous relict populations and endemisms [48]. These areas have a high erosion rate, with significant losses caused by leaching due to the high altitudes, undulating terrain, and the low soil thickness associated with the source material’s inadequacy [49].
High and extremely high EEF areas cover 9.83% and 0.46% of the basin, respectively, and most of them are mainly associated with PEF regions with high fragility. Mosaics of agriculture areas and pastures, urban agglomerations and naturally fragile and non-vegetated soils, rural landscapes, mining sites, and rocky outcrops are the associated land use land cover categories of these fragility classes. Drainages also who high levels of PEF and EEF [50], reinforcing the importance of forest cover on the borders of watercourses, which are considered permanent preservation areas (PPA) [41]. In the regions that are most susceptible to environmental degradation, mining activities for diamond, gold, quartz, colored stones, and ornamental rocks are predominant [51,52]. Moreover, there is an industrial sector in which food, ceramic, and textile segments are predominant. Forestry companies are located in the Upper and Middle Jequitinhonha areas and exert pressure on rural landscapes [53].
All of these activities require plans to control and monitor environmental degradation. Uncontrolled exploration can impact adjacent areas by increasing the impact of biodiversity [54]. EEF highlights the importance of vegetation cover, especially in regions with medium to extremely high EF. Vegetation cover is the inherent source of protection that the terrain has against erosion [55,56], decreasing the chances of soil degradation by raindrops by 95% [57]. Restoring forest cover, especially in degraded riverside areas, can reduce EF [58].
Thus, it is evident that EF studies provide a better definition of the guidelines and actions that should be implemented in the physical–territorial space, serving as a basis for environmental zoning and providing land management subsidies [7,42]. These studies are fundamental tools for strategic environmental assessments, especially in anthropic interventions and defining priority areas for environmental conservation and conservation units [59].
Using a joint analysis of the criteria considered to be determinants when mapping the PEF and EEF of the JRHB, the interaction between the indicators in determining the fragility was noticeable. However, the JRHB is heterogeneous and is composed of distinct sub-territories that require distinguished attention due to a desire to integrate areas with soil that is more susceptible to erosion or because they have a greater slope, less water availability, socio-cultural particularities, or a combination of several factors [17].

4.3. Method Evaluation: Advances and Challenges

We adopted an empirical ecodynamic approach in the study that combined the EF assessment with GIS methods and the AHP decision-making model to map the JRHB. We identified the highest and lowest priority areas for environmental protection and conservation. The methodological framework is efficient for environmental zoning and land-use planning, especially on a hydrographic basin scale. It is noteworthy that the greater the incorporation of new factors related to EF, the more consistent with local reality the results will be. We recommend evaluating and incorporating new elements with the methodology and those presented in this study.
Our study contributes to the advancement of current knowledge by presenting the possibility of combining AHP and GIS applied to environmental fragility modeling to reduce problems related to subjectivity in the decision-making process and to increase the realism of the mapping in relation to real-world instances. Our study offers a contribution to a large hydrographic basin in Minas Gerais that is located in a strategic region of Brazil, which is known as the Serra do Espinhaço Biosphere Reserve, a global hotspot for biodiversity conservation. Our study also faced the challenge of scalability, as it is proposed for an area of large territorial dimensions.
One of the fundamental challenges of modeling EF is the attribution of weights based on specific technical and scientific knowledge. Studies on the development and techniques for validating EF indexes are still necessary [60,61], especially large-scale trials on the actual probability of soil erosion and sedimentation [62,63]. Furthermore, studies on reducing the arbitrary bias in decision-making are required, such as machine learning techniques and mathematical programming to estimate the weights of the parameters [27,64,65].
On the other hand, the definition of the weights based on studies in the literature combined with AHP in this paper can be considered an improvement over conventional multi-criteria analyses in GIS. AHP mathematically quantifies empirical assessments [10,66]. Additionally, the establishment of weights by specialists is essential because it represents diverse landscape views. Therefore, MCA combined with AHP has been widely employed [24,44,67]. MCA is a modeling tool that can be implemented to support decision-making for defining priority areas for hydrographic basin management [44]. It has proven to be efficient in characterizing the areas that need more attention regarding EF in the JRHB.
Although the model considered in the present study does not directly incorporate the “social fraction”; an indicator related to social sustainability [68], we believe it can assist in understanding and asserting EF analyses under social perspectives. Future studies shall consider social components in the zoning analysis at the hydrographic basin scale.
The methodology used here can be replicated for any other global region. It is flexible in terms of use and in the classification of the specific criteria linked to the environment and to the morphodynamics to which it applies. This adaptability does not alter the method’s fundamental concept and provides more representative analyses of different settings [7].

4.4. Recommendations for Environmental Management

In the context of the JRHB zoning according to environmental criteria, we will propose some conservation and land-use practices that are more appropriate to ensure environmental conservation and socioeconomic development (Table 8) according to [7,12,29,30,31].
It is intuitive that land use and management can influence the magnitude of soil loss and environmental degradation [62]. The development of human activities in areas with high EF can intensify soil degradation processes and affect the quality of water resources and the local ecosystem at a macro level [7]. These areas must prioritize implementing conservation practices for land use, guarantee the adequacy of current anthropic uses, and plan actions to restore degraded areas. For the lower EF classes, the land use is adequate. Nevertheless, we recommend implementing best land-use practices and conservation, especially for sites classified as having a medium level of fragility or higher.
These land use and environmental conservation recommendations are indicated from a regional perspective, and local context analyses require specific attention. Nilsson and [34] highlight that fragility can be considered an inherent property of an ecosystem; that is, an ecosystem has a certain level of fragility, regardless of whether it is exposed to any disturbances. The only effectively observable fragility is the one revealed because of the disorder, both natural and human, that is operating in the ecosystem. Therefore, relating ecosystems to disturbances and anthropic actions can provide helpful and fundamental assessments in environmental zoning design. This approach is closely related to evaluating environmental impacts [12,59].
The final indicators of this study are indispensable for understanding proper land-use management concerning EF conditions. The following items are required: (i) consider the use of EF classes as a landscape planning unit for conservation and economic production; (ii) employ official and public databases to generate more reliable EF mappings to guide actions related to geographic intelligence and environmental and territorial planning; (iii) increase attention to compliance with current legislation for the adequate protection of more fragile ecosystems; (iv) promote management practices that consider compensation and synergy among multiple ecosystem services; (v) encourage agricultural practices such as crop rotation and diversity and integrated crop–livestock–forestry systems; (vi) create specific policies and programs to control land degradation and biodiversity loss in highly fragile sites; (vii) support local and regional landscape planning by considering sustainable practices and the participation of decision makers and stakeholders.

5. Conclusions and Perspectives

  • Models that improve our understanding of ecosystem fragility with or without human intervention can support environmental and territorial planning by allowing for the identification of suitable areas for human use and those that are a priority for conservation or restoration.
  • Spatial models of environmental fragility, regardless of whether they include human intervention, are essential for understanding soil susceptibility. The PEF and EEF maps presented here configure territorial and environmental intelligence tools for the JRHB.
  • The methodological framework was used efficiently, characterized the environmental fragility of the JRHB, and can be replicated in other world ecoregions according to specific characteristics and morphodynamic patterns.
  • This methodology can support government agencies in decision-making processes for managing land use, environmental services, and subsidizing environmental zoning in hydrographic basins.
  • Our results assist in prioritizing regions for comprehensive protection within the JRHB once part of the study area is considered a global hotspot for biodiversity with endemic and/or endangered species.

Author Contributions

L.C.d.J.F.: conceptualization, investigation, methodology, software, data curation, formal analysis, validation, writing—original draft preparation, writing—reviewing and editing. L.F.L.: writing—reviewing and editing. M.S.d.M.: conceptualization, writing—reviewing and editing. G.d.S.L.: writing—reviewing and editing. S.J.S.S.d.R.: writing—reviewing and editing. V.T.M.d.M.J.: writing—reviewing and editing. R.C.S.: writing—reviewing and editing. D.P.M.: conceptualization, investigation, supervision, methodology, funding acquisition, project administration, writing—reviewing and editing. All authors have read and agreed to the published version of the manuscript.

Funding

The present work was conducted with the support of Coordenação de Aperfeiçoamento de Pessoal de Nível Superior—Brasil (CAPES)—financing code 001.

Institutional Review Board Statement

Not applicable.

Acknowledgments

The first author (Luciano C. de J. França) thanks the ‘Coordenação de Aperfeiçoamento de Pessoal de Nível Superior—Brasil (CAPES)—Financing Code 001′—for granting the research grant to the Federal University of the Jequitinhonha and Mucuri Valleys (UFVJM) for the period in which the study and the University of Porto had the opportunity. We are grateful to the Federal University of the South of Bahia (UFSB), in reference to ‘Edital PROPPG/UFSB N° 08/2020, n° do processo 23746.005146/2020-91′. Special thanks to Jurandyr Luciano Sanches Ross (University of São Paulo, Brazil); Allaoua Saadi (Federal University of Minas Gerais, Brazil); Israel Marinho Pereira (Federal University of the Jequitinhonha and Mucuri Valleys, Brazil), and Carlos Valdir de Meneses Bateira (University of Porto, Portugal) for the scientific contribution in certain stages of this study. The author Luís Lopes was supported by an FCT-Foundation for Science and Technology PhD Programme SUSFOR grant (PT/BD/142963/2018).

Conflicts of Interest

The authors declare no conflict of interest.

References

  1. Prăvălie, R. Major perturbations in the Earth’s forest ecosystems. Possible implications for global warming. Earth-Sci. Rev. 2018, 185, 544–571. [Google Scholar] [CrossRef]
  2. Baude, M.; Meyer, B.C.; Schindewolf, M. Land use change in an agricultural landscape causing degradation of soil based ecosystem services. Sci. Total Environ. 2019, 659, 1526–1536. [Google Scholar] [CrossRef] [PubMed]
  3. Li, Z.; Wang, S.; Song, S.; Wang, Y.; Musakwa, W. Detecting land degradation in Southern Africa using Time Series Segment and Residual Trend (TSS-RESTREND). J. Arid. Environ. 2021, 184, 104314. [Google Scholar] [CrossRef]
  4. Albaladejo, J.; Díaz-Pereira, E.; de Vente, J. Eco-Holistic Soil Conservation to Support Land Degradation Neutrality and the Sustainable Development Goals. Catena (Amst). Available online: https://doi.org/10.1016/j.catena.2020.104823 (accessed on 25 April 2022). [CrossRef]
  5. Tricart, J. Ecodinâmica. 1977. Available online: http://biblioteca.ibge.gov.br/visualizacao/monografias/GEBIS-RJ/ecodinamica.pdf (accessed on 2 March 2018).
  6. Ross, J.L.S. Análise Empírica da Fragilidade dos Ambientes Naturais Antropizados. Rev. Do Dep. De Geogr. 1994, 8, 63–74. [Google Scholar] [CrossRef] [Green Version]
  7. da Silva Anjinho, P.; Barbosa, M.A.G.A.; Costa, C.W.; Mauad, F.F. Environmental fragility analysis in reservoir drainage basin land use planning: A Brazilian basin case study. Land Use Policy 2021, 100, 104946. [Google Scholar] [CrossRef]
  8. Chakhar, S.; Mousseau, V. An algebra for multicriteria spatial modeling. Comput. Environ. Urban Syst. 2007, 31, 572–596. [Google Scholar] [CrossRef]
  9. Saaty, T.L. The Analytic Hierarchy Process. McGraw-Hill, New York. References-Scientific Research Publishing. 1980. Available online: https://www.scirp.org/(S(lz5mqp453edsnp55rrgjct55))/reference/ReferencesPapers.aspx?ReferenceID=1943982 (accessed on 25 April 2022).
  10. de Jesus França, L.C.; Mucida, D.P.; Santana, R.C.; de Morais, M.S.; Gomide, L.R.; de Meneses Bateira, C.V. Ahp Approach Applied to Multi-Criteria Decisions in Environmental Fragility Mapping. Floresta 2020, 50, 1623–1632. [Google Scholar] [CrossRef]
  11. Giamalaki, M.; Tsoutsos, T. Sustainable siting of solar power installations in Mediterranean using a GIS/AHP approach. Renew. Energy 2019, 141, 64–75. [Google Scholar] [CrossRef]
  12. Manfré, L.A.; da Silva, A.M.; Urban, R.C.; Rodgers, J. Environmental Fragility Evaluation and Guidelines for Environmental Zoning: A Study Case on Ibiuna (the Southeastern Brazilian Region). Environ. Earth Sci. 2013, 69, 947–957. [Google Scholar] [CrossRef]
  13. Lee, S. Current and Future Status of GIS-based Landslide Susceptibility Mapping: A Literature Review. Korean J. Remote Sens. 2019, 35, 179–193. [Google Scholar]
  14. Lyu, H.M.; Shen, S.L.; Yang, J.; Zhou, A.N. Risk Assessment of Earthquake-Triggered Geohazards Surrounding Wenchuan, China. Nat. Hazards Rev. 2020, 21, 05020007. [Google Scholar] [CrossRef]
  15. Lyu, H.M.; Shen, J.S.; Arulrajah, A. Assessment of Geohazards and Preventative Countermeasures Using AHP Incorporated with GIS in Lanzhou, China. Sustainability 2018, 10, 304. [Google Scholar] [CrossRef] [Green Version]
  16. Alvares, C.A.; Stape, J.L.; Sentelhas, P.C.; Gonçalves, J.D.M.; Sparovek, G. Köppen’s climate classification map for Brazil. Meteorol. Z. 2013, 22, 711–728. [Google Scholar] [CrossRef]
  17. Vanderlei, G.; Ferreira, O. Paisagens culturais da Bacia do Rio Jequitinhonha, em Minas. Rev. Eletrônica De Geogr. 2013, 5, 2–26. [Google Scholar]
  18. Luciano, J.; Ross, S. Landforms and Environmental Planning: Potentialities and Fragilities. Rev. Do Dep. De Geogr. 2012, 38–51. [Google Scholar]
  19. Software de Mapeamento, G.I.S.; de Localização, I.; Espacial, A. Esri. Available online: https://www.esri.com/pt-br/home (accessed on 25 April 2022).
  20. Macedo Massa, E.; Luciano, J.; Ross, S. Aplicação De Um Modelo De Fragilidade Ambiental Relevo-Solo Na Serra Da Cantareira, Bacia Do Córrego Do Bispo, São Paulo-SP. Rev. Do Dep. De Geogr. 2012, 24, 57–79. [Google Scholar] [CrossRef] [Green Version]
  21. R.I UFVJM: Fragilidade Ambiental Potencial da Bacia Hidrográfica do Rio Jequitinhonha, Minas Gerais, Brasil. Available online: http://acervo.ufvjm.edu.br/jspui/handle/1/1585 (accessed on 25 April 2022).
  22. Saaty, T.L. How to make a decision: The analytic hierarchy process. Eur. J. Oper. Res. 1990, 48, 9–26. [Google Scholar] [CrossRef]
  23. Saaty, T.L. Decision making with the analytic hierarchy process. Int. J. Serv. Sci. 2008, 1, 83–98. [Google Scholar] [CrossRef] [Green Version]
  24. Morandi, D.T.; de Jesus França, L.C.; Menezes, E.S.; Machado, E.L.M.; da Silva, M.D.; Mucida, D.P. Delimitation of ecological corridors between conservation units in the Brazilian Cerrado using a GIS and AHP approach. Ecol. Indic. 2020, 115, 106440. [Google Scholar] [CrossRef]
  25. Saaty, T.L. Some Mathematical Concepts of the Analytic Hierarchy Process. Behaviormetrika 1991, 18, 29. [Google Scholar] [CrossRef]
  26. Nzeyimana, I.; Hartemink, A.E.; Geissen, V. GIS-Based Multi-Criteria Analysis for Arabica Coffee Expansion in Rwanda. PLoS ONE 2014, 9, e107449. [Google Scholar] [CrossRef] [PubMed]
  27. Rodríguez-Merino, A.; García-Murillo, P.; Fernández-Zamudio, R. Combining multicriteria decision analysis and GIS to assess vulnerability within a protected area: An objective methodology for managing complex and fragile systems. Ecol. Indic. 2020, 108, 105738. [Google Scholar] [CrossRef]
  28. Liu, S.; Li, W. Zoning and management of phreatic water resource conservation impacted by underground coal mining: A case study in arid and semiarid areas. J. Clean. Prod. 2019, 224, 677–685. [Google Scholar] [CrossRef]
  29. Lal, R. Degradation and Resilience of Soils. Philos. Trans. R. Soc. B Biol. Sci. 1997, 352, 997. [Google Scholar] [CrossRef]
  30. Castro, S.S.; de Hernani, L.C. Solos Frágeis: Caracterização, Manejo e Sustentabilidade. Portal Embrapa. Available online: https://www.embrapa.br/busca-de-publicacoes/-/publicacao/1039217/solos-frageis-caracterizacao-manejo-e-sustentabilidade (accessed on 25 April 2022).
  31. Cruz, B.B.; Manfré, L.A.; Ricci, D.S.; Brunoro, D.; Appolinario, L.; Quintanilha, J.A. Environmental fragility framework for water supply systems: A case study in the Paulista Macro Metropolis area (SE Brazil). Environ. Earth Sci. 2017, 76, 3–13. [Google Scholar] [CrossRef]
  32. Agência Embrapa de Informação Tecnológica-Argissolos. Available online: http://www.agencia.cnptia.embrapa.br/gestor/solos_tropicais/arvore/CONTAG01_7_2212200611538.html (accessed on 25 April 2022).
  33. de Alvarenga Yoshida, F.; Stolf, R. Environmental fragility based on the spatial distribution of soil resistance for the en-vironmental protection area (EPA) of Botucatu, Sao Paulo, Brazil. Holos Environ. 2019, 19, 391–405. [Google Scholar] [CrossRef] [Green Version]
  34. Nilsson, C.; Grelsson, G. The Fragility of Ecosystems: A Review. J. Appl. Ecol. 1995, 32, 677. [Google Scholar] [CrossRef]
  35. Winkler, K.; Fuchs, R.; Rounsevell, M.; Herold, M. Global land use changes are four times greater than previously estimated. Nat. Commun. 2021, 12, 2501. [Google Scholar] [CrossRef]
  36. Taveira, L.R.; Weindorf, D.C.; De Menezes, M.D.; de Carvalho, T.S.; Da Motta, P.E.F.; Teixeira, A.F.D.S.; Curi, N. Land use capability classification adaptation in low and intermediate technology farming systems: A soil erosion indicator. Soil Use Manag. 2021, 37, 164–180. [Google Scholar] [CrossRef]
  37. Lowe, M.A.; McGrath, G.; Leopold, M. The Impact of Soil Water Repellency and Slope upon Runoff and Erosion. Soil Tillage Res. 2021, 205, 104756. [Google Scholar] [CrossRef]
  38. Zambon, N.; Johannsen, L.L.; Strauss, P.; Dostal, T.; Zumr, D.; Cochrane, T.A.; Klik, A. Splash erosion affected by initial soil moisture and surface conditions under simulated rainfall. Catena 2021, 196, 104827. [Google Scholar] [CrossRef]
  39. Derakhshan-Babaei, F.; Nosrati, K.; Tikhomirov, D.; Christl, M.; Sadough, H.; Egli, M. Relating the spatial variability of chemical weathering and erosion to geological and topographical zones. Geomorphology 2020, 363, 107235. [Google Scholar] [CrossRef]
  40. Silva, A.C.; Horak-Terra, I.; Barral, U.M.; Costa, C.R.; Gonçalves, S.T.; Pinto, T.; Silva, B.P.C.; Fernandes, J.S.C.; Mendonça Filho, C.V.; Vidal-Torrado, P. Altitude, vegetation, paleoclimate, and radiocarbon age of the basal layer of peatlands of the Serra do Espinhaço Meridional, Brazil. J. S. Am. Earth Sci. 2020, 103, 102728. [Google Scholar] [CrossRef]
  41. Base Legislação da Presidência da República-Lei n° 12.651 de 25 de maio de 2012. Available online: https://legislacao.presidencia.gov.br/atos/?tipo=LEI&numero=12651&ano=2012&ato=a48QTVU1kMVpWT59b (accessed on 25 April 2022).
  42. Spröl, C.; Ross, J.L.S. Análise Comparativa da fragilidade ambiental com aplicação de três modelos. GEOUSP-Espaço E Tempo 2004, 8, 39–49. [Google Scholar]
  43. Mapbiomas Brasil. Available online: https://mapbiomas.org/en/collection-release (accessed on 25 April 2022).
  44. de Mello, K.; Taniwaki, R.H.; de Paula, F.R.; Valente, R.A.; Randhir, T.O.; Macedo, D.R.; Leal, C.G.; Rodrigues, C.B.; Hughes, R.M. Multiscale land use impacts on water quality: Assessment, planning, and future perspectives in Brazil. J. Environ. Manag. 2020, 270, 110879. [Google Scholar] [CrossRef]
  45. Morellato, L.P.C.; Silveira, F.A.O. Plant life in campo rupestre: New lessons from an ancient biodiversity hotspot. Flora 2018, 238, 1–10. [Google Scholar] [CrossRef]
  46. Mucina, L. Vegetation of Brazilian campos rupestres on siliceous substrates and their global analogues. Flora 2018, 238, 11–23. [Google Scholar] [CrossRef]
  47. Reflora. Available online: https://reflora.jbrj.gov.br/reflora/PrincipalUC/PrincipalUC.do;jsessionid=E9097EADC1FC672438ECDA3AFA184702 (accessed on 25 April 2022).
  48. Ribeiro, K.T.; Freitas, L. Impactos potenciais das alterações no Código Florestal sobre a vegetação de campos rupestres e campos de altitude. Biota Neotrop. 2010, 10, 239–246. [Google Scholar] [CrossRef] [Green Version]
  49. Schaefer, C.E.; Corrêa, G.R.; Candido, H.G.; Arruda, D.M.; Nunes, J.A.; Araujo, R.W.; Rodrigues, P.; Fernandes Filho, E.I.; Pereira, A.F.; Brandão, P.C.; et al. The physical environment of rupestrian grasslands (Campos Rupestres) in Brazil: Geological, geomorphological and pedological characteristics, and interplays. In Ecology and Conservation of Mountaintop Grasslands in Brazil; Springer: Cham, Switzerland, 2016; pp. 15–54. [Google Scholar]
  50. Análise da Fragilidade Ambiental da Bacia do Ribeirão das Abóboras, em Rio Verde, Sudoeste de Goiás–Dialnet. Available online: https://dialnet.unirioja.es/servlet/articulo?codigo=6069631 (accessed on 25 April 2022).
  51. Karfunkel, J.; Chaves, M.L.S.C.; Svisero, D.P.; Meyer, H.O.A. Diamonds from Minas Gerais, Brazil: An update on sources, origin, and production. Int. Geol. Rev. 2010, 36, 1019–1032. [Google Scholar] [CrossRef]
  52. Sulzbacher, A.W.; Lage, N.; Lopes, L.S. Mineração e questão agrária no Vale do Jequitinhonha. Rev. Campo-Territ. 2020, 15, 400–429. [Google Scholar] [CrossRef]
  53. Fernandes, G.W.; Arantes-Garcia, L.; Barbosa, M.; Barbosa, N.P.; Batista, E.K.; Beiroz, W.; Resende, F.M.; Abrahao, A.; Almada, E.D.; Alves, E.; et al. Biodiversity and ecosystem services in the Campo Rupestre: A road map for the sustainability of the hottest Brazilian biodiversity hotspot. Perspect. Ecol. Conserv. 2020, 18, 213–222. [Google Scholar] [CrossRef]
  54. Fernandes, G.W.; Barbosa, N.P.U.; Alberton, B.; Barbieri, A.; Dirzo, R.; Goulart, F.; Guerra, T.J.; Morellato, L.P.C.; Solar, R.R.C. The deadly route to collapse and the uncertain fate of Brazilian rupestrian grasslands. Biodivers. Conserv. 2018, 27, 2587–2603. [Google Scholar] [CrossRef] [Green Version]
  55. Crepani, E.; Medeiros, J.D.; Hernandez Filho, P.; Florenzano, T.G.; Duarte, V.; Barbosa, C.C.F. Sensoriamento Remoto e Geoprocessamento Aplicados ao Zoneamento Ecológico-Econômico e ao Ordenamento Territorial; Inpe: São José dos Campos, Brazil, 2001. [Google Scholar]
  56. Kidane, M.; Bezie, A.; Kesete, N.; Tolessa, T. The impact of land use and land cover (LULC) dynamics on soil erosion and sediment yield in Ethiopia. Heliyon 2019, 5, e02981. [Google Scholar] [CrossRef] [PubMed] [Green Version]
  57. Miyata, S.; Kosugi, K.; Gomi, T.; Mizuyama, T. Effects of forest floor coverage on overland flow and soil erosion on hillslopes in Japanese cypress plantation forests. Water Resour. Res. 2009, 45, 6402. [Google Scholar] [CrossRef]
  58. Oliveira-Andreoli, E.Z.; de Moraes, M.C.P.; da Silva Faustino, A.; Vasconcelos, A.F.; Costa, C.W.; Moschini, L.E.; Melanda, E.A.; Justino, E.A.; Di Lollo, J.A.; Lorandi, R. Multi-temporal analysis of land use land cover interference in environmental fragility in a Mesozoic basin, southeastern Brazil. Groundw. Sustain. Dev. 2021, 12, 100536. [Google Scholar] [CrossRef]
  59. Campos, J.A.; Aires, U.R.V.; da Silva, D.D.; Calijuri, M.L. Environmental fragility and vegetation cover dynamics in the Lapa Grande State Park, MG, Brazil. An. Da Acad. Bras. De Ciências 2019, 91. Available online: http://www.scielo.br/j/aabc/a/hmcZ6GYy97wQKrHqznXmKGs/abstract/?lang=en (accessed on 25 April 2022). [CrossRef]
  60. Wang, X.D.; Zhong, X.H.; Liu, S.Z.; Liu, J.G.; Wang, Z.Y.; Li, M.H. Regional assessment of environmental vulnerability in the Tibetan Plateau: Development and application of a new method. J. Arid. Environ. 2008, 72, 1929–1939. [Google Scholar] [CrossRef]
  61. Xiaodan, W.; Xianghao, Z.; Pan, G. A GIS-based decision support system for regional eco-security assessment and its application on the Tibetan Plateau. J. Environ. Manag. 2010, 91, 1981–1990. [Google Scholar] [CrossRef]
  62. Panagos, P.; Christos, K.; Cristiano, B.; Ioannis, G. Seasonal monitoring of soil erosion at regional scale: An application of the G2 model in Crete focusing on agricultural land uses. IJAEO 2014, 27, 147–155. [Google Scholar] [CrossRef]
  63. Panagos, P.; Borrelli, P.; Meusburger, K.; Alewell, C.; Lugato, E.; Montanarella, L. Estimating the soil erosion cover-management factor at the European scale. Land Use Policy 2015, 48, 38–50. [Google Scholar] [CrossRef]
  64. Lu, C.Y.; Gu, W.; Dai, A.H.; Wei, H.Y. Assessing habitat suitability based on geographic information system (GIS) and fuzzy: A case study of Schisandra sphenanthera Rehd. et Wils. in Qinling Mountains, China. Ecol. Model. 2012, 242, 105–115. [Google Scholar] [CrossRef]
  65. Zhou, X.; Zhao, M.; Zhou, L.; Yang, G.; Huang, L.; Yan, C.; Huang, Q.; Ye, L.; Zhang, X.; Guo, L.; et al. Regionalization of Habitat Suitability of Masson’s Pine based on geographic information system and Fuzzy Matter-Element Model. Sci. Rep. 2016, 6, 34716. [Google Scholar] [CrossRef] [Green Version]
  66. Gharizadeh Beiragh, R.; Alizadeh, R.; Shafiei Kaleibari, S.; Cavallaro, F.; Zolfani, S.H.; Bausys, R.; Mardani, A. An integrated multi-criteria decision making model for sustainability performance assessment for insurance companies. Sustainability 2020, 12, 789. [Google Scholar] [CrossRef] [Green Version]
  67. Randhir, T.; Shriver, D.M. Deliberative valuation without prices: A multiattribute prioritization for watershed ecosystem management. Ecol. Econ. 2009, 68, 3042–3051. [Google Scholar] [CrossRef]
  68. Rose, D.C.; Wheeler, R.; Winter, M.; Lobley, M.; Chivers, C.A. Agriculture 4.0: Making it work for people, production, and the planet. Land Use Policy 2021, 100, 104933. [Google Scholar] [CrossRef]
Figure 1. Location of the study area in the context of the biomes of Brazil (A) and the state of Minas Gerais (B). Altimetry of the Jequitinhonha River Hydrographic Basin (JRHB) and the main tributaries and border basins (C).
Conservation 02 00024 g001
Figure 2. Landscape features of the Jequitinhonha River Hydrographic Basin, Brazil. (ac) feature of the rocky outcrops and the “Campos Rupestres” of the Upper Jequitinhonha; (df) the areas of the Upper Jequitinhonha with eucalyptus forests; (g) sloping area of the Upper/Middle Jequitinhonha as well as the forests on the upland or plateau areas and the agricultural areas on the slopes; (h) sloping site in the Upper/Middle Jequitinhonha areas, which experiences problems related to erosion processes caused by the highways installed on top of the hill; (i) local livestock activity in the Low Jequitinhonha area; (jm) the semiarid zone between the Middle/Low Jequitinhonha areas that experience intense anthropic use; (n) and (o) sloping areas with low or no vegetation cover; (p) rocky outcrops; (q) and (r) ornamental rock mining activity in the Low Jequitinhonha area; (s) and (t) human-influenced forested areas in the Low Jequitinhonha area.
Conservation 02 00024 g002
Figure 3. Information plans used in the algebra maps for the potential and emergent environmental fragility of the Jequitinhonha River Hydrographic Basin. Layers (A) slope; (B) geological domains; (C) river hierarchy; (D) soil classes; (E) average annual precipitations and (F) land use and cover.
Conservation 02 00024 g003
Figure 4. Flowchart of the methodological procedures for analyzing the potential and emerging environmental fragility.
Conservation 02 00024 g004
Figure 5. (A) PEF (potential environmental fragility) and (B) EEF (emerging environmental fragility) maps of the Jequitinhonha River Hydrographic Basin, Brazil.
Conservation 02 00024 g005
Table 1. Databases, acquisition sources, and methods applied to the data set.
Geo-Spatial Data LayersDatabaseData Type or Method
Digital Elevation Model (DEM/SRTM)Earth Explorer (USGS) (https://earthexplorer.usgs.gov/)
(accessed on 2 March 2018)
Raster
Soil Classes 1State Environment Foundation (FEAM) (http://idesisema.meioambiente.mg.gov.br/)
(accessed on 2 March 2018)
Polygons
Geological DomainsGeological Survey of Brazil (CPRM)
(http://www.cprm.gov.br/en/)
(accessed on 2 March 2018)
Polygons
Rainfall 2Rainfall atlas (CPRM)
(http://www.cprm.gov.br/en/)
(accessed on 2 March 2018)
Inverse Distance Weighted (IDW)
Fluvial HierarchyDerived from the DEM/SRTM
(https://earthexplorer.usgs.gov/)
(accessed on 2 March 2018)
Strahler method
Land Use Land Cover 3MapBiomas
(https://mapbiomas.org/)
(accessed on 23 January 2020)
Raster
1 Converted to international nomenclature; 2 Isoietas of Average Annual Precipitations between 1977 and 2006; 3 base year 2018.
Table 2. Fragility classes and their respective weights and descriptions. Adapted from [6,12,18,21].
ClassCoefficientDescription
Low1High potential for resilience and dynamic balance.
Slightly Low2Stable morphodynamical conditions in the landscape with at least one environmental characteristic not included in low/weight 1 class.
Medium3Fragility in the transition from the lower to the upper classes; an alert category for the risk of environmental degradation. They have moderate restrictions on the use of natural resources and anthropic use. Some of the analyzed parameters determine this level of fragility.
High4High restrictions on the use of natural resources and land; more susceptible to forms of degradation than class 3. A combination of conditioning factors determines this level of environmental fragility, and careful evaluations are required before implementing any enterprise or anthropic interventions to minimize the impact and prioritize conservation or protection.
Extremely High5Unstable areas with extreme environmental sensitivity. They have severe restrictions on the use of natural resources and land. The combination of biogeophysical or morphodynamical parameters can lead to soil erosion and environmental degradation. These areas are of relevant interest to forest conservation and biodiversity.
Table 3. Informative auxiliary table with a description of the abbreviations used in the study.
AbbreviationDescription
PEFPotential Environmental Fragility
EEFEmergent Environmental Fragility
AHPAnalytic Hierarchy Process
MCAMulti-Criteria Analysis
WLCWeighted Linear Combination
CRConsistency Ratio
CIConsistency Index
RIRandom Index
JRHBJequitinhonha River Hydrographic Basin
Table 4. Classes and weights for the environmental fragility in the Jequitinhonha River Hydrographic Basin according to different criteria and sub-criteria.
Environmental Fragility Classes Criteria and Sub-Criteria
Slope Degree 1 (%)Geological DomainsRiver Hierarchy (Orders)2 Soil Classes3 Rainfall (mm)4 Land Use Cover
(1) Low0–6Granitoids; gneisses; deformed granitoids5 st, 6 st, 7 stRed oxisols800–899
899–999
Forest formation
(2) Slightly Low6–12Gneisses and migmatites; metasedimentary and metavolcanic rocks---Yellow and red-yellow oxisols---Other non-forest natural formations
(3) Medium12–20(Meta) sedimentary rocks3 st, 4 stYellow-red ultisols999–1098Forest plantations; savanna formations; annual and perennial crops; semi-perennial crops
(4) High20–30Detrital lateritic covers2 stAlfisols; haplic inceptisols1098–1198
1198–1300
Pastures; mosaics of agricultural areas and pastures
(5) Extremely High>30---1 stRed ultisols; lithic entisols; rocky outcrops---Rocky outcrops; mining; urban infrastructure; grassland; other non-vegetated areas
(---) No occurrence; (st) Represents the orders of the drainage hierarchy. 1 slope degree: adapted from [6,18]; 2 soil classes: adapted from [6,18,32]; 3 rainfall (mm): adapted from [18]; 4 land use land cover. Adapted from [6,18,33].
Table 5. Pairwise comparison matrix between the indicators of the Jequitinhonha River Hydrographic Basin.
C1C2C3C4C5C6EIGENVECTORANV.
C11629543.6040%
C21/711/751/51/30.445%
C31/3719332.4027%
C41/91/51/911/91/70.182%
C51/551/39131.4416%
C61/531/371/310.8810%
Sum (∑)1.9922.203.9240.009.6411.488.93100%
Criteria nomenclature: C1: land use land cover; C2: soil classes; C3: slope; C4: geological domains; C5: rainfall; C6: river hierarchy. (A.N.V = auto-normalized vector or weights of importance).
Table 6. Criteria (n) and weight coefficients in priority hierarchy obtained after AHP implemntation.
Order of ImportanceCriteria (n)Weight wijPriority Importance Scale
1Land Use Land Cover0.4040%
2Slope0.2727%
3Rainfall0.1616%
4Fluvial Hierarchy0.1010%
5Soil Classes0.055%
6Geological Domains0.022%
Table 7. Area and percentage of (A) PEF classes and (B) EEF classes.
Fragility Classes(A) PEF(B) EEF
Area (km2)Percentage (%)Area (km2)Percentage (%)
Low12,430.5719.381646.902.57
Slightly Low18,540.9328.9021,399.1433.36
Medium19,244.0730.0034,503.5553.78
High10,519.6316.406305.459.83
Extremely High3416.155.33296.270.46
Total 64,151.3510064,151.35100
Table 8. Emerging environmental fragility classes; degradation risk and susceptibility scenarios; recommendations/proposals for conservation, recovery, and sustainable land use.
EEF(A)(B)
Degradation Risk/
Susceptibility
Resilience
DescriptionRecommendations
LowResistant
(very resistant to stress and stable)
Highly resilient(1) Suitable for anthropic land use and observations of the land use capability
(2) Areas of rapid recovery/regeneration
(3) Conservation of existing plant/forest remnants
Slightly LowSlight
(stress resistant and stable)
Resilient(1) Suitable for anthropic land use and observations of the land use capability
(2) Conventional recovery techniques with appropriate management
(3) Conservation of existing plant/forest remnants
MediumModerate
(susceptible to stress, with the transition from stable to unstable)
Moderately resilient(1) Requires attention to anthropic land use; preferably agricultural and silvicultural minimum cultivation
(2) Correct pasture management
(3) Recovery through techniques and the induction of natural regeneration
HighHigh
(highly susceptible to stress and unstable)
Slightly or low resilience(1) Priority for conservation and/or restoration
(2) Reforestation with native species in riparian forests with streams and around anthropized springs
(3) Slowly recoverable, even with land-use changes
(4) Use of conservationist practices in anthropic land-use activities. Areas in use should prioritize family farming
Extremely HighExtreme
(extremely susceptible and fragile)
Low or no resilience(1) Areas for the conservation and protection of natural vegetation, especially in the Espinhaço Range Biosphere Reserve
(2) Effective recovery unlikely, even with a change in land use
(3) Strict application of the Forest Code for PPA 1 of sloping land, hilltops, riverbanks, and springs
(4) Priorities for the implementation of conservation units
1 PPA: permanent preservation areas [41].
Publisher’s Note: MDPI stays neutral with regard to jurisdictional claims in published maps and institutional affiliations.

