Article

Landscape Characteristics Affecting Small Mammal Occurrence in Heterogeneous Olive Grove Agro-Ecosystems

1
Departamento de Biologia, Universidade de Évora, Pólo da Mitra, 7002-554 Évora, Portugal
2
CIBIO—Centro de Investigação em Biodiversidade e Recursos Genéticos, InBIO Laboratório Associado, Campus de Vairão, Universidade do Porto, 4485-661 Vairão, Portugal
3
BIOPOLIS Program in Genomics, Biodiversity and Land Planning, CIBIO, Campus de Vairão, 4485-661 Vairão, Portugal
4
Laboratório de Ecologia Aplicada, CITAB—Centro de Investigação e Tecnologias Agroambientais e Biológicas, Universidade de Trás-os-Montes e Alto Douro, 5001-801 Vila Real, Portugal
5
MED—Instituto Mediterrâneo para a Agricultura, Ambiente e Desenvolvimento, Unidade de Biologia da Conservação, Universidade de Évora, Pólo da Mitra, Apartado 94, 7002-554 Évora, Portugal
*
Author to whom correspondence should be addressed.
Conservation 2022, 2(1), 51-67; https://doi.org/10.3390/conservation2010005
Submission received: 19 November 2021 / Revised: 4 January 2022 / Accepted: 5 January 2022 / Published: 10 January 2022

Abstract

:
Understanding how small mammals (SM) are associated with environmental characteristics in olive groves is important to identify potential threats to agriculture and assess the overall conservation value and functioning of agro-ecosystems. Here, we provide first insights on this topic applied to traditional olive groves in northeast (NE) Portugal by assessing the landscape attributes that determine SM occurrence, focusing on one species of conservation concern (Microtus cabrerae Thomas 1906) and one species often perceived as a potential pest of olives (Microtus lusitanicus Gerbe 1879). Based on SM genetic non-invasive sampling in 51 olive groves and surrounding habitats, we identified seven rodent species and one insectivore. Occupancy modelling indicated that SM were generally less detected within olive groves than in surrounding habitats. The vulnerable M. cabrerae reached a mean occupancy (95% CI) of 0.77 (0.61–0.87), while M. lusitanicus stood at 0.37 (0.24–0.52). M. cabrerae was more likely to occur in land mosaics with high density of agricultural field edges, while M. lusitanicus was more associated with high density of pastureland patches. Overall, our study suggests that the complex structure and spatial heterogeneity of traditionally managed olive grove agro-ecosystems may favor the occurrence of species-rich SM communities, possibly including well-established populations of species of conservation importance, while keeping potential pest species at relatively low occupancy rates.

1. Introduction

Over the past century, the transition from traditional to intensive agriculture has caused drastic changes in the environmental conditions of agricultural landscapes [1,2], being associated with a fast decline in agro-ecosystems biodiversity [3,4]. In the Mediterranean region, for instance, traditional olive farming has been considered a crucial agricultural system due to its environmental, cultural and socio-economic importance [5,6,7]. However, in recent decades, there has been an increasing intensification in olive farming in many regions, with olive groves tending to be much larger and with less ground vegetation than traditional orchards [8,9,10]. This results in more homogeneous and simplified landscapes that likely support much lower biodiversity levels [11,12,13]. Therefore, understanding the basic relationships between landscape spatial heterogeneity and biodiversity under more extensively managed agricultural landscapes, such as traditional olive farming systems, is of major importance for sustainable agricultural development [14,15].
Small mammals (Rodentia and Eulipotyphla) are considered keystone species in agro-ecosystems [16], including olive groves, where they play crucial ecological functions promoting plant community productivity and diversity, including soil aeration, organic turn-over and mineralization, seed dispersal, and the maintenance of ectomycorrhizal fungi (e.g., [17]). Small mammals also contribute to support trophic networks, for instance, by consuming insects [18] and by affecting the diversity of higher trophic levels as prey species for mammalian and avian predators [19,20,21]. However, small mammals may also contribute to spreading zoonotic diseases, and in the case of rodents, they may also become agricultural pests (e.g., [17,22,23]). For instance, in fruit tree orchards from southwestern (SW) Mediterranean Europe, species such as Microtus lusitanicus (Gerbe 1879) are often perceived as a potential pest [24], given the damage they may cause to tree roots. These conflicts tend to be more noticeable in more intensive farming systems compared to more traditional farming, in which tree root systems tend to be larger and therefore more resilient to vole attacks [25]. Moreover, more traditional farming systems might allow the occurrence of small mammal species that are more vulnerable to land use intensification, such as Microtus cabrerae (Thomas 1906) [26], thus potentially supporting significantly higher concentration of biodiversity values and related ecosystem services [27]. Understanding how olive grove landscape composition and structure affect small mammals’ occurrence is therefore a main research topic to gain first insights on their ability to provide key ecosystem services and unwanted disservices [17]. However, the elusive and secretive behavior of most small mammal species often challenges their study based on traditional sampling techniques (e.g., life-trapping, telemetry) [28]. This may prevent the completion of basic information on their occurrence patterns, making the use of molecular tools based on non-invasive sampling a suitable and reliable alternative [29,30].
Here, we analyze the landscape characteristics that affect the occurrence of small mammals (Rodentia and Eulipotyphla, excluding Erinaceus europaeus Linnaeus 1758, and Sciurus vulgaris Linnaeus 1758) in Mediterranean olive groves and their surrounding habitats. To do so, we focused on northeast (NE) Portugal olive groves, where traditional agriculture still represents the most common farming system [31]. We focused our approach on M. cabrerae and M. lusitanicus because of their contrasting conservation status and potential to generate conflicts related to olive tree damage. M. cabrerae is an endemic species of the Iberian Peninsula, with a very fragmented distribution across its range [32,33], being currently listed as “Vulnerable” in the Red Book of Portuguese Vertebrates [34] and in the Spanish Atlas and Red Book of Mammals [32]. To our knowledge, damages on fruit tree crops attributed to this species have never been recorded in the literature, probably because of its semi-fossorial habits [26,33], and the fact that it usually occurs at low densities in specific habitats dominated by wet perennial mixed grasses with abundant sedge-rush communities, near small streams, ponds, and agricultural field margins with high soil moisture conditions (e.g., [26,35,36,37,38,39]). M. lusitanicus is an endemic species of southwestern Europe [40] considered of “Least Concern” in both Portuguese and Spanish Red Lists [32,34]. This species has fossorial habits and its presence is easily identified (including by local farmers) from the typical mounds of soil and entrances to burrows [41]. This species occurs in many types of habitats, from open habitats such as meadows and pastures, to agricultural areas such as commercial orchards and irrigated crops [42,43], where, if present at high density, it can be harmful for orchards and crops [44].
Based on genetic non-invasive sampling of the species in selected olive groves and surrounding landscape, we tested the following main hypotheses: (i) small mammals in olive farms are generally less conspicuous within planted olive groves than in surrounding semi-natural habitats (e.g., [45]), and (ii) the complex geometry of different land uses surrounding olive groves critically determines the occurrence of species differing in their conservation status and potential to cause damage to trees (e.g., [46]). Overall, we expect that the highly patchy and heterogeneous mosaics of different land uses associated with olive groves in NE Portugal allow for the occurrence of a rich small mammal community, including relatively high occupancy rates by species of conservation concern, and relatively low occupancy rates by potential pest species.

2. Materials and Methods

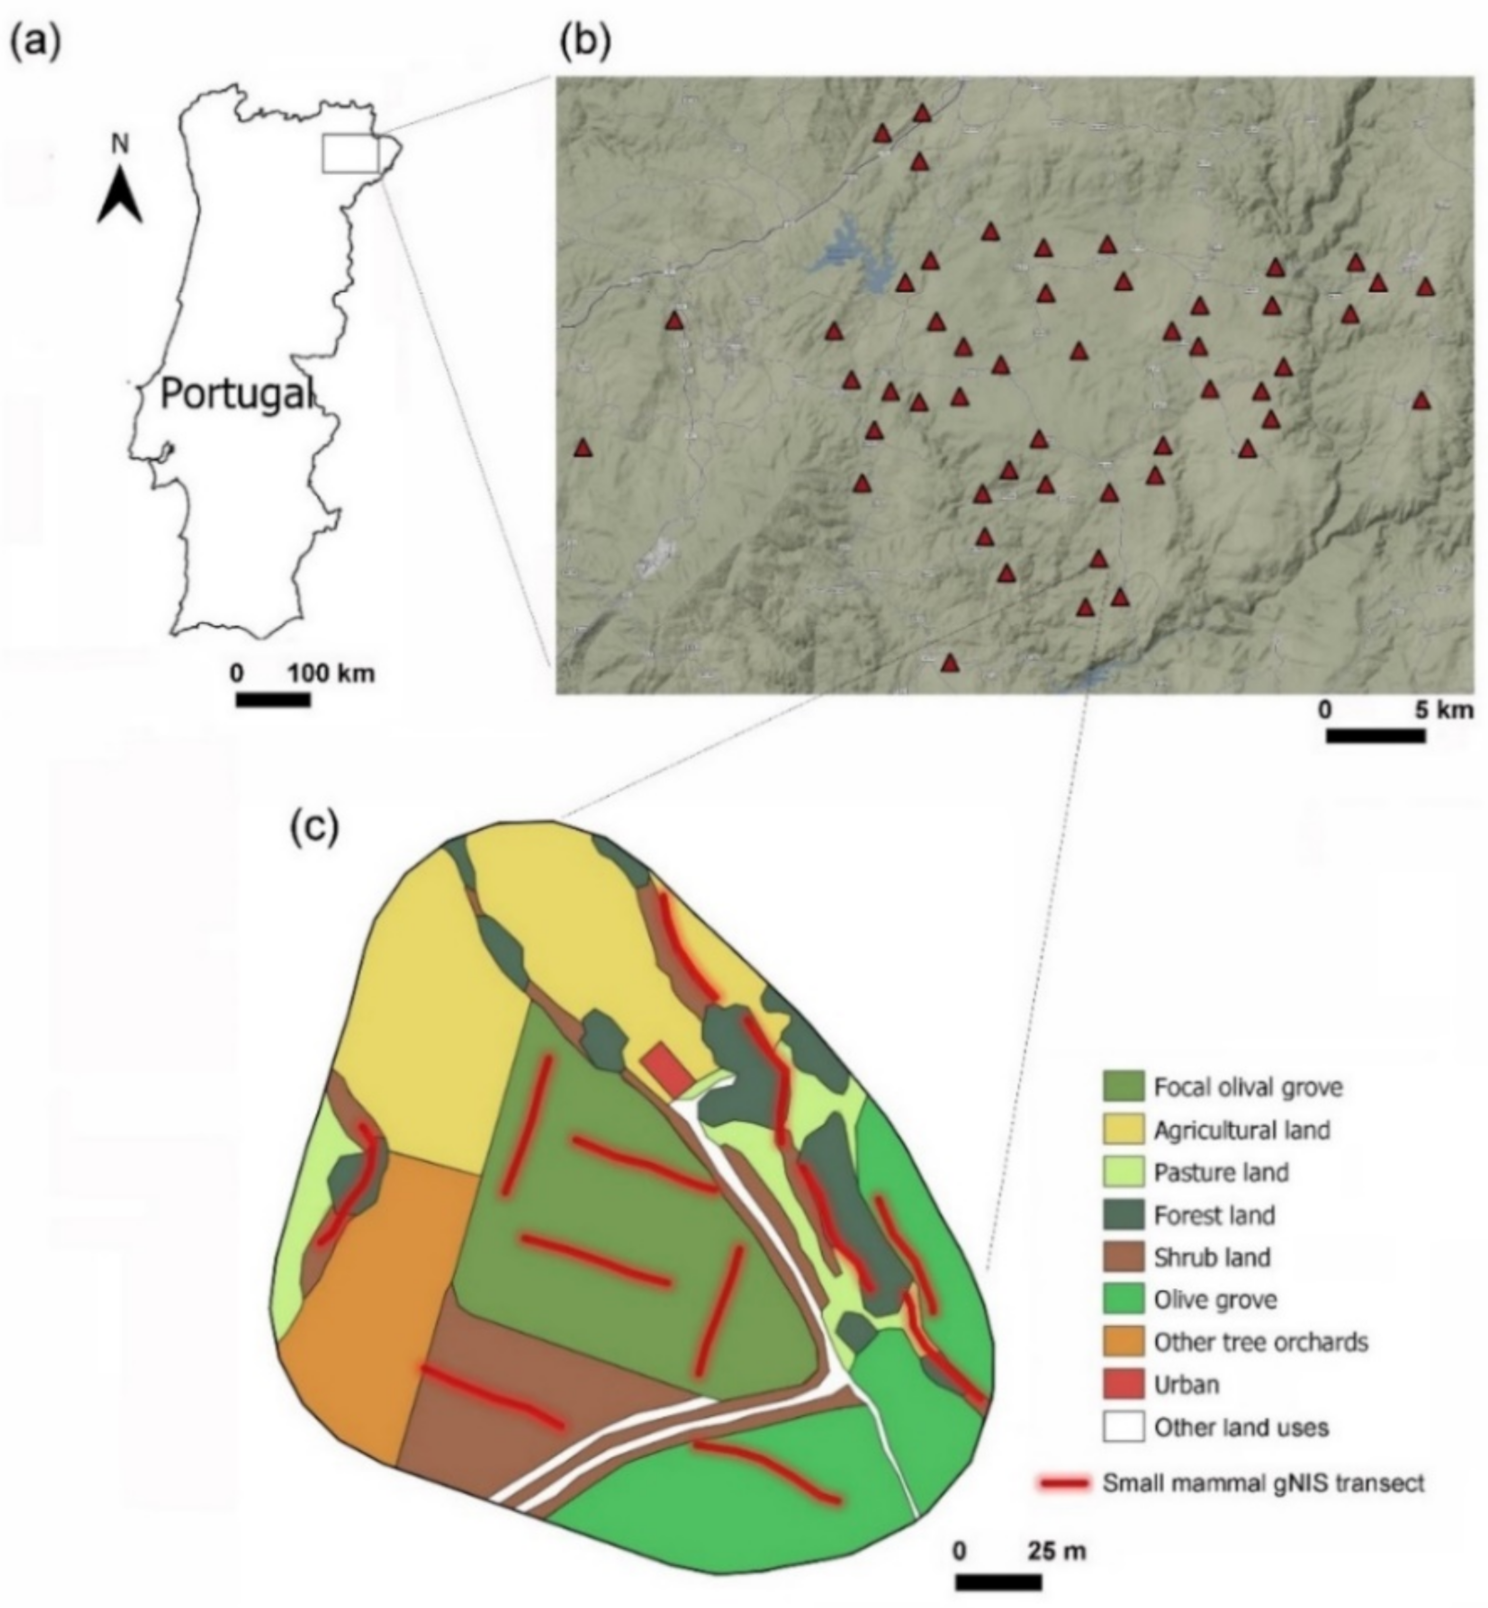
2.1. Study Area and Design

The study was conducted in the Trás-os-Montes region (Figure 1a), located in NE Portugal. Climatically, this region is at the confluence of Atlantic and Mediterranean type environments, which together with the presence of a mountainous system determine the presence of distinct local microclimates, allowing the maintenance of high biodiversity levels across different taxonomic levels [47], as may be the case of small mammals (e.g., [48]). The landscape is largely dominated by olive groves, making the region one of the most important national areas of olive oil production, with the largest number of olive holdings (37,244). These represent ca. 12% to 15% of total olive oil national production, most of which is provided by traditional, low-intensity olive farming, with orchards mainly comprising less than 200 trees per ha, and a low degree of mechanization in harvesting operations [31,49]. The average olive orchard’s area is also small (ca. 1.94 ha), indicating the predominance of very small olive oil producers, most of which also have other enterprises, such as vineyards, or sheep [49]. Therefore, despite the recent trends for more intensive growing systems in a few particular areas (larger fields, higher tree densities and use of chemical fertilizers and herbicides) aiming at higher yield and economic profitability, olive farming in the region is mostly characterized by low-input management systems providing a source of income to the local olive farmers [31].
In order to relate small mammals (Rodentia and Eulipotyphla, excluding Erinaceus europaeus Linnaeus 1758, and Sciurus vulgaris Linnaeus 1758) with landscape characteristics in traditionally managed olive grove agro-ecosystems in NE Portugal, we selected a total of 51 land mosaics corresponding to small farm units operating independently from each other (hereafter sampling units), each centered on a focal olive grove patch, and including its surrounding habitats (50 m buffers around the focal patch) (Figure 1b). The distance among selected sampling units was >1200 m, thereby guarantying their independence, given the typical dispersal distances of small mammal species (e.g., [50,51]). Between May and July 2020, we surveyed sampling units for small mammals based on genetic non-invasive sampling (gNIS). This time interval coincided with the end of the spring, and was considered sufficiently short to offset eventual seasonal differences in species occupancy patterns. Additionally, relevant landscape metrics were extracted from land use mapping based on satellite images and ground surveys (see sections below).

2.2. Small Mammal Genetic Non-Invasive Sampling

Small mammal gNIS in each sampling unit consisted of conducting repeated 40 m long transects for detecting their presence signs and collecting fecal samples for subsequent molecular identification of the species. The number of transects in each sampling unit was defined accordingly to its size (4 transects/ha), ranging between 7 and 19 transects per sampling unit. In each case, about 20% of the transects were located within the focal olive grove patch and about 80% were distributed across the surrounding area, with their location favoring more natural habitats (e.g., field margins, ditch banks, hedgerows), chosen approximately according to the availability of main adjacent land uses (see Figure 1c). Transects were geo-referenced in the field using a GPS device. Each survey was conducted by two observers walking in line along each transect. Eventual observer biases were minimized by thorough training and calibration among observers with different previous experience in small mammal gNIS, and by surveying each transect by at least one experienced observer (J.Q., H.V.-G., J.P. or R.P.). All feces identified in the field as belonging to small mammals were collected into microtubes with alcohol 98%, identified with a sample number. To avoid cross-species contamination, fecal samples were collected preferentially from small latrines, using latex gloves and sterilized sampling material between each sample collection [30,52].

2.3. Molecular Analyses

DNA was extracted from the feces collected using a magnetic-based enzymatic protocol, with Agencourt®AMPure®XP beads (Beckman Coulter Company: Beverly, MA, USA) and Qiagen® Buffer solutions, as described in [53], but with adjusted volumes of ATL solution (400 μL) and Proteinase K (25 μL). The DNA extract obtained was then transferred to two new microplates for long-term storage (40 μL and 30 μL each). DNA extractions were conducted in a physically isolated room, where all the equipment was sterilized with bleach and ethanol and exposed to UV light before and after its usage to maintain conditions to monitor and reduce the risk of DNA contamination [29,54,55]. Negative controls were included in each manipulation. Then, we applied a DNA metabarcoding protocol, which consists of the taxonomic identification of multiple species extracted from a mixed sample (community DNA or environmental DNA), through PCR amplification and sequencing on a high-throughput platform (e.g., Illumina, Ion Torrent) [55]. DNA metabarcoding can complement and overcome the limitations of conventional methods by targeting different species, sampling greater diversity and increasing the resolution of taxonomic identifications [56]. A two-step PCR approach was applied, where in the first PCR amplification, the primer 12S-V5.1F (AGACTGGGATTAGATACCCC) and 12S-V5.1AND2R (TAGAACAGGCTCCTCTAG) were used [57]. Each 10 μL PCR mixture contained 5 μL of HotStart Master Mix (Multiplex PCR Kit, QIAGEN, Hilden, Germany), 0.3 μL of each primer, 3.4 μL ultrapure water and 1 μL of diluted DNA. After an initial denaturation cycle at 95 °C for 15 min, 35 cycles of 30 s at 95 °C, 30 s annealing at 47 °C and 30 s extension at 72 °C were performed, followed by a final elongation at 72 °C for 10 min. Each sample, including extraction negative controls, was replicated three times, and PCR negative controls containing no template DNA were also included. PCR amplicons were then visualized on a 2% agarose gel and the PCR product was purified using AMPure XP beads (to remove primers and primer dimer). A second-round PCR was then performed for attaching the unique dual indexes selected to each sample, using the PCR product diluted ten times [53]. The 14 μL indexing PCR mixture contained 7 μL 2X KAPA HiFi HotStart ReadyMix (Kapa Biosystems, Cape Town, South Africa), 1.4 μL of mixed indexing primer, 2.8 μL ultrapure water and 2.8 μL of diluted first-round PCR product. Indexing thermal cycling conditions were 95 °C for 3 min followed by 10 cycles of 95 °C for 30 s, 55 °C for 30 s and 72 °C for 30 s, with an extension of 72 °C for 5 min. A second PCR clean-up with AMPure XP beads was performed and each sample library was quantified with Epoch and normalized before pooling. The final library was then validated in the TapeStation system (High Sensitivity D1000 ScreenTape Assay) and normalized to 4 nM after quantification in qPCR using KAPA Library Quantification Kit for Illumina platforms. Dual-indexed PCR amplicons were sequenced in an Illumina MiSeq System using one MiSeq V2 500-cycle reagent kit (Illumina, San Diego, CA, USA).

2.4. Bioinformatics

DNA sequence data were processed using the OBITools program suite [58]. First, the paired end reads were aligned and each sequence was assigned to the respective sample. Then, the unaligned sequence records were removed (“obigrep”) and the reads were dereplicated into unique sequences across samples and filtered according to size (95–115 bp reads were kept) and read count (sequences with read counts lower than 10 were removed). To clean sequences from PCR or sequencing errors (sequence variants), we used “obiclean” with a 50% threshold for the abundance ratio.
The resulting exact sequence variants (ESVs) obtained were then compared with two reference libraries for species identification, namely, the CIBIO’s reference database of Iberian small mammals and the reference nucleotide database (NCBI) using BLASTN [59]. Then, the results were condensed to attribute a taxonomic identification to each ESV. Species-level results were attributed to ESVs where a unique species was identified with a percentage equal or higher than 98%. If more than one species showed similar high percentage identities, the ESVs would be assigned to a genus or to a higher taxonomic level. Additionally, when percentage identities were lower than 98%, the ESV was assigned to the taxonomic level that was shared by the most ranked taxa considering the following identity thresholds: ≥95% for Genus; ≥92% for Family or higher taxonomic levels. Assignments produced by the two databases were cross-checked, and the best taxonomic assignment was selected for each sequence. The resulting taxonomic identifications were then merged with the database containing the number of reads per sample. These analyses were performed using the R packages “maptools” [60], “rgdal” [61], “dplyr” [62], “taxonomizr” [63] and “tibble” [64] in R environment [65], using RStudio [66].
Finally, the reads obtained for each taxon per sample were summed, and if a taxon was detected within the negative controls (from extraction and PCR), the number of reads was subtracted in the relevant samples. The sample was considered as identified if only one species was detected, with a minimum of 50 reads (though for ca. 97% of the data, a minimum of 500 reads were obtained). In samples where two or more species were detected, the species with highest read count was considered if the other species were detected with a number of reads lower than 10% of the read count from the highest-valued species. If those species presented a number of reads higher than 10% of the highest-valued species, the sample was considered contaminated.

2.5. Landscape Metrics

Land uses in each sampling unit were mapped as vector layers in QGIS (version 3.10.0, A. Coruña) [67], combining information from satellite images provided by Google Maps, the maps of land uses in NE Portugal COS (Carta de Ocupação de Solos, COS 2018, 2019) available from the General Directorate for Territorial Development (DGT) and field validation (ground truth). Eight main land use classes were initially considered: (i) olive grove (plantations of Olea europaea L. ssp. europaea, including the more or less scattered patches of bare soil and herbaceous vegetation among olive trees); (ii) pasture land (areas of herbaceous vegetation traditionally used for livestock grazing); (iii) shrub land (woody vegetation dominated by shrubs, bushes, and young trees, generally less than 2 m height); (iv) agricultural land (cultivated areas of cereal crops, vegetables and other crops); (v) forest land (areas dominated by mature trees, mostly composed by native Quercus suber L. and Quercus ilex L. ssp. rotundifolia Lam., or occasionally by conifers such as Pinus pinaster Aiton, and/or broad-leaved trees such as Castanea sativa Mill.); (vi) other fruit tree orchards (plantations of Prunus avium L, Prunus dulcis Mill., Juglans regia L., and Malus domestica Borkh.); (vii) urban (human buildings, social areas, isolated farmhouses and infrastructures); and (viii) other land uses (e.g., roads, fences, ponds, small streams).
From the maps produced, we extracted for each sampling unit a set of landscape-level variables focusing on the composition and configuration of those land use classes showing a mean cover of at least 5%. For this, we first converted vector geometries into raster images using the R packages “rdgal” [61] and “raster” [68], considering a pixel size of 1 m. We then used the R package “landscapetools” to visualize the data [69] and the package “landscapemetrics” [70] to estimate for each of these land use classes the percentage of cover (%); the total edge density (m/ha); the density of habitat patches (nr/100 ha); and the normalized landscape shape index (NLSI). The density of edges and habitat patches measure the patchiness of sampling units, with higher values indicating higher patchiness [70]. The NLSI provides a simple measure of class aggregation or clumpiness adjusted for the size of sampling units, with higher NLSI values indicating more dispersed or scattered patches [71]. In addition, we also estimated the richness of land uses, and the Shannon diversity and evenness indices, in these cases considering all initial main land use classes. The Shannon diversity index measures the probability that two patches randomly selected from a sampling unit will belong to the same land use class, while the Shannon evenness index provides information on land use composition, taking the relative abundances of different land uses into account.

2.6. Occupancy Modelling

We used single season, single species occupancy-detection models [72] to first examine how the location of sampling transects affected the detection probability (p) of the species for which a sufficient number of sightings could be obtained. Specifically, we tested whether the detectability of small mammals was lower within olive groves than in surrounding habitats, while assuming occupancy probability (Psi) as constant. Then, we modelled Psi relative to landscape variables with the best submodel structure of p, focusing on species with different conservation status and pest risk potential, and for which naïve occupancy estimates were less than 85% (higher values were considered indicative of lack of variability in occupancy status across sampling units). Candidate variables explaining the occupancy of each species were identified by running single covariate submodels of Psi and comparing model AICc scores with that of the model with no covariates affecting Psi. All covariates were standardized by rescaling their ranges [73]. Single-covariate models with lower AICc than the model with no covariates on Psi were indicative of some support of the included covariate [74]. In that case, the covariate was retained in subsequent analyses. Pearson correlations among supported covariates were then estimated in order to identify those that were highly correlated (|corr| > 0.6, [75]). To avoid multi-collinearity in the multi-model building and selection stages, we implemented the most parameterized model alternatives including different main effect combinations of uncorrelated covariates only. From these, the one resulting in lower AICc scores was retained in subsequent steps. The final candidate model set for each species was built by starting from the best full model and implementing simplified versions including all possible combinations of covariates. The best ranking model was then identified based on AICc (deltaAICc, weighted-AICc) [74]. Model averaging was conducted using the subsample of models exhibiting deltaic < 2 relative to the top-ranked model, if more than one. We used the 5th and 95th percentiles as the lower and upper bounds of effect size estimates to infer on the effects of landscape covariates included in the best model on species occupancy probability. Estimates including 0 were considered as equivocal [74]. All modeling procedures were executed in R environment [66], via RStudio [65], using the R packages “unmarked” [73] and “AICcmodavg” [76]. Finally, to confirm that any potential spatial autocorrelation in occupancy between sampling units had been controlled for in the analysis [77], we conducted Moran’s I tests based on the inverse distance matrix between sampling units as an indicator of proximity, using the package “ape” [78]. We considered the existence of spatial autocorrelation at p < 0.05.

3. Results

3.1. Small Mammal Detection Based on Genetic Non-Invasive Sampling

We surveyed a total of 613 transects across the 51 sampling units, with a mean ± SE (range) of 12 ± 0.38 (7–19) per sampling unit. In each sampling unit, 2.65 ± 0.14 (1–5) of the transects were located within the focal olive grove, and 9.00 ± 0.28 (6–15) were located at surrounding semi-natural areas. Overall, we collected a total of 1953 non-invasive samples of biological material (feces) judged to pertain to small mammals across all 51 sampling units. From these, we were able to identify to the species level 1621 samples, corresponding an overall success rate of 83%. A total of 1% of collected samples were from species of other taxa, identified at different taxonomic resolutions, with a total of 0.75% and 0.25% belonging to birds and reptiles, respectively. Specifically, 0.5% of the samples were identified as belonging to the order Passeriformes, 0.05% to the family Alaudidae (Vigors 1825), and 0.05% to the family Sturnidae (Rafinesque 1815). Samples identified to lower taxonomic levels included the genus Jynx (Linnaeus 1758) (0.05%), the genus Chalcides (Laurenti 1768) (0.1%), and the species Garrulus glandarius Linnaeus 1758 (0.05%), Gallus gallus Linnaeus 1758 (0.05%), Tarentola mauritanica (Linnaeus 1758) (0.1%) and Timon Lepidus (Daudin 1802) (0.05%). Additionally, 5.6% of the samples were contaminated and 10.4% failed.
After collapsing our detection/non-detection data of each small mammal species to the level of each individual transect, we obtained a total of 497 records based on gNIS. Apodemus sylvaticus (Linnaeus 1758) was the species most frequently detected (36.6% of overall detections, in a total of 49 sampling units), followed by Microtus cabrerae (Thomas 1906) (21.3%, in 37 sampling units), Crocidura russula (Hermann 1780) (16.1%, in 42 sampling units), Mus spretus (Lataste 1883) (15.9%, in 39 sampling units), and Microtus lusitanicus (Gerbe 1879) (8.5%, in 18 sampling units). Less frequently detected species were Arvicola sapidus (Miller 1908) (1%), Mus musculus (Linnaeus 1758) (0.4%) and Microtus rozianus (Bocage 1865) (0.2%), detected in three, two and one sampling units, respectively. These species were therefore discarded from the analyses.
Occupancy detection modelling for estimating small mammal detection probability (p) relative to transect position while keeping occupancy (Psi) constant revealed that for all species, estimates of p within olive groves was significantly lower than that estimated in surrounding semi-natural habitats (Table 1 and Table 2). Occupancy probability estimates were equivocal for C. russula, ca. 98% for A. sylvaticus and ca. 87% for M. spretus, followed by M. cabrerae (77%) and M. lusitanicus (37%) (Table 2).

3.2. Landscape Variability

Land uses with mean cover >5% included olive groves, pastures, shrubs and agricultural and forest lands. Olive groves were, by far, the most extensive land use class, with a mean cover percentage higher than 50% and ranging from 11.5% to 100%, while forests were the least representative land use, with a mean value of 6.17%, ranging from 0% to 63.8% (Table 3). In addition, we found high variability in all landscape metrics related to edge, density and aggregation metrics for each of these land uses classes across sampling units. Patch and edge density metrics revealed relatively high patchiness compared to olive groves, pastures and shrubs across most sampling units, in contrast with values found for agricultural and forest lands (Table 3). In general, the values of NLSI showed mostly aggregated patches of land use classes because their mean values are closer to 0 (Table 3). These, together with the high variability observed with regard to diversity and evenness indices (Table 3), suggest high heterogeneity in the geometry and complexity of land mosaic composition and structure across the study area.

3.3. Landscape Effects on Microtus cabrerae and Microtus lusitanicus Occupancy

Based on the results of single covariate models for each species, while keeping the best structure in the detectability submodel (see Table S1 in Supplementary Materials), candidate landscape variables for model building and selection were AgricCover, AgrcEdgeD, AgricPatchD, AgricNLSI and PastNLSI in case of M. cabrerae; and PastCover, PastEdgeD, PastPatchD, OliveNLSI and ForestNLSI in case of M. lusitanicus. Because AgricCover, AgricEdgeD and AgricPatchD were highly correlated (see Table S2 in Supplementary Materials), three alternative versions of a full model for M. cabrerae were initially implemented, each including one of these variables at the time, together with the uncorrelated variables (AgricNLSI and PastNLSI) (see Table S4 in Supplementary Materials). From these models, the one including AgricEdgeD, AgricNLSI and PastNLSI showed the lowest AICc score (Table S4 in Supplementary Materials) and was therefore considered in remaining model building and selection procedures. On the other hand, high correlations were also found among PastCover, PastEdgeD and PastPatchD (see Table S3 in Supplementary Materials), resulting in three alternative full models for M. lusitanicus (Table S4). From these, the model including PastPatchD, OliveNLSI and ForestNLSI showed a lower AICc than competing alternatives (Table S4 in Supplementary Materials), therefore being the model considered in subsequent analytical steps.
Model building and selection revealed that among the seven final candidate models for M. cabrerae, the model including the additive effects of AgricEdgeD and PastNLSI received the highest support, being the first ranking model, with an AICc more than 2 units below that of the second ranked model (Table 4). This model had a higher probability of being the best approximating model describing the data, given the candidate set of models considered, and was therefore taken as the best model for M. cabrerae. The model suggested that M. cabrerae occupancy in NE Portugal increases with the density of agricultural edges, tending to decrease where pastures are more dispersed and scattered (Table 5). As for M. lusitanicus, model building and selection revealed that among the seven final candidate models for explaining this species occupancy, the model including the additive effects of PastPatchD and OliveNLSI was the best ranked model. However, there was also high support for more four candidate models, with deltaAICc < 2 relative to the top ranked model (Table 4). In this case, model average estimates of landscape effects included in each of these competing models revealed that occupancy by M. lusitanicus increased with the density of pasture habitats, tending to decrease where olive grove patches are more disaggregated across the landscape, and where forests are more clumped (Table 5). Overall, we found no evidence for spatial autocorrelation in occupancy patterns of both M. cabrerae and M. lusitanicus, with very low and non-significant observed Moran’s I values (I = 0.01, p = 0.22 and I = 0.01, p = 0.16, respectively).

4. Discussion

Understanding biodiversity patterns in agro-ecosystems is a main goal to improve conservation management, particularly in areas where farming practices tend to shift from traditional subsistence systems to market-oriented agriculture, primarily aiming at increasing agricultural productivity [79]. Regarding small mammals, studies aiming to assess species occurrence patterns in agro-ecosystems have been mostly based on the habitat level, while fewer have emphasized the landscape scale (e.g., [80,81]). Our study, based on small mammal genetic non-invasive sampling across olive grove agro-ecosystems in NE Portugal, showed that the high heterogeneity in the cover and geometry of different land uses across the region allows for the occurrence of a rich small mammal community at the landscape scale, supporting the idea that spatial diversity and variability in habitat composition and structure increases mammal species richness (e.g., [82]). This was particularly noticeable among rodents, for which a total of seven out of the eight burrowing species predicted for the region [48] were confirmed to occur (only Rattus rattus Linnaeus 1758 remained undetected). The small mammals identified included species differing in their conservation status and pest risk potential perceived by local farmers. This suggests that the complex land mosaics, mostly resulting from the still predominating traditional farming in the region [31], should provide a high diversity of micro-habitats that allow the coexistence of different small mammal species, even those that might in some way overlap in their niches, such as voles (family Arvicolinae Gray 1821), which are often associated with marginal grassland habitats in agro-ecosystems [45]. It is, therefore, likely that the high spatial heterogeneity and landscape patchiness of NE Portugal olive grove agro-ecosystems might provide opportunities for multiple species to spatially segregate and locally coexist under equilibrium [83].
According to our predictions, small mammal activity signs (mainly feces) were, in general, more conspicuous in semi-natural habitats surrounding olive groves than within olive groves. This suggests that small mammals in traditionally managed agro-ecosystems dominated by small olive farms might be largely restricted to less disturbed marginal habitats, avoiding areas where human intervention is relatively higher. This might be indicative of a general low potential for crop damage by the species in the study region, which is also supported by the relatively low occupancy rates predicted for Microtus lusitanicus (Gerbe 1879), the species that is often perceived by farmers as a potential pest of olive trees [25,44]. According to our predictions, the probability of occupancy by this species increased with the density of pasture habitats, which is, in general, consistent with previous literature showing the association of this species to open habitats, such as meadows or pastures (e.g., [40,48]). In addition, there was some tendency for higher occupancy probability where olive patches were more clumped and where forest patches were more disaggregated, which suggests that eventual expansion of olive farming into surrounding semi-natural habitats (landscape homogenization) might create favorable conditions for an eventual predominance of M. lusitanicus, via reduced competition or predation pressures [83], which could increase their damage potential at olive groves. On the other hand, our results also indicated relatively high occupancy rates by Microtus cabrerae (Thomas 1906), suggesting that agro-ecosystems in NE Portugal might support well-established populations of this vulnerable species [48], thus highlighting its high value in terms of conservation. In particular, the occupancy of M. cabrerae increased with the density of agricultural edges, which is consistent with the existing literature associating this species with wet herbaceous vegetation cover that typically occurs along agricultural field margins [35]. In addition, there was some tendency for higher occupancy estimates where pastures were more aggregated, which agrees with the idea that this land use might favor landscape connectivity for this species in farmed areas [26]. Also of note is the presence of Arvicola sapidus (Miller 1908), which is globally considered as “Vulnerable” in the IUCN Red List [84], and Microtus rozianus (Bocage 1865), a recently described, range-restricted species, previously considered as Microtus agrestis (Linnaeus 1761) [85]. Overall, therefore, our study suggests that spatial heterogeneity in olive grove agro-ecosystems should be key to the occurrence of either rare and specialist species, or more common and generalist species, thus contributing to the maintenance of high biodiversity levels. Specifically, the maintenance of spatially complex and variable mosaics of different land uses (including forest patches of Quercus suber L., Quercus ilex L. subsp. rotundifolia Lam., and Pinus pinaster Aiton, mixed with open pastures and agricultural fields with cereal crops, vineyards, and other tree-fruit orchards), together with more natural areas kept undisturbed for some time (e.g., marginal grassland habitats, shrub lands), should be of critical importance to support a high number of small mammal species at the landscape and regional scales. This should include species with different biological traits (e.g., fossorial, semi-fossorial and surface-dwelling species), habitat preferences (e.g., open grassland, woody, freshwater habitats) and conservation importance (e.g., threatened, least concern), as shown in our study.
While our results provide support for a high small mammal richness occurring in NE Portugal olive grove agro-ecosystems, the recent trends in olive farming intensification [12] raises relevant conservation concerns, as they might compromise the existing ecological equilibrium, e.g., by favoring the predominance of a single potential pest species [86]. Decreases in biodiversity levels and ecosystem functioning have been observed in other Mediterranean regions where olive groves are more intensively managed, particularly among bats [8], birds [87], invertebrate species [88] and plants [89]. Therefore, preserving the more traditional farming practices in NE Portugal olive groves should be crucial to guarantee the provision of food, shelter and protection for many small mammal species, as well as their predators, thus contributing to overall ecosystem health [90,91]. Reverting the current trends of olive farming intensification is, however, a major conservation challenge, as the international competition in the olive oil sector, which is increasingly dominated by the use of fully mechanized, intensive cultivation methods of high performance at low costs, makes it hard for small producers to retain their position in the market [92]. Therefore, the conservation of traditional olive groves may require compensation measures and policies involving incentive agreements, such as crop insurance, and the development of accurate mechanisms for biodiversity-friendly crop certification, so that agents of the sector become more willing to maintain the important social, economic and environmental value of more traditional olive grove systems [93].
We acknowledge that more research focusing on more detailed demographic parameters (e.g., population size) and on seasonality effects is needed to fully understand the processes driving small mammal populations and community structuring, and the overall conservation value and resilience of NE Portugal olive groves relative to small mammals’ community. In the context of non-invasive sampling methods, this would require the use of genetic markers for individual identification (e.g., [30,52,94]), and would certainly benefit from the use of complementary sampling techniques providing additional sources of DNA, such as hair trapping [95]. Likewise, detailed data on site-specific management operations (e.g., plowing, planting, grazing, selective irrigation and fertilization, use of rodenticides or traps for small mammals) would also provide critical information to improve our understanding of the local impacts of agricultural practices on small mammal populations. In our study, however, such data could not be systematically assessed due to the restrictions related to coronavirus pandemic during the study period, which prevented us from conducting direct interviews with local farmers about current and past management practices at each olive grove. Furthermore, the assessment of possible competition-based mechanisms of population regulation involving potential pest species would provide important insights on the likely value of a rich small mammal community in providing ecosystem services, such as bio-control services (e.g., [96]). To our knowledge, no study has ever documented interspecific interactions between M. cabrerae and M. lusitanicus. While the use of multispecies occupancy modelling could have provided important first insights on such interactions, our sample size did not allow the implementation of such models, given the relatively high number of parameters involved. Despite these limitations, however, we believe that this study provides a relevant contribution to improve our knowledge on how the landscape characteristics that determine the occurrence of small mammals in olive grove ecosystems for NE Portugal. Moreover, our study also highlights the utility of non-invasive genetic sampling methods at the landscape scale for informing and improving agro-ecosystem management towards more biodiverse and healthy environments (e.g., [54,97]). Importantly, our results suggest that traditional olive farming maintaining a complex matrix of small patches of crops interspersed with other land uses should provide ideal conditions to guarantee the continued coexistence of small mammals with different biological and ecological traits in NE Portugal, thus probably resulting in a more diverse community [98], likely to provide important ecosystem services contributing to the long-term sustainability of olive farming in the region (e.g., [90]).

5. Conclusions

Olive grove agro-ecosystems represent at present one of the most important woody crops in Europe, holding particularly high social, economic and cultural value in Mediterranean countries [7]. However, the recent expansion and intensification of olive farming in many regions have been associated with critical declines in biodiversity and related ecosystem services [10]. Building on our biodiversity knowledge base in traditionally managed olive grove agro-ecosystems is therefore a key requirement to enhance the effectiveness of strategic management planning aiming at the retention of ecological functions and resilience of these systems [15]. Regarding small mammals, our study constitutes a first step towards this main goal, providing important insights into how species may relate to landscape characteristics in traditionally managed olive grove agro-ecosystems in NE Portugal. Based on genetic non-invasive sampling, we showed that low-input management systems may hold a relatively high species richness, particularly among ground-dwelling rodents. This likely resulted from the predominance of small-sized patches and the complex geometries of different land uses surrounding olive groves, which should favor the coexistence of different small mammal species, possibly including well-established populations of species with conservation importance, while keeping low occupancy rates of species that are known to cause damages on tree crops. We thus conclude that maintaining a rich community of small mammals in olive groves, together with a low risk of crop damage by potential pests, should require the retention of highly patchy and heterogeneous mosaics of different land uses, together with semi-natural areas with minimum anthropogenic disturbance. Such spatial variability in landscape composition and structure should provide a wide range of niches for multiple species differing in their biological and ecological traits, thus contributing to increased biological diversity and therefore, overall ecosystem functioning. Although more studies focusing on detailed demographic parameters and species interactions are needed to fully understand small mammal occurrence and their relationship with ecosystem functioning and services in olive groves, our study supports the view that despite largely neglected in biodiversity assessments [16], small mammals should provide a useful indicator group to assess high-functioning biodiversity and ecosystem services in agricultural landscapes.

Supplementary Materials

The following are available online at https://www.mdpi.com/article/10.3390/conservation2010005/s1, Table S1: Support for the effects of each landscape variable alone on Microtus cabrerae and Microtus lusitanicus occupancy relative to the model with constant occupancy (Psi ~ 1), while keeping detectability as a function of transect location. Table S2: Pearson’s correlations among covariates receiving some support regarding their effects on Microtus cabrerae occupancy. Table S3: Pearson’s correlations among covariates receiving some support regarding their effects on Microtus lusitanicus occupancy. Table S4: Alternative versions of the full model for each species, accounting for those covariates that were highly correlated and therefore may not be included in the same model.

Author Contributions

Conceptualization, J.P. and R.P.; formal analysis, I.B., J.Q., J.P. and R.P.; funding acquisition, J.P. and R.P.; methodology, I.B., J.Q., H.V.-G., J.P. and R.P.; writing—original draft preparation, I.B. and R.P.; writing—review and editing, J.P. and R.P. All authors have read and agreed to the published version of the manuscript.

Funding

This research was funded by FEDER through “Programa Operacional de Factores de Competitividade—COMPETE” and by national funds through FCT—Portuguese Foundation for Science and Technology, IP, under the scope of the project AGRIVOLE (reference: PTDC/BIA-ECO/31728/2017). H.V.-G. was supported by the project UIDB/04033/2020. J.P. was supported by the European Union’s Horizon 2020 Research and Innovation programme under grant agreement no. 668981.

Institutional Review Board Statement

Ethical review and approval were waived for this study due to the exclusive use of genetic non-invasive sampling methods requiring no or only minimal physical interaction with wild-ranging animals, therefore raising no concerns related to animal welfare.

Informed Consent Statement

Not applicable.

Data Availability Statement

The raw sequence data and sample metadata from this study can be found at the European Nucleotide Archive ENA database (accession number: PRJEB49250).

Acknowledgments

We thank all farmers from NE Portugal who provided access to sampling sites.

Conflicts of Interest

The authors declare no conflict of interest.

References

  1. Tilman, S.; Fargione, J.; Wolff, B.; D’Antonio, C.; Dobson, A.; Howarth, R.; Schildler, D.; Schlesinger, W.H.; Simberloff, D.; Swackharmer, D. Forecasting agriculturally driven environmental change. Science 2001, 292, 281–285. [Google Scholar] [CrossRef] [Green Version]
  2. Green, R.E.; Cornell, S.J.; Scharlemann, J.P.W.; Balmford, A. Farming and the fate of wild nature. Science 2005, 307, 550–555. [Google Scholar] [CrossRef] [PubMed] [Green Version]
  3. Stoate, C.; Boatman, N.D.; Borralho, R.; Rio Carvalho, C.; de Snoo, G.; Eden, P. Ecological impacts of arable intensification in Europe. J. Environ. Manag. 2001, 63, 337–365. [Google Scholar] [CrossRef] [PubMed]
  4. Foley, J.A.; De Fries, R.; Asner, G.P.; Barford, C.; Bonan, G.; Carpenter, S.R.; Chapin, F.S.; Coe, M.T.; Daily, G.C.; Gibbs, H.K.; et al. Global consequences of land use. Science 2005, 309, 570–574. [Google Scholar] [CrossRef] [Green Version]
  5. Loumou, A.; Giourga, C. Olive groves: “The life and identity of the Mediterranean”. Agric. Hum. Values 2003, 20, 87–95. [Google Scholar] [CrossRef]
  6. European Commission. LIFE among the Olives: Good Practice in Improving Environmental Performance in the Olive Oil Sector; Office for Official Publications of the European Union: Luxembourg, 2010; Available online: https://publications.europa.eu/en/publication-detail/-/publication/53cd8cd1-272f-4cb8-b7b5-5c100c267f8f (accessed on 31 July 2021).
  7. Tartaglini, N.; Calabrese, G.; Servadei, L. Ancient olive orchards as high nature value farmland: A shared vision at Euro-Mediterranean level. In A Multi-Scale and Multi-Level Approach for Conservation of Ancient Olive Orchards in the Euro-Mediterranean Region; Posta, L., Lacirignola, C., Mimiola, G., Eds.; CIHEAM—Mediterranean Agronomic Institute of Bari: Bari, Italy, 2012; pp. 25–39. [Google Scholar]
  8. Herrera, J.M.; Costa, P.; Medinas, D.; Marques, J.T.; Mira, A. Community composition and activity of insectivorous bats in Mediterranean olive farms. Anim. Conserv. 2015, 18, 557–566. [Google Scholar] [CrossRef] [Green Version]
  9. Sánchez-Martínez, J.D.; Cabrera, A.P. The olive monoculture in the south of Spain. Eur. J. Geogr. 2015, 6, 16–29. [Google Scholar]
  10. Infante-Amate, J.; Villa, I.; Aguilera, E.; Torremocha, E.; Guzmán, G.; Cid, A.; Molina, M.G. The making of olive landscapes in the south of Spain. A history of continuous expansion and intensification. In Biocultural Diversity in Europe. Environmental History; Agnoletti, M., Emanueli, F., Eds.; Springer: Cham, Switzerland, 2016; Volume 5, pp. 157–179. [Google Scholar] [CrossRef]
  11. Gómez, J.A.; Llewellyn, C.; Basch, G.; Sutton, P.B.; Dyson, J.S.; Jones, C.A. The effects of cover crops and conventional tillage on soil and runoff loss in vineyards and olive groves in several Mediterranean countries. Soil Use Manag. 2011, 27, 502–514. [Google Scholar] [CrossRef] [Green Version]
  12. Weissteiner, C.J.; Strobl, P.; Sommer, S. Assessment of status and trends of olive farming intensity in EU-Mediterranean countries using remote sensing time series and land cover data. Ecol. Indic. 2011, 11, 601–610. [Google Scholar] [CrossRef]
  13. Rey, P.J.; Manzaneda, A.J.; Valera, F.; Alcántara, J.M.; Tarifa, R.; Isla, J.; Molina-Pardo, J.; Calvo, G.; Salido, T.; Gutiérrez, E.; et al. Landscape-moderated biodiversity effects of ground herb cover in olive groves: Implications for regional Biodiversity conservation. Agric. Ecosyst. Environ. 2019, 277, 61–73. [Google Scholar] [CrossRef]
  14. Benton, T.G.; Vickery, J.A.; Wilson, J.D. Farmland biodiversity: Is habitat heterogeneity the key? Trends Ecol. Evol. 2003, 18, 182–188. [Google Scholar] [CrossRef]
  15. Tscharntke, T.; Klein, A.M.; Kruess, A.; Steffan-Dewenter, I.; Thies, C. Landscape perspectives on agricultural intensification and biodiversity—Ecosystem service management. Ecol. Lett. 2005, 8, 857–874. [Google Scholar] [CrossRef]
  16. Delibes-Mateos, M.; Smith, A.T.; Slobodchikoff, C.N.; Swenson, J.E. The paradox of keystone species persecuted as pests: A call for the conservation of abundant small mammals in their native range. Biol. Conserv. 2011, 144, 1335–1346. [Google Scholar] [CrossRef]
  17. Fischer, C.; Gayer, C.; Kurucz, K.; Riesch, F.; Tscharntke, T.; Batáry, P. Ecosystem services and disservices provided by small rodents in arable fields: Effects of local and landscape management. J. Appl. Ecol. 2017, 55, 548–558. [Google Scholar] [CrossRef] [Green Version]
  18. Gliwicz, J.; Taylor, J.R.E. Comparing life histories of shrews and rodents. Acta Theriol. 2002, 47, 185–208. [Google Scholar] [CrossRef]
  19. Giraudoux, P.; Delattre, P.; Habert, M.; Quéré, J.P.; Deblay, S.; Defaut, R.; Duhamel, R.; Moissenet, M.F.; Salvi, D.; Truchetet, D. Population dynamics of fossorial water vole (Arvicola terrestris scherman): A land use and landscape perspective. Agric. Ecosyst. Environ. 1997, 66, 47–60. [Google Scholar] [CrossRef]
  20. Aschwanden, J.; Birrer, S.; Jenni, L. Are ecological compensation areas attractive hunting sites for common kestrels (Falco tinnunculus) and long-eared owls (Asio otus)? J. Ornithol. 2005, 146, 279–286. [Google Scholar] [CrossRef]
  21. Sálek, M.; Kreisinger, J.; Sedlacek, F.; Albrecht, T. Do prey densities determine preferences of mammalian predators for habitat edges in an agricultural landscape? Landsc. Urban Plan. 2010, 98, 86–91. [Google Scholar] [CrossRef]
  22. Luque-Larena, J.J.; Mougeot, F.; Viñuela, J.; Jareño, D.; Arroyo, L.; Lambin, X.; Arroyo, B. Recent large-scale range expansion and eruption of common vole (Microtus arvalis) outbreaks in NW Spain. Basic Appl. Ecol. 2003, 14, 432–441. [Google Scholar] [CrossRef] [Green Version]
  23. Renwick, A.R.; Lambin, X. Host-parasite interactions in a fragmented landscape. Int. J. Parasitol. 2013, 43, 27–35. [Google Scholar] [CrossRef]
  24. Miñarro, M.; Somoano, A.; Ventura, J. Intra-annual continuous reproduction of the apple pest Microtus lusitanicus: Implications for management. Crop Prot. 2017, 96, 164–172. [Google Scholar] [CrossRef]
  25. Miñarro, M.; Montiel, C.; Dapena, E. Vole pests in apple orchards: Use of presence signs to estimate the abundance of Arvicola terrestris cantabriae and Microtus lusitanicus. J. Pest Sci. 2012, 85, 477–488. [Google Scholar] [CrossRef]
  26. Pita, R.; Beja, P.; Mira, A. Spatial population structure of the Cabrera vole in Mediterranean farmland: The relative role of patch and matrix effects. Biol. Conserv. 2007, 134, 383–392. [Google Scholar] [CrossRef]
  27. Dee, L.E.; Cowles, J.; Isbell, F.; Pau, S.; Gaines, S.D.; Reich, P.B. When do ecosystem services depend on rare species? Trends Ecol. Evol. 2019, 34, 746–758. [Google Scholar] [CrossRef]
  28. Bondi, N.; White, J.G.; Stevens, M.; Cooke, R. A comparison of the effectiveness of camera trapping and live trapping for sampling terrestrial small-mammal communities. Wildl. Res. 2010, 37, 456–465. [Google Scholar] [CrossRef]
  29. Beja-Pereira, A.; Oliveira, R.; Alves, P.C.; Schwartz, M.K.; Luikart, G. Advancing ecological understandings through technological transformations in noninvasive genetics. Mol. Ecol. Resour. 2009, 9, 1279–1301. [Google Scholar] [CrossRef] [PubMed]
  30. Ferreira, C.M.; Sabino-Marques, H.; Barbosa, S.; Costa, P.; Encarnação, C.; Alpizar-Jara, R.; Pita, R.; Beja, P.; Mira, A.; Searle, J.B.; et al. Genetic non-invasive sampling (gNIS) as a cost-effective tool for monitoring elusive small mammals. Eur. J. Wildl. Res. 2018, 64, 1–15. [Google Scholar] [CrossRef] [Green Version]
  31. Duarte, F.; Jones, N.; Lúcio, C.; Nunes, A. The reform of the olive oil regime and its impacts on the olive and olive oil sector: A case study in Northern Portugal—Trás-os-Montes. New Medit. 2006, 5, 4–15. [Google Scholar]
  32. Fernández-Salvador, R. Microtus cabrerae (Thomas, 1906). In Atlas y Libro Rojo de los Mamíferos Terrestres de España; Palomo, L.J., Gisbert, J., Blanco, J.C., Eds.; Dirección General para la Biodiversidad-SECEM-SECEMU: Madrid, Spain, 2007; pp. 429–431. [Google Scholar]
  33. Pita, R.; Mira, A.; Beja, P. Microtus cabrerae (Rodentia: Cricetidae). Mamm. Species 2014, 46, 48–70. [Google Scholar] [CrossRef] [Green Version]
  34. Cabral, M.; Almeida, J.; Almeida, P.; Dellinger, T.; Ferrand de Almeida, N.; Oliveira, M.; Palmeirim, J.; Queiroz, A.; Rogado, L.; Santos-Reis, M. Livro Vermelho dos Vertebrados de Portugal; Instituto de Conservação da Natureza: Lisbon, Portugal, 2005; p. 659. [Google Scholar]
  35. Pita, R.; Mira, A.; Beja, P. Conserving the Cabrera vole, Microtus cabrerae, in intensively used Mediterranean landscapes. Agric. Ecosyst. Environ. 2006, 115, 1–5. [Google Scholar] [CrossRef]
  36. Pita, R.; Mira, A.; Beja, P. Assessing habitat differentiation between coexisting species: The role of spatial scale. Acta Oecol. 2011, 37, 124–132. [Google Scholar] [CrossRef]
  37. Santos, S.M.; Simões, M.P.; Mathias, M.; Mira, A. Vegetation analysis in colonies of an endangered rodent, the Cabrera vole (Microtus cabrerae), in southern Portugal. Ecol. Res. 2006, 21, 197–207. [Google Scholar] [CrossRef]
  38. Santos, S.M.; Mathias, M.; Mira, A.; Simões, M.P. Vegetation structure and composition of road verge and meadow sites colonized by Cabrera vole (Microtus cabrerae Thomas). Pol. J. Ecol. 2007, 55, 481–493. [Google Scholar]
  39. Luque-Larena, J.J.; López, P. Microhabitat use by wild-ranging Cabrera voles Microtus cabrerae as revealed by live trapping. Eur. J. Wildl. Res. 2007, 53, 221–225. [Google Scholar] [CrossRef]
  40. Santos, S.M.; Lourenço, R.F.; Mathias, M.L.; Mira, A. Spatial and temporal ecology of the Lusitanian pine vole (Microtus lusitanicus) in a Mediterranean polyculture. Anim. Biol. 2010, 60, 209–227. [Google Scholar] [CrossRef]
  41. Giannoni, S.M.; Borghi, C.E.; Martínez-Rica, J.P. Comparing the burrowing behaviour of the Iberian mole voles (Microtus (Terricola) lusitanicus, M.(T.) pyrenaicus and M.(T.) duodecimcostatus). Mammalia 1993, 57, 483–490. [Google Scholar] [CrossRef]
  42. Vinhas, A. Microtus lusitanicus (Rato cego) e Microtus duodecimcostatus (Rato cego-mediterrânico), roedores pragas das culturas. Rev. Cienc. Agrar. 1993, 17, 375–382. [Google Scholar]
  43. Mira, A.; Mathias, M.L. Microtus lusitanicus (Gerbe, 1879). In Atlas y Libro Rojo de los Mamíferos Terrestres de España; Palomo, L.J., Gisbert, J., Blanco, J.C., Eds.; Dirección General para la Biodiversidad-SECEM-SECEMU: Madrid, Spain, 2007; pp. 418–421. [Google Scholar]
  44. Ponsà, M.; Cabré, L.; Ferrando, A.; Bosch, M.; Ventura, J. Approach on the genetic diversity in a Lusitanian pine vole population. Mammalia 2011, 75, 305–309. [Google Scholar] [CrossRef]
  45. Rodriguez-Pastor, R.; Luque-Larena, J.J.; Lambin, X.; Mougeot, F. “Living on the edge”: The role of field margins for common vole (Microtus arvalis) populations in recently colonised Mediterranean farmland. Agric. Ecosyst. Environ. 2016, 231, 206–217. [Google Scholar] [CrossRef] [Green Version]
  46. Sukma, H.T.; Stefano, J.D.; Swan, M.; Sitters, H. Mammal functional diversity increases with vegetation structural complexity in two forest types. For. Ecol. Manag. 2019, 433, 85–92. [Google Scholar] [CrossRef]
  47. Instituto da Conservação da Natureza e das Florestas (ICNF). Parque Natural de Montesinho. Available online: http://www2.icnf.pt/portal/ap/p-nat/pnm (accessed on 1 September 2021).
  48. Bencatel, J.; Sabino-Marques, H.; Álvares, F.; Moura, A.E.; Barbosa, A.M. Atlas de Mamíferos de Portugal, 2nd ed.; Universidade de Évora: Évora, Portugal, 2019; p. 271. [Google Scholar]
  49. de Graaff, J.; Duarte, F.; Fleskens, L.; De Figueiredo, T. The future of olive groves on sloping land and ex-ante assessment of cross compliance for erosion control. Land Use Policy 2010, 27, 33–41. [Google Scholar] [CrossRef]
  50. Sutherland, G.D.; Harestad, A.S.; Price, K.; Lertzman, K.P. Scaling of natal dispersal distances in terrestrial birds and mammals. Conserv. Ecol. 2000, 4, 16. [Google Scholar] [CrossRef]
  51. Bowman, J.; Jaeger, J.A.G.; Fahrig, L. Dispersal distance of mammals is proportional to home range size. Ecology 2002, 83, 2049–2055. [Google Scholar] [CrossRef]
  52. Sabino-Marques, H.; Fereira, C.M.; Paupério, J.; Costa, P.; Barbosa, S.; Encarnacao, C.; Alpizar-Jara, R.; Alves, P.C.; Searle, J.B.; Mira, P.; et al. Combining genetic non-invasive sampling with spatially explicit capture-recapture models for density estimation of a patchily distributed small mammal. Eur. J. Wildl. Res. 2018, 64, 1–14. [Google Scholar] [CrossRef] [Green Version]
  53. Martins, F.M.S.; Galhardo, M.; Filipe, A.F.; Teixeira, A.; Pinheiro, P.; Paupério, J.; Alves, P.C.; Beja, P. Have the cake and eat it: Optimizing nondestructive DNA metabarcoding of macroinvertebrate samples for freshwater biomonitoring. Mol. Ecol. Resour. 2019, 19, 863–876. [Google Scholar] [CrossRef]
  54. Barbosa, S.; Paupério, J.; Searle, J.B.; Alves, P.C. Genetic identification of Iberian rodent species using both mitochondrial and nuclear loci: Application to noninvasive sampling. Mol. Ecol. Resour. 2013, 13, 43–56. [Google Scholar] [CrossRef] [PubMed]
  55. Costa, V.; Rosenbom, S.; Monteiro, R.; O‘Rourke, S.M.; Beja-Pereira, A. Improving DNA 515 quality extracted from fecal samples—A method to improve DNA yield. Eur. J. Wildl. Res. 2017, 63, 1–7. [Google Scholar] [CrossRef]
  56. Deiner, K.; Bik, H.M.; Mächler, E.; Seymour, M.; Lacoursière-Roussel, A.; Altermatt, F.; Creer, S.; Bista, I.; Lodge, D.M.; de Vere, N.; et al. Environmental DNA metabarcoding: Transforming how we survey animal and plant communities. Mol. Ecol. 2017, 26, 5872–5895. [Google Scholar] [CrossRef] [PubMed]
  57. Riaz, T.; Shehzad, W.; Viari, A.; Pompanon, F.; Taberlet, P.; Coissac, E. ecoPrimers: Inference of new DNA barcode markers from whole genome sequence analysis. Nucl. Acids Res. 2011, 39, e145. [Google Scholar] [CrossRef]
  58. Boyer, F.; Mercier, C.; Bonin, A.; Le Bras, Y.; Taberlet, P.; Coissac, E. Obitools: A unix-inspired software package for DNA metabarcoding. Mol. Ecol. Resour. 2016, 16, 176–182. [Google Scholar] [CrossRef]
  59. Camacho, C.; Coulouris, G.; Avagyan, V.; Ma, N.; Papadopoulos, J.; Bealer, K.; Madden, T.L. BLAST+: Architecture and applications. BMC Bioinform. 2008, 10, 421. [Google Scholar] [CrossRef] [Green Version]
  60. Bivand, R.; Lewin-Koh, N. Maptools: Tools for Handling Spatial Objects. R Package. Available online: https://cran.r-project.org/web/packages/maptools/index.html (accessed on 30 September 2021).
  61. Bivand, R.; Keitt, T.; Rowlingson, B.; Pebesma, E.; Sumner, M.; Hijmans, R.; Rouault, E. Rgdal: Bindings for the Geospatial Data Abstraction Library. R Package. Available online: https://cran.r-project.org/web/packages/rgdal/index.html (accessed on 30 September 2021).
  62. Wickham, H.; Francois, R.; Henry, L.; Müller, K. Dplyr: A Grammar of Data Manipulation. R Package. Available online: https://CRAN.R-project.org/package=dplyr (accessed on 30 September 2021).
  63. Sherrill-Mix, S. Taxonomizr: Functions to Work with NCBI Accessions and Taxonomy. R Package. Available online: https://CRAN.R-project.org/package=taxonomizr (accessed on 30 September 2021).
  64. Müller, K.; Wickham, H. Tibble: Simple Data Frames. R Package. Available online: https://CRAN.R-project.org/package=tibble (accessed on 30 September 2021).
  65. Allaire, J. RStudio: Integrated Development Environment for R; RStudio Team: Boston, MA, USA, 2012; Volume 770, p. 394. [Google Scholar]
  66. R Core Team. R: A Language and Environment for Statistical Computing. Available online: https://www.r-project.org/ (accessed on 14 August 2021).
  67. QGIS Development Team. QGIS Geographic Information System. QGIS Association. Available online: https://www.qgis.org/en/site/ (accessed on 30 July 2021).
  68. Hijmans, R.J. Raster: Geographic Data Analysis and Modeling. R Package. Available online: https://CRAN.R-project.org/package=raster (accessed on 2 August 2021).
  69. Sciaini, M.; Fritsch, M.; Scherer, C.; Simpkins, C.E. NLMR and Landscapetools: An Integrated Environment for Simulating and Modifying Neutral Landscape Models in R. Methods Ecol. Evol. 2018, 9, 2240–2248. [Google Scholar] [CrossRef] [Green Version]
  70. Hesselbarth, M.H.K.; Sciaini, M.; With, K.A.; Wiegand, K.; Nowosad, J. Landscapemetrics: An open-source R tool to calculate landscape metrics. Ecography 2019, 42, 1648–1657. [Google Scholar] [CrossRef] [Green Version]
  71. Shetty, P.J.; Gowda, S.V.; Gururaja, K.V.; Sudhira, H.S. Effect of Landscape Metrics on Varied Spatial Extents of Bangalore, India. Asian J. Geoinformatics 2012, 12, 1–11. [Google Scholar]
  72. Mackenzie, D.I.; Nichols, J.D.; Lachman, G.B.; Droedge, S.; Royle, J.A.; Langtimm, C.A. Estimating site occupancy rates when detection probabilities are less than one. Ecology 2002, 83, 2248–2255. [Google Scholar] [CrossRef]
  73. Fiske, I.; Chandler, R. Unmarked: An R Package for Fitting Hierarchical Models of Wildlife Occurrence and Abundance. J. Stat. Softw. 2011, 43, 1–23. [Google Scholar] [CrossRef] [Green Version]
  74. Burnham, K.P.; Anderson, D.R. Model Selection and Multimodel Inference: A Practical Information-theoretic Approach, 2nd ed.; Springer: New York, NY, USA, 2002; p. 488. [Google Scholar] [CrossRef] [Green Version]
  75. Dormann, C.F.; Elith, J.; Bacher, S.; Buchmann, C.; Carl, G.; Carre, G.; García Marquéz, J.R.; Gruber, B.; Lafourcade, B.; Leitão, P.; et al. Collinearity: A review of methods to deal with it and a simulation study evaluating their performance. Ecography 2012, 36, 27–46. [Google Scholar] [CrossRef]
  76. Mazerolle, M.J. AICcmodavg: Model Selection and Multimodel Inference Based on (Q)AIC(c). R Package. Available online: https://cran.r-project.org/package=AICcmodavg (accessed on 30 October 2021).
  77. Legendre, P. Spatial autocorrelation: Trouble or new paradigm? Ecology 1993, 74, 1659–1673. [Google Scholar] [CrossRef]
  78. Paradis, E.; Schliep, K. Ape 5.0: An environment for modern phylogenetics and evolutionary analyses in R. Bioinformatics 2019, 35, 526–528. [Google Scholar] [CrossRef] [PubMed]
  79. Montoya, D.; Gaba, S.; de Mazancourt, C.; Bretagnolle, V.; Loreau, M. Reconciling biodiversity conservation, food production and farmers’ demand in agricultural landscapes. Ecol. Modell. 2020, 416, 108889–108909. [Google Scholar] [CrossRef] [PubMed]
  80. Millán de la Peña, N.; Butet, A.; Delettre, Y.; Paillat, G.; Morant, P.; Le Du, L.; Burel, F. Response of the small mammal community to changes in western French agricultural landscapes. Landsc. Ecol. 2003, 18, 265–278. [Google Scholar] [CrossRef]
  81. Pita, R.; Lambin, X.; Mira, A.; Beja, P. Hierarchical spatial segregation of two Mediterranean vole species: The role of patch-network structure and matrix composition. Oecologia 2016, 182, 253–263. [Google Scholar] [CrossRef] [PubMed] [Green Version]
  82. Fox, B.J.; Fox, M.D. Factors determining mammal species richness on habitat islands and isolates: Habitat diversity, disturbance, species interactions and guild assembly rules. Glob. Ecol. Biogeogr. 2000, 9, 19–37. [Google Scholar] [CrossRef]
  83. Cramer, M.J.; Willig, M.R. Habitat heterogeneity, habitat associations, and rodent species diversity in a sand–shinnery-oak landscape. J. Mammal. 2002, 83, 743–753. [Google Scholar] [CrossRef]
  84. Rigaux, P.; Vaslin, M.; Noblet, J.F.; Amori, G.; Muñoz, L.J.P. Arvicola sapidus. In The IUCN Red List of Threatened Species; e.T2150A9290712. 2008. Available online: https://www.iucnredlist.org/species/2150/9290712 (accessed on 10 November 2021).
  85. Paupério, J.; Herman, J.S.; Melo-Ferreira, J.; Jaarola, M.; Alves, P.C.; Searle, J.B. Cryptic speciation in the field vole: A multilocus approach confirms three highly divergent lineages in Eurasia. Mol. Ecol. 2012, 21, 6015–6032. [Google Scholar] [CrossRef]
  86. Balestrieri, A.; Gazzola, A.; Formenton, G.; Canova, L. Long-term impact of agricultural practices on the diversity of small mammal communities: A case study based on owl pellets. Environ. Monit. Assess. 2019, 191, 1–14. [Google Scholar] [CrossRef] [PubMed]
  87. Morgado, R.; Santana, J.; Porto, M.; Sánchez-Oliver, J.S.; Reino, L.; Herrera, J.M.; Rego, F.; Beja, P.; Moreira, F. A Mediterranean silent spring? The effects of olive farming intensification on breeding bird communities. Agric. Ecosyst. Environ. 2020, 288, 106694. [Google Scholar] [CrossRef]
  88. Castro, J.; Tortosa, F.S.; Carpio, A.J. Structure of canopy and ground-dwelling arthropod communities in olive orchards is determined by the type of soil cover. Eur. J. Entomol. 2021, 118, 159–170. [Google Scholar] [CrossRef]
  89. Tarifa, R.; Martínez-Núñez, C.; Valera, F.; González-Varo, J.P.; Salido, T.; Rey, P.J. Agricultural intensification erodes taxonomic and functional diversity in Mediterranean olive groves by filtering out rare species. J. Appl. Ecol. 2021, 58, 2266–2276. [Google Scholar] [CrossRef]
  90. Paz, D.B.; Henderson, K.; Loreau, M. Agricultural land use and the sustainability of social-ecological systems. Ecol. Modell. 2020, 437, 109312. [Google Scholar] [CrossRef] [PubMed]
  91. Serafini, V.N.; Priotto, J.W.; Gomez, M.D. Effects of agroecosystem landscape complexity on small mammals: A multi-species approach at different spatial scales. Landsc. Ecol. 2019, 34, 1117–1129. [Google Scholar] [CrossRef]
  92. Moreira, F.; Herrera, J.M.; Beja, P. Making olive oil sustainable. Science 2019, 365, 873. [Google Scholar] [CrossRef]
  93. Krishna, V.; Drucker, A.; Pascual, U.; Raghu, P.E.D.; King, I.O. Estimating compensation payments for on-farm conservation of agricultural biodiversity in developing countries. Ecol. Econ. 2013, 87, 110–123. [Google Scholar] [CrossRef]
  94. Proença-Ferreira, A.; Ferreira, C.; Leitão, I.; Paupério, J.; Sabino-Marques, H.; Barbosa, S.; Lambin, X.; Alves, P.C.; Beja, P.; Moreira, F.; et al. Drivers of survival in a small mammal of conservation concern: An assessment using extensive genetic non-invasive sampling in fragmented farmland. Biol. Conserv. 2019, 230, 131–140. [Google Scholar] [CrossRef] [Green Version]
  95. Reiners, T.E.; Encarnação, J.A.; Wolters, V. An optimized hair trap for non-invasive genetic studies of small cryptic mammals. Eur. J. Wildl. Res. 2011, 57, 991–995. [Google Scholar] [CrossRef] [Green Version]
  96. Van Veen, F.J.; Memmott, J.; Godfray, H.C.J. Indirect effects, apparent competition and biological control. In Trophic and Guild Interactions in Biological Control; Brodeur, J., Boivin, G., Eds.; Springer: Dordrecht, The Netherlands, 2006; pp. 145–169. [Google Scholar]
  97. Waits, L.P. Using noninvasive genetic sampling to detect and estimate abundance of rare wildlife species. In Sampling Rare or Elusive Species: Concepts, Designs, and Techniques for Estimating Population Parameters; Thompson, W.L., Ed.; Island Press: Washington, DC, USA, 2004; pp. 211–228. [Google Scholar]
  98. Benedek, A.M.; Sîrbu, I. Responses of small mammal communities to environment and agriculture in a rural mosaic landscape. Mamm. Biol. 2018, 90, 55–65. [Google Scholar] [CrossRef]
Figure 1. (a) Map of the study area in Trás-os-Montes, northeast (NE) Portugal. (b) Location of the 51 sampling units centered in olive grove patches distributed across the Trás-os-Montes region, selected to survey small mammals and main land uses (red triangles). (c) Example of sampling unit showing the location of transects for small mammal genetic non-invasive sampling, and the main land uses surrounding the focal olive grove (50 m buffers).
Conservation 02 00005 g001
Table 1. Selection of the best submodel of detectability, assuming constant occupancy for each small mammal species (Psi ~ 1), based on comparisons between AICc values of models considering the effects of transect type (within focal olive groves versus at neighboring semi-natural marginal habitats) and the model with no effects on detectability. In each case, the submodel including the transect type (p~TransType) received greater support than the model with constant detectability (p ~ 1), and therefore, this submodel structure was carried out in subsequent analyses focusing occupancy.
Speciesp SubmodelAICcΔAICcWt-AICc
Microtus cabrerae~1553.91624.7830.00
~TransType529.133 1.00
Microtus lusitanicus~1268.3637.0400.03
~TransType261.323 0.97
Apodemus sylvaticus~1750.62132.7860.00
~TransType717.835 1.00
Mus spretus~1467.6287.4950.02
~TransType460.133 0.98
Crocidura russula~1486.66618.5230.00
~TransType468.144 1.00
Table 2. Detectability (p) and occupancy (Psi) estimates of small mammals in NE Portugal according to the models including the effects of transect location, i.e., within focal olive groves versus in surrounding semi-natural habitats.
SpeciesMean (95%CI) p (within Olive Groves)Mean (95%CI) p (Surrounding Habitats)Mean (95%CI) Psi
Microtus cabrerae0.037 (0.012–0.108)0.267 (0.223–0.317)0.765 (0.611–0.871)
Microtus lusitanicus0.029 (0.004–0.181)0.219 (0.158–0.296)0.366 (0.236–0.519)
Apodemus sylvaticus0.085 (0.045–0.156)0.347 (0.304–0.392)0.984 (0.654–0.999)
Mus spretus0.066 (0.030–0.141)0.163 (0.126–0.210)0.868 (0.635–0.961)
Crocidura russula0.019 (0.005–0.072)0.158 (0.129–0.193)1.000 (0.000–1.000) 1
1 Estimates with equivocal meaning.
Table 3. Summary of descriptive statistics of landscape covariables of small mammal occupancy in 51 olive farms in NE Portugal.
Covariable (Units)CodeMean ± seRange
Cover metrics
Olive grove cover (%)OliveCover53.16 ± 3.2611.5–100
Pasture land cover (%)PastCover15.84 ± 1.820–47.6
Shrub cover (%)ShrubCover13.28 ± 2.080–58.6
Agricultural land cover (%)AgricCover7.01 ± 1.300–37.7
Forest cover (%)ForestCover6.17 ± 1.750–63.8
Edge density metrics
Olive edge density /m/ha)OliveEdgeD202.05 ± 11.950–443
Pasture land edge density /m/ha)PastEdgeD114.16 ± 12.250–353
Shrub edge density /m/ha)ShrubEdgeD124.60 ± 16.650–483
Agricultural land edge density (m/ha)AgricEdgeD64.48 ± 11.210–303
Forest edge density /m/ha)ForestEdgeD46.37 ± 9.990–293
Patch density metrics
Olive patch density (number/ha)OlivePatchD65.18 ± 5.3421.7–189
Pasture patch density (number/ha)PastPatchD61.70 ± 7.050–218
Shrub patch density (number/ha)ShrubPatchD60.89 ± 5.560–203
Agricultural patch density (number/ha)AgricPatchD35.94 ± 5.560–172
Forest patch density (number/ha)ForestPatchD20.32 ± 4.270–110
Aggregation metrics
Olive normalized landscape shape indexOliveNLSI0.04 ± 0.020–1.00
Pasture normalized landscape shape indexPastNLSI0.02 ± 0.010–0.27
Shrub normalized landscape shape indexShrubNLSI0.02 ± 0.000–0.06
Agricultural normalized landscape shape indexAgricNLSI0.01 ± 0.000–0.10
Forest normalized landscape shape indexForestNLSI0.01 ± 0.000–0.07
Diversity metrics
Number of habitat typesPatchRichness4.67 ± 0.201–7
Shannon diversity indexShanDiv1.04 ± 0.050–1.73
Shannon evenness indexShanEvn0.68 ± 0.030–0.91
Table 4. AICc-based ranking of candidate models built to assess the effects of landscape variables on Microtus cabrerae and Microtus lusitanicus occupancy in NE Portugal olive grove agro-ecosystems. In each case, the submodel structure for detectability included the effects of transect location (p~TransType). Most supported models for each species (delta AICc < 2) are indicated in bold.
SpeciesPsi SubmodelAICcΔAICcWt-AICc
Microtus cabrerae~AgricEdgeD + PastNLSI522.8700.55
~AgricEdgeD + AgricNLSI + PastNLSI525.222.350.17
~AgricNLSI + PastNLSI525.953.080.12
~AgricEdgeD527.254.380.06
~AgricNLSI528.085.210.04
~PastNLSI528.355.480.04
~AgricEdgeD + AgricNLSI529.226.350.02
Microtus lusitanicus~PastPatchD + OliveNLSI258.100.24
~PastPatchD258.280.180.22
~PastPatchD + ForestNLSI258.70.60.18
~PastPatchD + OliveNLSI + ForestNLSI259.311.210.13
~OliveNLSI259.571.470.11
~OliveNLSI + ForestNLSI260.522.410.07
~ForestNLSI 261.23.10.05
Table 5. Estimates of main effects (mean and 5th and 95th percentiles) on p and Psi obtained from the best model identified for Microtus cabrerae, and from model averaging of best models identified for Microtus lusitanicus. Variables with 5th and 95th percentile ranges not including 0 are shown in bold.
SpeciesParameterCovariableEffect Size5th, 95th Percentiles
Microtus cabreraepTransType:SurroundHabitat2.261.27, 3.25
PsiAgricEdgeD1.680.31, 3.05
PsiPastNLSI−2.23−5.00, 0.54
Microtus lusitanicuspTransType:SurroundHabitat2.240.54, 3.93
PsiPastPatchD0.750.07, 1.43
PsiOliveNLSI−7.89−17.8, 2.03
PsiForestNLSI0.44−0.15, 1.03
Publisher’s Note: MDPI stays neutral with regard to jurisdictional claims in published maps and institutional affiliations.

