Article

Sustainable Development and Business Strategies: An Exploratory Study of Greek Businesses

by
Spyridon A. Bafas
,
Alexandra P. Alexandropoulou
,
Andreas E. Fousteris
,
Eleni A. Didaskalou
* and
Dimitrios A. Georgakellos
Department of Business Administration, University of Piraeus, 185 34 Pireas, Greece
*
Author to whom correspondence should be addressed.
Businesses 2023, 3(3), 441-459; https://doi.org/10.3390/businesses3030027
Submission received: 20 June 2023 / Revised: 1 August 2023 / Accepted: 8 August 2023 / Published: 11 August 2023

Abstract

:
The purpose of the present study is threefold: (a) it examines how Greek businesses perceive the concept of sustainability, (b) it investigates the implementation of sustainable development practices in Greek businesses, and (c) it examines if there is a correlation between sustainable development practices adopted by businesses and the competitive advantage of businesses. Furthermore, reference is made to concepts like sustainability, the Triple Bottom Line (TBL), and Sustainable Development Goals (SDGs). In addition, the TBL for sustainable business practices and the viability of measurement systems are examined. For this study, a survey was conducted using a questionnaire composed of five sections, which was addressed to Greek companies operating in various sectors. A total of 150 questionnaires were sent out and responses were received from 34 enterprises. An analysis of the data from field research confirms that Greek companies perceive sustainability as a transformation catalyst for businesses and have adopted sustainability practices. Furthermore, there is a moderate correlation between the economic and social pillar of sustainability and the competitive advantage of organisations. The study aims to provide a deeper understanding of factors that influence the adoption of sustainable practices in Greek enterprises.

1. Introduction

Recently, concerns have been raised about sustaining our planet, which has been a hot topic for society, academic practice, and businesses over the last few years. Waste, energy consumption, and life itself must be viewed under a different light for future generations and the planet. The conference of the United Nations (UN) in Paris in 2015 drew special attention to the concept of sustainable development. The Paris Agreement is a global action plan to limit global warming and consequently the greenhouse effect. This plan is part of the United Nations Convention on Climate Change (UNFCCC) [1,2]. Raising awareness in society about energy and the use of natural resources has resulted in fundamental changes for environmental concerns [3]. Nowadays, sustainable development is an ever growing matter of concern, and organisations are trying to incorporate sustainability in their strategic agenda. Based on three fundamental pillars, sustainable development can be interpreted with regard to social progress, environmental balance, and economic development [4]. This approach is called the Triple Bottom Line (TBL) and was first introduced into business practice by John Elkington [5].
According to the literature, businesses’ main role is to be the driving force of the economy and social change. Additionally, organisations that take action for a sustainable transition [6] are expected to respond better to crises, such as COVID-19, and to gain long-term value. Generally, businesses can play a central role in achieving the Sustainable Development Goals (SDGs) [7]. In addition, their role is enhanced by the global reach acquired through the development of large-scale solutions and the willingness to invest and innovate [8]. In Greece, the adoption of sustainable development principles by companies and their performance in terms of the SDGs are at an intermediate level. This level is opposed to most of the north-western countries of Europe [9]. If one considers the number of businesses and employees in Greece, it is evident that sustainable development does not receive appropriate attention, whereas it is particularly well established in businesses around the world [10]. This research focuses on sustainable development in Greek businesses and their opinion towards it, the TBL practices adopted by Greek businesses, and the suitability of this strategy towards actualising their goal.
The main goal of the study is to investigate how sustainable development is integrated into the strategy of Greek businesses and the contribution of sustainable practices to the creation and development of a competitive advantage. To present the main points of the Greek experience of the adoption of sustainable practices by enterprises, a survey was conducted in Greek companies using a structured questionnaire. The authors decided to conduct a survey rather than drawing conclusions from analysing official reports and studies, as done in many previous studies.
Section 2 of this paper provides an overview of the existing literature on the history of sustainable development, TBL, SDGs, SDGs in Greece, sustainability, and business, while Section 3 discusses the research design and methodology. Finally, Section 4 presents the research results and Section 5 discusses the results, gives managerial implications, and suggests directions for future research.

2. Literature Review

2.1. The Concept of Sustainable Development and SDGs

The concept of sustainable development is not new. However, over recent years, it has started gaining growing importance in every aspect of life. Sustainable development is a concept thought to originate in 18th century economics and more specifically from a discussion on population growth and the earth’s ability to support it, given its limited natural resources [11]. Following the Industrial Development era, sustainable development started to be further discussed [12], as during that period, society switched to using oil, coal, and other carbon-related materials for energy. This led to an argument about whether future generations would be able to live according to existing rates of resource consumption or not [11,12]. In 1972, at the UN Conference on the Human Environment, an initial discussion of sustainability and environmental crises took place [13]. This period was overshadowed by the oil crisis in 1974–1976, which indicated, for the first time, a shortage of a non-infinite material, bringing a crisis and its aftereffects to society [12].
The first approach to the concept of sustainable development was introduced in 1980 in the World Conservation Strategy (WCS) (IUCN/UNEP/WWF, 1980), which used the term to explain how the environment could be saved through material exploitation control. The first definition of sustainable development was given in the Brundtland Commission report in 1987, establishing that: “development must meet the needs of the present without compromising the ability and opportunities of future generations to meet their own needs” [12,13]. Today, this definition is still being used [13]. It was only at the United Nations Conference on Environment and Development (UNCED), also known as the ‘Earth Summit’, in Rio in 1992 when the term ‘sustainable development’ was turned into a global slogan for governments, businesses, stakeholders, and non-governmental organizations [14].
The alteration of the planet and the continuous environmental degradation caused by human factors clearly indicate that measures must be taken at a global level [15]. In response to this, countries from around the world came together in Paris in 2015 in an attempt to establish a framework with distinctive goals (i.e., the Sustainable Development Goals, also known as SDGs) and ensure their achievement by 2030 [2,16]. These goals (SDGs) were considered as measures and were adopted both at state and international levels. The SDGs are based on sustainable development with a forecast year and scale of achievement leading up to 2030 for each country, not just businesses alone [16]. The 17 goals are listed below (Figure 1).
The 17 SDGs (Figure 1) provide principles with strict guidelines, which must be followed and respected, along with common directions applicable to different groups [18]. They provide clear guidance and coherent approaches to a specific problem or issue in sustainability terms. In addition, they provide general measures and reports on targets that a participating country is responsible for carrying out [2]. Overall, the SDGs main purpose is the improvement of the global economy, society, and the environment [2,16,19]. Finally, there is a corresponding correlation of the SD goals with the three pillars of sustainable development, which is illustrated below [20]:
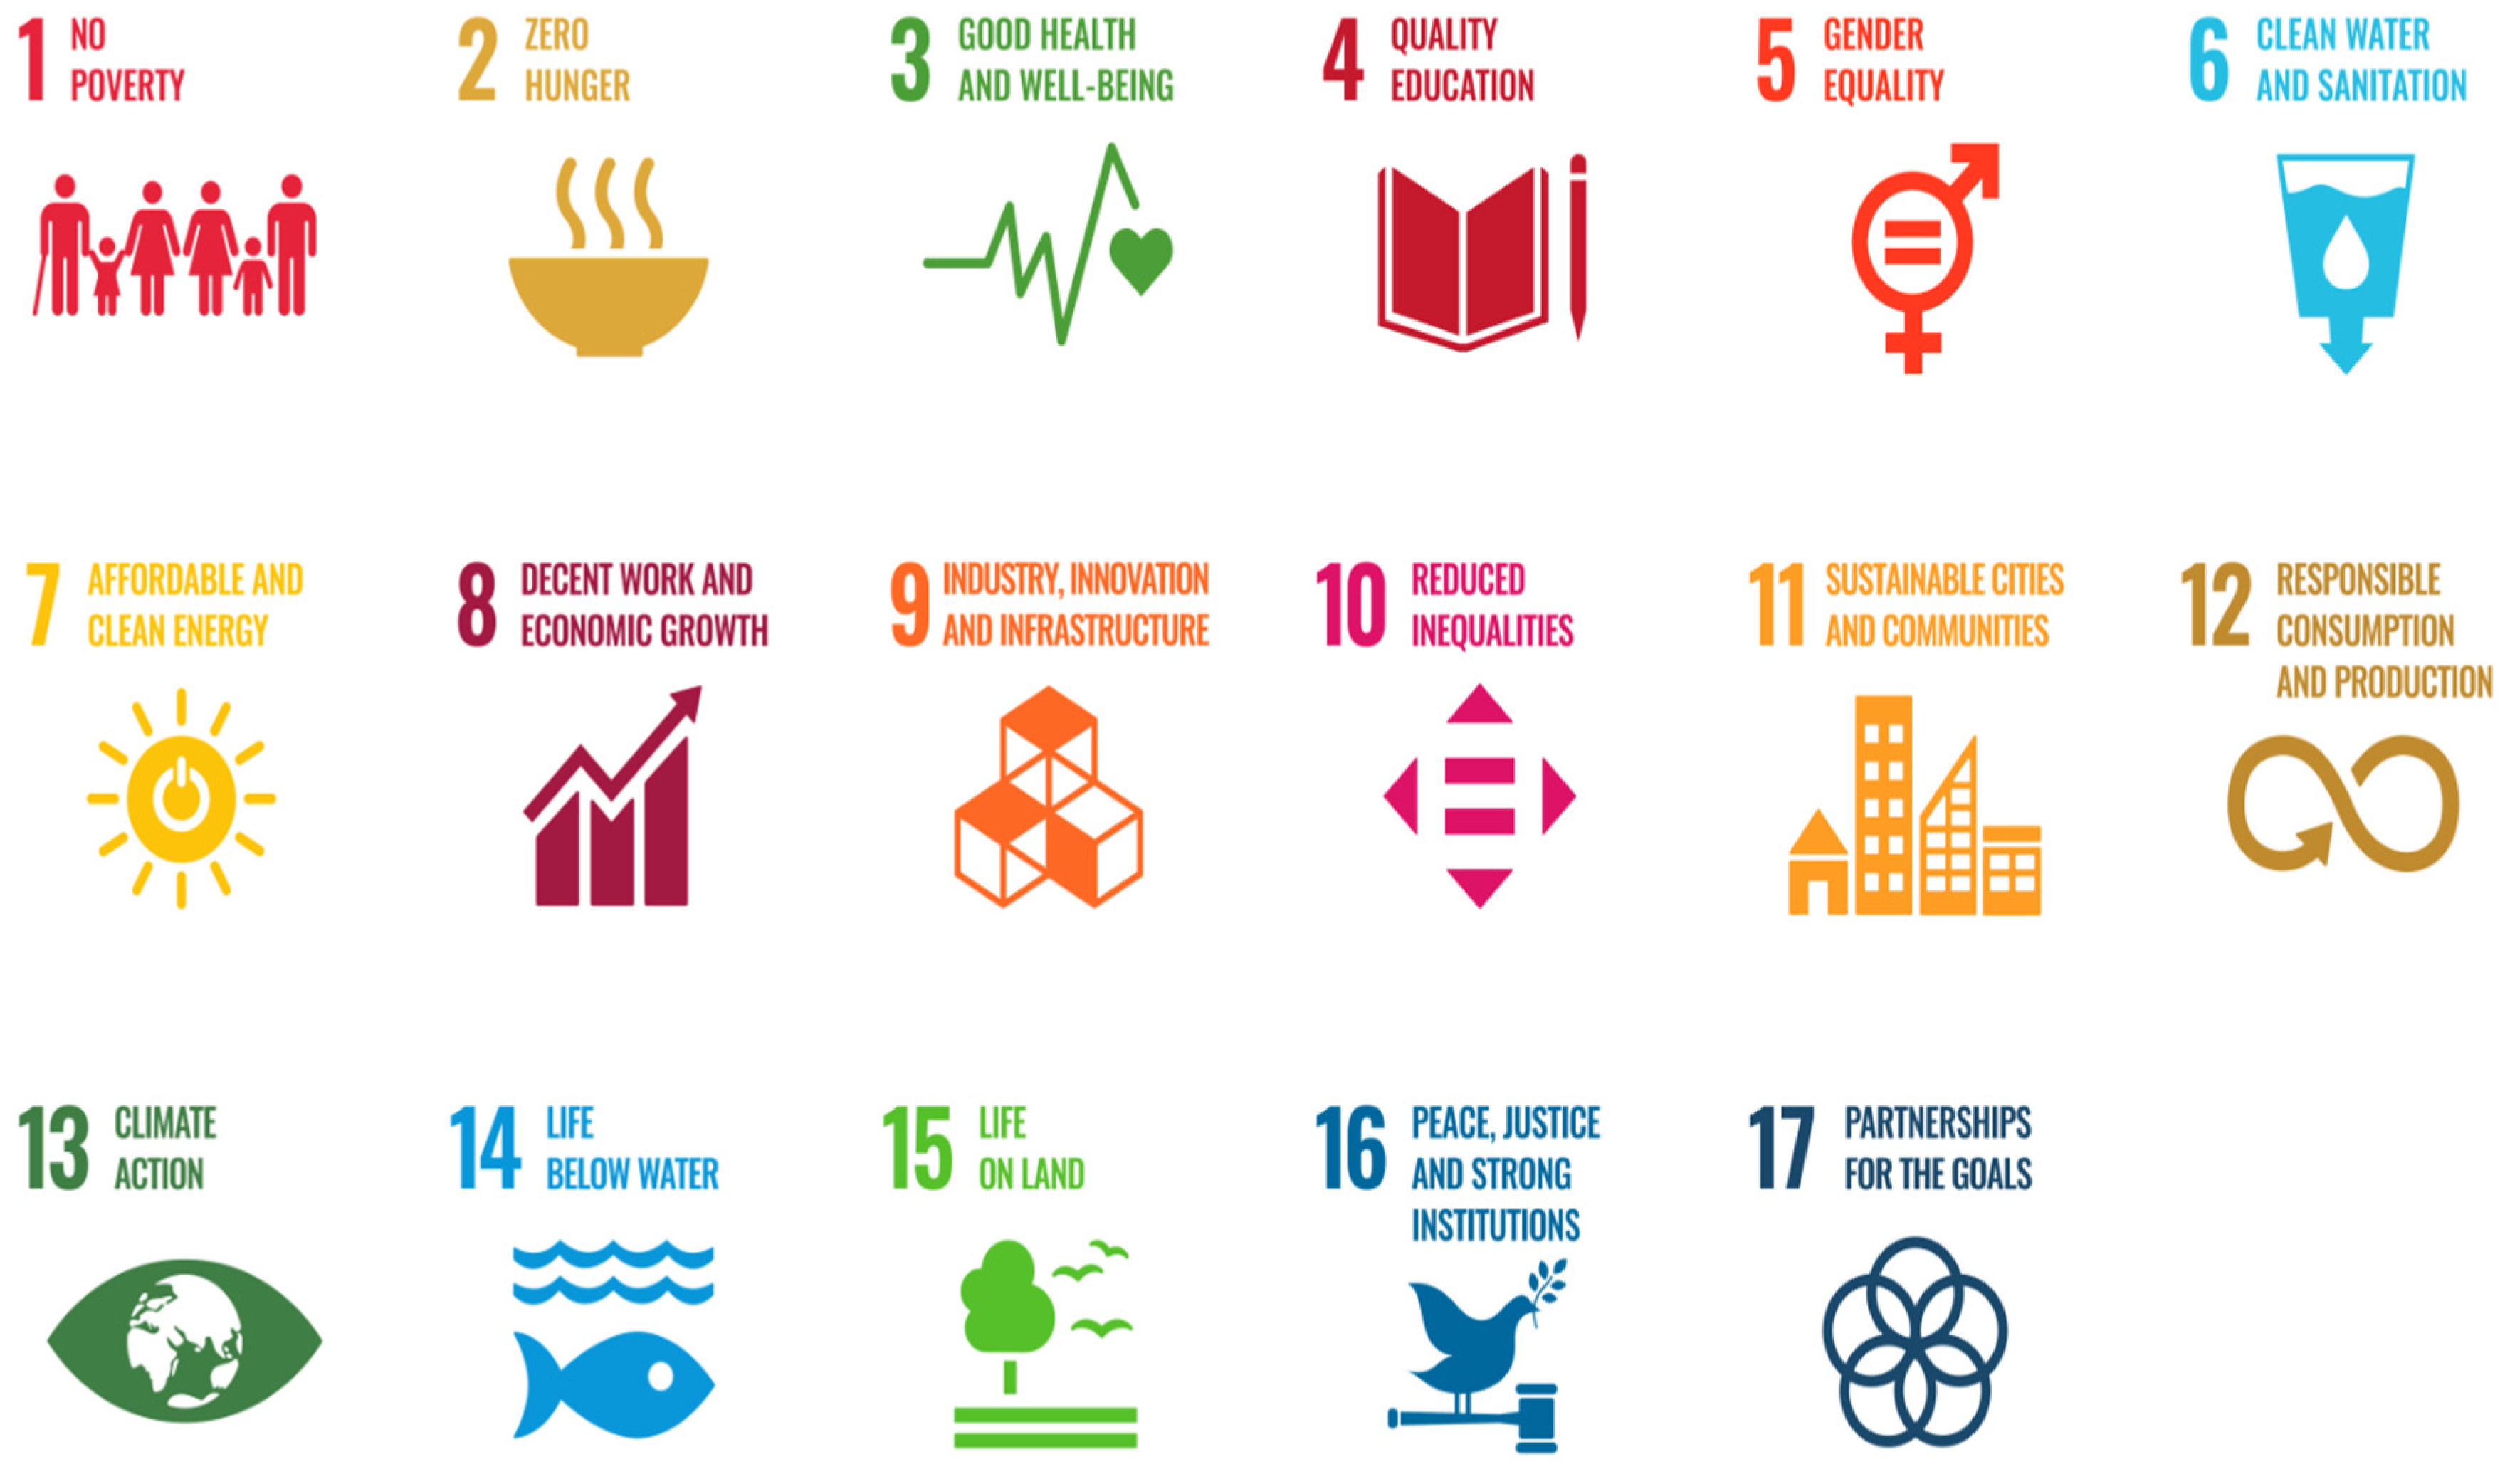
  • Economic pillar: SD goals 1, 2, 3, 8, and 9.
  • Social Pillar: SD goals 4, 5, 10, 11, 16, and 17.
  • Environmental Pillar: SD goals 6, 7, 12, 14, 13, and 15.
Following the setting of the 17 goals (SDG) in 2017, the European Union issues yearly reports on the progress of European countries and the fulfilment of the goals [10]. This new strategy, called the European Green Deal, has now become a requirement for all European countries. According to the EU [10], this requirement is an attempt to form a more modern, efficient, and competitive economy, which in turn will make the countries less dependable on resources (such as fossil fuels for energy) in order to reduce gas emissions (reaching zero in 2050) and provide a more healthy and prosperous society. Moreover, according to the European Union [10], the COVID-19 crisis demonstrated the necessity for sustainable development and that the SDGs can offer Europe resilience and integrity [10]. All in all, it appears that SD is an opportunity worth exploring for every European business.
Similar conclusions were drawn from reports in Greece [21,22]. Furthermore, the Greek state, through various laws and development programs, has been trying since 2018 to help and promote sustainable development in the business sector [22,23]. However, Greece’s SDG situation is worse compared to the overall picture in the European Union [10]. Greece is progressing towards many SDGs, but on average, most of the indicator values are below the EU average. Regarding SDG8 and SDG9, which refer to businesses, they appear at −40% on average [9] (Figure 2).

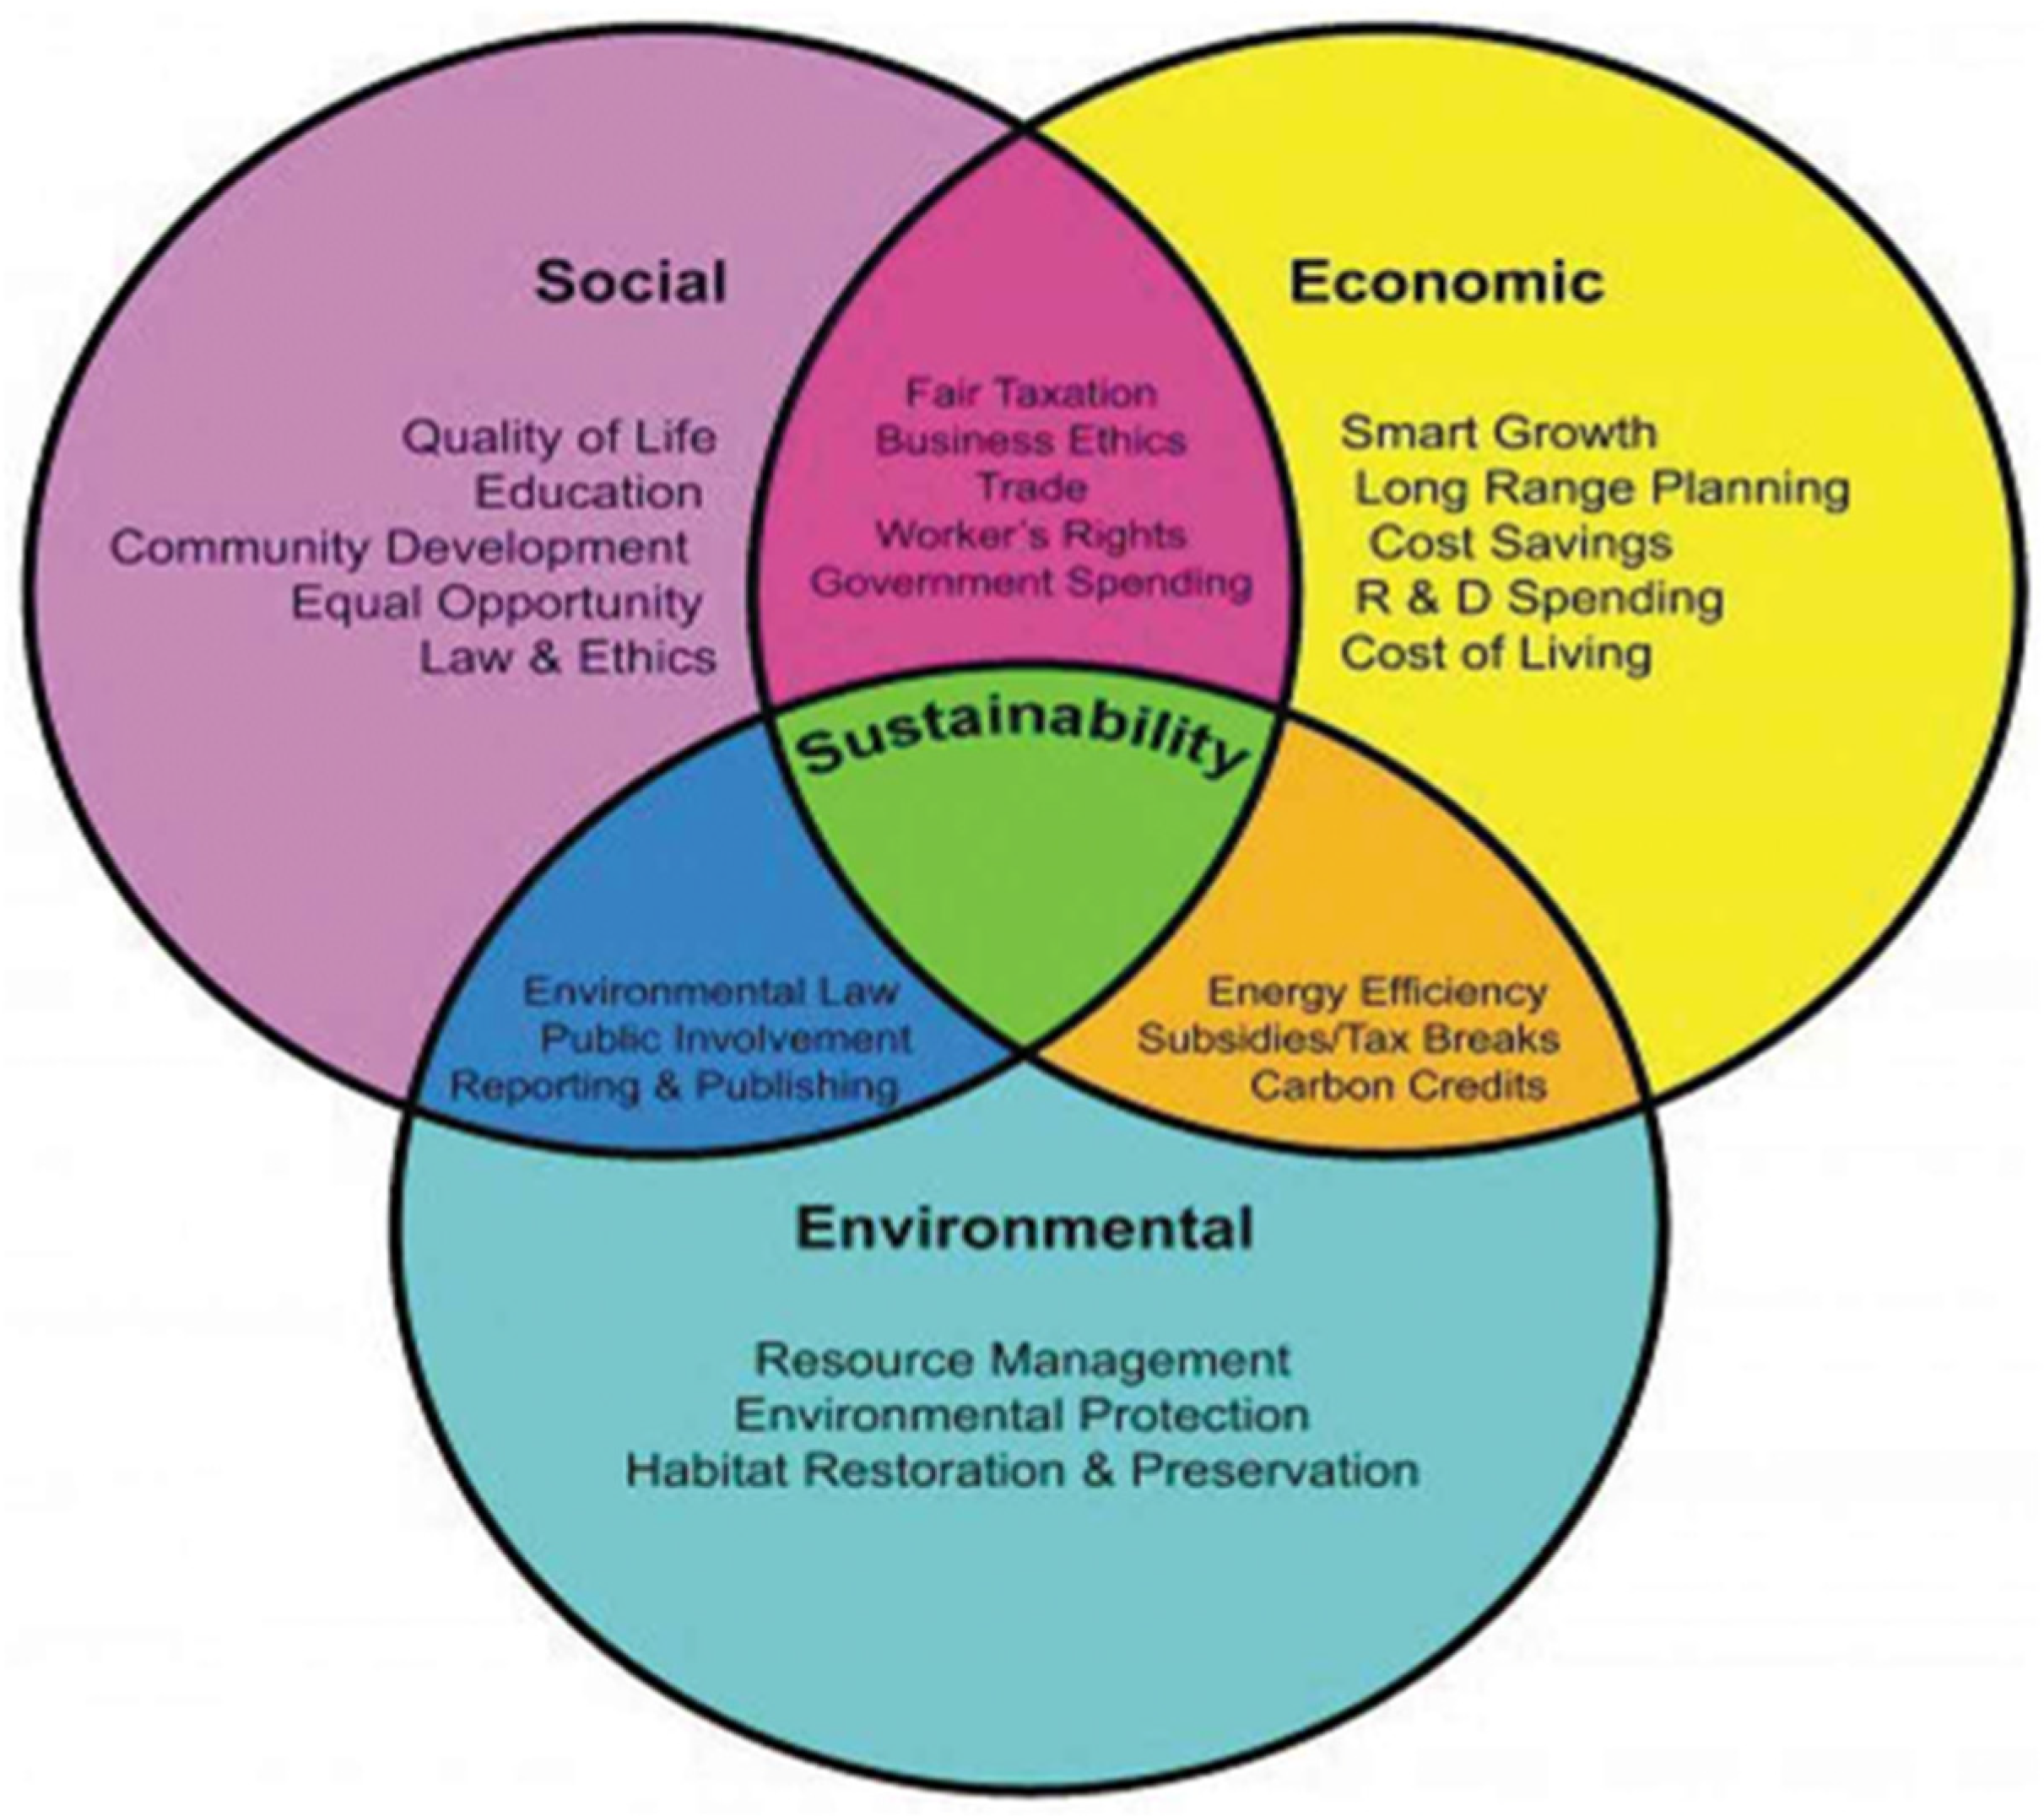
2.2. Sustainable Development and the TBL (Triple Bottom Line)

The Triple Bottom Line (TBL) concept was introduced to refer to a system of measuring a company’s performance and success using economic, social, and environmental bottom lines [24]. Thus, by definition: “TBL sustainability is the result of an organization’s activities, voluntary or mandated by law, that demonstrate an organization’s ability to sustain its business activities (including its financial viability, as applicable) without adversely affecting no social or environmental system” [25]. In other words, this concept, and therefore the measure system it describes, can contribute to businesses’ financial success without crossing any social or environmental boundaries, while concurrently maintaining an interchangeable connection as depicted in Figure 3.
The concept of the economic pillar in the TBL refers to the impact of business practices on the economic system, which must be sustained and evolve for future generations [24]. It refers to the ability of a business or an organization to make a profit, taking environmental considerations into account [27]. An example of good practice is when companies seek to cooperate with other agencies, thus creating industrial clusters among themselves, reaping the benefits and achieving economic viability [28].
The social pillar in the TBL refers to good conduct and practice that a business brings to society, giving value to the society itself [24]. In addition, people constitute part of the social responsibility of a business [5]. Better employee relations and fairer wages could form a part of the social pillar of the TBL. The pillar references social interactions, behavioural patterns, and values of business relationships with the community [27]. It reflects the goals that a company has set in order to satisfy the ever-changing social demands in terms of social services [28]. Examples of such actions may include updating the health and safety regulations to ensure a better workplace for employees and organising charitable actions and events to give back to the community.
The concept of the environmental pillar in the TBL describes the ecological practices of a business. It refers to an organization’s practices that do not endanger environmental resources for future generations, and also to the environmental initiatives undertaken for business sustainability [24]. In addition, it focuses on the planet and, more specifically, the responsibility that businesses should have towards the environment [5]. Some of the environmental initiatives are, for example, reductions in carbon dioxide emissions and energy resource use. Thus, environmental performance is often measured through EMSs (Environmental Management Systems) such as the ISO 14001series or EMAS [27]. Resources and the environment are at the core of the environmental pillar and environmental protection. For example, the use of photovoltaics for electricity production and water recycling can be considered actions of the environmental pillar. Furthermore, environmentally friendly industrial growth may positively affect sustainable competitiveness [29].
To rate companies’ sustainability performances, measurement systems should be used. Examples of such measures include:
  • Global Reporting Initiative (GRI) standards, which are used to report company’s impacts on the environment, economy, and people [30,31]. Many companies worldwide uses GRI as a means of promoting a green corporate image [30].
  • Corporate Social Responsibility (CSR), which is a business performance measurement system that integrates social and environmental concerns regarding the activities of businesses. Despite not being compulsory, it shows a positive commitment toward society [32]. Reforestation of an area by planting trees to improve the environment is an indicative example of CSR.
  • Environmental management system (EMS), which are guidelines that a company may use to protect the environment. The EMS supports the environment through the prevention of pollution and the use of a management system, which provides guidance and usually a third-party certification (e.g., ISO 14001) [28].
  • A specific sustainable development performance measurement system called ESG (Environment, Social, Governance), which has been used by companies in recent years. Companies that adhere to ESG criteria are considered less risky, with a good long-term course, future, and organizational structure [6]. Today, many companies are using ESG to publicly inform shareholders and society about their actions towards sustainability.
The concept of the TBL suggests that businesses can reap positive economic results from adopting sustainable development practices in addition to demonstrating socially and environmentally responsible behaviour [33].

2.3. Sustainable Development and Business Strategies

Before the beginning of the 20th century, many businesses could be successful without adopting sustainability initiatives or practices. Specifically, despite their productive initiatives and operations, and without the existence of any protection or precautionary measures, various waste from production or even from energy production was deposited in rivers and lakes, resulting in water and air pollution [34,35]. However, the protection of society and the environment seems to be gaining importance and the concept of sustainability has been adopted by a growing number of businesses. The concept of sustainability is of great importance and lies in the fact that in order for a business to be successful in the long term, it must be often re-evaluated based on the surrounding ecosystem, society, and environment [16]. In addition, companies that use sustainable development practices are considered better in terms of their “image”. Explicitly, a company which takes into consideration both society and the environment (i.e., helping with additional human-centred actions and avoiding pollution), exhibits a socially and environmental friendly corporate image to the external environment [16].
A company, in terms of its strategy concept, must analyse the strengths and weaknesses of its external environment in relation to its competitors to find the best opportunity to positively influence its competitive advantage. The goal of business through strategy is of course to increase profitability [11]. The definition of strategy in reference to the above is the relationship between the competitive advantage and profitability of the business, which results from an analysis of both the external and the internal environment. A business should need to create an appropriate vision, mission, clear achievable goals, objectives, and set policy guidelines [35]. The goals and objectives indicate the plans for the future, and while the latter is measurable, the former is more arbitrary and unmeasurable, and shows a general preference for planning for the future [35]. An example of a sustainable mission is that of the company Chipotle. Chipotle had stated that: “To change the way people think about and eat fast food having a vision to serve delicious food made from fresh ingredients that come from sustainable resources and sold at reasonable prices, having a strategic direction of Food with Integrity”. It is evident that the company’s mission places great emphasis on finding the best raw materials produced through sustainable development, with respect for animals, the environment, and farmers [35].
Once a vision and a mission have been identified, a strategy that integrates the main business approach to achieve the vision, mission, and goals should be developed. In this case, sustainable development does not only affect one part of the business, but it also requires the systematic change of many functions [35]. Thus, environmental changes or other pillar changes may, on the one hand, present advantages but, on the other hand, be costly. In conclusion, a sustainable strategy requires analysing all three pillars of the TBL to achieve a competitive advantage that leads to profit.
The formation of a business strategy aims to highlight the competitive advantage of the company in relation to the competitors to gain further ground and ultimately a gradual lead in the market. A competitive advantage adds value to a business. In addition, the term “value” can be characterised as an economic concept that a company expects through the management of all resources and functions that its strategic plan provides for the creation of large returns and profit [35]. The profit that a business expects to have after implementing a strategy is measured as business performance. Thus, it is the value that gives the economic response to customers and the market, leading the business to acquire a competitive advantage and thus a competitive business performance [36]. Many organizations calculate their business performance by analysing this financial level in relation to previous years, based on their cost of “production”. Nowadays, however, adoption of a production system based on the criteria of long-term sustainability of resources is seen as a tool to address both economic and environmental crises. In this context, a necessary condition is the development of productive structures that favour sustainability. It is also necessary to explore the impact of sustainable development measures on business performance.

3. Materials and Methods

3.1. Research Hypotheses

The study investigates whether Greek businesses are fully aware of the sustainable development concept. Unfortunately, there are not many surveys that reference the corporate sustainability of Greek businesses [22,23]. European reports have presented the level of sustainable development of Greece but not that of Greek businesses [9]. As far as Greek businesses are concerned, there are some sustainability data, but they mainly come from reports of larger companies rather than smaller ones and they fail to address the TBL connection to their functions.
In the context of this study, the relation of the three sustainable development pillars (social, economic, and environmental) with competitive advantage is examined. Regarding the environmental pillar, there are positives advantages for companies that follow environmental practices of sustainable development. Surveys have shown that when businesses analyse the external environment for environmental issues, this have a positive relation with their performance, because it helps them identify future demands such as green products [35,37,38]. Regarding the social pillar, certain actions of businesses (such as giving back to the community) can create a positive image for a company. Moreover, the literature review indicates the existence of a positive correlation between the social pillar and a competitive advantage, which is reinforced by improving customer satisfaction [39].
In addition, as far as the financial pillar is concerned, this mainly targets the business strategy of a company. This pillar focuses on the cooperative relations of the companies which have sustainable development practices [28]. Similar to the above, collaborative relationships can be positively related to a competitive advantage [40].
The concepts of correlation were coded as follows:
  • SP: social pillar;
  • EP: economic pillar;
  • ENP: environmental pillar;
  • CA: competitive advantage;
  • BP: business performance.
Studies have pointed out that businesses that integrate SDGs into their strategies generate positive impacts on society and businesses also. In this sense, SDGs and the TBL concept contribute to the development of competitive strategies and value creation processes of companies [41,42]. Furthermore, the role that organizations play in contributing to the advancement of the Sustainable Development Goals (SDGs) is also under examination and many attempts to embed SDGs within businesses practices have emerged [43,44]
Considering what has been mentioned previously and the fact that SDGs represent an important opportunity for enterprises to reap a number of benefits, the following five hypotheses are formed:
Hypothesis 1 (H1). 
There is a statistically significant relationship between the social pillar (SP) of sustainable development and competitive advantage (CA).
Hypothesis 2 (H2). 
There is a statistically significant relationship between the economic pillar (EP) of sustainable development and competitive advantage (CA).
Hypothesis 3 (H3). 
There is a statistically significant relationship between the environmental pillar (ENP) of sustainable development and the competitive advantage (CA).
Hypothesis 4 (H4). 
There is a statistically significant relationship between the three pillars of sustainable development and competitive advantage (CA).
Hypothesis 5 (H5). 
There is a statistically significant relationship between the competitive advantage (CA) of sustainable development and business performance (BP).

3.2. Research Design and Methodology

The present research was conducted via a questionnaire. The questionnaire was structured in accordance with the literature on sustainable development as follows: (1) formulation of the questions, (2) the method of coding the questionnaire answers or measurements, and (3) the general appearance of the questionnaire [45]. The questionnaire was then sent via email, accompanied by an introductory note and a link created through Microsoft forms which transferred the respondents to the electronic questionnaire.
In the sampling procedure, a business database from ICAP was used, along with the ICAP database of the 40 best industries in Greece in 2018 and 2020. These databases contain information on various Greek companies on sustainable development practices [46,47].
After the sectors and companies were examined through ICAP, two websites were then used to extract further data on Greek companies. Firstly, the website http://www.findbiz.gr/ (accessed on 28 May 2022). was used for the extraction of company data such as website address, email, percentage (%) of turnover, local address, telephone, the approximate number of people they employ, and the name of the company manager. All the above data were helpful for having the correct email address and person in charge in order to to address the questionnaire to the correct person in charge. Secondly, the second website was http://www.dnb.com/ (accessed on 28 May 2022), which gave the same data as the previous one, allowing a cross check on the turnover and headcount numbers with the previous year.
Due to the need for the questionnaire not to be biased, a random selection of Greek companies was made from various sectors of the economy. According to all the above, a total of 150 Greek companies were selected from the following sectors: 3PL, Logistics, Meat products, Renewable energy sources, Energy, Dairy and Cheese, Household furniture, Pasta, Paper Products, Health—Personal Hygiene and Cleanliness, Paper, Supermarket, Juices—Soft Drinks, Pharmaceuticals, Fuels—Lubricants, Banks, Packaging—Plastics, Salt, Machinery—Equipment, Chocolate, and Olive—Fruit and Oils.
Questionnaires were sent in groups of 30, as it was easier to make contact over the phone, in order to kindly remind participants to respond to the questionnaire and identify the people in charge of sustainable development. In the end, 150 questionnaires were sent via e-mail, and 34 questionnaires were returned (electronically), a response rate of 22.6%. A total of 33 out of 34 questionnaires were deemed eligible, whereas 1 was rejected as it was unsuitable for analysis.
The questionnaire consisted of 39 questions with 5-point Likert-type responses, 3 Yes/No questions, 3 multiple choice questions, and 6 open-ended questions. The questions were organized as follows: the first section was an introductory section on sustainable development, the second section examined the use of sustainable development in business, and the third section examined the competitive advantage and business performance gain through SD. Finally, Section 4 and Section 5 asked for general information and the personal details of the respondent, respectively. The coding and analysis of the data were conducted through Excel and SPSS version 27. The authors conceived the questions included in the questionnaire through an extensive review of the literature [27,48,49,50].

4. Data Analysis and Results

After the collection of the questionnaires, the results showed that the data were unidimensional. In addition, two different methods were used to assess reliability. First, internal consequences were assessed. Cronbach’s alpha index was applied to examine the internal consistency of all questions of the questionnaire and the analysis showed that the scale had an acceptable level of reliability (α = 0.943), well above the acceptable level (0.70). Thus, the questionnaire was considered appropriate [45,51].
Bartlett’s test of sphericity was then used to examine the correlation of the variable through a chi-square value, which was 736.702 with a degree of freedom of 325 and excellent correlation (r < 0.001), an acceptable result [52]. In addition, the KMO effect confirmed the result [53]. The KMO value was 0.546, greater than 0.5. Thus, the questionnaire was deemed suitable for analysis [52].
In conclusion, the questionnaire was suitable for analysis and general descriptive statistics tools were used, such as Microsoft Excel graphs and the SPSS 27 program. More specifically, the results of the questionnaire were analysed for univariate statistics and multivariate correlations with the use of SPSS 27.

4.1. Univariate Statistics

For a better analysis of the responses presented in the figures and tables, the Likert scale responses were grouped into three categories:
  • Positive: includes the categories ‘agree’ and ‘strongly agree’;
  • Neutral: includes the category ‘neither agree nor disagree’;
  • Negative: includes the categories ‘disagree’ and ‘strongly disagree’.
Additionally, the questions considering the three pillars of the TBL were categorized as environmental, social, and economic
Figure 4 and Table 1 present the responses of the questionnaire regarding the perceptions of enterprises on sustainable development (Section 1). The questions, based on the three pillars of the TBL, are categorized as follows:
  • Environmental: “Would you adopt systems to reduce environmental impact like packaging?”, “Your business practices focus on environmental issues”.
  • Social: “Your business practices focus on social issues”, “Are you considering the social welfare of society as a whole?”, “Do your HR processes exceed legal requirements?”.
  • Economic: “Your business practices focus on financial issues”, “Is sustainable development a means of focusing on market survival?”, “Do most of your competitors take environmental protection measures?”.
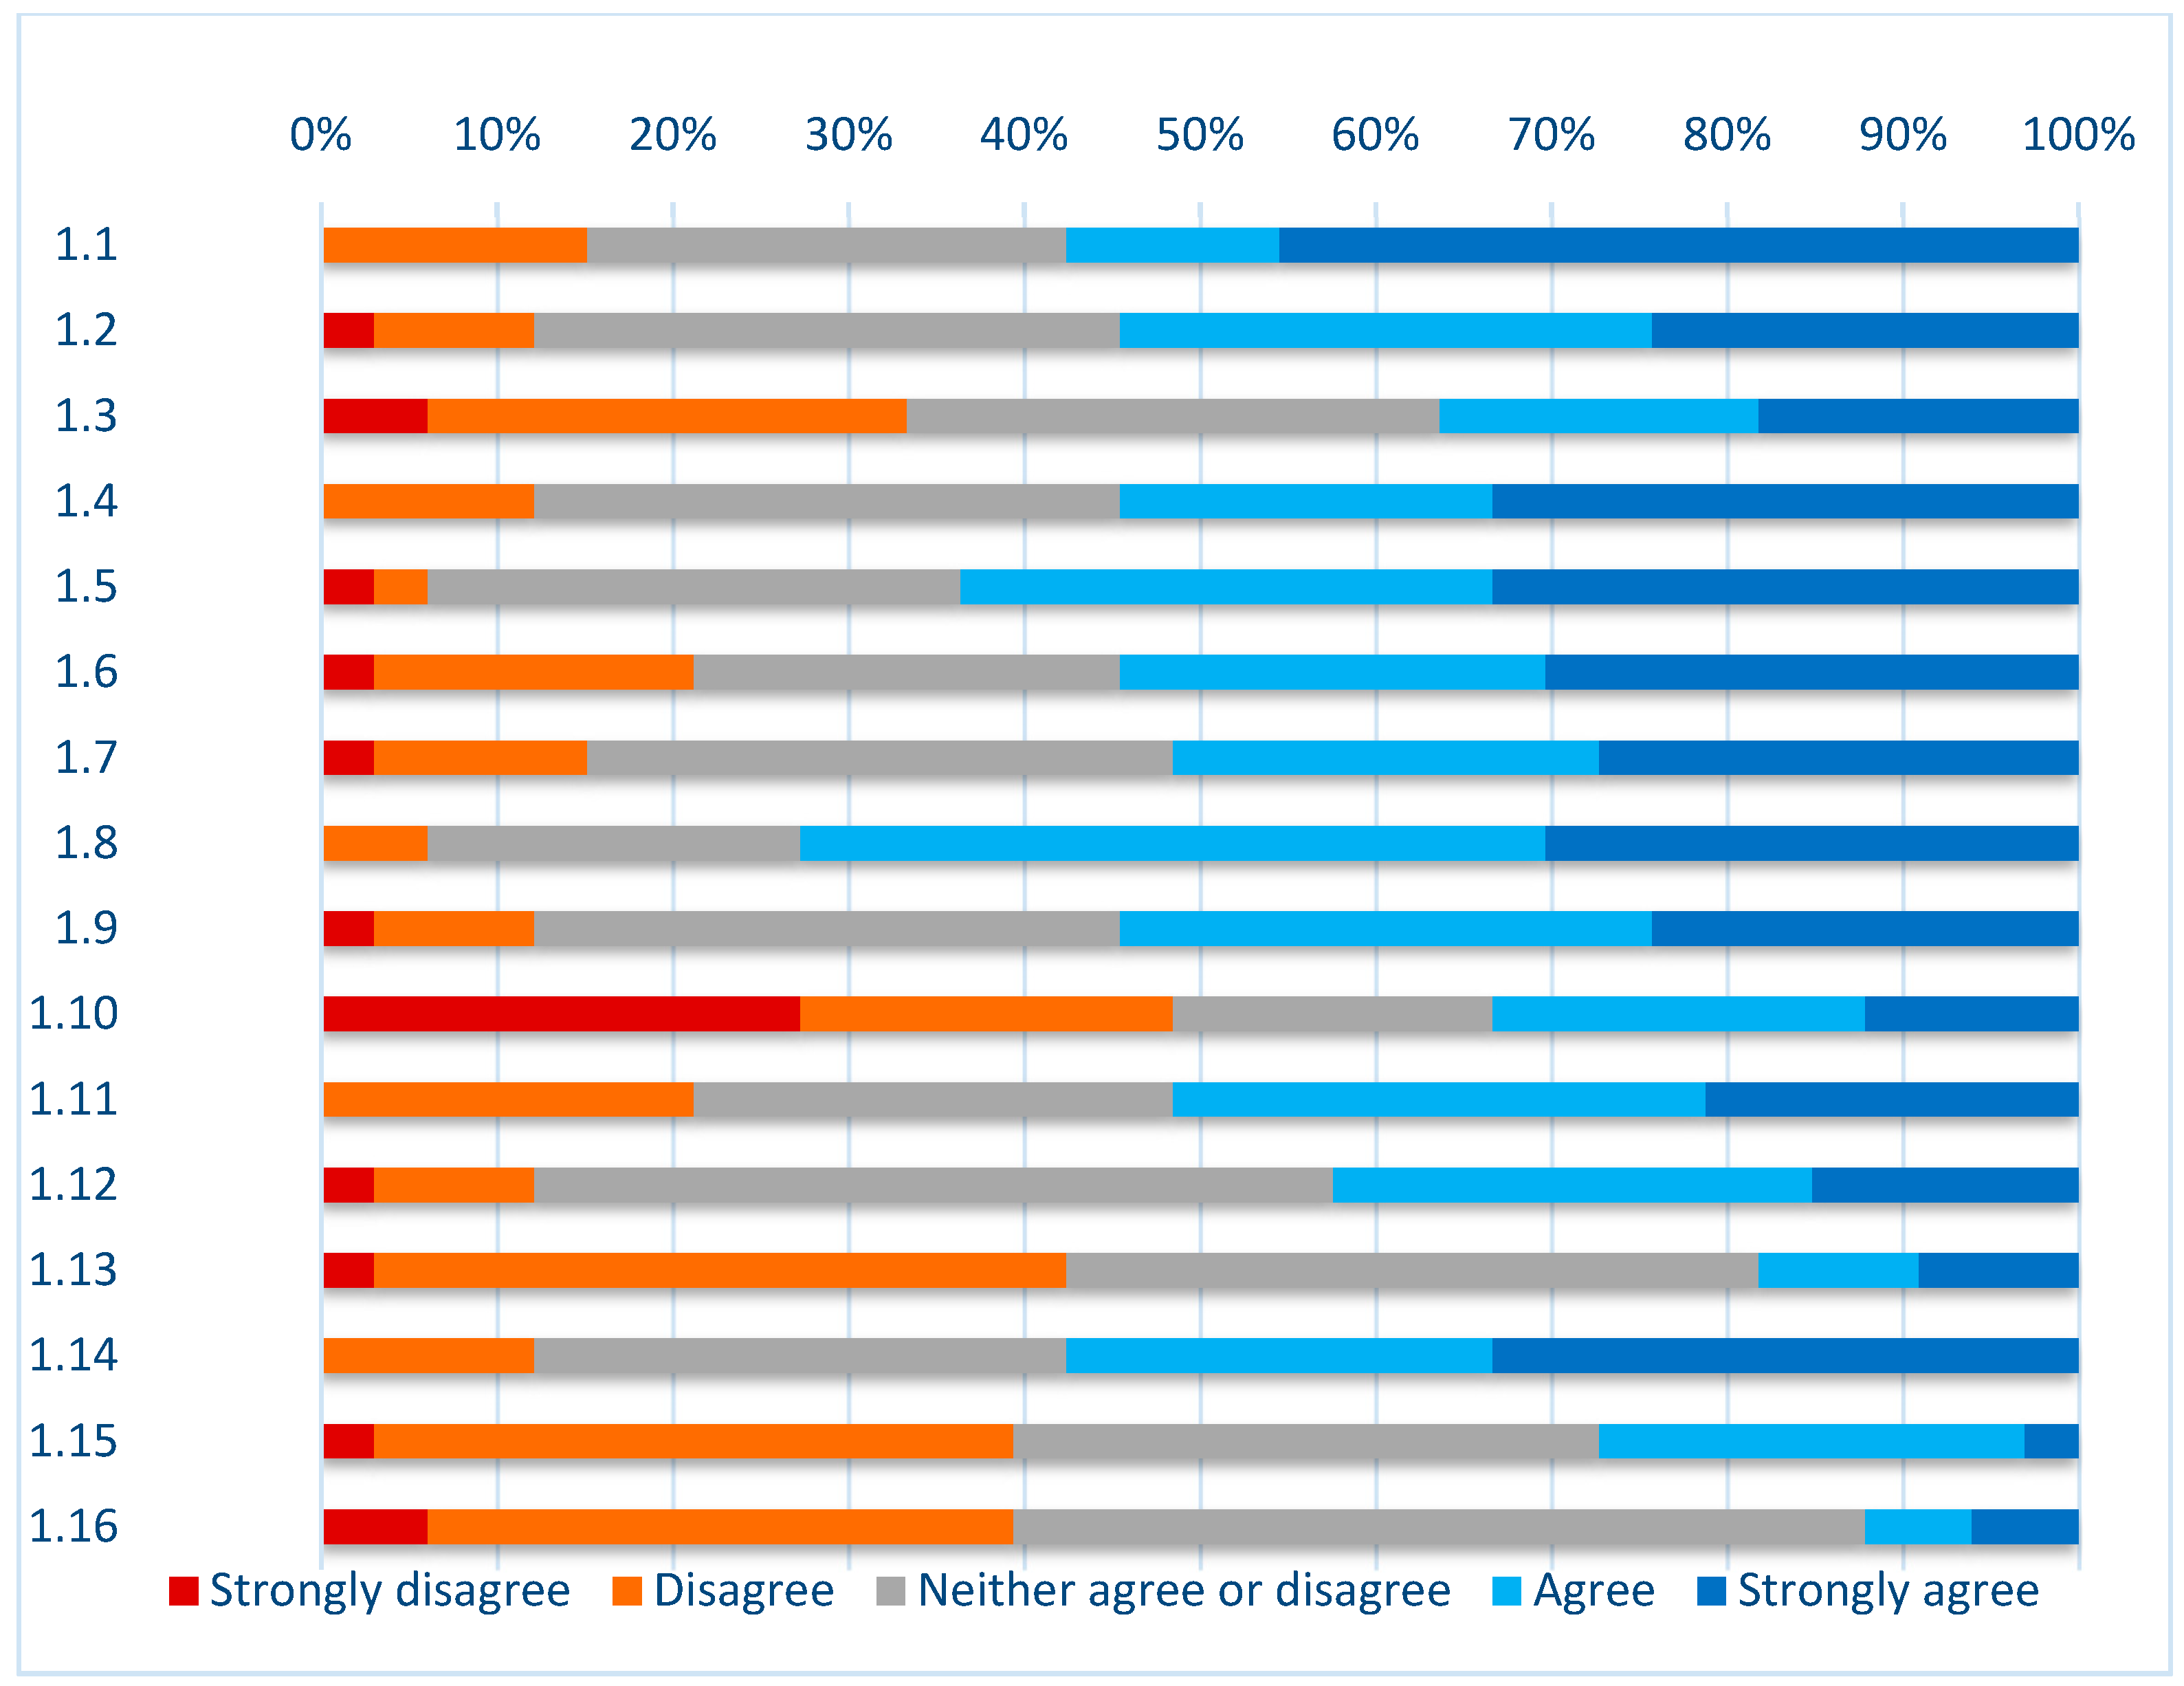
Figure 4. Perceptions of enterprises on sustainable development (Section 1).
Businesses 03 00027 g004
Table 1. Percentages of responses for the five dimensions of the Likert scale regarding Section 1 of the questionnaire.
Section 1Strongly DisagreeDisagreeNeither Agree nor DisagreeAgreeStrongly Agree
1.1 Do you know what sustainable development is?0.00%15.15%27.27%12.12%45.45%
1.2 What is the value of sustainable business practices to your company?3.03%9.09%33.33%30.30%24.24%
1.3 Is implementing sustainable practices within the business and its business network complex and time consuming?6.06%27.27%30.30%18.18%18.18%
1.4 Would you use sustainability key performance metrics?0.00%12.12%33.33%21.21%33.33%
1.5 Would you adopt systems to reduce environmental impact like packaging?3.03%3.03%30.30%30.30%33.33%
1.6 Your business practices focus on environmental issues3.03%18.18%24.24%24.24%30.30%
1.7 Your business practices focus on social issues3.03%12.12%33.33%24.24%27.27%
1.8 Your business practices focus on financial issues0.00%6.06%21.21%42.42%30.30%
1.9 Are you considering the social welfare of society as a whole?3.03%9.09%33.33%30.30%24.24%
1.10 Do your HR processes exceed legal requirements?27.27%21.21%18.18%21.21%12.12%
1.11 Sustainable development is a means of advertising0.00%21.21%27.27%30.30%21.21%
1.12 Sustainable development is a means of focusing on market survival3.03%9.09%45.45%27.27%15.15%
1.13 Sustainable development is known in the market3.03%39.39%39.39%9.09%9.09%
1.14 Would you use Sustainable Performance Measurement Systems?0.00%12.12%30.30%24.24%33.33%
1.15 Do customers, suppliers, government, and other stakeholders encourage the organization to identify itself as a green business?3.03%36.36%33.33%24.24%3.03%
1.16 Do most of your competitors take environmental protection measures?6.06%33.33%48.48%6.06%6.06%
Regarding the environment questions in Figure 4 and Table 1, most businesses answered the two corresponding questions “positively”, with 63.64% and 54.55% respectively, indicating that they consider the environmental ratings with great importance. Regarding the social issues, answers were more divided, but the majority responded “positively”. The question that was conflicting in the results was that of the legal requirements of their human resources, where most responded “negatively”, with a percentage of 48.28% , stating that a business would find it difficult to exhaust its resources regarding its employees. In addition, regarding the financial issue, again, the businesses had difficulty reaching a majority answer. What is worth mentioning is that businesses generally believe in focusing on economic issues based on sustainable development with the percentage of “positive” answers at 72.73% . Furthermore, regarding the question of whether sustainable development is a means of advertising, most answered “positively”, with a percentage of 51.52% . Finally, the questions concerning sustainable development as a means of focus for survival in the market and the measures taken by their competitors for protecting the environment gained “neutral” responses, with percentages of 45.45% and 48.48%, respectively.
Figure 5 and Table 2 present the responses of the questionnaire regarding the actions and measures adopted by businesses in the direction of sustainable development (Section 2). The questions, based on the three pillars of the TB, are categorized as follows:
  • Social: “Do you provide procedures that help ensure the health and safety of our employees?”, “Do you support your employees who wish to pursue further education?”, “Do you provide your employees with salaries that properly and fairly reward them for their work?”, “Do you treat all employees fairly and respectfully, regardless of gender or ethnic background?”
  • Environmental: “Have you adopted processes to reduce energy consumption?”, “Have you adopted processes to reduce and recycle waste?”, “Have you adopted processes to reduce water consumption?”, “Have you implemented systems to reduce harmful emissions?”, “Have you adopted systems to reduce packaging environmental effects?”
  • Economic: “Do you involve all suppliers in new products or services development?”, “Do you inform all suppliers of products and services about organizational changes affecting purchasing decisions?”, “Do you provide all customers with the information needed to make sound purchasing decisions?”.
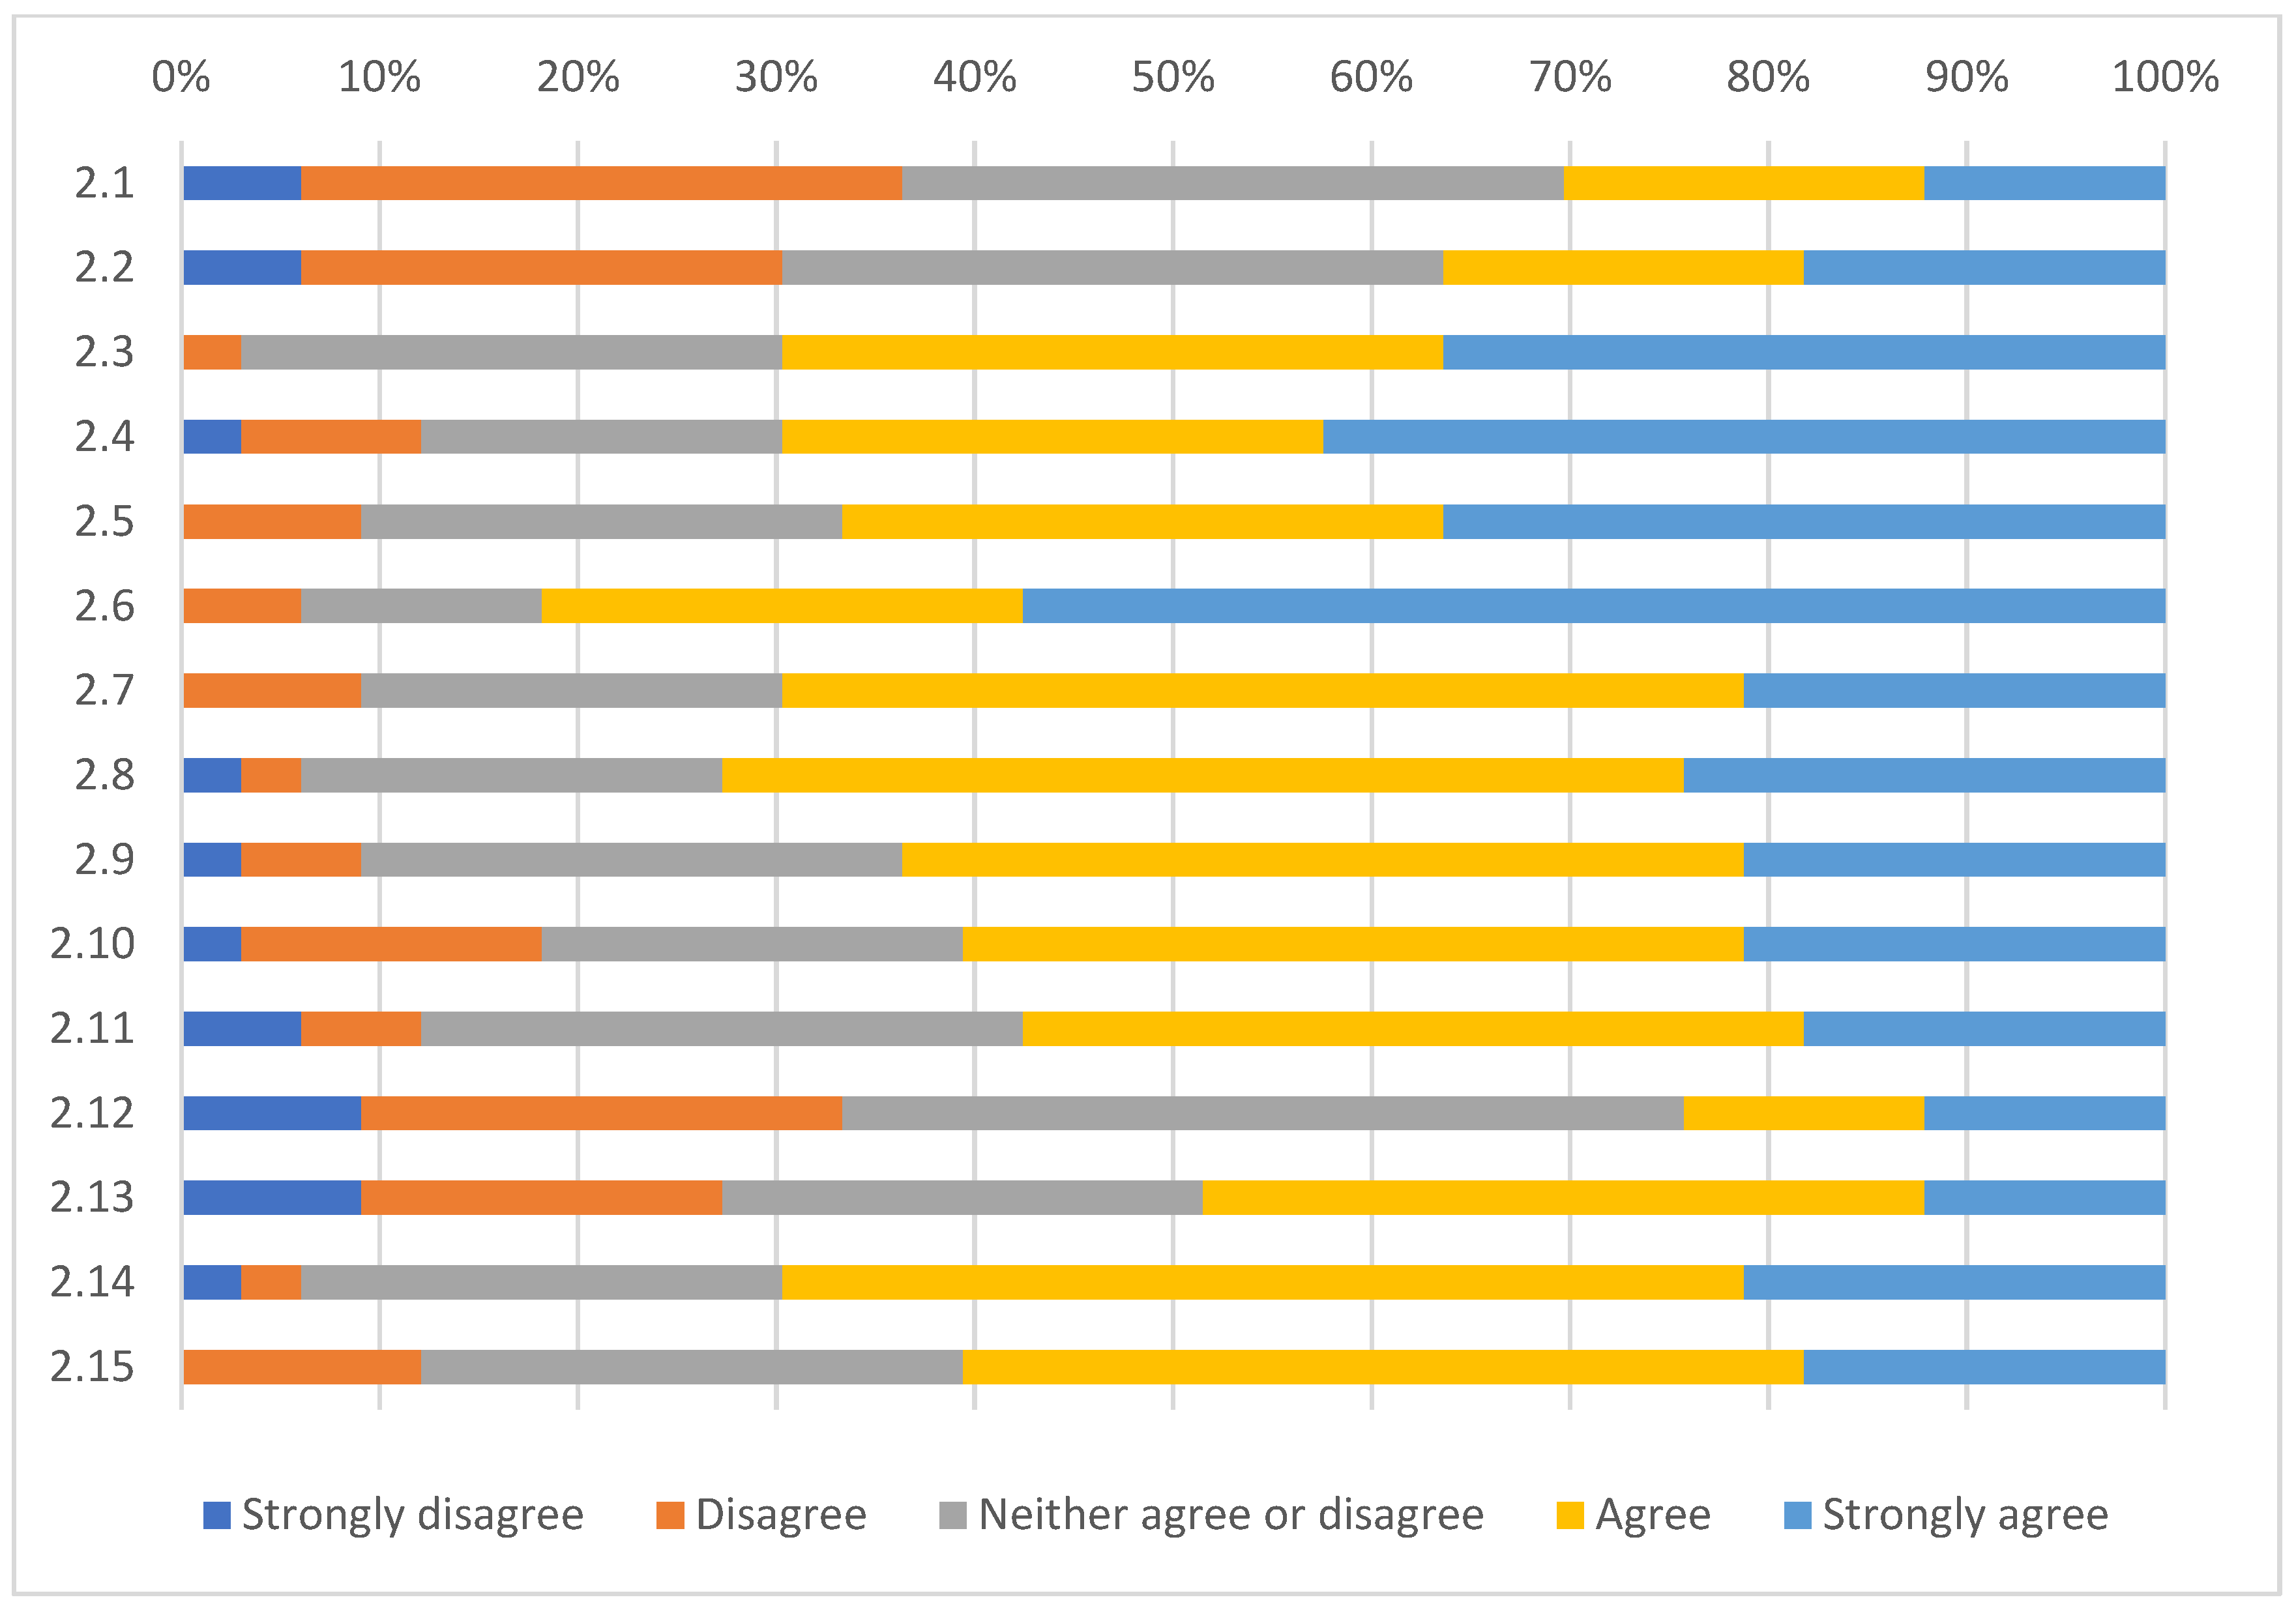
Figure 5. Actions and measure adopted by businesses in the direction of sustainable development (Section 2).
Businesses 03 00027 g005
Table 2. Percentages of responses for the five dimensions of the Likert scale regarding Section 2 of the questionnaire.
Section 2Strongly DisagreeDisagreeNeither Agree nor DisagreeAgreeStrongly Agree
2.1 Performance measurement systems, including sustainability key performance indicators?6.06%30.30%33.33%18.18%12.12%
2.2 Social, environmental or sustainability reporting?6.06%24.24%33.33%18.18%18.18%
2.3 Do you provide procedures that help ensure the health and safety of our employees?0.00%3.03%27.27%33.33%36.36%
2.4 Do you support your employees who wish to pursue further education?3.03%9.09%18.18%27.27%42.42%
2.5 Do you provide your employees with salaries that properly and fairly reward them for their work?0.00%9.09%24.24%30.30%36.36%
2.6 Do you treat all employees fairly and respectfully, regardless of gender or ethnic background?0.00%6.06%12.12%24.24%57.58%
2.7 Have you adopted processes to reduce energy consumption?0.00%9.09%21.21%48.48%21.21%
2.8 Have you adopted processes to reduce and recycle waste?3.03%3.03%21.21%48.48%24.24%
2.9 Have you adopted processes to reduce water consumption?3.03%6.06%27.27%42.42%21.21%
2.10 Do you implement systems to reduce harmful emissions?3.03%15.15%21.21%39.39%21.21%
2.11 Have you adopted systems to reduce packaging’s environmental effects?6.06%6.06%30.30%39.39%18.18%
2.12 Do you involve all suppliers in new products or services development?9.09%24.24%42.42%12.12%12.12%
2.13 Do you inform all suppliers of products and services about organizational changes affecting purchasing decisions?9.09%18.18%24.24%36.36%12.12%
2.14 Do you provide all customers with the information needed to make sound purchasing decisions?3.03%3.03%24.24%48.48%21.21%
2.15 The level of customer satisfaction is higher than that of competitors0.00%12.12%27.27%42.42%18.18%
Regarding the questions of the social pillar of Figure 5 and Table 2, 71.97% of the responses were very “positive”. The response to treating employees fairly and with respect, regardless of gender or ethnic origin, was particularly positive, with a respective percentage of 81.82% .Regarding the questions referring to the environmental pillar, the answers were “positive”, with a percentage of 64.85%. In addition, based on the data, 69.70% of Greek businesses try to reduce their energy consumption and 72.73% adopt recycling practices. In addition, regarding the reduction in harmful emissions, a positive reply was given by 39.39% of the businesses. Regarding the financial level, businesses found it difficult to reach a majority response. In most of them, the respondents answered neutrally, except for whether they provide their customers with information needed to make good purchase decisions, with 69.70% responding positively. Finally, the respondents answered negatively about the use of performance measurements and key indicators of sustainable development.
The third section of the questionnaire referred to the competitive advantage that Greek businesses acquire from adopting sustainable development practices. This section includes two subsections: the first refers to the association between sustainable development and sustainable business performance and the second to the correlation between sustainable development and a sustainable competitive advantage.
According to Figure 6 and Table 3, the responses of the companies on sustainable business performance were rather negative. Regarding the sustainable competitive advantage (Figure 7 and Table 4), all the answers converged in the category “neither agree nor disagree”. An exception was made for the question regarding sustainable development and whether it is has offered them the opportunity to maintain a market presence in times of crisis, with a percentage of 41.94% answering with “agree”.

4.2. Reliability and Validity Testing, Correlation

To examine the relationship between the three pillars of sustainable development with the competitive advantage and business performance of Greek companies, statistical correlations were used [49,54]. The specific correlation followed the scale and correlation methodology of dividing the questionnaire questions according to the three pillars of the TBL and correlating them with the competitive advantage (Table 5). The statistic number of a correlation can be characterized as low, moderate, high, or very high [55]. In this specific questionnaire, five different correlations were examined, which were (1) three correlations of three pillars of sustainable development and competitive advantage, as well as (2) a general correlation of the pillars of sustainable development to competitive advantage, and (3) the correlation of competitive advantage with business performance.
To examine if the hypotheses are supported and can be accepted, the statistical correlation between the two variables was examined. A correlation coefficient is considered high, moderate, or low according to the following:
  • r ≤ 0.29      No correlation.
  • 0.30 < r < 0.49 No significant correlation.
  • 0.50 < r < 0.69 Medium correlation.
  • 0.70 < r < 0.79 High correlation.
  • 0.80 < r < 0.99 Very high correlation.
The results of the hypothesis tests are given below.
H1. 
Social pillar with the competitive advantage is statistically significant (p < 0.001) and the probability that the specific result is due to random factors is almost zero. Thus, there is a moderate correlation r = 0.677, p < 0.001. Thus, based on Pearson r correlation, hypothesis H1 is confirmed.
H2. 
Economic pillar with the competitive advantage is statistically significant (p < 0.001). There is a moderate correlation r = 0.548, p = 0.001. Thus, based on Pearson r correlation, hypothesis H2 is confirmed.
H3. 
Environmental pillar with the competitive advantage is statistically significant (p < 0.05). However, there is a weak correlation r = 0.389, p < 0.05. Thus, based on Pearson r correlation, hypothesis H3 is not confirmed.
H4. 
Three pillars of sustainable development with the competitive advantage is statistically significant (p < 0.001). There is a moderate correlation r = 0.599, p < 0.001. Thus, based on Pearson r correlation, hypothesis H4 is confirmed.
H5. 
Business performance with the competitive advantage is statistically significant (p < 0.001). There is a moderate correlation r = 0.582, p < 0.001. Thus, based on Pearson r correlation, hypothesis H5 is confirmed.

5. Discussion, Conclusions, and Future Research

As mentioned above, all previous surveys did not include percentage reports on Greek businesses’ awareness of sustainable development and their opinions on this issue. Moreover, in cases where some statistical data were presented, it was through national and European reports addressing the goals of sustainable development at national and European levels. According to the above data, 45.45% of participants (Greek companies) responded positively to whether they know what sustainable development means. Furthermore, on their opinion about whether the government and their external environment promote sustainable development, 36.36% answered “disagree” and 33.33% answered “neither agree or disagree” (neutral), a statement that is also supported by the existing literature. In greater detail, according Figure 3, Greece did not have any sustainable development goals above average compared to EU status, where goals 8 and 9, which refer to businesses, are at −40% on average [9]. Finally, according to the responses, Greek businesses positively believe that it is worth engaging in sustainable development, especially with the economic bottom line and the environmental bottom line, at 72.73% and 59%, respectively. This corresponds to the fact that they seek profit where the economic pillar can give them a competitive advantage and the environmental pillar can bring them a reduction in operating costs. In conclusion, they were aware of the meaning of sustainable development.
In addition, for the practices adopted by Greek companies, which must be in line with sustainable development, most of the businesses followed: (1) environmental bottom line standards, resulting in reductions in energy and recycling and (2) social bottom line standards, focusing on employees. For economic bottom line standards, the Greek companies were neutral. While many of the companies do not have ISO for social responsibility, the majority have ISO 14001 certifications (EMS) and health and safety certifications. In addition, they pay special attention to social standards, a fact that indicates that achieving human-centred results is of greater importance than the certification or measurement system per se. Greek companies had negative opinions regarding the use of performance measurement and key indicators of sustainable development. Lastly, they had negative opinions about sustainable business performance and remained neutral about the competitive advantage questions.
Finally, in terms of correlations, the social bottom line and the economic bottom line were found to have a moderate correlation with competitive advantage (0.677 and 0.548, respectively). In contrast, the environmental bottom line showed a weak correlation with competitive advantage, at 0.389%. This correlation is consistent with the results of Cantele and Zardini [49]. According to the results of the correlation between the social pillar and competitive advantage, Greek firms believe that better treatment of employees and customers is moderately correlated with a competitive advantage and value. Thus, it is agreed that social practices add a competitive advantage, in line with [57]. Furthermore, the correlation between the economic pillar and competitive advantage showed that collaborative relationships with suppliers and customers are moderately correlated with a competitive advantage. As the existing literature suggests, collaborative relationships even with customers can bring a competitive advantage and profit, which was examined in [39].
Furthermore, the environmental bottom line showed that environmental practices of Greek companies do not have a strong correlation with a competitive advantage. Thus, the above relationship contradicts research reports that ecological practices can bring competitive advantage and value [57,58,59]. This research therefore reinforces the former hypotheses regarding the positive correlation of social and economic pillars with competitive advantage, but it contradicts the hypothesis of the environmental pillar, which has a negative correlation with a competitive advantage [48,49,60]. Finally, a moderate correlation of the three pillars with a competitive advantage strengthens the hypothesis of previous reports where a positive correlation exists between the three pillars of the TBL and a competitive advantage [27,48]. In terms of the relationship between competitive advantage and business performance, there was a moderate correlation, suggesting that firms which believed they were competitive added value to their businesses, which is in line with previous reports [35,49].
An important insight that the research can offer to business managers is that the adoption of sustainable practices by firms is linked to their gaining a competitive advantage. It is noted that achieving a sustainable competitive advantage is an ambition of business strategy. A competitive advantage enables businesses to create exceptional value for customers and profits for themselves. Therefore, businesses should take initiatives towards sustainable development and the adoption of the SDGs and should allocate resources to integrate sustainable development into their business strategy. Of course, awareness-raising actions may be required.
This survey was designed carefully to achieve the best possible results. However, there were some limitations in conducting the research. Firstly, the concept of correlation used to derive results can only provide information on the degree of correlation, without including the reason why some correlation is greater than others. This is mainly due to the definition of correlation. It is therefore important to further explore the impact of the three pillars of sustainable development on business performance. Secondly, the sample size was comparatively small due to the topic, which is still considered a new concept for Greek businesses. Thirdly, for the needs of this research and to obtain these specific results, only correlation was used. Other statistical methods could be used; however, due to the small number of responses, they were not considered.
The authors acknowledge that there are research limitations that may have influenced the results of the study. There could be a problem in the survey in providing declarative answers to research questions. This research was conducted in Greece and was aimed at Greek companies. However, in further research, the results could be re-examined for application in other settings and countries. Additional research could be conducted on small and family businesses (SME) with statistical data analyses to explore the market’s preference and responses to sustainable development.

Author Contributions

Conceptualization, methodology, writing—review and editing, S.A.B., A.P.A., A.E.F., E.A.D. and D.A.G. All authors have read and agreed to the published version of the manuscript.

Funding

This research received no external funding.

Institutional Review Board Statement

Not applicable.

Informed Consent Statement

Not applicable.

Data Availability Statement

Not applicable.

Conflicts of Interest

The authors declare no conflict of interest.

References

  1. Ranjbari, M.; Shams Esfandabadi, Z.; Zanetti, M.C.; Scagnelli, S.D.; Siebers, P.-O.; Aghbashlo, M.; Peng, W.; Quatraro, F.; Tabatabaei, M. Three Pillars of Sustainability in the Wake of COVID-19: A Systematic Review and Future Research Agenda for Sustainable Development. J. Clean. Prod. 2021, 297, 126660. [Google Scholar] [CrossRef] [PubMed]
  2. United Nations. Transforming Our World: The 2030 Agenda for Sustainable Development; United Nations: San Francisco, CA, USA, 2015; Available online: https://sustainabledevelopment.un.org/content/documents/21252030%20Agenda%20for%20Sustainable%20Development%20web.pdf (accessed on 27 May 2022).
  3. Dhahri, S.; Omri, A. Entrepreneurship Contribution to the Three Pillars of Sustainable Development: What Does the Evidence Really Say? World Dev. 2018, 106, 64–77. [Google Scholar] [CrossRef] [Green Version]
  4. Zhai, T.; Chang, Y.-C. Standing of Environmental Public-Interest Litigants in China: Evolution, Obstacles and Solutions. J. Environ. Law 2018, 30, 369–397. [Google Scholar] [CrossRef]
  5. Elkington, J. Towards the Sustainable Corporation: Win-Win-Win Business Strategies for Sustainable Development. Calif. Manag. Rev. 1994, 36, 90–100. [Google Scholar] [CrossRef]
  6. Nelson, M. Investor Sentiment on ESG and Nonfinancial Reporting. Available online: https://www.ey.com/en_gl/assurance/how-will-esg-performance-shape-your-future (accessed on 27 May 2022).
  7. Scheyvens, R.; Banks, G.; Hughes, E. The Private Sector and the SDGs: The Need to Move Beyond ‘Business as Usual’: The Private Sector and the SDGs: Moving Beyond ‘Business-as-Usual’. Sust. Dev. 2016, 24, 371–382. [Google Scholar] [CrossRef]
  8. Tulder, V. Rob Business & The Sustainable Development Goals: A Framework for Effective Corporate Involvement; Erasmus University Rotterdam: Rotterdam, The Netherlands, 2018. [Google Scholar]
  9. European Commission; Eurostat. Sustainable Development in the European Union: Monitoring Report on Progress towards the SDGs in an EU Context: 2022 Edition; Publications Office of the European Union: Luxembourg, 2022; Available online: https://data.europa.eu/doi/10.2785/313289 (accessed on 27 May 2022).
  10. European Commission; Eurostat. Sustainable Development in the European Union: Monitoring Report on Progress towards the SDGs in an EU Context: 2021 Edition; Publications Office of the European Union: Luxembourg, 2021; Available online: https://data.europa.eu/doi/10.2785/195273 (accessed on 27 May 2022).
  11. Graedel, T.E.; Allenby, B.R. Industrial Ecology and Sustainable Engineering; Prentice Hall: Upper Saddle River, NJ, USA, 2010; ISBN 978-0-13-600806-4. [Google Scholar]
  12. Du Pisani, J.A. Sustainable Development—Historical Roots of the Concept. Null 2006, 3, 83–96. [Google Scholar] [CrossRef]
  13. Mebratu, D. Sustainability and Sustainable Development: Historical and Conceptual Review. Environ. Impact Assess. Rev. 1998, 18, 493–520. [Google Scholar] [CrossRef]
  14. Waas, T.; Hugé, J.; Verbruggen, A.; Wright, T. Sustainable Development: A Bird’s Eye View. Sustainability 2011, 3, 1637–1661. [Google Scholar] [CrossRef] [Green Version]
  15. Clark, W.; Harley, A. Sustainability Science: Towards a Synthesis. In Sustainability Science Program Working Paper 2019-01; John F. Kennedy School of Government, Harvard University: Cambridge, MA, USA, 2019. [Google Scholar]
  16. Van Tulder, R.; Rodrigues, S.B.; Mirza, H.; Sexsmith, K. The UN’s Sustainable Development Goals: Can Multinational Enterprises Lead the Decade of Action? J. Int. Bus. Policy 2021, 4, 1–21. [Google Scholar] [CrossRef]
  17. UN THE 17 GOALS|Sustainable Development. Available online: https://sdgs.un.org/goals (accessed on 23 June 2022).
  18. Kanie, N.; Griggs, D.; Young, O.; Waddell, S.; Shrivastava, P.; Haas, P.M.; Broadgate, W.; Gaffney, O.; Kőrösi, C. Rules to Goals: Emergence of New Governance Strategies for Sustainable Development: Governance for Global Sustainability Is Undergoing a Major Transformation from Rule-Based to Goal-Based. But with No Compliance Measures, Success Will Require an Unprecedented Level of Coherency of Action Founded on New and Reformed Institutions Nationally and Internationally. Sustain. Sci. 2019, 14, 1745–1749. [Google Scholar] [CrossRef] [Green Version]
  19. European Commission. Eurostat EU SDG Indicator Set 2021 Result of the Review in Preparation of the 2021 Edition of the EU SDG Monitoring Report; European Commission: Brussels, Belgium, 2021; Available online: https://ec.europa.eu/eurostat/documents/276524/12239692/SDG_indicator_set_2021.pdf (accessed on 27 May 2022).
  20. Bali Swain, R.; Yang-Wallentin, F. Achieving Sustainable Development Goals: Predicaments and Strategies. Null 2020, 27, 96–106. [Google Scholar] [CrossRef] [Green Version]
  21. Hellenic Republic. Voluntary National Review 2018 on the Implementation of the 2030 Agenda for Sustainable Development; General Secretariat of the Government Office of Coordination, Institutional, International & European Affairs: Thessaloniki, Greece, 2018; p. 160. Available online: https://sustainabledevelopment.un.org/content/documents/19378Greece_VNR_Greece_2018_pdf_FINAL_140618.pdf (accessed on 27 May 2022).
  22. Hellenic Republic. Voluntary National Review 2022—On the Implementation of the 2030 Agenda for Sustainable Development; General Secretariat of the Government Office of Coordination, Institutional, International & European Affairs: Thessaloniki, Greece, 2022; p. 364. Available online: https://www.statistics.gr/documents/20181/13491320/VNR+2022+Greece+Report.pdf/d0b97502-84b4-866f-e32e-2d91dff2538a (accessed on 27 May 2022).
  23. Hellenic Ministry of Environment, Energy and Climate Change, Press Releases. Available online: https://ypen.gov.gr/kostas-skrekas-me-200-ekat-evro-anavathmizoume-tin-energeiaki-apodosi-mikromesaion-epicheiriseon-tis-rachokokalias-tis-ethnikis-mas-oikonomias/ (accessed on 27 May 2022). (In Greek)
  24. Alhaddi, H. Triple Bottom Line and Sustainability: A Literature Review. BMS 2015, 1, 6. [Google Scholar] [CrossRef]
  25. Smith, P.A.C.; Sharicz, C. The Shift Needed for Sustainability. Learn. Organ. 2011, 18, 73–86. [Google Scholar] [CrossRef]
  26. Mensah, J. Sustainable Development: Meaning, History, Principles, Pillars, and Implications for Human Action: Literature Review. Cogent Soc. Sci. 2019, 5, 1653531. [Google Scholar] [CrossRef]
  27. Høgevold, N.M.; Svensson, G.; Klopper, H.B.; Wagner, B.; Valera, J.C.S.; Padin, C.; Ferro, C.; Petzer, D. A Triple Bottom Line Construct and Reasons for Implementing Sustainable Business Practices in Companies and Their Business Networks. Corp. Gov. 2015, 15, 427–443. [Google Scholar] [CrossRef]
  28. Mao, J.; Li, C.; Pei, Y.; Xu, L. Circular Economy and Sustainable Development Enterprises, 1st ed.; Springer: Singapore, 2018; ISBN 978-981-10-8524-6. [Google Scholar]
  29. Bordoli, L.; Scire’, G.; Rossi, F. Designing Dynamic Sustainable Business Models to Assess the Feasibility of an Industrial Symbiosis: The Case of the Retro-Port Area of Trieste. Businesses 2023, 3, 368–381. [Google Scholar] [CrossRef]
  30. Boiral, O. Sustainability Reports as Simulacra? A Counter-Account of A and A+ GRI Reports. Account. Audit. Account. J. 2013, 26, 1036–1071. [Google Scholar] [CrossRef]
  31. Belkhir, L.; Bernard, S.; Abdelgadir, S. Does GRI Reporting Impact Environmental Sustainability? A Cross-Industry Analysis of CO2 Emissions Performance between GRI-Reporting and Non-Reporting Companies. MEQ 2017, 28, 138–155. [Google Scholar] [CrossRef]
  32. Boccia, F.; Sarnacchiaro, P. The Impact of Corporate Social Responsibility on Consumer Preference: A Structural Equation Analysis. Corp. Soc. Responsib. Environ. Manag. 2018, 25, 151–163. [Google Scholar] [CrossRef]
  33. Gimenez, C.; Sierra, V.; Rodon, J. Sustainable Operations: Their Impact on the Triple Bottom Line. Int. J. Prod. Econ. 2012, 140, 149–159. [Google Scholar] [CrossRef]
  34. Fowler, S.J.; Hope, C. Incorporating Sustainable Business Practices into Company Strategy. Bus. Strat. Env. 2007, 16, 26–38. [Google Scholar] [CrossRef]
  35. Wheelen, T.L.; Hunger, J.D.; Hoffman, A.N.; Bamford, C.E. Strategic Management and Business Policy: Globalization, Innovation, and Sustainability, 15th ed.; Pearson Education Limited.: London, UK, 2018; ISBN 978-1-292-21548-8. [Google Scholar]
  36. Tien, N.H.; Anh, D.B.H.; Ngoc, N.M. Corporate Financial Performance Due to Sustainable Development in Vietnam. Corp Soc. Responsib. Env. 2020, 27, 694–705. [Google Scholar] [CrossRef]
  37. Aragón-Correa, J.A.; Hurtado-Torres, N.; Sharma, S.; García-Morales, V.J. Environmental Strategy and Performance in Small Firms: A Resource-Based Perspective. J. Environ. Manag. 2008, 86, 88–103. [Google Scholar] [CrossRef] [PubMed]
  38. Larrán Jorge, M.; Herrera Madueño, J.; Martínez-Martínez, D.; Lechuga Sancho, M.P. Competitiveness and Environmental Performance in Spanish Small and Medium Enterprises: Is There a Direct Link? J. Clean. Prod. 2015, 101, 26–37. [Google Scholar] [CrossRef]
  39. Saeidi, S.P.; Sofian, S.; Saeidi, P.; Saeidi, S.P.; Saaeidi, S.A. How Does Corporate Social Responsibility Contribute to Firm Financial Performance? The Mediating Role of Competitive Advantage, Reputation, and Customer Satisfaction. J. Bus. Res. 2015, 68, 341–350. [Google Scholar] [CrossRef]
  40. Porter, M.E.; Kramer, M.R. The Link between Competitive Advantage and Corporate Social Responsibility. Harv. Bus. Rev. 2006, 84, 78–92. [Google Scholar]
  41. ElAlfy, A.; Palaschuk, N.; El-Bassiouny, D.; Wilson, J.; Weber, O. Scoping the Evolution of Corporate Social Responsibility (CSR) Research in the Sustainable Development Goals (SDGs) Era. Sustainability 2020, 12, 5544. [Google Scholar] [CrossRef]
  42. Fallah Shayan, N.; Mohabbati-Kalejahi, N.; Alavi, S.; Zahed, M.A. Sustainable Development Goals (SDGs) as a Framework for Corporate Social Responsibility (CSR). Sustainability 2022, 14, 1222. [Google Scholar] [CrossRef]
  43. Garrido-Ruso, M.; Aibar-Guzmán, B.; Monteiro, A.P. Businesses’ Role in the Fulfillment of the 2030 Agenda: A Bibliometric Analysis. Sustainability 2022, 14, 8754. [Google Scholar] [CrossRef]
  44. Khaled, R.; Ali, H.; Mohamed, E.K.A. The Sustainable Development Goals and Corporate Sustainability Performance: Mapping, Extent and Determinants. J. Clean. Prod. 2021, 311, 127599. [Google Scholar] [CrossRef]
  45. Sekaran, U.; Bougie, R. Research Methods for Business: A Skill-Building Approach, 7th ed.; Wiley: Chichester, UK, 2016; ISBN 978-1-119-16555-2. [Google Scholar]
  46. Demertzi, E. Top 40 Sectors of the Greek Economy 2020, 11th ed.; ICAP: New York, NY, USA, 2020; Available online: https://dir.icap.gr/mailimages/flipbooks/LS/2020/ (accessed on 27 May 2022).
  47. Demertzi, E. Top 40 Sectors of the Greek Economy 2018; ICAP: New York, NY, USA, 2018; Available online: https://dir.icap.gr/mailimages/flipbooks/LS/2020/ (accessed on 27 May 2022).
  48. Bagur-Femenias, L.; Llach, J.; del Mar Alonso-Almeida, M. Is the Adoption of Environmental Practices a Strategical Decision for Small Service Companies? An Empirical Approach. Manag. Decis. 2013, 51, 41–62. [Google Scholar] [CrossRef]
  49. Cantele, S.; Zardini, A. Is Sustainability a Competitive Advantage for Small Businesses? An Empirical Analysis of Possible Mediators in the Sustainability–Financial Performance Relationship. J. Clean. Prod. 2018, 182, 166–176. [Google Scholar] [CrossRef]
  50. López-Pérez, M.E.; Melero, I.; Javier Sese, F. Management for Sustainable Development and Its Impact on Firm Value in the SME Context: Does Size Matter?: Management for Sustainable Development: Doses Size Matter? Bus. Strat. Env. 2017, 26, 985–999. [Google Scholar] [CrossRef]
  51. Tavakol, M.; Dennick, R. Making Sense of Cronbach’s Alpha. Int. J. Med. Educ. 2011, 2, 53–55. [Google Scholar] [CrossRef] [PubMed]
  52. Yong, A.G.; Pearce, S. A Beginner’s Guide to Factor Analysis: Focusing on Exploratory Factor Analysis. TQMP 2013, 9, 79–94. [Google Scholar] [CrossRef] [Green Version]
  53. Kaiser, H.F. An Index of Factorial Simplicity. Psychometrika 1974, 39, 31–36. [Google Scholar] [CrossRef]
  54. Aczel, A.D.; Sounderpandian, J. Complete Business Statistics, 7th ed.; The McGraw-Hill/Irwin series Operations and decision sciences; McGraw-Hill/Irwin: Boston, MA, USA, 2009; ISBN 978-0-07-337360-7. [Google Scholar]
  55. Roussos, P.L.; Tsaouses, G. Statistike Stis Epistemes Tes Symperiphoras Me te Chrese tou SPSS; Topos: Athena, Belgium, 2011; ISBN 978-960-6863-69-1. [Google Scholar]
  56. Haseeb, M.; Hussain, H.I.; Kot, S.; Androniceanu, A.; Jermsittiparsert, K. Role of Social and Technological Challenges in Achieving a Sustainable Competitive Advantage and Sustainable Business Performance. Sustainability 2019, 11, 3811. [Google Scholar] [CrossRef] [Green Version]
  57. Herrera Madueño, J.; Larrán Jorge, M.; Martínez Conesa, I.; Martínez-Martínez, D. Relationship between Corporate Social Responsibility and Competitive Performance in Spanish SMEs: Empirical Evidence from a Stakeholders’ Perspective. BRQ Bus. Res. Q. 2016, 19, 55–72. [Google Scholar] [CrossRef] [Green Version]
  58. Chang, C.-H. The Influence of Corporate Environmental Ethics on Competitive Advantage: The Mediation Role of Green Innovation. J. Bus. Ethics 2011, 104, 361–370. [Google Scholar] [CrossRef]
  59. Chen, Y.-S.; Lai, S.-B.; Wen, C.-T. The Influence of Green Innovation Performance on Corporate Advantage in Taiwan. J. Bus. Ethics 2006, 67, 331–339. [Google Scholar] [CrossRef]
  60. Fousteris, A.; Didaskalou, E.; Tsogas, M.-M.; Georgakellos, D. The Environmental Strategy of Businesses as an Option under Recession in Greece. Sustainability 2018, 10, 4399. [Google Scholar] [CrossRef] [Green Version]
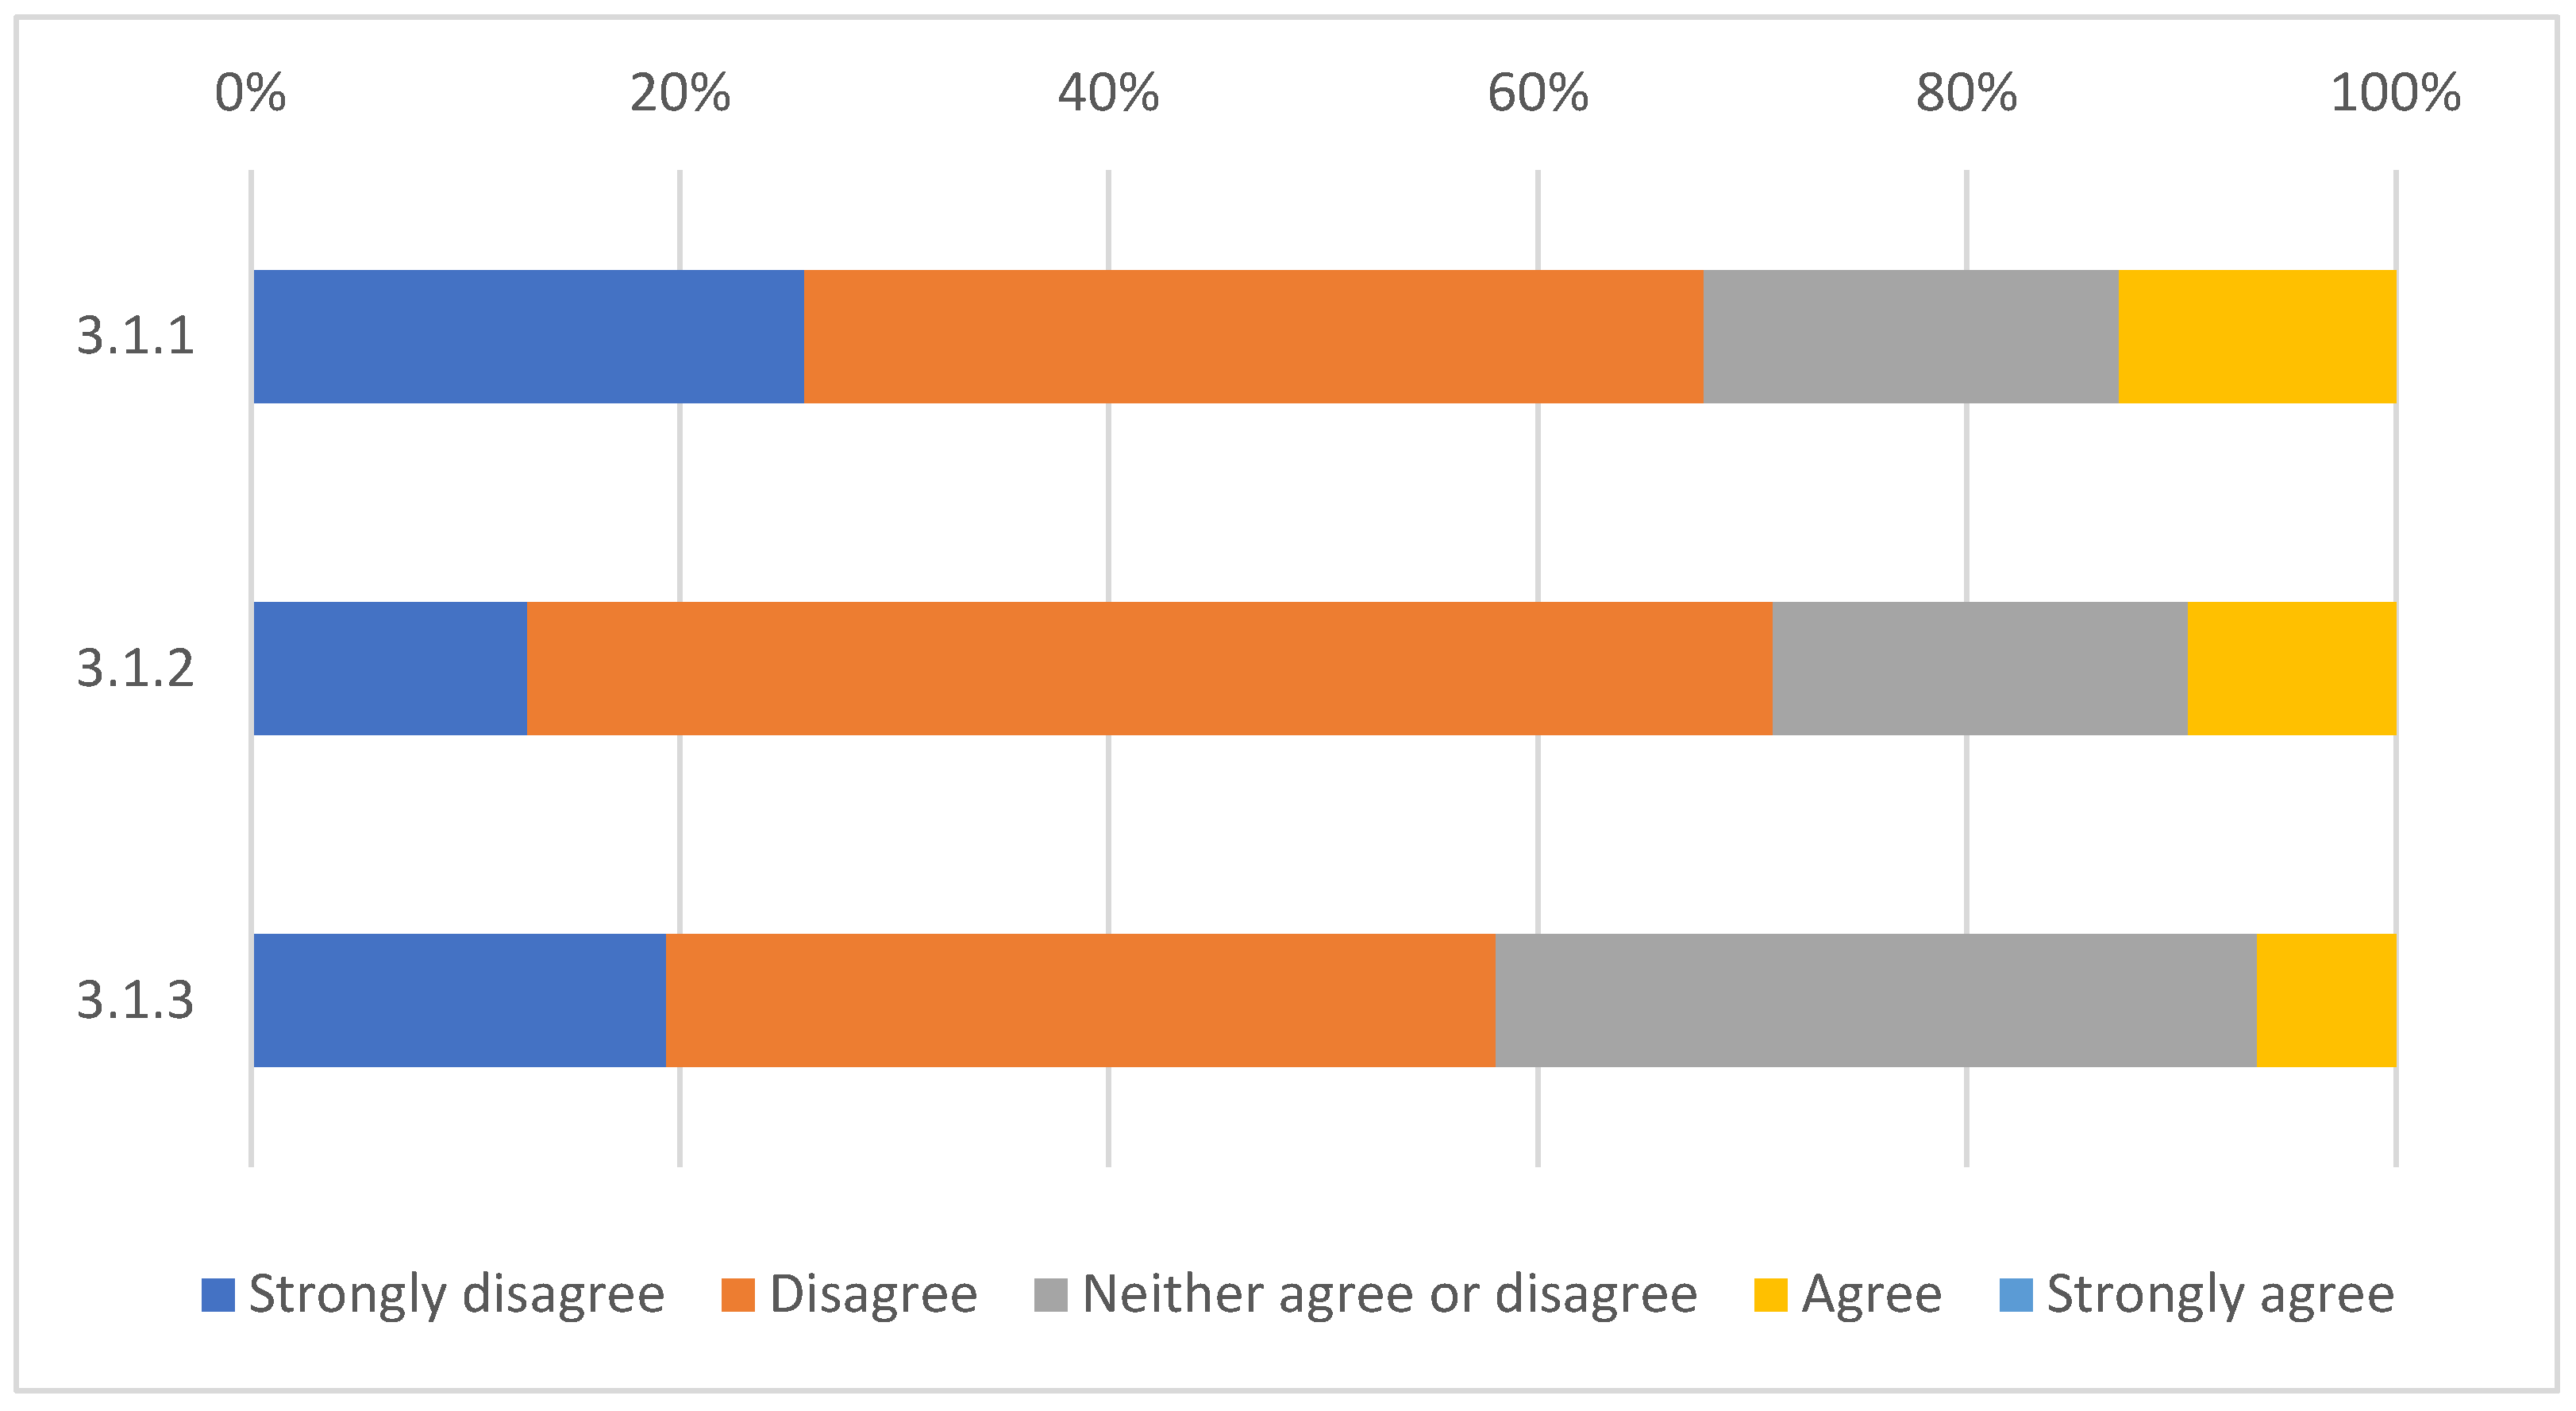
Figure 1. The 17 goals of sustainable development [17].
Businesses 03 00027 g001
Figure 2. Greece’s status and progress in SDGs [9].
Businesses 03 00027 g002
Figure 3. The hypothetical relationship between the three levels of sustainable development (TBL) [26].
Businesses 03 00027 g003
Figure 6. Sustainable development and sustainable business performance (Section 3.1).
Businesses 03 00027 g006
Figure 7. Sustainable development and sustainable competitive advantage (Section 3.2).
Businesses 03 00027 g007
Table 3. Percentages of responses for the five dimensions of the Likert scale regarding Section 3.1 of the questionnaire.
Section 3.1Strongly DisagreeDisagreeNeither Agree nor DisagreeAgreeStrongly Agree
3.1.1 The net profit margin of our organization increased.25.81%41.94%19.35%12.90%0.00%
3.1.2 Profitability growth has been outstanding.12.90%58.06%19.35%9.68%0.00%
3.1.3 Profitability has exceeded our competitors. 19.35%38.71%35.48%6.45%0.00%
Table 4. Percentages of responses for the five dimensions of the Likert scale regarding Section 3.2 of the questionnaire.
Section 3.2Strongly DisagreeDisagreeNeither Agree nor DisagreeAgreeStrongly Agree
3.2.1 The company’s image has improved3.23%16.13%41.94%35.48%3.23%
3.2.2 The customer satisfaction level is higher than that of competitors3.23%12.90%45.16%35.48%3.23%
3.2.3 The employee satisfaction level is higher than that of competitors6.45%16.13%41.94%25.81%9.68%
3.2.4 Ability to maintain a market presence in times of crisis is higher0.00%19.35%32.26%41.94%6.45%
3.2.5 Sales have increased more than those of competitors3.23%32.26%48.39%16.13%0.00%
Table 5. Correlation of questions and scale.
VariableQuestionsReference
Social Pillar (SP)[49]
S.P 1Do you provide procedures that help ensure the health and safety of our employees?
S.P 2Do you support your employees who wish to pursue further education?
S.P 3Do you provide your employees with salaries that properly and fairly reward them for their work?
S.P 4Do you treat all employees fairly and respectfully, regardless of gender or ethnic background?
Environmental Pillar (ENP)[49]
ENP 1Have you adopted processes to reduce energy consumption?
ENP 2Have you adopted processes to reduce and recycle waste?
ENP 3Have you adopted processes to reduce water consumption?
ENP 4Have you implemented systems to reduce harmful emissions?
ENP 5Have you adopted systems to reduce packaging’s environmental effects?
Economic Pillar (EP)[49]
EP 1Do you involve all suppliers in new products or services development?
EP 2Do you inform all suppliers of products and services about organizational changes affecting purchasing decisions?
EP 3Do you provide all customers with the information needed to make sound purchasing decisions?
Βusiness management
Sustainable Business Performance (S.B.P)[56]
S.B.P 1The net profit margin of our organization increased.
S.B.P 2Profitability growth has been outstanding.
S.B.P 3Profitability has exceeded our competitors.
Sustainable Competitive Advantage (SCA)[48]
S.C.A 1The company’s image has improved
S.C.A 2Customer satisfaction level is higher than that of competitors
S.C.A 3Employee satisfaction level is higher than that of competitors
S.C.A 4Ability to maintain a market presence in times of crisis is higher
S.C.A 5Sales have increased more than those of competitors
Disclaimer/Publisher’s Note: The statements, opinions and data contained in all publications are solely those of the individual author(s) and contributor(s) and not of MDPI and/or the editor(s). MDPI and/or the editor(s) disclaim responsibility for any injury to people or property resulting from any ideas, methods, instructions or products referred to in the content.

