1. Introduction
Concrete comprises two main components: a paste and aggregates. The paste consists of ordinary Portland cement (OPC), supplementary cementing materials (SCMs), water, chemical admixtures, and entrained or entrapped air. Concrete mixtures should have enough paste to not only fill the voids between the aggregates but to also coat these aggregates. In addition, the paste content will dictate the amount of friction between the aggregates, which in turn contributes to the workability of the concrete mixture. The role of cementitious paste is to act as an internal lubricant when the concrete is in its fresh state. In a concrete’s hardened state, the paste’s role is to act as a binder that binds the aggregates together.
Early research by Kennedy (1940) on paste volume and concrete performance reported that the paste volume must be at least equal to the volume of the voids in the combined compacted aggregates [
1]. The author also reported that additional paste is required to force the aggregate particles apart and impart plasticity to the mixture. The research results, based on 542 concrete mixtures, confirmed that there is a positive correlation between workability and the amount of paste. As aggregate characteristics vary significantly, the amount of paste would be expected to be dependent on the characteristics of the aggregates, including the voids in the aggregates, used in the mixture.
Prescriptive specifications for mixture proportioning set limits on the type, amount, and proportions of mixture ingredients based on the application for which the concrete is required. These specifications can lead to overdesigned concrete mixtures, where the cementitious materials content (CMC) exceeds what is actually required to achieve the fresh and hardened requirements. As there is growing attention on the sustainability of construction materials, such as the embodied energy and the carbon footprint associated with concrete production, there is a need to minimize the constituent materials that significantly contribute to this carbon footprint. For concrete, OPC is the largest contributor to the carbon footprint, and thus OPC must be used in a judicious manner. In addition to the environmental benefits of minimizing the OPC and paste content of concrete mixtures, minimizing the OPC and paste content can also reduce the cost associated with concrete mixtures, as cement is generally the most expensive constituent material of concrete.
It has long been argued that prescriptive-based specifications lead to overdesigned mixtures because of the safety factor imposed on the CMC (Yurdakul et al. 2013, LeBow 2018, Vasudevan and Trejo 2023) [
2,
3,
4]. Notably, there are some common misconceptions that have reinforced the use of prescriptive specifications since the early 1900s. Primarily, the notion that increasing the CMC, beyond some minimum value, increases the compressive strength and the overall performance of concrete is a common misconception. Past studies suggest that the CMC can influence the compressive strength of concrete up to a certain value (LeBow 2018) [
3]. Trejo et al. (2022) reported that both 28- and 56-day compressive strengths increased when the CMC increased from 494 lb/yd
3 (293 kg/m
3) to 578 lb/yd
3 (343 kg/m
3) [
5]. Beyond this value, no increase in compressive strength was observed with an increase in CMC content. In addition, Aitcin (2000), Darwin et al. (2004), Schneider et al. (2011), and Wassermann et al. (2009) reported that increasing the CMC of concrete can lead to increased early-age cracking [
6,
7,
8,
9]. Therefore, CMC, in more than optimal quantities, can exacerbate the shrinkage and cracking problems associated with concrete and provides limited value with respect to increasing the strength. Results from a survey on the CMC of concrete used for bridge decks by state highway agencies (SHAs) revealed that 30% of the states required 564 lb/yd
3 (335 kg/m
3), 52% of the states required 658 lb/yd
3 (390 kg/m
3), and 5% of the states required more than 846 lb/yd
3 (502 kg/m
3) (Aktan et al. 2005) [
10]. The same survey also reported that early-age cracking is the most frequent bridge-deck distress reported by these SHAs. Based on the literature, it is evident that using higher CMCs than what is required to achieve the required concrete characteristics provides limited value. Thus, it is surprising that organizations still impose restrictions on the minimum CMCs despite these known challenges.
Some SHAs recommend conducting trial mixes to determine the minimum CMC (CalTrans Standard Specifications, 2019) [
11]. However, most SHAs specify limits on the minimum CMC needed in a concrete mixture. For example, in the case of concrete pavement mixtures, the minimum specified CMC varies between 550 lb/yd
3 (326 kg/m
3) and 611 lb/yd
3 (356 kg/m
3) (Rudy and Olek 2012) [
12]. This is illustrated in
Figure 1. Past studies by Popovics (1990) and Wassermann et al. (2009) indicate that these values are conservative and far exceed the CMC needed for the required strength and performance [
9,
13]. Additionally, LeBow (2004) reported that a concrete mixture with a CMC of 517 lb/yd
3 (307 kg/m
3) can meet both the fresh and hardened characteristics required of a 611 lb/yd
3 (362 kg/m
3) cementitious content mixture [
3]. A more recent study by Trejo et al. (2022) reported that comparable hardened properties (compressive and flexural strength) can be achieved even after reducing the CMC by approximately 15% if the aggregate is characterized prior to proportioning [
5]. Both Lebow (2004) and Trejo et al. (2022) reported that, apart from satisfying the specified requirements, the mixtures with lower CMCs also exhibited lower drying shrinkage [
3,
5]. It is clear that a methodology is needed to minimize CMCs while also achieving the required concrete characteristics.
Research shows that it is possible to attain required fresh and hardened characteristics with a reduced CMC if the aggregates are characterized (i.e., the aggregate void content, AV) prior to proportioning (Trejo et al. 2022, Vasudevan and Trejo 2023) [
5,
14]. Key variables that influence the fresh and hardened characteristics include the amount of voids within the combined aggregates (i.e., AV), the amount of paste required to achieve the specified workability (i.e., paste volume, PV), and the water-to-cementitious materials ratio (w/cm). With the need to make concrete more sustainable, it is time to develop a mixture proportioning methodology that uses key aggregate and SCM characteristics to minimize CMC.
1.1. Effect of CMC on Concrete Characteristics
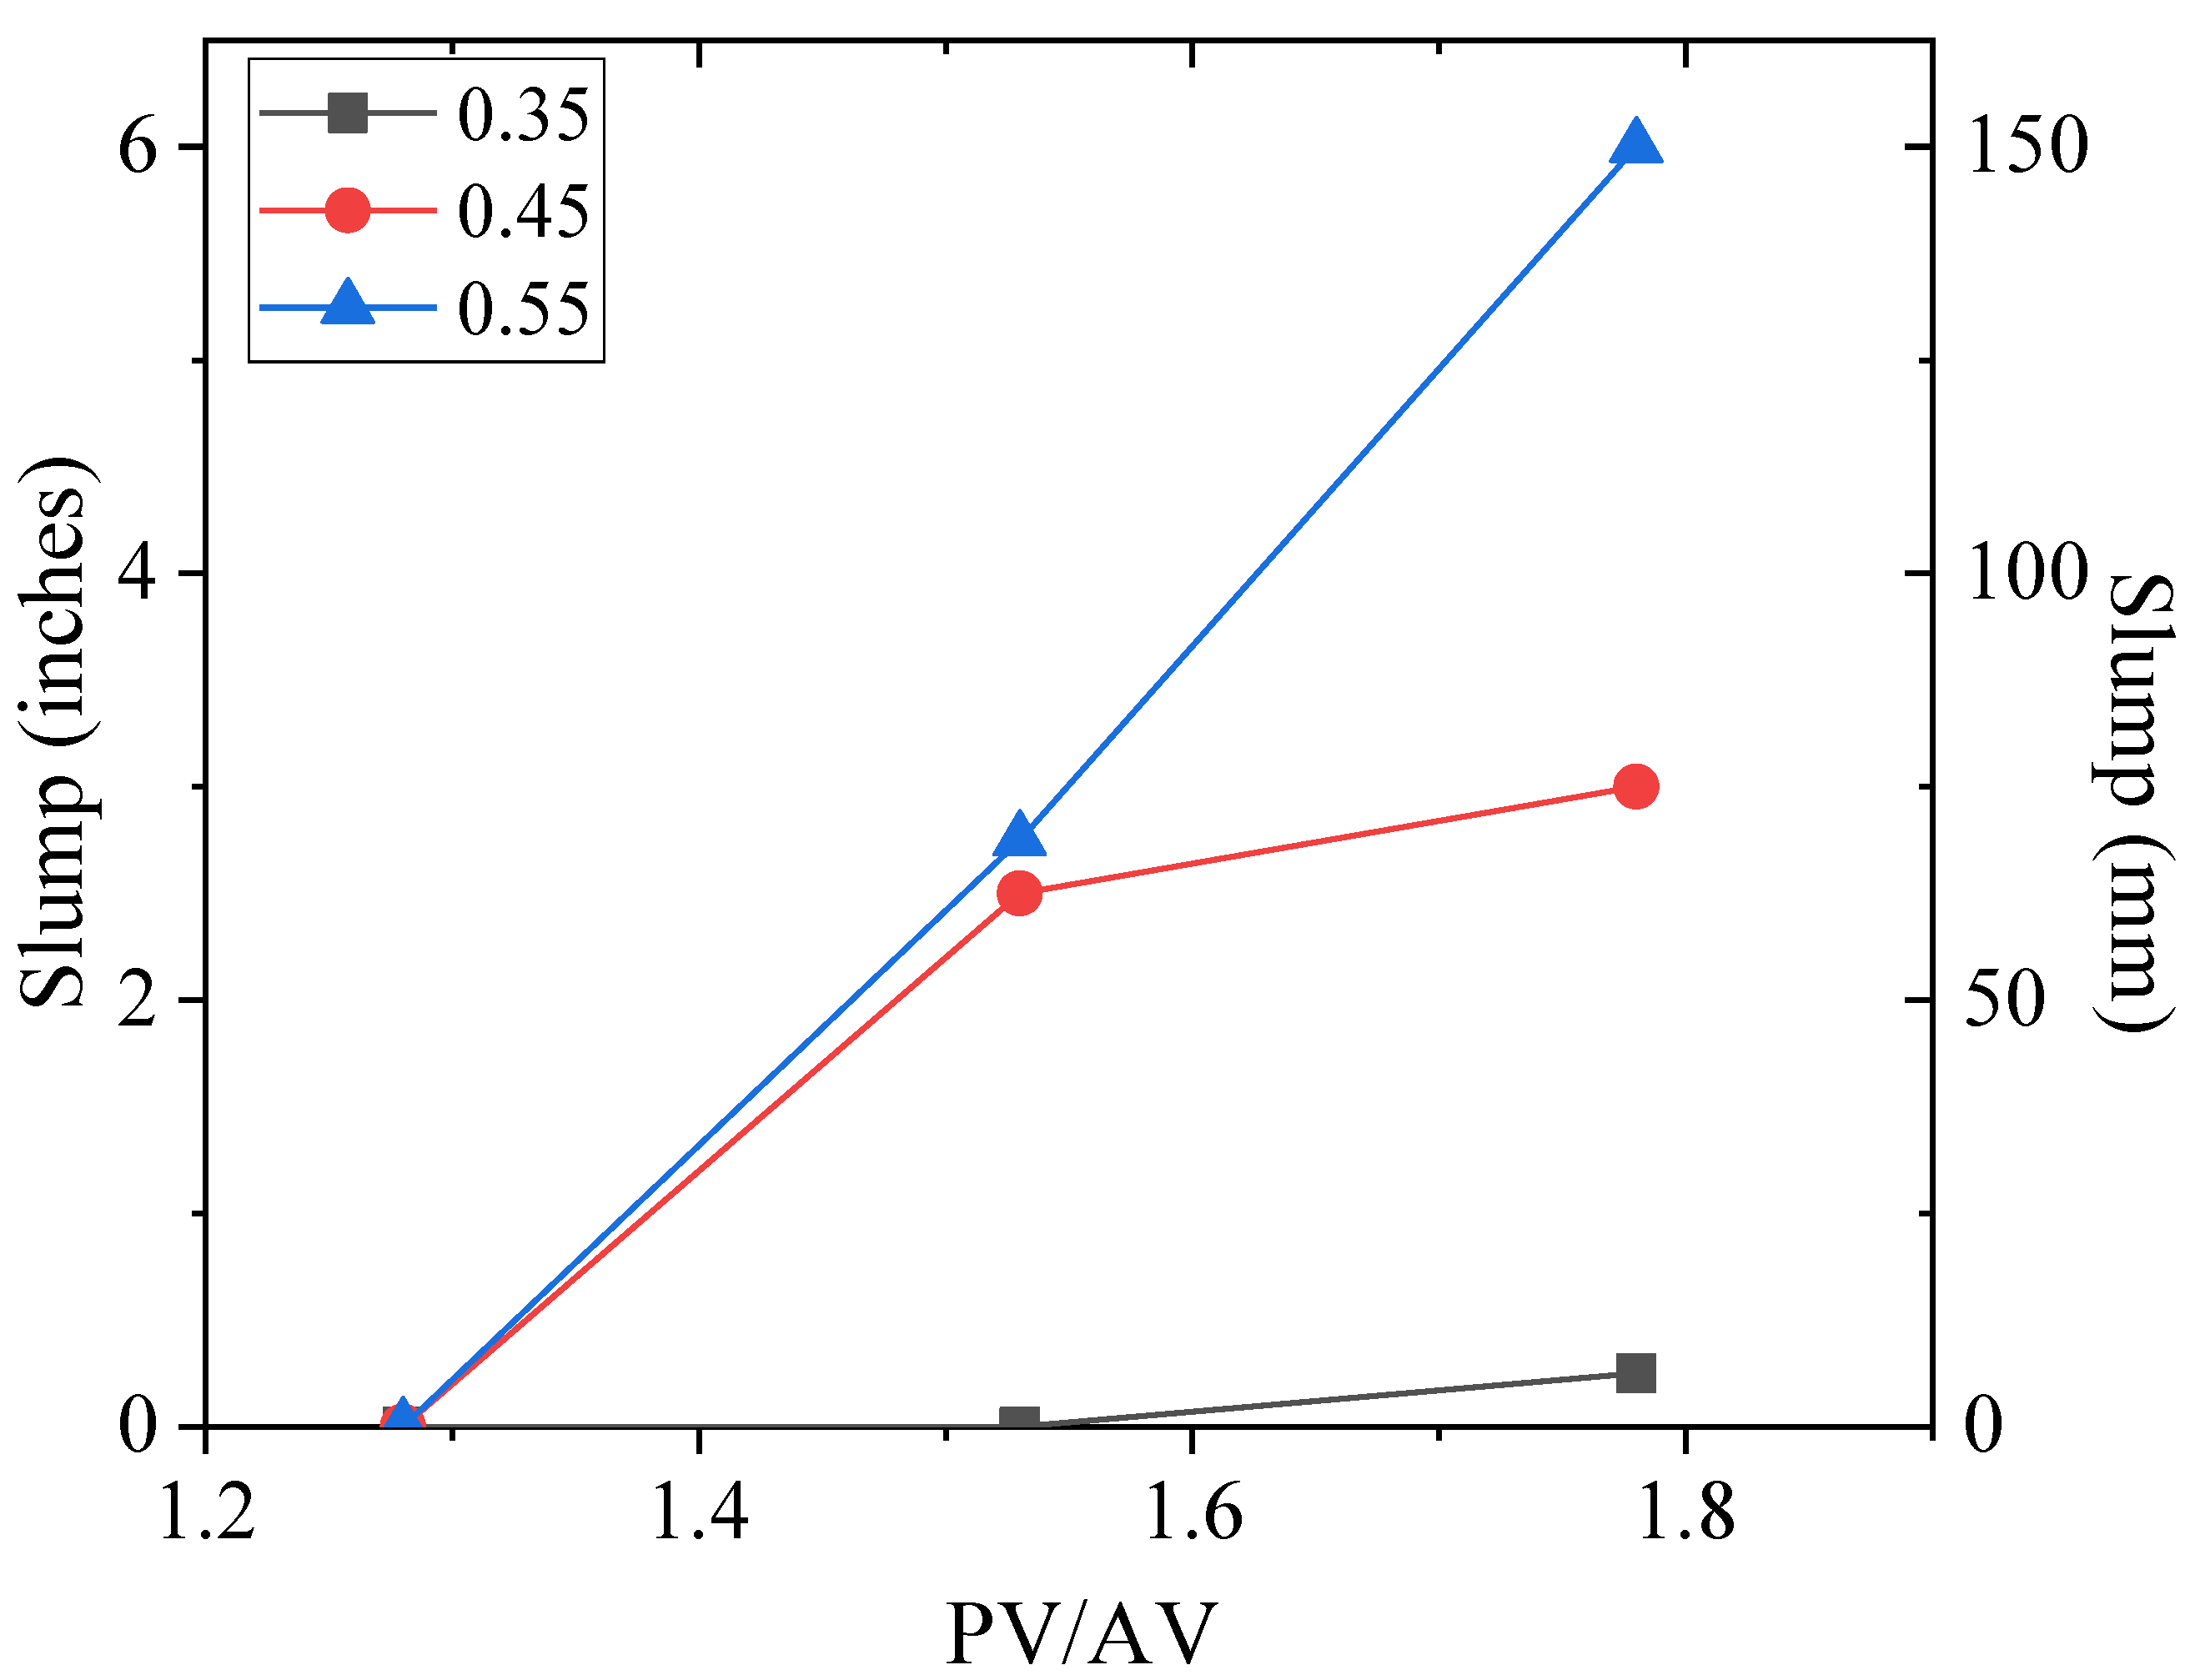
The effect of CMC and hence the paste volume on the workability and consistency of concrete is well-documented. As noted earlier, the paste fills the voids between the aggregates and coats the aggregates. Increasing the paste volume will lead to a reduction in friction between the aggregates, and this contributes to increased concrete workability and consistency. Yurdakul et al. (2014) reported that an increase in the paste volume-to-aggregate void ratio (PV/AV) led to an increase in the slump of concrete mixtures [
2]. Slump values for concrete mixtures proportioned with various PV/AV and w/cm values are shown in
Figure 2. Note that the data presented in this figure are from preliminary trial mixtures. It can be seen that the slump increases with an increase in PV/AV at all w/cm values. These findings were also corroborated by Trejo et al. (2022) [
5]. Trejo et al. (2022) reported a positive correlation between the CMC and the edge slump of concrete [
5]. More discussions on the edge slump and its relevance for slipform concrete pavements are presented in Cook et al. (2013) [
15]. Paste content can also influence strength and durability.
Some minimum CMC is required to optimize strength. Clearly, if the voids in the aggregate are not filled with paste, the void content increases and the strength decreases. A study by Taylor et al. (2015) showed that compressive strength increased with increasing PV/AV up to a certain point [
16]. The authors reported that beyond a certain PV/AV, the 1-, 3-, 28-, and 90-day compressive strengths did not exhibit any significant increases. This trend was also observed for specimens incorporating Class F and C fly ashes. Trejo et al. (2022) reported similar results, where the CMC only increased the compressive strength up to a certain quantity [
5]. The researchers also reported no significant changes in flexural strength for concretes containing CMCs ranging between 495 lb/yd
3 (294 kg/m
3) and 676 lb/yd
3 (401 kg/m
3).
Taylor et al. (2015) reported that CMCs above an optimal value do not significantly influence concrete durability [
16]. Obla et al. (2006) also reported that CMC likely does not play a major role in affecting the service life of concrete in corrosive conditions [
17]. It has also been reported that CMC does not have a significant impact on chloride-induced corrosion of reinforcing bars (Arachchige 2008) [
18]. Research to date indicates that there is no direct correlation between CMC and durability, as long as some minimum paste content is provided so that the concrete can be properly placed and consolidated. However, as reported earlier, high CMCs can lead to increased cracking, and these can influence durability. This indicates that CMCs, above some minimum requirements, do not improve concrete characteristics and, in some cases, can even be detrimental to concrete performance. These results from the literature indicate that the paste must fill the voids, coat the aggregates, and be in a sufficient quantity such that the concrete can be placed and consolidated: paste volumes above this level provide no value and make concrete less economical and less environmentally friendly. As such, a method is needed to identify a minimum CMC for the specific aggregates being used to achieve the required workability and strength, but also the durability of the concrete.
1.2. The Need to Characterize Aggregates
In general, the aggregates used in a concrete mixture are sourced locally. Aggregates are seldom transported over long distances, as this makes concrete less economical. It has been reported that the workability, resistance to bleeding, and segregation of concrete are very dependent on the aggregate size, gradation, shape, texture, specific gravity, and absorption (Smith et al. 2001) [
19]. ACI 211 and Portland Cement Association (PCA), the two most commonly used prescriptive proportioning methods, account for some of these general aggregate characteristics [
20,
21]. For example, the fineness modulus (FM) of the fine aggregates is used to determine the relative volume of the coarse aggregates in a mixture. An increase in FM requires a lower fraction of coarse aggregates, thereby increasing the paste volume. Additional clauses also stipulate that the coarse aggregate volume can be changed by up to 20% depending on the user’s preference on the workability of a mixture. However, no guidance is provided on how to carry this out and still achieve the required fresh and hardened characteristics. An increase in nominal maximum aggregate size (NMAS) can reduce the required water content in concrete. In addition, the water content can be adjusted based on the coarse aggregate shape. For example, ACI 211 assumes that the typical aggregate is “reasonably well-shaped angular aggregates graded within limits of accepted specifications” and allows the water content to be reduced by 25 lb/yd
3 (11.4 kg/m
3) when rounded coarse aggregates are used [
20]. Note that reducing the water content reduces the paste content of concrete. Therefore, general aggregate characteristics are indirectly used to quantify the required paste volume in concrete. Without having more specific information on the aggregates used for the mixture, the current mixture proportioning methods are vague and insufficient to systematically minimize CMCs to maximize economy, maximize durability, and minimize environmental impact. This research argues that the aggregates that are to be used in concrete (both fine and coarse) must first be characterized (i.e., for void content) to maximize economy and performance, while also minimizing the environmental impact. Aggregate characterization requires minimal time and cost, and the benefits can be significant.
The effect of paste volume on concrete characteristics has been well studied (Yurdakul et al. 2013, LeBow 2018, Trejo et al. 2022) [
2,
3,
5]. However, there is a knowledge gap when it comes to quantifying the impact of PV/AV on the workability, strength, and durability characteristics of concrete. In this study, a new proportioning method, termed SER proportioning, is proposed. This SER method requires some knowledge of how PV/AV influences workability, and the literature provides little guidance on this. In addition, because SCMs can further reduce the amount of OPC in a mixture, this research investigated the influence of SCM—more specifically, an off-spec fly ash (OFA)—on workability, strength, and durability. Mixtures with different OFA replacement levels (
RLs) and OFA reactivities were evaluated. Based on the data generated from this study, multiple linear regression (MLR) models were developed that quantitatively capture the effects of PV/AV, w/cm, OFA
RL, OFA reactivity, and other material characteristics on fresh and hardened characteristics. These models were then used to develop the new SER mixture proportioning procedure and will be explained in a later section. Using these models allows the user to minimize the required OPC, maximize the SCM levels (in this case, OFA levels), and produce an economical, durable, and more environmentally friendly concrete.
1.3. Research Significance
One of the techniques to make concrete sustainable, economic, and resilient is to optimize the ingredients, and this primarily involves minimizing the OPC in concrete. However, this contradicts the current notion, prevalent among some organizations, that increased paste volumes lead to better concrete. This study proposes a new mixture proportioning approach, termed the SER proportioning method, based on quantifying the voids in an aggregate system and then identifying the minimum paste volume required to achieve some required characteristics. To further enhance the sustainability, this study also investigates the inclusion of OFAs as SCMs. Using the aggregate voids and characteristics of the OFA, the new SER mixture proportioning methodology is presented to proportion concrete mixtures that achieve minimum required concrete characteristics.
5. Effect of PV/AV on Fresh, Mechanical, and Durability Characteristics
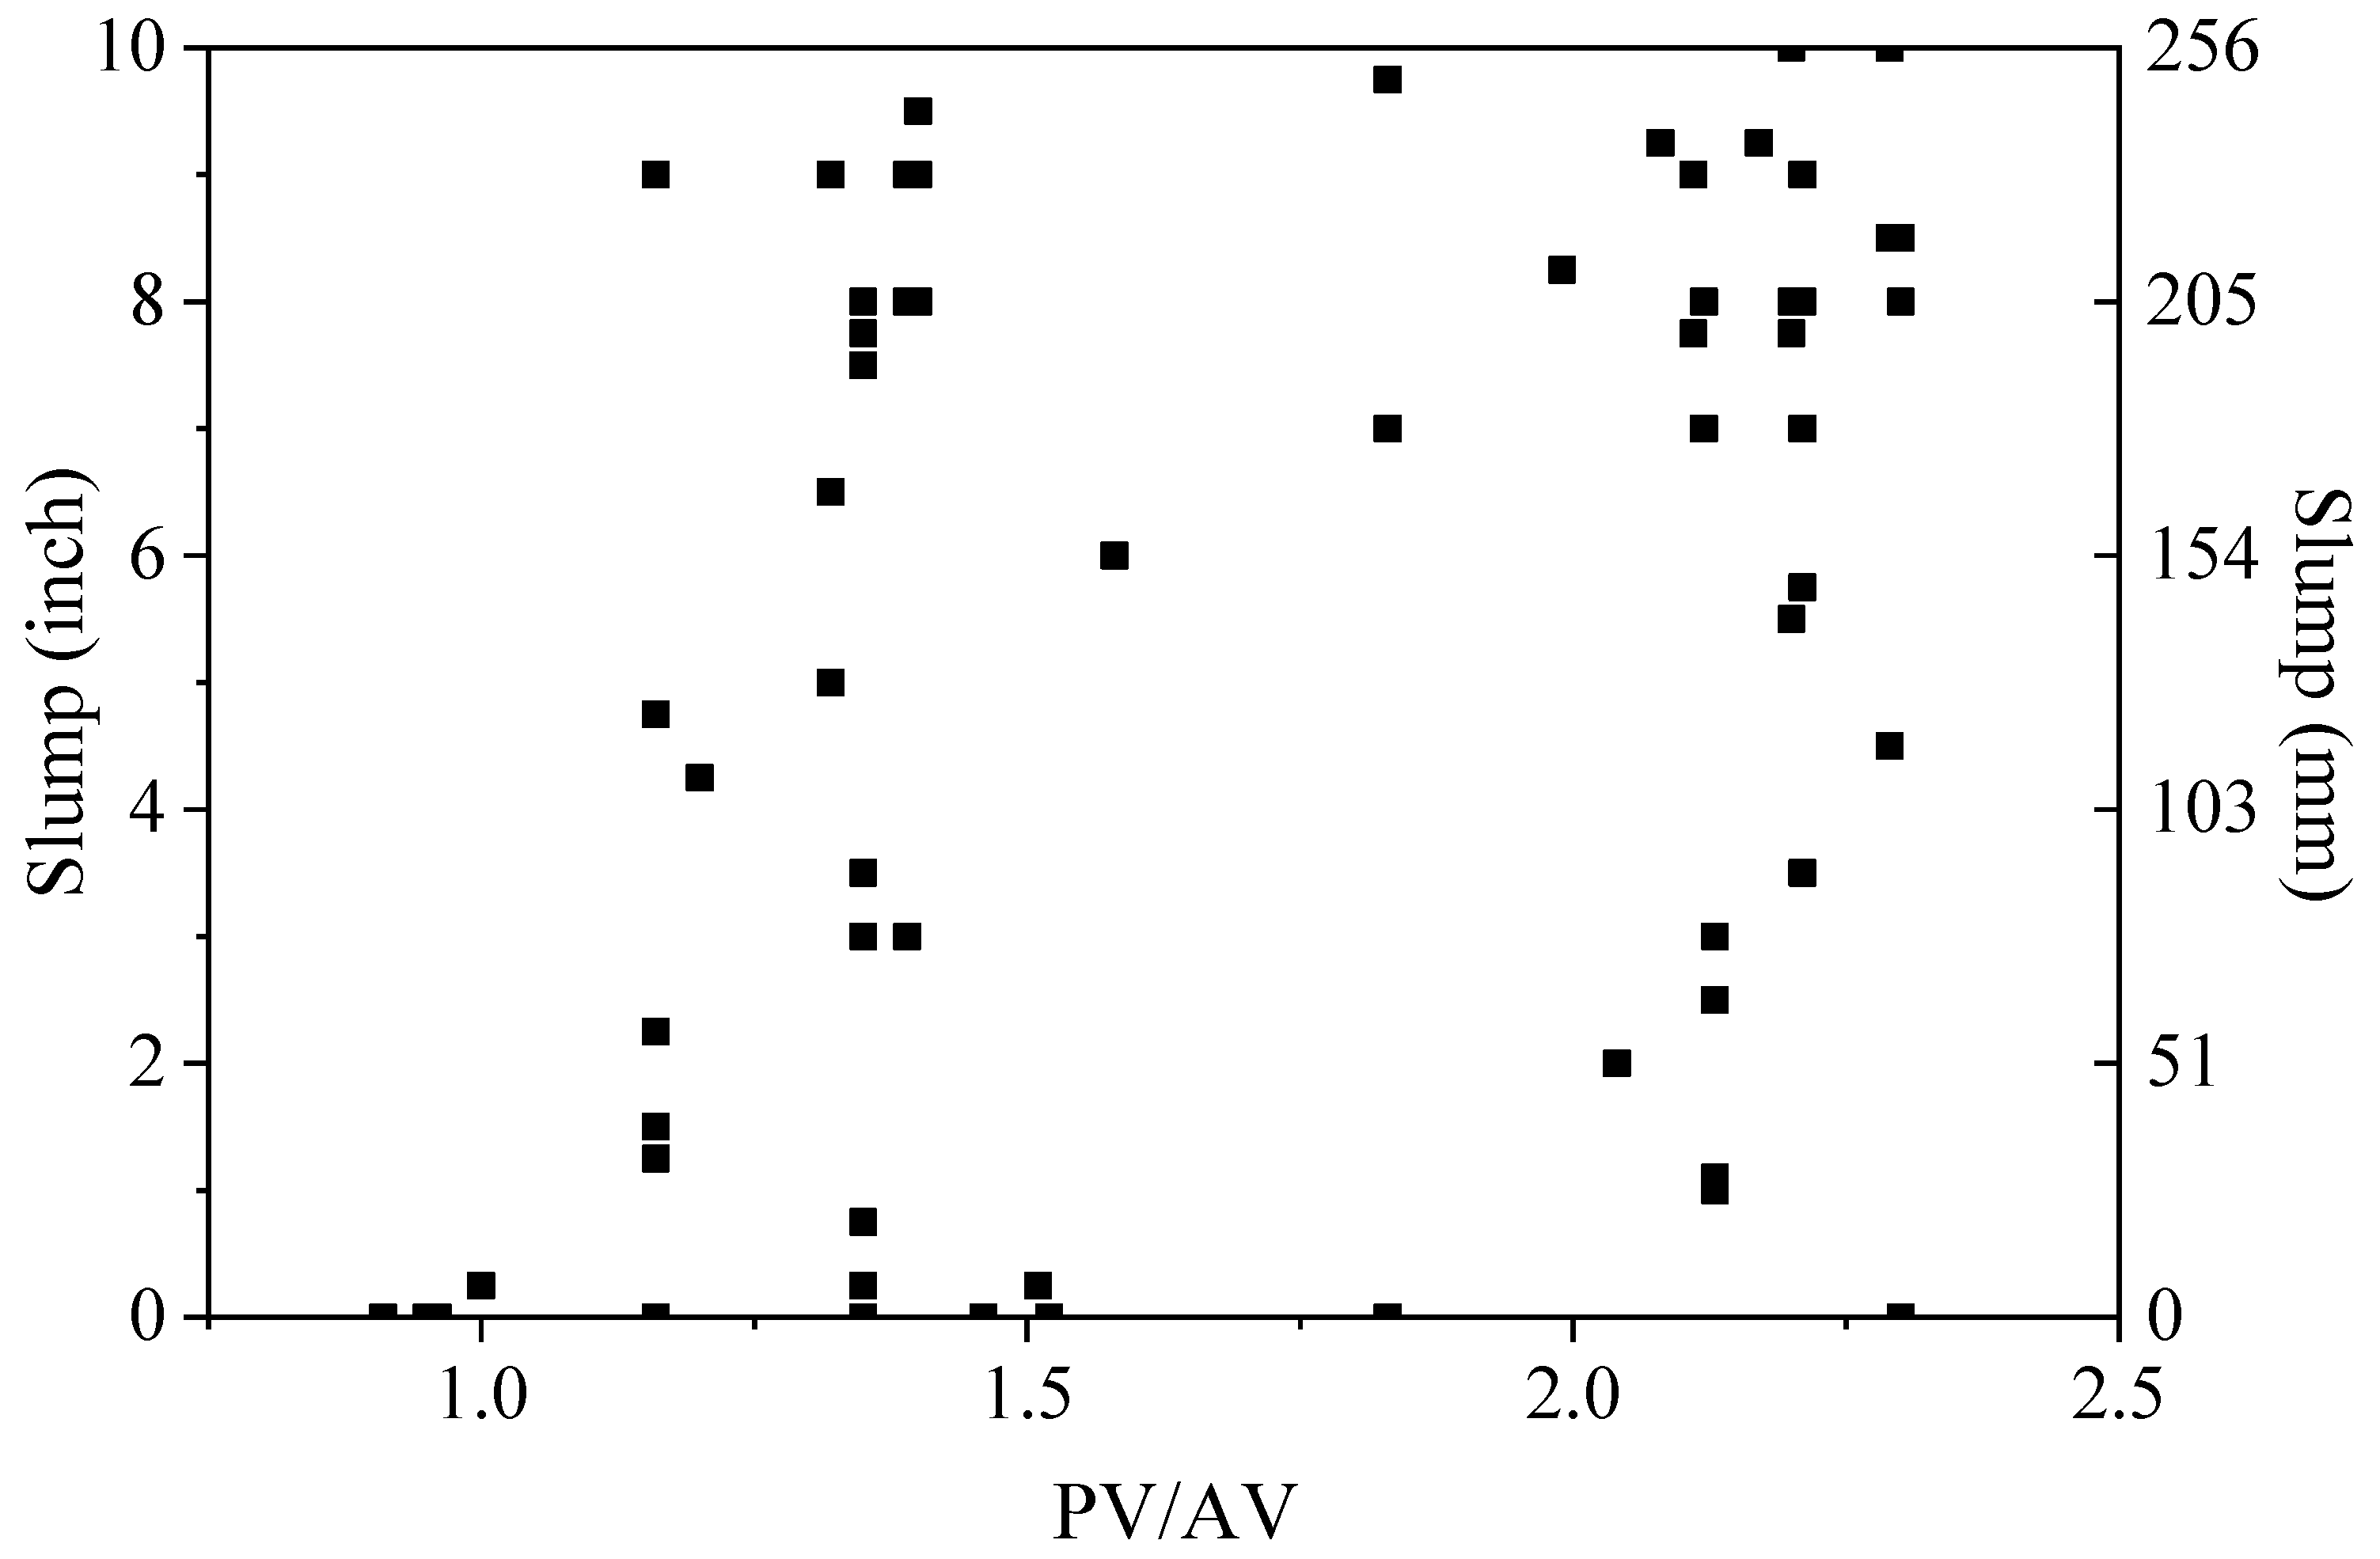
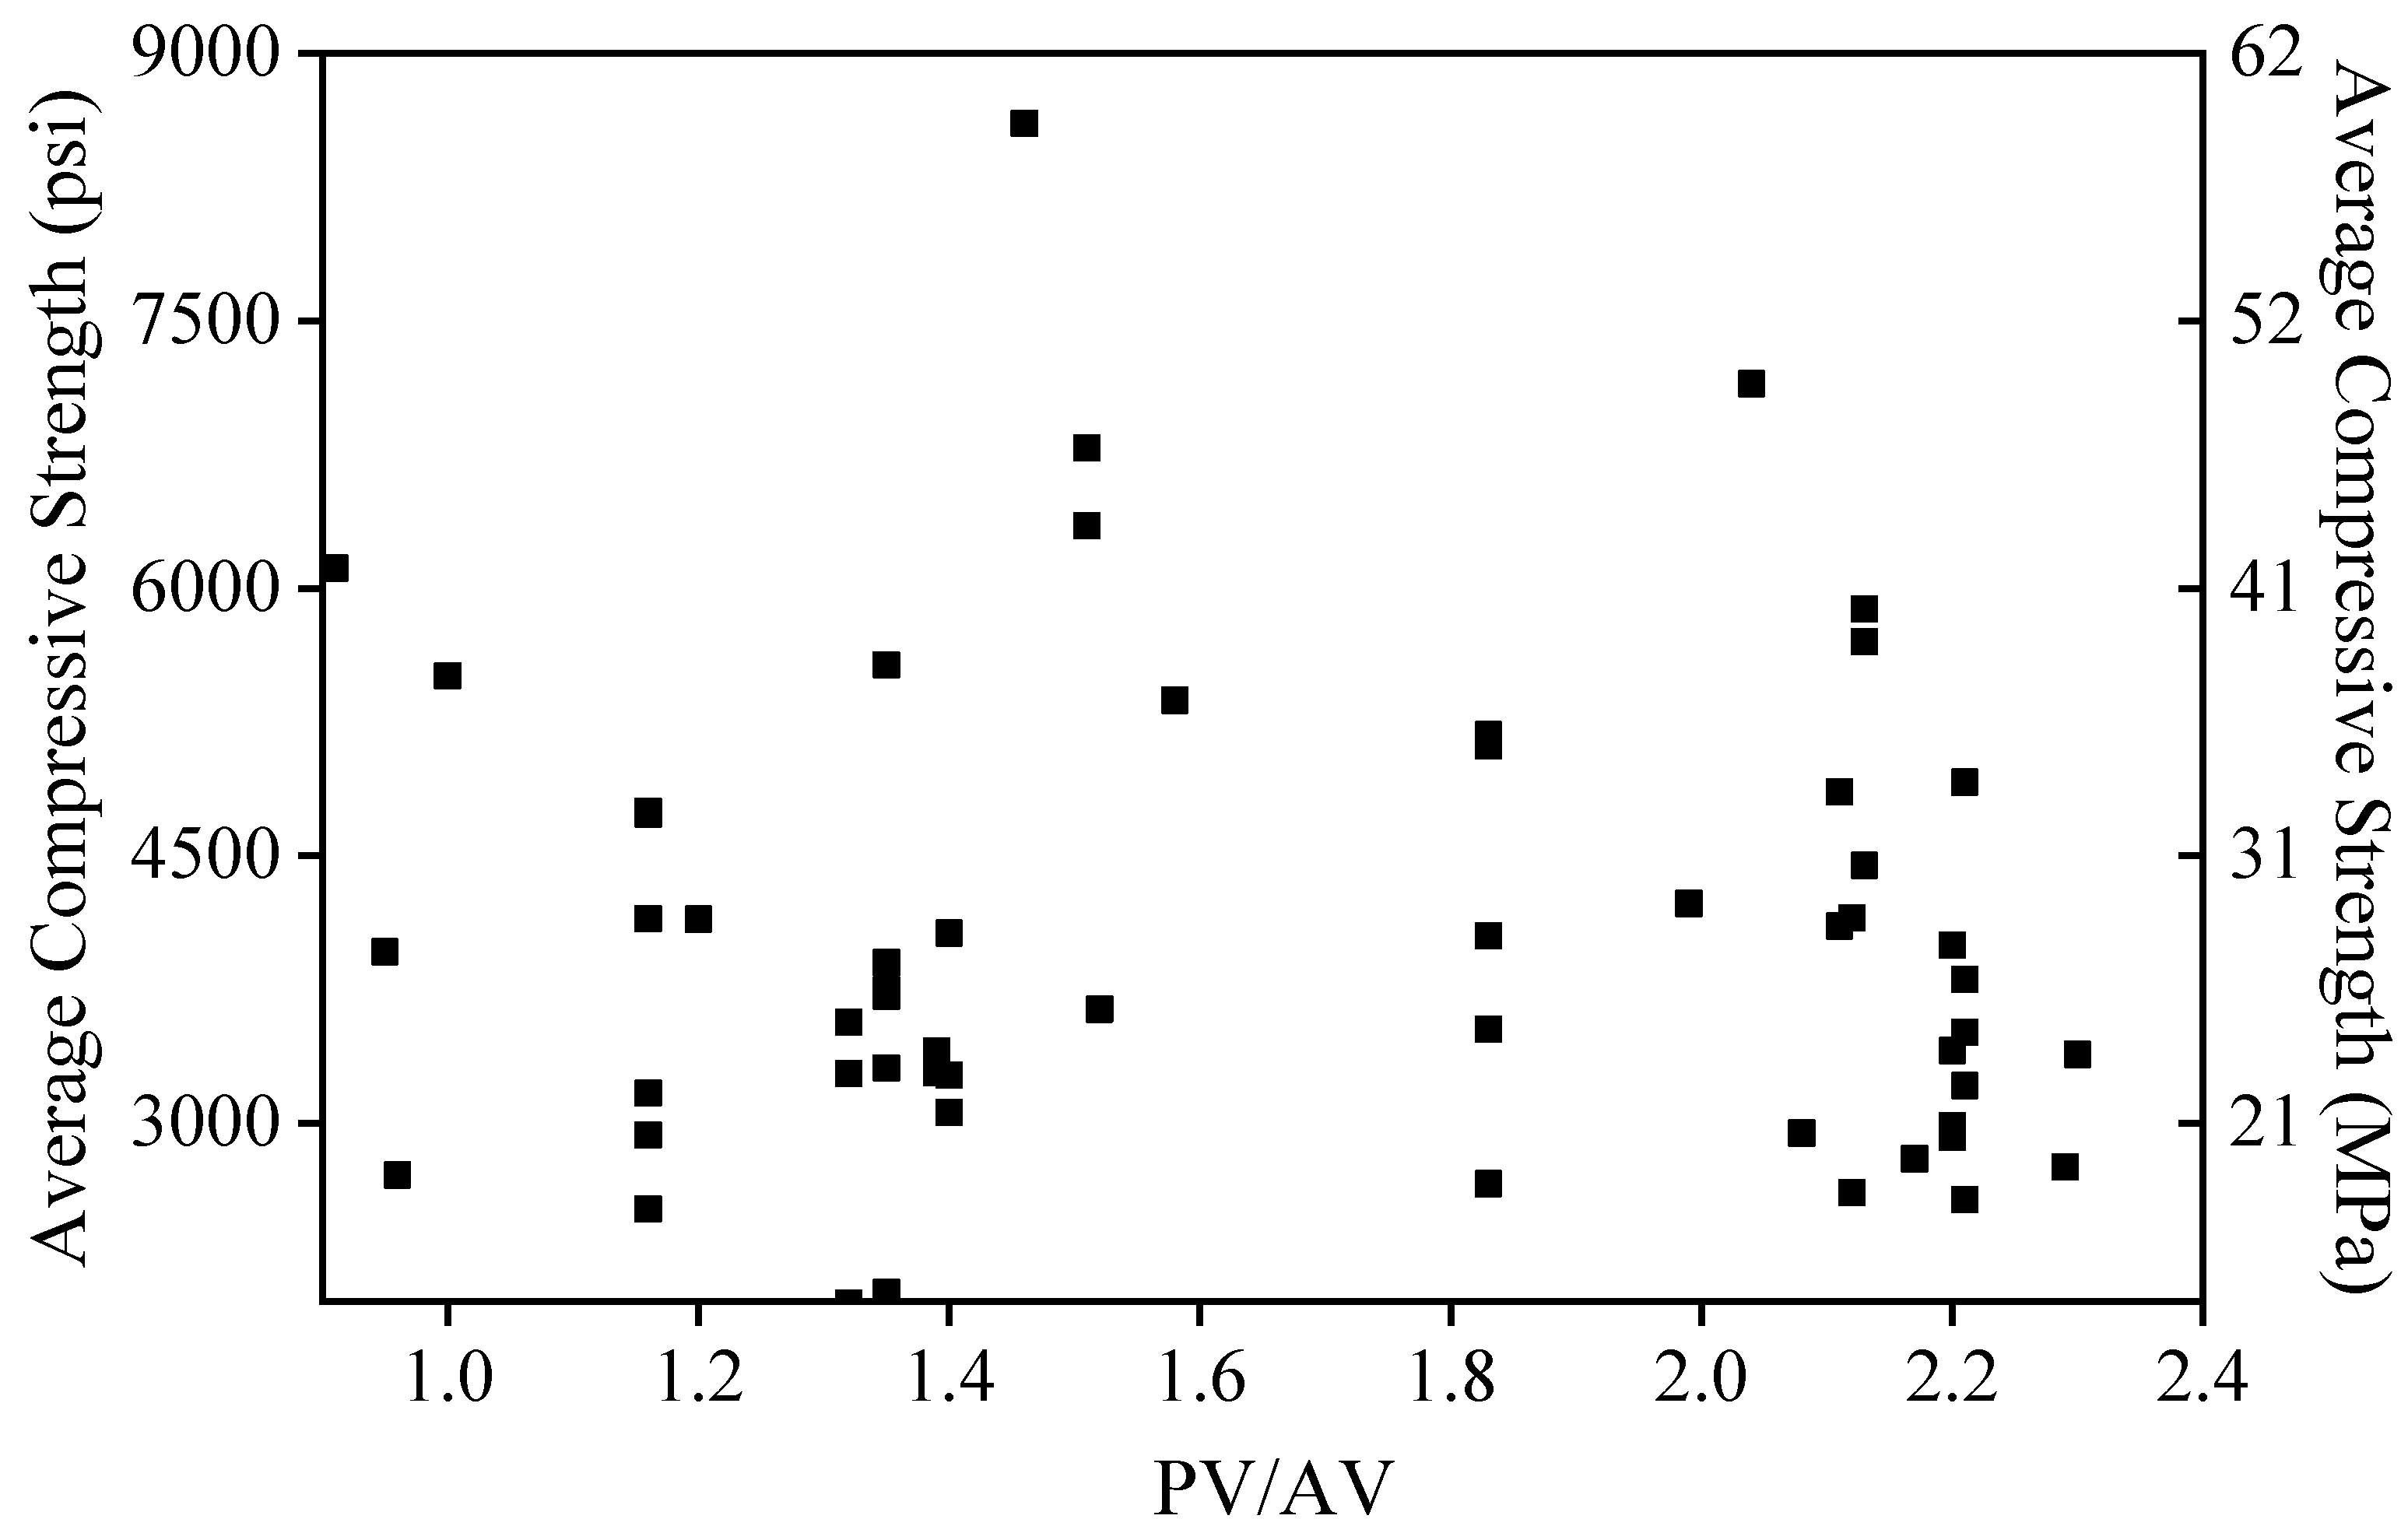
As a fractional factorial design was implemented, coupled with a large number of test parameters for evaluation, it was challenging to produce plots that captured the effect of only PV/AV on concrete characteristics. For example,
Figure 4 and
Figure 5 show the scatter plots for slump and 28-day compressive strength as a function of PV/AV only. The large scatter in these data is because of the additional influencing factors included in the experimental program, such as w/cm, OFA type,
RL,
DoR, and aggregate characteristics. In such scenarios, MLR models are developed with generated data to capture the effects of all parameters.
Table 6,
Table 7 and
Table 8 show the MLR data for the models developed based on the data generated from this testing program. In these tables, the significant
p-values are underlined for the readers’ benefit. Note that
p-values less than 0.05 are considered to be significant and that these provide conclusive evidence that the associated explanatory variable (e.g., PV/AV) influences the response variable (e.g., slump).
Table 6 shows the MLR data for the model developed for the slump. It can be seen that w/cm, PV/AV, and FM are significant parameters with
p-values of 0.011, 0.018, and 0.001, respectively. As noted earlier, FM has been reported to indirectly influence the paste volume of concrete in both the ACI 211 and PCA specifications. Note here that the RLs of SCMs typically influence the slump of concrete. However, in this research, there was no significant effect of OFA RL on the slump. This can be attributed to the unique chemistry of the OFAs used in this research, and more discussion on this is presented in Vasudevan and Trejo (2023) [
14]. Note also that the data in
Table 6 indicate that a 0.05 increment in PV/AV can result in a slump increase of approximately 0.3 inches (7 mm), provided all the other factors remain the same.
Table 7 shows the effect of PV/AV and other material characteristics on the 28- and 56-day compressive strength of concrete specimens made from all the 72 mixtures. Note that the authors decided to include the variables that were relevant to the property/characteristic in question. Including additional variables would have led to overfitting of the model, significantly reducing the power of the developed regression models. The w/cm, the
DoR of the OFA, and the
NMAS are the three significant variables influencing compressive strength. It is interesting to note that the
p-value of 0.0274 for PV/AV only provides moderate evidence for significance on the 28-day compressive strength and suggestive, yet inconclusive evidence for significance (
p-value = 0.0734) on the 56-day compressive strength. This suggests that the current dataset does not suffice to conclusively assess the significance of PV/AV and that more investigation is required. However, the researchers determined to keep PV/AV in the model for estimating both compressive strengths.
MLR data for the bulk resistivity model are shown in
Table 8. The w/cm,
DoR,
RL,
d50, and loss on ignition (LOI) of the OFA are significant parameters. Note that PV/AV does not have a significant effect on the bulk resistivity. The findings from
Table 7 and
Table 8 further underline the influence of the
DoR of the OFA on the strength and resistivity of concrete. A discussion on the influence of the
DoR and the chemistry of SCMs on the fresh, mechanical, and durability characteristics of concrete is presented in Vasudevan and Trejo (2022) [
14].
The models presented in this section were essential to developing the SER mixture proportioning method with minimal trial mixtures. Using these models ensures that the proportioned concrete mixture meets the required fresh, hardened, and durability characteristics. These models will be presented in the mixture proportioning steps in which they are used. The methodology to proportion concrete mixtures based on PV/AV is presented next.
6. A New SER Mixture Proportioning Methodology Based on PV/AV
This section provides a description of the procedure necessary to proportion economic, sustainable, and resilient concrete mixtures. This procedure is based on the aggregate voids and the paste volume required to achieve some predefined workability. A total of ten steps are required. This new SER proportioning method emphasizes the quantification of voids in the combined aggregates (fine and coarse aggregates) prior to the mixture proportioning process. This void quantification will minimize the CMC in the concrete mixture, which in turn can lead to a reduction in cost, a reduction in the overall carbon footprint, and improved durability.
The ten steps required in the mixture proportioning process are broadly classified into three categories. Steps 1 and 2 fall under the category of material assessment and involve identifying and characterizing the constituent materials and quantifying the voids in the combined aggregates. Steps 3 to 6 include the proportioning category and involve determining the quantities of constituent materials required for one unit volume of concrete (i.e., 1 yd3 or 1 m3). Steps 7 through 10 include confirming that the proportions meet the required properties and characteristics. In Step 7, the required hardened characteristics (strength and resistivity) of the concrete mixture are estimated. Step 8 involves the optimization of w/cm based on the required hardened characteristics. Step 9 involves performing a trial mix. Step 10 involves further optimizing the paste volume to enhance sustainability, economy, and resiliency. The following sections provide a description of each step.
- Step 1.
Select and Characterize Constituent Materials
The first step in the mixture proportioning process is to identify the coarse and fine aggregates that will be used for the concrete in the project. It is assumed here that the gradations of both the fine and coarse aggregates meet the requirements of the project. If the aggregate characteristics are not provided by the aggregate producer, the specific gravity and absorption capacity can be determined using the ASTM C127 and ASTM C128 test methods [
27,
28]. In addition, other aggregate characteristics, such as FM, coarse aggregate shape (round or crushed), and NMAS, are also required.
The specific gravities of the cementitious materials (cement and SCM) used in the concrete are also required. If this information is not available beforehand, the specific gravities can be determined using the ASTM C188 test method [
29]. The
d50, LOI, and
DoR of the SCM are also required. Note that in this study an OFA was used as the SCM. However, any SCM either conforming to or not conforming to the relevant specifications can be used with this procedure (but not necessarily the same model parameters developed herein) within the limits imposed by the owner.
- Step 2.
Perform the AASHTO T 19 test to determine AVmin and F/Copt
The amount of voids in the aggregate system (fine and coarse) can change significantly depending on the aggregate types and the fine-to-coarse aggregate ratio. Therefore, it is necessary to evaluate the void content of the fine and coarse aggregates at different aggregate weight ratios to determine the ratio at which the void content is minimized. For this, the AASHTO T19 test is performed with different fine-to-coarse aggregate weight ratios (
F/
C). The
AV content of the combined aggregate system for each
F/
C value, as shown on the abscissa of
Figure 3, can be determined using the following (AASHTO T19) [
24]:
where
DRUW is the dry-rodded unit weight (lb/yd
3 or kg/m
3) of the combined aggregate, as determined by the AASHTO T19 test;
ρw is the density of water (1686 lb/yd
3 or 1000 kg/m
3); and
SGcomb.agg is the weighted average of the combined aggregates’ oven-dried specific gravity. Trejo et al. (2022) observed that the
F/
Copt value depends on the chosen aggregate system [
5]. For example, the authors reported that a combination of crushed quarry rock and fine sand exhibited an
F/
Copt of 1.25, whereas a combination of crushed gravel and fine sand exhibited an
F/
Copt of 0.75. It is recommended to check the void content of four (4) to six (6)
F/
C combinations. The
F/
C at which the lowest
AV was observed was identified as
F/
Copt, as shown earlier in
Figure 3. The
F/
C can influence the workability and abrasion resistance of concrete, as noted in ACI 325.14R-17,
Guide for Design and Proportioning of Concrete Mixtures for Pavements [
30]. This guide reports that increasing the
F/
C can reduce the abrasion resistance of concrete. Therefore, it is recommended that
F/
Copt falls within some reasonable range. Unfortunately, there are currently few studies available in the literature that explicitly report a range of ideal
F/
C values to improve abrasion resistance, which reduces the bleeding and segregation of concrete and results in a minimum of aggregate voids. Research is needed.
- Step 3.
Determine w/cm based on design strength
The target w/cm is typically based on the compressive strength requirements of concrete. Several methods can be used to select an appropriate w/cm that meets the project requirements, and the user is encouraged to use the equation most appropriate for their application. As an example, ACI 211 provides a table of target strength values as a function of w/cm as follows:
where
f’cr is the required compressive strength.
- Step 4.
Determine paste and aggregate volumes
The
PV required is dependent on the amount of voids in the aggregate system and the required workability (e.g., slump or edge slump). The amount of voids in the aggregate system is a function of aggregate shape, texture, size, gradation, and F/C. In most cases, minimizing the void content in the aggregate system will minimize the
PV required. The volume of the solids of the combined aggregates (both fine and coarse),
Vcomb.agg, can be determined using the bulk volume of the combined aggregates as one unit volume (
Vc) (i.e., 1 yd
3 or 1 m
3) as follows:
where
AVmin is the percentage of voids in the aggregate system determined in Step 2. Note that the required paste content, as a percentage, to achieve adequate workability must be greater than this
AVmin. Increasing the paste volume beyond
AVmin increases the workability of the mixture. However, increasing the paste volume beyond some high value can lead to segregation, volume instability, and poor compressive strength of the concrete.
PV/(
AVmin) can vary significantly depending on the type and proportion of constituent materials and the type of structure for which the concrete is required. Slump (or edge slump) requirements are known for a given type of structure, and information regarding this can be found in ACI 211 and PCA mixture proportioning guidelines [
20,
21]. So, an initial estimate of
PV/(
AVmin) is necessary to proportion a concrete mixture. Using the data from this research,
PV/(
AVmin) can be initially estimated as follows:
Equation (4) is a reduced and modified version of the data presented in
Table 6. Note that the initial w/cm is known from Step 3. Also, the slump term in Equation (4) represents the value in inches. For users of SI units, the slump value in millimeters must be divided by 25.4, to convert it into inches, and used in Equation (4).
CAshape in Equation (4) is a discrete parameter that refers to the coarse aggregate shape. A value of 0 is used if the coarse aggregate is crushed and a value of 1 is used if the coarse aggregate is rounded. By generating an initial estimate of
PV/(
AVmin), the required number of trial mixtures can be significantly reduced. Note that for some applications, such as slipform concrete pavements, edge slump requirements are specified instead of traditional slump. If available, edge slump models can be used in place of the traditional slump model in Equation (4). Once the (
PV/(
AVmin))
initial is determined, the volume of paste (
Vp) required can be estimated as follows:
Now note that the sum of these volumes of paste and combined aggregates is greater than some unit volume,
Vc (i.e., 1 yd
3 or 1 m
3), because of the additional paste volume necessary to achieve the concrete’s fresh characteristic requirements. To make the concrete mixture yield, the paste and combined aggregate volume must be proportionally reduced to a total unit volume (i.e., 1 yd
3 or 1 m
3). The corrected volume of combined aggregates (
Vcomb.agg,cor) for one unit volume of concrete can be determined as follows:
The unit of this value is either cubic feet per cubic yard or cubic meter per cubic meter. The corrected volume of paste (
VP,cor) per one unit volume of concrete can now be determined by subtracting the value determined in Equation (6) from
Vc as follows:
Summarizing, in Step 5, the volumes of both the combined aggregates and paste are determined for one unit volume (i.e., 1 yd3 or 1 m3) of concrete. The two key parameters that are used for these calculations are AVmin and (PV/(AVmin))initial. AVmin is determined in Step 2 using the AASHTO T19 method and (PV/(AVmin))initial is determined from Equation (4). Using the estimated total paste and combined aggregate volumes, the mass proportions of the main constituents (i.e., binder, water, coarse aggregates, and fine aggregates) are then determined using Steps 5 and 6. These are presented next.
- Step 5.
Determine water and binder quantities
The weight of water (
Wtwater) required for the mixture can be determined using the following:
where %
Air is the specified air content of the concrete as a percentage and
SGbind is the specific gravity of the binder. Note here that if multiple cementitious or pozzolanic materials are used in the binder, a weighted average of the specific gravities of the cementitious materials can be used to determine
SGbind. Following this, the weight of the binder (
Wtbind) can be determined using the following:
where w/cm is determined in Step 4 and is based on the design strength. Once the weight of the binder is determined, the weights of the cement (
Wtcem) and SCM (
WtSCM) can be determined. A discussion on choosing a suitable
RL of OFA, based on DoR, is available in Vasudevan and Trejo (2023) [
14].
WtSCM can be determined by multiplying the
RL of the SCM with the weight of the binder, as shown in the following equation:
Finally, the weight of the cement (
Wtcem) can be determined by subtracting the weight of the SCM (
WtSCM) from the total binder content (
Wtbind), as follows:
Note that if multiple SCMs are used, their weights can be calculated based on the equations provided in Trejo et al. (2022) [
5]. The weights of the water, cement, and SCM are now known and can be documented.
- Step 6.
Determine fine aggregate and coarse aggregate quantities and confirm yield
The remaining quantities to be determined are the weights of the fine and coarse aggregates.
F/
Copt, determined in Step 2, is needed to determine the quantities of the aggregates. The weight of coarse aggregates (
WtCA) can be determined as follows:
where
SGCA and
SGFA are the specific gravities of the coarse aggregates and fine aggregates, respectively. Subsequently, the weight of the fine aggregates (
WtFA) can be calculated based on the following equation:
After all the quantities of the constituent materials are known, the user must check to confirm what the sum of the volumes of all constituent materials yield; that is, that they equal some unit volume (i.e., 1 yd3 or 1 m3).
- Step 7.
Generate an improved estimate for compressive strength and resistivity
The objective of this step is to estimate the anticipated compressive strength and bulk resistivity using (
PV/(
AVmin))
initial and constituent material characteristics. Although Step 3 provides an initial strength estimate, the compressive strength model developed herein uses influencing parameters and this step is used to further optimize the mixture (i.e., reduce the OPC). First, (
PV/(
AVmin))
initial and the other relevant variables are used to estimate, in this case, the 28-day compressive strength using the following:
Note that this equation is significantly different and more comprehensive (i.e., includes OFA
RL,
d50,
DoR, and
LOI) when compared to the ACI 211 equation in Equation (2). Alternately, in cases where the 56-day compressive strength is required, the values from
Table 7 for 56-day compressive strength can be used in place of the 28-day compressive strength values.
The bulk resistivity is then assessed to determine whether the mixture with (
PV/(
AVmin))
initial can achieve the required durability criterion. Note that any durability criteria can be used but data must be generated to develop the necessary model. The bulk resistivity can be determined using the w/cm determined in Step 3 and the other variables. Bulk resistivity is determined as follows:
It can be seen in Equations (14) and (15) that the DoR, RL, d50, and LOI of the OFA are necessary to estimate f’cr and bulk resistivity. The compressive strength and resistivity values generated in this step are used to optimize the mixture. This is discussed in Step 8 presented next.
- Step 8.
Optimization of w/cm based on strength and resistivity
Once
f’cr and bulk resistivity are estimated, they are compared to the target criteria. As shown in
Figure 6, modifications can be made to the w/cm depending on how the estimated values of
f’cr and bulk resistivity compare to the target criteria. If either
f’cr or bulk resistivity do not meet the target criteria, the w/cm is reduced by 0.02 and Steps 3 through 7 are repeated. Alternately, if both
f’cr and bulk resistivity exceed 120% of the target criteria, the w/cm is increased by 0.02 and Steps 3 through 7 are repeated.
- Step 9.
Perform trial mixes to identify (PV/AVmin)opt
Note that the (PV/(AVmin))initial determined from the slump model in Equation (4) is only an estimate and may not necessarily be the actual PV/(AVmin) that satisfies the workability requirements. Also note that, as stated earlier, the objective of this research is to minimize the CMC and paste content to minimize the carbon footprint, maximize the economy, and maximize the durability of the mixture (i.e., make the mixture sustainable, economical, and resilient). Therefore, it is critical to identify an optimal PV/(AVmin) value, (PV/(AVmin))opt, that meets the specified workability criterion and hardened characteristics using trial mixtures. As such, Step 9 involves performing the necessary trial mixes required to identify the (PV/(AVmin))opt and resulting proportions.
- Step 10.
Identify (PV/AVmin)opt
The first trial mixture may not provide the user with the optimal
PV/(
AVmin), (
PV/(
AVmin))
opt. As an example, consider a scenario where a trial mixture with a
PV/(
AVmin) of 1.2 does not meet the required workability criteria, e.g., slump or edge slump. In such a scenario, another trial mixture is proportioned and mixed with a higher
PV/(
AVmin) of 1.25. If a mixture with a
PV/(
AVmin) of 1.25 meets the required criterion, then (
PV/(
AVmin))
opt lies between 1.20 and 1.25. However, if a
PV/(
AVmin) of 1.25 does not meet the required criterion, then another trial mixture is required with a higher
PV/(
AVmin) of 1.30, as shown in the procedure in
Figure 6. Identifying (
PV/(
AVmin))
opt is critical in minimizing the OPC and overall paste content. As an example, for an
AVmin of 25% and a w/cm of 0.5, a 0.05 difference in
PV/
AV corresponds to 26 lb/yd
3 (15 kg/m
3) of cementitious materials. After determining (
PV/(
AVmin))
opt, the quantities of the other constituent materials can be determined using the new SER mixture proportioning procedure, as shown earlier. The authors would like to note that optimizing the
PV/(
AVmin) value in this last step does not significantly change the compressive strength and bulk resistivity of the concrete. Unlike the workability (i.e., slump in this research), it can be seen from
Table 7 and
Table 8 that an increase in PV/AV of 0.05 changes the 28-day compressive strength and bulk resistivity by only 34 psi (0.25 MPa) and 12 ohm-in (0.3 ohm-m), respectively, provided other parameters remain the same.


