Article

Application of Bilinear Softening Laws and Fracture Toughness of Foamed Concrete

1
Department of Civil Engineering, Faculty of Civil Engineering and Built Environment, Universiti Tun Hussein Onn Malaysia, Batu Pahat 86400, Malaysia
2
Department of Mechanical Engineering, Faculty of Engineering, University of Mataram, Mataram 83115, Indonesia
*
Author to whom correspondence should be addressed.
Constr. Mater. 2023, 3(3), 287-304; https://doi.org/10.3390/constrmater3030019
Submission received: 28 May 2023 / Revised: 13 July 2023 / Accepted: 21 July 2023 / Published: 3 August 2023
(This article belongs to the Special Issue Modelling and Analysis of Concrete Degradation)

Abstract

:
This study examined the fracture and failed performance of foamed concrete materials by testing normalized notched beams under three-point bending via three methods: inverse analysis, digital image correlation (DIC), and finite element modeling (FEM). It also discussed both experimental and FEM characteristics. However, inverse analysis is only applicable for specimens with a notch height of 30 mm. Bilinear softening of the tested beams was estimated to identify the fracture energy (GF), critical crack length (ac), and elastic modulus (E). Additionally, the fracture toughness was calculated by adopting the double-K method (initiation fracture, unstable fracture, and cohesive fracture). Two-dimensional FEA modeling of the fracture was conducted using the traction-separation law (TSL), incorporating the extended finite element method (XFEM) and cohesive zone (CZM) techniques. A finite element sensitivity for the XFEM and CZM was performed, with the global mesh size of 2 and the damage stabilization cohesion of 1 × 10⁻⁵ showed good convergence and were used in other models. Further comparison of the DIC experiment findings with those from the FEM demonstrated good agreement in terms of crack propagation simulation.

1. Introduction

The structural design of buildings entails the determination of the best way to transmit loads to the ground. However, the utilization of concrete is inevitable in construction due to its moldability, impermeability, and favorable compression conditions; somehow, the weight of normal concrete is relatively high and creates a significant dead load for the upper structure. Regarding substructures, such as a foundation, the transfer of major loads affects the foundation design more than the low soil-bearing capacity. This leads to high costs. The introduction of lightweight materials, such as foamed concrete, is a promising solution to counter this problem. The incorporation of voids into concrete limits its strength properties; nevertheless, it has prominent potential as a structural material. The incorporation of pozzolanic materials as replacements for cement not only reduces the production of CO2 but also enhances the strength properties of foamed concrete. Several studies utilized silica fumes as pozzolanic materials, including those by Lee et al. [1], Gökçe et al. [2], Ahmad et al. [3], and Wang et al. [4], with densities of 1700, 1424, 1300, and 1400 kg/m3, respectively, and compression strengths of 27.12, 26.8, 24.3, and 20 MPa, respectively.
In conventional theory (stress–strain equilibrium), concrete tensile resistance is negligible. However, knowledge of the fracture behavior of brittle materials, which can lead to catastrophic failure, is essential, especially for critical buildings such as dams, tunnels, and nuclear power plants. A drawback of the conventional theory is its inability to predict the fracture behavior of materials, especially after the material’s resistance is reached. The linear elastic fracture mechanic (LEFM) theory is only able to explain fracture behavior for material has a relatively small plastic process zone. However, the development of a fracture process zone (FPZ) ahead of a crack tip prior to fracture [5] and the shape and dimensions within the concrete material result in the use of improper methods to implement the LEFM theory [6]. The stress transfer capability of the material, sometimes referred to as the softening feature of concrete, is compromised by the presence of a FPZ. Various studies on fundamental models were conducted, including those that investigated the fictitious crack model (also known as the cohesive crack model) [5], crack band model [7], two-parameter fracture model, effective crack band model [8], size effect model [9], and double-K fracture model [10].
Fracture energy refers to the amount of energy used to open a unit area on a crack’s surface. It is one of the parameters governing the damage-and-fracture mechanism. A study conducted by Jaini et al. [11] investigated the fracture energy in foamed concretes with different densities (1400–1600 kg/m3). Meanwhile, a similar investigation by Kozlowski et al. [12] used the densities of 488–1024 kg/m3. Both studies showed that increases in the density of foamed concrete resulted in increased fracture energy. According to Falliano et al. [13], the fracture energy in foamed concrete is influenced by the selection of the curing method. Xu et al. [14] investigated fracture energy by considering the boundary effect. It was found that the weaker the local fracture energy, the closer it was to the element boundary. Ding et al. [15] observed the fracture energy in a slag-based geopolymer (SG) and Portland cement (PC) with various compressive strengths. As for the compressive strength, the SG developed greater fracture energy compared to the PC.
Non-contact monitoring methods, including acoustic emission (AE) and digital image correlation (DIC), have been widely employed to better understand the fracture process occurring before the crack tip [16,17,18]. Ohno et al. [19] investigated the FPZ in a notched concrete beam under three-point bending (3PBT) with variously sized aggregates by applying AE. It was found that the fracture energy was correlated with the width of the AE cluster, as the energy increased when the width of the FPZ expanded. Alam et al. [20] observed the FPZ of a notched beam under 3PBT by using DIC and AE. The study concluded that DIC is better compared to AE, particularly as DIC is based on crack opening while AE may cause a loss of information as it is not possible to know exactly the crack tip. Meanwhile, Wu et al. [21] observed the FPZ via DIC and stated that the length of the FPZ increased during crack propagation and decreased after the FPZ was fully developed.
Finite elements (FEs) have been extensively utilized in previous studies to investigate the damage and fracture mechanisms in structural engineering [22,23,24,25,26]. Finite element analysis (FEA) is a simulation of any given physical phenomenon using a numerical technique called the finite element method (FEM). There are three well-known methods within the Traction–Separation Law (TSL): the extended finite element method (XFEM), cohesive zone model (CZM), and virtual crack closure technique (VCCT). However, the selection method within the TSL will determine the behavior and structural response [27]. An investigation by Yu et al. [28] observed a notched graphite nuclear beam using the XFEM, CZM, and VCCT. The result showed that the VCCT is more sensitive compared to the XFEM and CZM. Meanwhile, Omar et al. [29] worked on foam concrete beams using the XFEM and CZM and found that there was less agreement within the CZM due to the simplification of adopting a failure path. However, the LEFM theory adopted within the ABAQUS software is only applicable for materials that have a relatively small plastic process zone [30].
The novelty within this study is that the material constituent of foamed concrete is different compared to normal concrete, such as having no coarse aggregate and a more void presence, which affects the fracture process zone length (or critical crack). To the best of our knowledge, there has been no previous research conducted on the matter. Inverse analysis was adopted to estimate the critical crack length, which will be described further in the following section. DIC was also conducted to observe the critical crack length at the ultimate load. In addition, the TSL incorporated with the XFEM and CZM within two-dimensional (2D) FEA Modeling was adopted. Later, It was followed by an observation of the crack propagation at the ultimate load, which predicted the results.

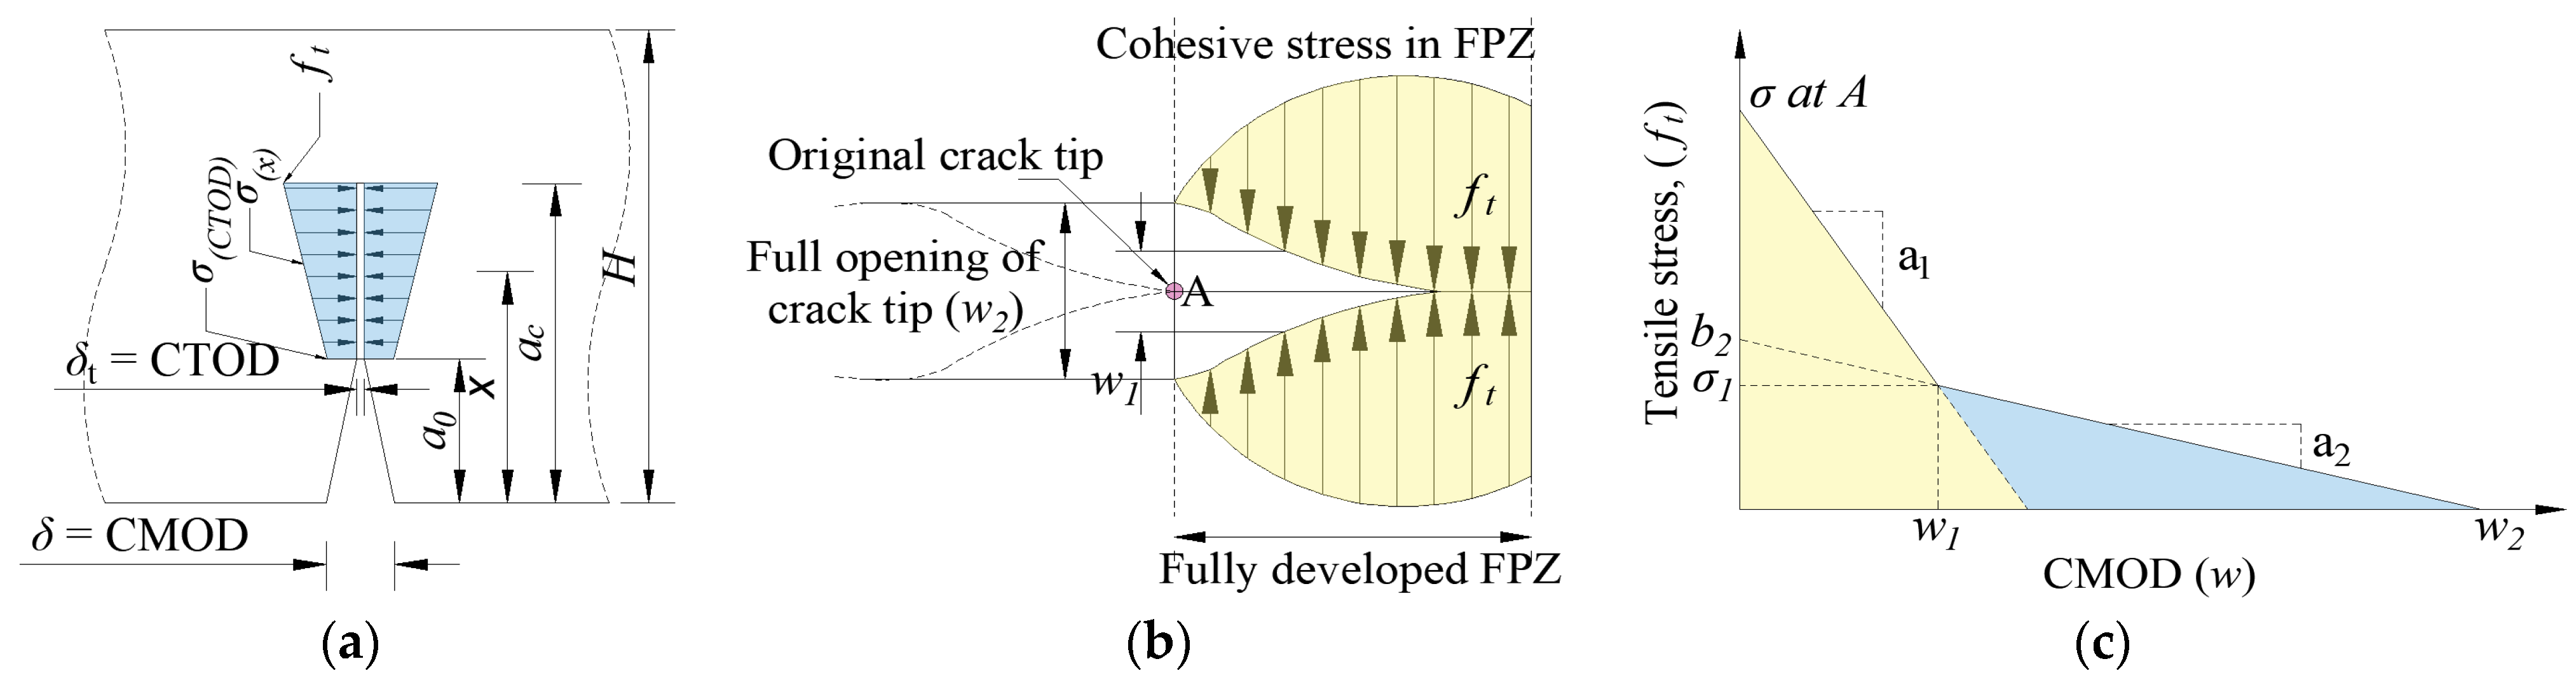
1.1. Bilinear Softening Law

The classical bilinear softening law is extensively adopted in fracture mechanics and used as a cohesive zone model [5,31,32]. The model is based on the idea that concrete softens gradually owing to microcracking and other energy dissipation processes in an extended fracture process zone (FPZ) prior to a real traction-free crack. As for a real traction-free crack, this portion of the crack cannot be continuous with complete separation of its faces. The fictitious crack faces have certain residual amounts of stress that can be transferred across them and are inconsistent along their length. An investigation by Hu & Fan [33] stated that critical tip opening displacement ( C T O D c ) reached its value at an ultimate load while cohesive stress ( σ C T O D c ) was reached at the fracture tip, as depicted in Figure 1a, whereas Figure 1b,c describe the condition where a crack is already formed. Additionally, Roelfstra & Wittmann [34] emphasized that the determined kink point (σ1, w1) of the bilinear softening law is the most essential component.

1.2. Fracture Toughness

Prior to reaching the ultimate load, crack initiation is already present within the concrete material [33]. However, this condition of crack propagation under an applied load can be explained through fracture toughness (K). Since the use of the LEFM theory is irrelevant due to the presence of the FPZ, several researchers have adopted the double-K method [17,35,36,37,38]. The important parameters of fracture toughness are Kini (initial cracking) and Kun (unstable cracking toughness). Such a case clearly indicates that in quasi-brittle material, the fracture crack develops in three stages: initial cracking, stable development, and failure development. The corresponding fracture criteria are that when K < K I C i n i no crack appears, whereas the specimen is deemed to be in the failure stage when K I C i n i K < K I C u n , with the crack developing stably. When K K I C u n , the crack develops unstably. These parameters, therefore, have the following relationship: K I C u n = K I C i n + K I C C , Δ a c = a c a 0 . K I C i n i and K I C u n can be calculated using Equations (1) and (3), respectively.
K I C i n i = 3 P i n i S a 0 2 H 2 B F ( a 0 H )
F ( a 0 H ) = 1.99 ( a 0 H ) ( 1 a 0 H ) [ 2.15 3.93 ( a 0 H ) + 2.7 ( a 0 H ) 2 ]   ( 1 + 2 ( a 0 H ) ) ( 1 ( a 0 H ) 1.5 )
K I C u n = 3 P u l t S a c 2 H 2 B F ( a c H )
F ( a c H ) = 1.99 ( a c H ) ( 1 a c H ) [ 2.15 3.93 ( a c H ) + 2.7 ( a c H ) 2 ]   ( 1 + 2 ( a c H ) ) ( 1 ( a c H ) 1.5 )
a c = 2 π ( H + H 0 ) a r c t a n B . E 32.6   P u l t C M O D c 0.1135 H 0
E = 6 S a 0 C i B H 2   ( 0.76 2.28 α 0 + 3.87 α 0 2 2.04 α 0 2 + 0.66 ( 1 α 0 ) 2 )
C T O D c = C M O D c { ( 1 a 0 a c ) 2 + [ 1.081 1.14 ( a c H ) ] [ a 0 a c ( a 0 a c ) 2 ] } 1 / 2
where Pult is the ultimate load and Pini is obtained through the initial point of non-linearity in the P–CMOD curve. B, H, and S are the width, height, and span of the beam, respectively; H0 is the clip gauge holder thickness (2 mm in this study). Additionally, the elastic modulus can be predicted using inverse analysis from the P–CMOD curve, where α 0 = ( a 0 + H 0 ) / ( H + H 0 ) and Ci is the initial compliance of the P–CMOD curve. The sum of the initial pre-cut crack length ( a 0 ) and fictitious crack extension length ( Δ a c ) equals the critical crack length ( a c ).

2. Experimental Investigations

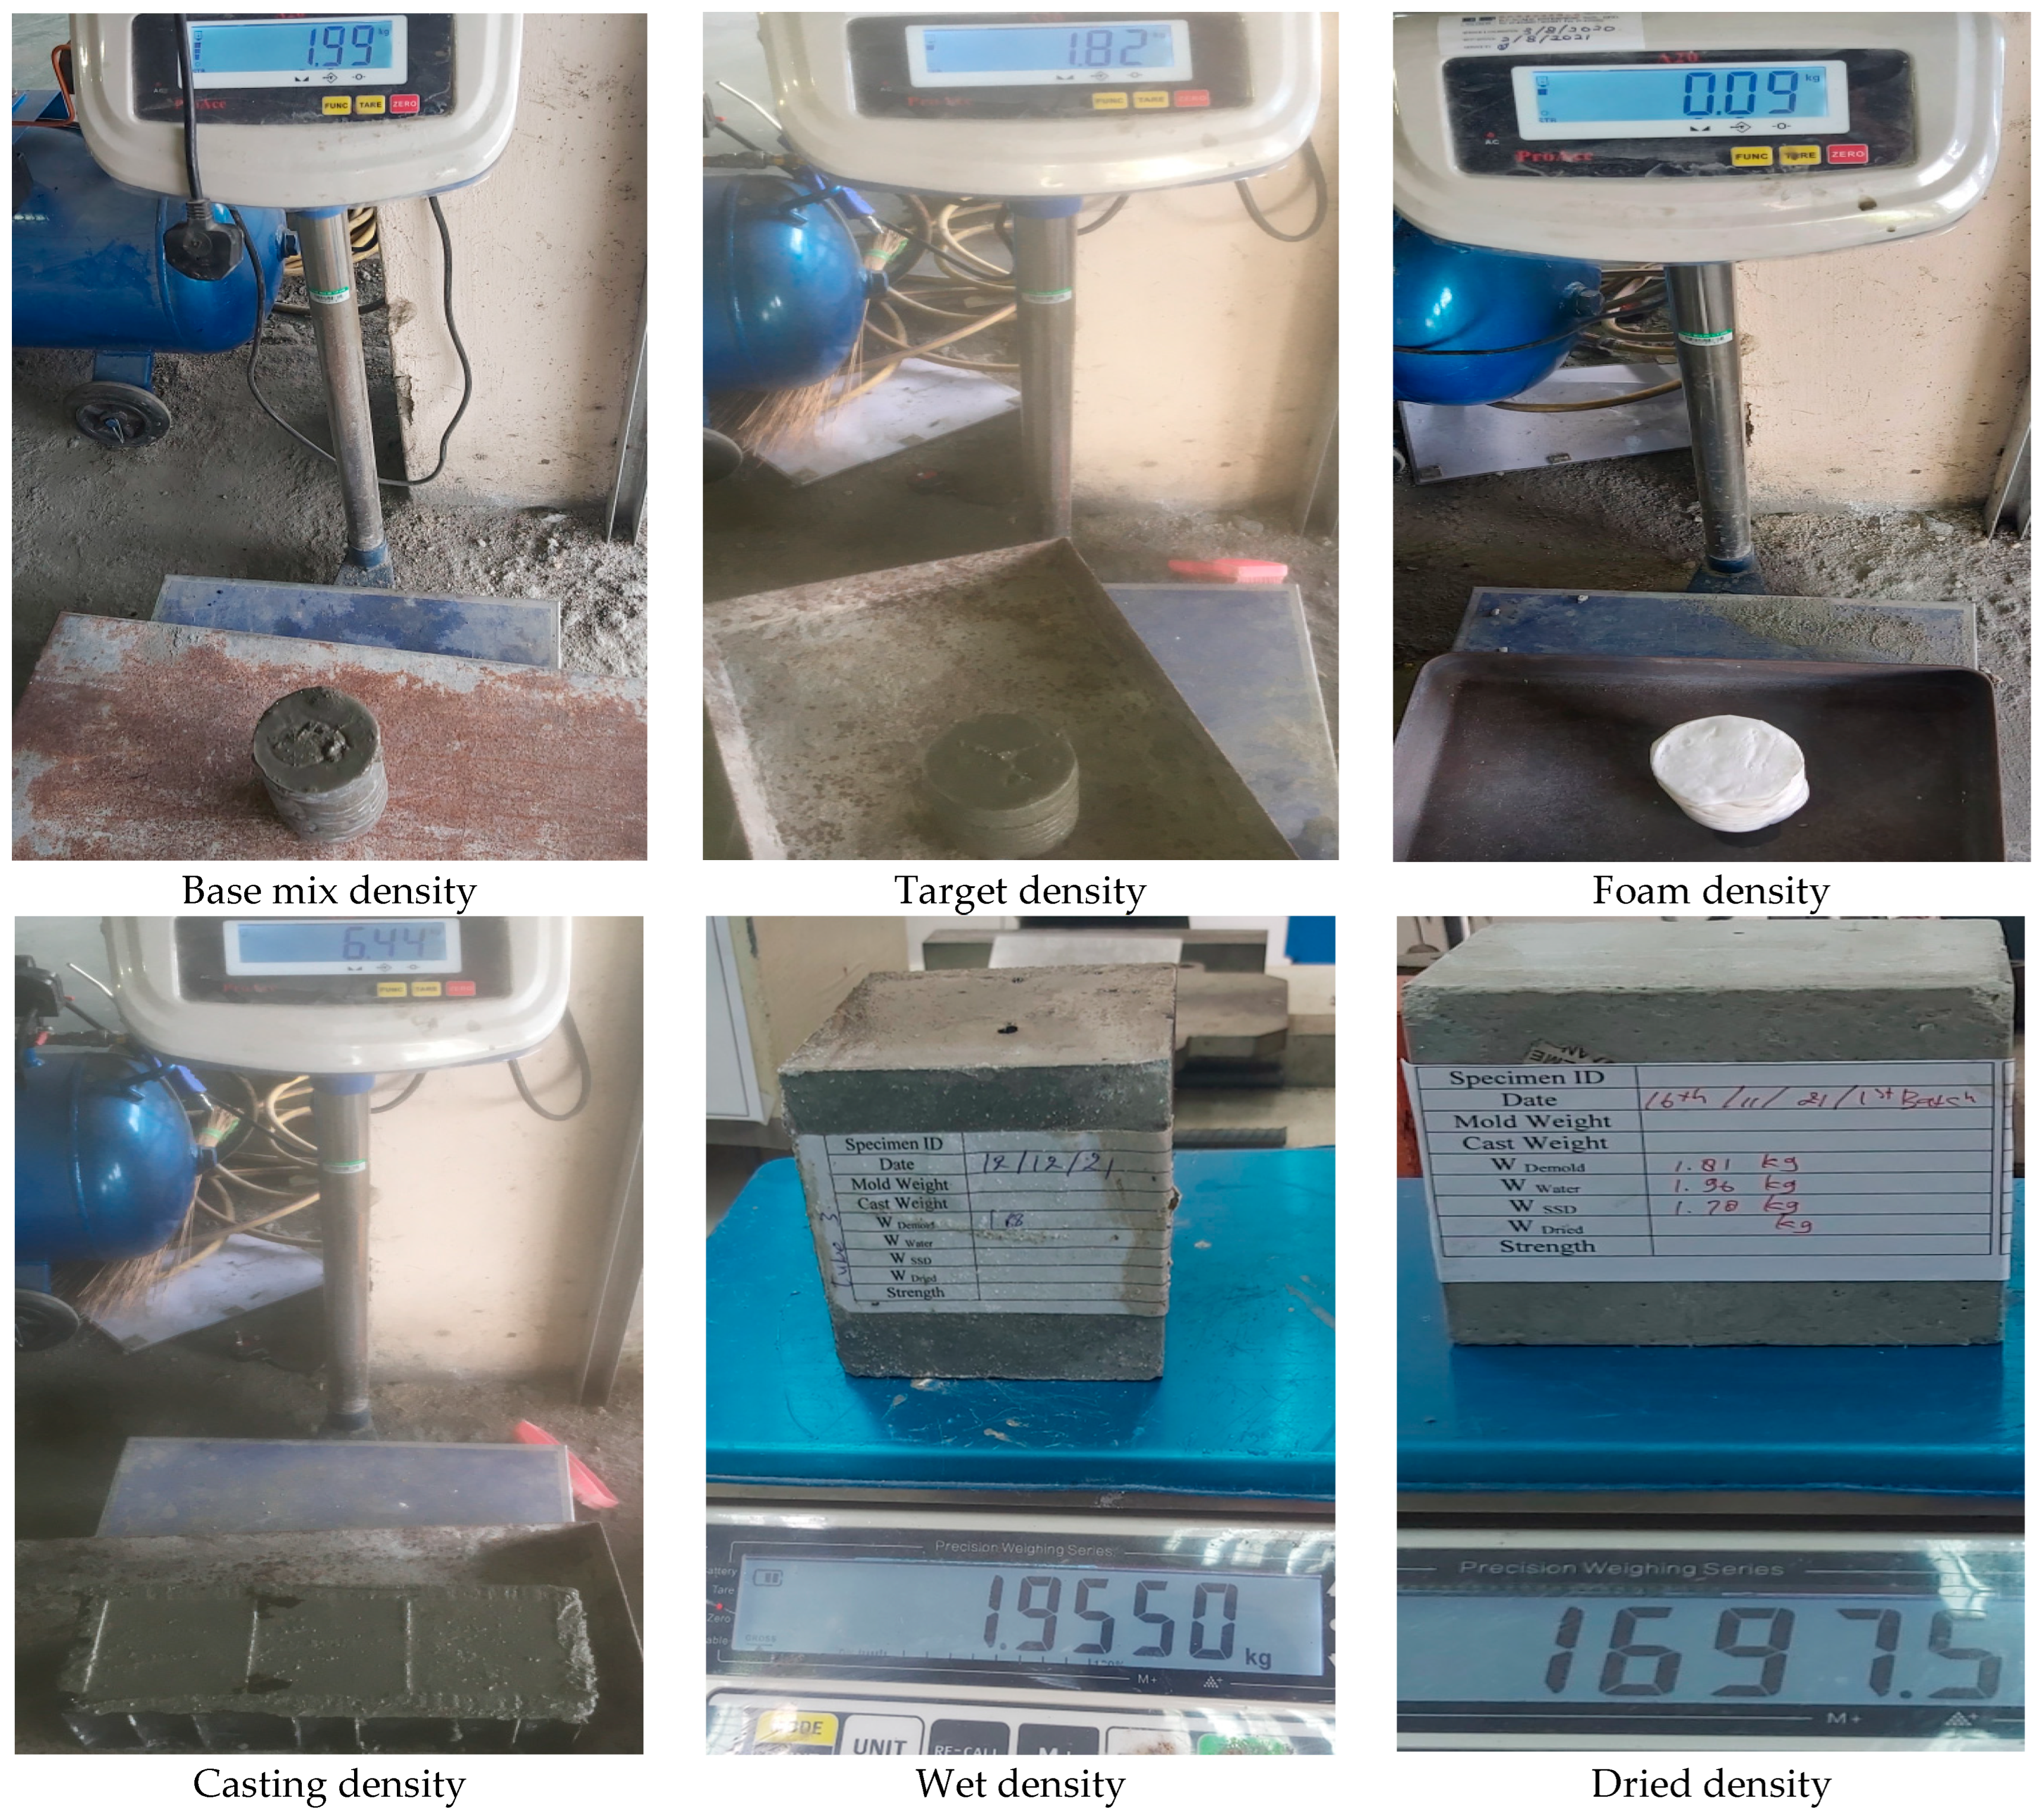
2.1. Experimental Testing

A specific gravity mix design was utilized for batching the lightweight foamed concrete. The components of the lightweight foamed concrete were river sand with a maximum 3-mm grain size, Tasek Portland Cement I-42.5R manufactured in Ipoh, Malaysia, superplasticizers (SPs), water pH 7, and silica fume (SF). SF was manufactured by Shinjiang Shengping Minerals Co., Ltd. from Shijiazhuang, China as a partial cement replacement. A synthetic-based foaming agent, Sika Aer 50/50 manufactured in Nilai, Malaysia, with a ratio of 1:20 was used to generate foam. As shown in Table 1, the water-to-binder ratio, sand-to-binder ratio, SP-to-binder ratio, and SF replacement were 0.42%, 3%, 0.01%, and 5%, respectively. Prior to foam addition, the base mix density was measured to be 1995 kg/m3, and the addition of foam was intended to achieve a density of 1820 kg/m3. Casting was conducted when the concrete achieved the desired density. The concrete was set for 24 h before it was demolded and cured with water for 28 days. Each stage density of the foamed concrete was measured as depicted in Figure 2.
Upon reaching the 28th day, the specimens were dried by placing them inside the oven for 24 h. Three cubes of specimens were tested for compressive strength, f′c (see Table 1). Painting and marking were conducted prior to testing, where contrast white and black speckles were applied on the smooth surface to enable detection via the DIC software (GOM Suite version 3.0.1101.1). The software is developed by Carl Zeiss located in Oberkochen, Germany. Three specimens of each notched beam and cylinder were tested and recorded using two configured cameras (Camera 1 was to detect deformation, while Camera 2 was to show the applied load, see Figure 3d). Un-notched concrete beams were tested under a four-point bending test following the ASTM-C78-02 standard [39]. The purpose of an un-notched beam was to determine the indirect tensile strength without being affected by stress concentration (or un-notched strength); such a value was required later in the FEM. On the other hand, notched beams were tested under a three-point bending test based on the JCI-S-001 standard [40] with a speed rate of 0.1 mm/min. The purpose of this notched beam was to observe fracture characteristics and fracture energy (GF). The schematic test and geometry of specimens for the un-notched and notched concrete beams are shown in Figure 4, whereas cylinder specimens were tested under a compression test following the ASTM C469-02 standard [41] to determine the elastic modulus and Poison’s ratio required for the FEM. Table 2 shows the testing series with the three specimens that was conducted in this study (see Figure 3a,b).

2.2. Experimental Results

The shape of the bilinear softening law is determined using four parameters: ft, σ1, w1, and w2 (see Figure 1c and Figure 5a). In this study, the indirect tensile strength (ft) was obtained using the classical theory (moment–section modulus). Compared to the previous study [15], this study obtained different kink points (σ1, w1) and zero stress points (w2) in the expression of a cohesive law (see Table 3). According to [42], kink points (σ1, w1) are assumed to occur at 0.15–0.33; such a result is similar to this study. Nevertheless, the zero-stress point (w2) was compared to other studies [15,33] (with values of 0.284 and 0.239 mm, respectively) on normal concrete, but the foamed concrete in our study developed a value of more than 2.0 mm (see w2 in Table 3). This condition was due to the presence of a void, which allowed for the arresting of the crack during propagation. Regarding the initiation crack obtained from a second non-linear P–CMOD curve [16,33], initiation within the foamed concrete was relatively close to the ultimate load. This is because the foamed concrete contained no coarse aggregate to provide bridging. The presence of stress concentration due to of notch influenced the height of the FPZ above the crack tip, which reduced the tensile strength (ft), including at the kink points (σ1, w1) (see Table 3).
In this study, fracture energy (GF) was estimated using the classical Hillerborg model [43] based on the load–displacement (Equation (8)). Similar previous studies have used the Hillerborg model to estimate the fracture energy of foamed concrete material [11,12], achieving values of 0.018–0.025 N/mm for densities of 1400–1600 kg/m3 and 0.001–0.012 N/mm for densities of 488–1024 kg/m3. Falliano et al. [13] estimated the fracture energy using the JCI-S-001 equation [40] (based on load–CMOD curve), giving a value of 0.003–0.010 N/mm for 800 kg/m3 of density. Figure 5b depicts the softening area (U0) within this model, where mg is the specimen weight, do is deflection at the failure, W is the specimen width, H is the specimen height, and a 0 is the notch height. Compared to other studies on normal concrete, the foamed concrete fracture energy in this study was relatively lower. Additionally, inverse analysis (from the notched beam) and conventional analysis (from the cylinder) were conducted; however, only the GF-30 testing series showed good agreement in terms of the elastic modulus (E) (see Table 4), as the Ci value was significantly influenced by the notch height. Double-K was used to observe the fracture toughness, and the critical tip opening displacement (CTODc) was computed from the critical mouth opening displacement (CMODc) at the ultimate load. It was found that inverse analysis with the GF-70 testing series was incapable of identifying unstable fracture toughness K I C u n and cohesive fracture toughness K I C c due to the absence of a FPZ.
G F = ( U 0 + m g d 0 ) W ( H a 0 )

2.3. Digital Image Correlation

This study analyzed the deformation represented by a microcrack using the DIC software GOM Suite. Figure 6a depicts the deformation of each stage within foamed concrete by referring to Figure 3d. The initiation crack began with a microcrack above the notch tip. The occurrence of the initiation crack was identified using the second linear of CMOD in Figure 5a. Meanwhile, Figure 5c shows the presence of a notch that influenced the tensile resistance of the specimens, whereas a higher notch exhibited a smaller FPZ. Also, a higher notch allowed the specimens to bend more, as depicted in Figure 5d. The microcrack developed and became longer until the ultimate load. At this stage, the length of the microcrack was assumed to be a critical crack. However, both inverse analysis and the DIC method showed good agreement. After reaching the ultimate load, the crack was visible to the naked eye within the softening phase (SF). During the first softening (SF1), the traction started becoming weaker from the notched tip. The traction disappeared along the crack propagation, as seen during the second softening (SF2). Nevertheless, the traction length was shorter when the crack was propagated until fully separated. Figure 6e–h shows the opening distance along the notch height, which stands as a verification of the inverse analysis (or superposition method) for CTODc. The CTODc value from the DIC observation was slightly lower, 0.07 mm (Figure 6f), compared to CTODc from the inverse analysis which had a value of 0.075 mm. In addition, the CMODc value from the experimental observation was recorded as 0.123 mm (see Table 4), which was slightly higher compared to the DIC method, which gave a value of 0.120 mm (Figure 6f).

3. Finite Element Study

In this study, the XFEM and CZM were adopted to perform strength prediction and crack propagation at an ultimate load, which will be described in the following section. The ABAQUS software was utilized to conduct the FEM. Furthermore, a 2D-deformable plain strain was adopted in this study by considering the computational effort, time, and accuracy. Table 5 describes the materials (elastic modulus (E), Poisson’s ratio (v), un-notched strength (σ0), and fracture energy mode I (GI)) and geometry properties of the foamed concrete beam used in FEA Modeling. On the other hand, Figure 7 illustrates the XFEM and CZM implementation areas (red zone) within the notched concrete beam, while Table 6 shows details of the elements, nodes, and integration point finite elements for each model.

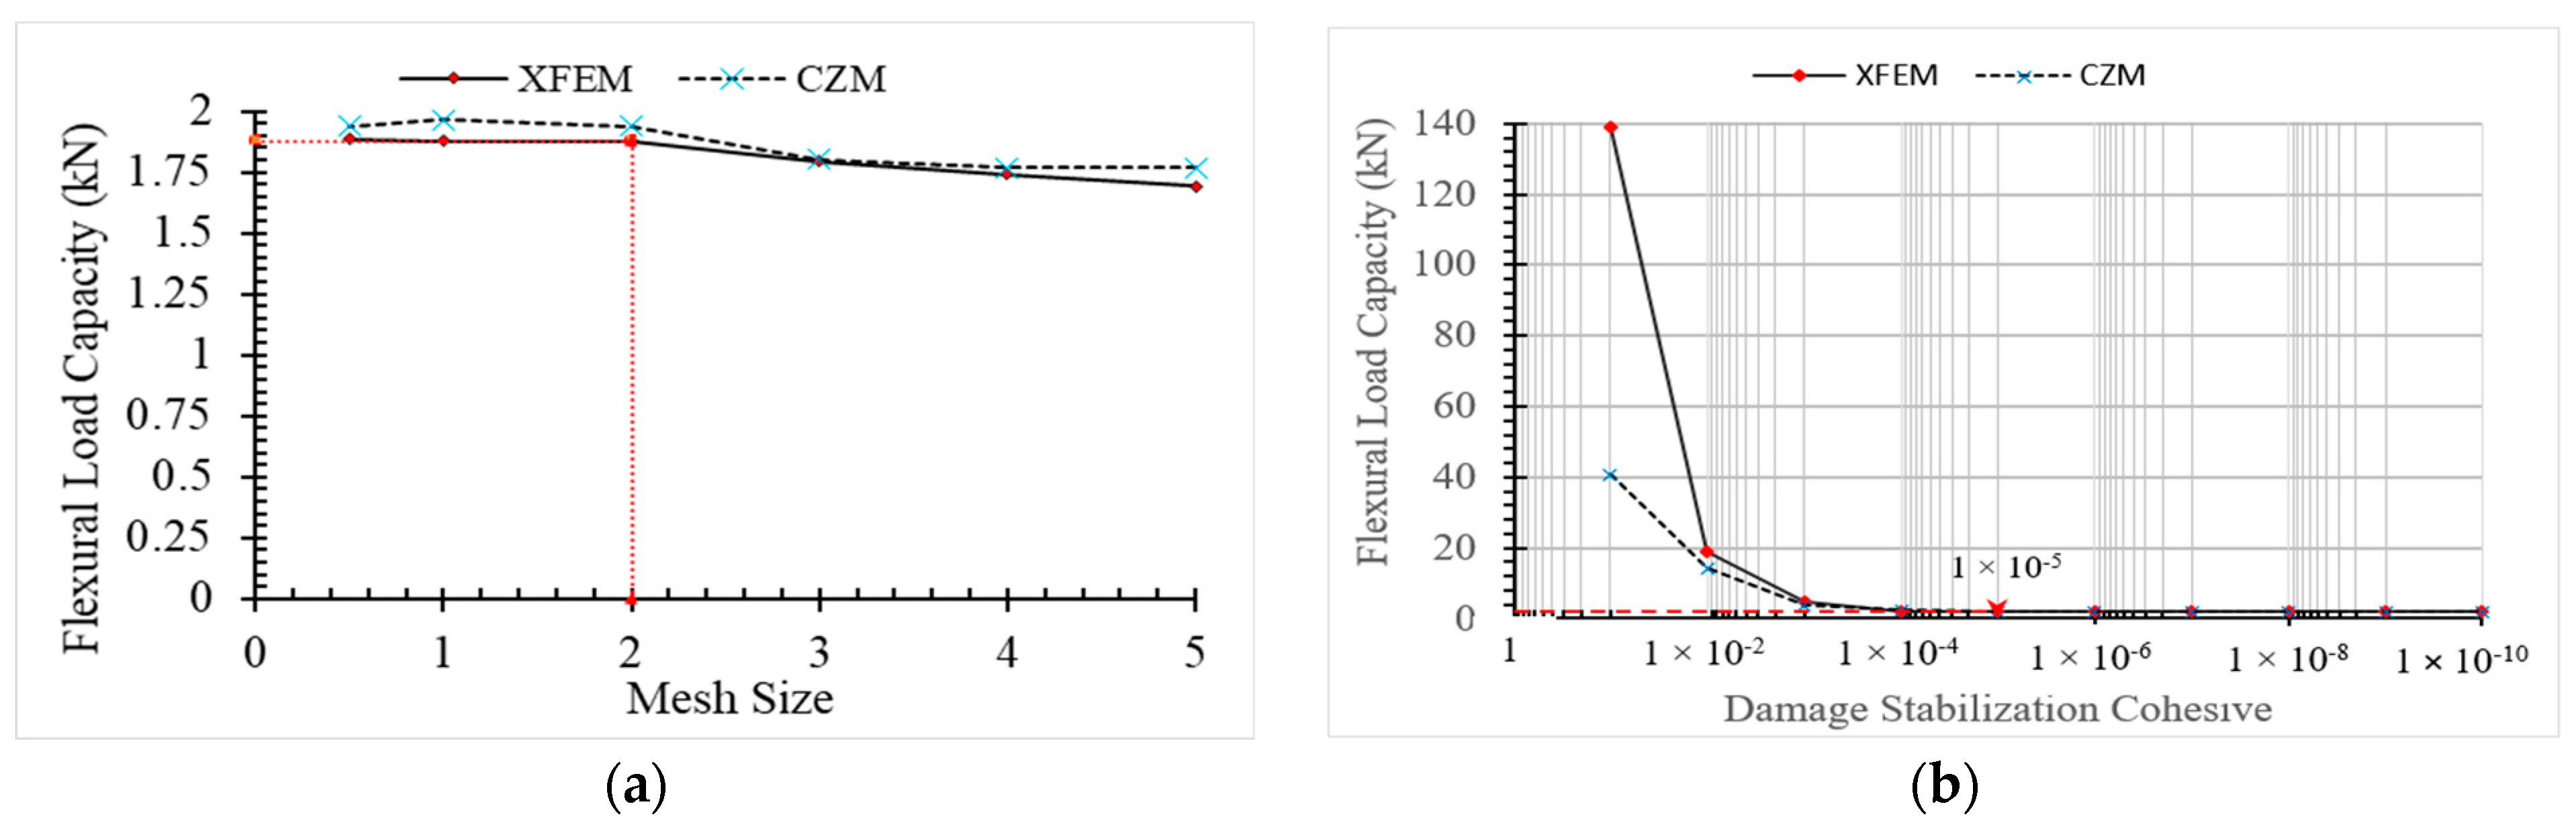
3.1. Sensitivity Study
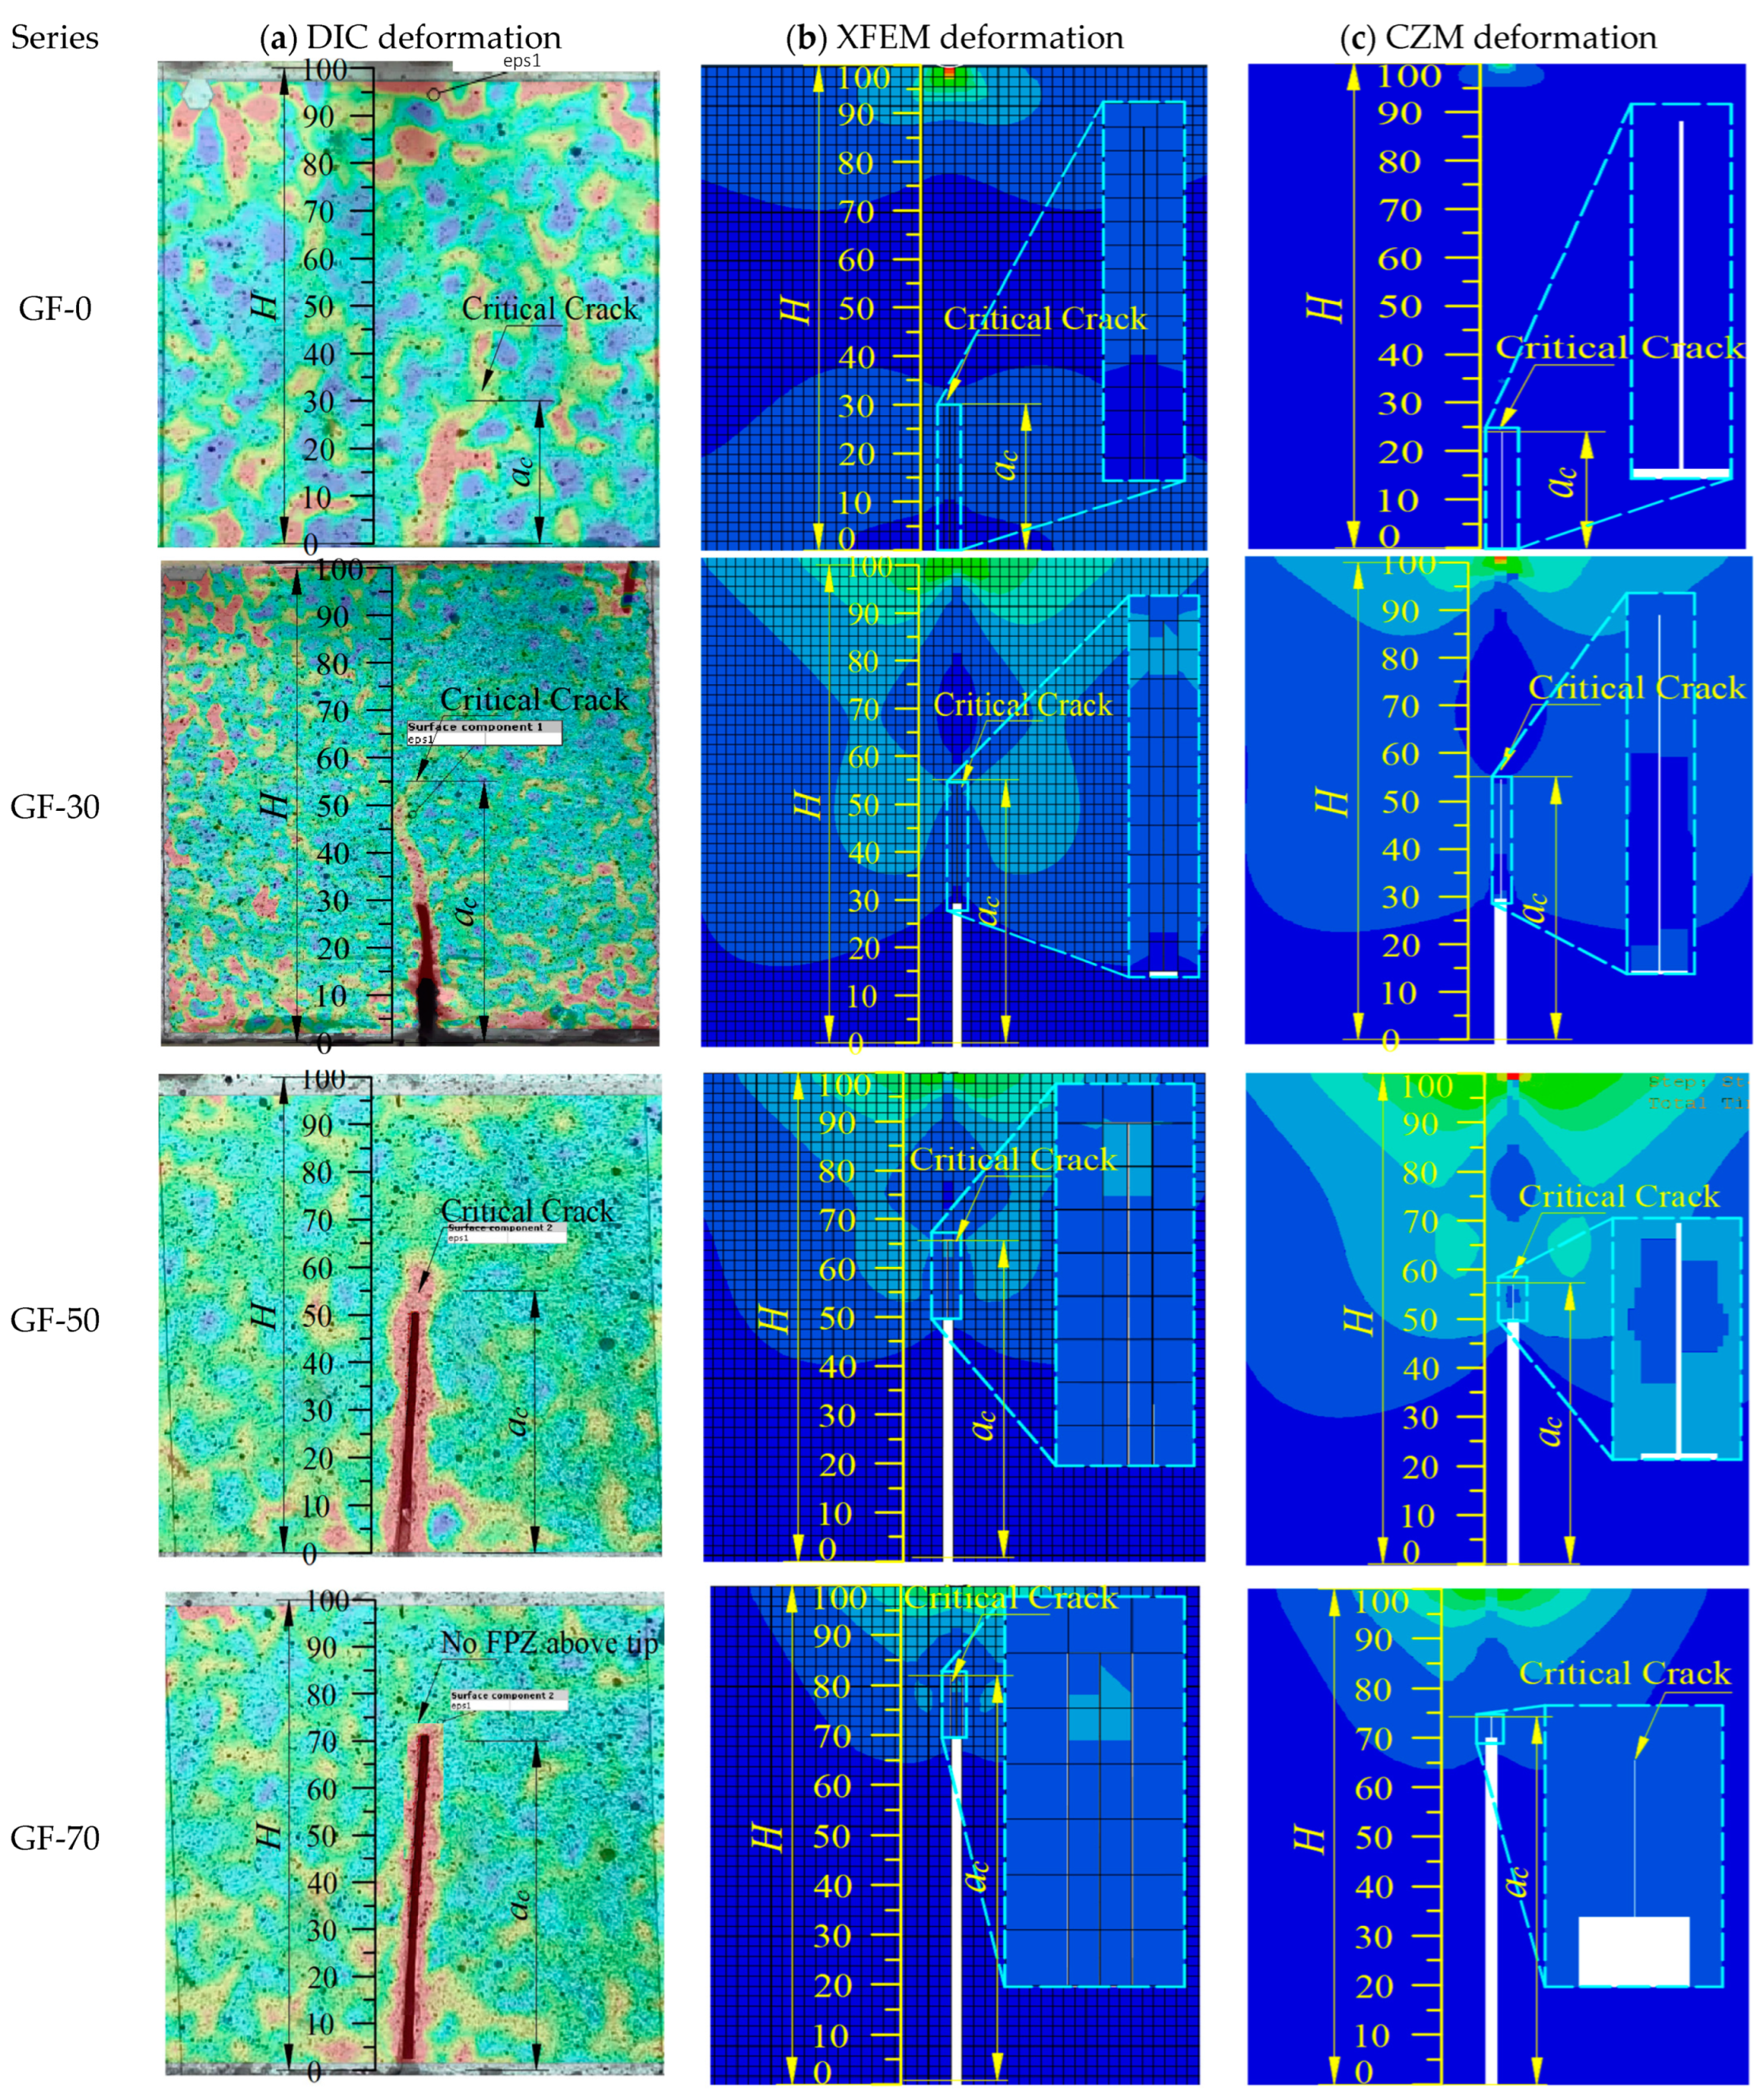
Sensitivity analysis was conducted to evaluate the effects of mesh and damage stabilization-cohesive dependence on FEA Modeling. Munjiza et al. [44] stated that the size of a finite element near the crack tip must be smaller than the actual plastic zone size. Nevertheless, the shell-based formulation within this study was modeled using a four-noded shell element named CPE4R. More & Bindu [45] stated that an FE model with a larger mesh might lead to less accurate results but a faster computational time; a finer mesh would yield high accuracy but take more computational effort. Therefore, the global mesh size ranged from coarse to a fine mesh size (i.e., mesh density 5 to 0.5) in this study. Figure 8 shows the global mesh size 2 and damage stabilization cohesive with a value of 1 × 10⁻⁵. The model showed good consistency at the ultimate load for both the the XFEM and CZM methods. Similar findings with global mesh size 2 were also reported by [46], while investigations by [47,48,49] involved global meshes with sizes of 0.01 mm, 0.125 mm, and between 0.5–1 mm, respectively. Meanwhile, a damage stabilization cohesive with a value of 1 × 10⁻⁵ was also reported in [28,50,51].

3.2. Damage Plot

Figure 9 depicts a schematic damage plot of each stage of damage from the beginning until it completely failed. During Stage 1, the crack started to initiate after reaching the maximum principal tensile stress of the material as depicted in Figure 9a. Nevertheless, compared to the crack initiation exhibited in the experiment, the FEM results indicated propagation at a lower load. The crack was propagated until Stage 2 by increasing the load until the ultimate load was reached. At this stage, the length of the crack was named as a critical crack (see Figure 9b). However, the FEM results were shorter compared to the experimental (DIC observation) or inverse analysis. In Stage 3 (Figure 9c), the beam was under the softening condition and the crack remained propagated until the beam was fully separated, as shown in Stage 4 (Figure 9d). Meanwhile, Table 7 shows the bilinear parameter from the FEM (referred to as a load–CMOD curve in Figure 6). In comparison to the experimental output in Table 3, it was found that the characters within the FEM were unable to fully represent the experimental results. Regarding the critical crack length (ac) at the ultimate load, both experimental (DIC and the FEM) methods showed good agreement (see Figure 10), with the presence of the notch height influencing the height of the critical crack length (known as the fracture process zone at the ultimate load). However, the CZM provided better agreement with the experimental method compared to the XFEM. It is worth highlighting that the LEFM theory adopted within the ABAQUS software is only applicable for materials with relatively small plastic process zones [30], whereas concrete material has a large plastic process zone commonly known as the fracture process zone.
Figure 11 shows the FEM output for both the XFEM and CZM in relation to the load prediction (Figure 11a,b) and opening crack (Figure 11c,d). It can be seen that the XFEM exhibited better load prediction than the CZM (see Table 7). Both the experimental method and the FEM (XFEM and CZM) exhibited a similar trend in tensile strength, in which a higher notch required less material for load resistance due to stress concentration—this was the outcome of the fracture process zone length, which was influenced by the notch height. During softening after reaching the ultimate load, the CZM was more representative of the experimental method than the XFEM in the crack opening. As shown by the kink points (σ1, w1) in Table 7, the CZM was relatively higher (for σ1) and larger (for w1). Nevertheless, both the XFEM and CZM recorded a zero-stress point (w2) in comparison to the experimental method, subsequently indicating a good agreement for the GF-0 and GF-30 series.

4. Conclusions

In this study, three specimens of un-notched beams, normalized notched beams, and cylinders of foamed concrete material were experimentally investigated. All of the methods (DIC, XFEM, and CZM) had good agreement in predicting the critical crack length (ac). However, the use of inverse analysis to predict the critical crack length (ac) was inapplicable with the GF-70 testing series due to the absence of a FPZ. The elastic modulus obtained from the P–CMOD inverse analysis and the conventional method showed good agreement, giving a value of 13 GPa (only with the GF-30 testing series). In terms of softening, a comparison of findings by previous studies on normal concrete indicated that foamed concrete exhibited longer openings in zero-stress points (w2) up to 2 mm. The model showed independence from sensitivity with global mesh size 2 and damage stabilization cohesive with 1 × 10⁻⁵. Fracture toughness for initiation, instability, and cohesiveness was only applicable for materials with a FPZ. Prior to the ultimate load, the traction length (known as the FPZ) increased but later decreased after the ultimate load. Fracture energy (GF) from the Hillerborg model (with a value of 0.015 N/mm) was adopted within the FEM for foamed concrete materials. While the foamed concrete exhibited relatively lower fracture energy than normal concrete, the material has better resistance during fracture in terms of flexibility and zero-stress points (w2).

Author Contributions

Investigation, data curation, writing—original draft, M.R.M., H.A. and S.S. Methodology, writing—review and editing, M.R.M., H.A. and S.S. Conceptualization, funding acquisition, supervision, H.A. All authors have read and agreed to the published version of the manuscript.

Funding

This research was financially supported by the Ministry of Higher Education (MoHE) Malaysia through the Fundamental Research Grant Scheme (FRGS/1/2020/TK01/UTHM/02/4) and also thanks to the Research Management Centre (RMC), University Tun Hussein Onn Malaysia (UTHM) for funding this work under the Postgraduate Research Grant (GPPS) (Research Grant No. H706).

Institutional Review Board Statement

Not applicable.

Informed Consent Statement

Not applicable.

Data Availability Statement

Not applicable.

Acknowledgments

Authors would like to express a sincerely gratitude to Advanced Materials Engineering Laboratory of Faculty Civil Engineering and Built Environment, University Tun Hussein Onn Malaysia (UTHM).

Conflicts of Interest

The authors declare no conflict of interest.

Nomenclature

σ1kink point tensile stress
σ0un-notched strength
Δ a c fictitious crack extension length
a 0 pre-cut crack length
a c the critical crack length
w1kink point CMOD opening
w2zero stress point
a1first softening compliance
a2second softening compliance
b2stress of second softening intercept
C T O D crack tip opening displacement
C T O D c critical crack tip opening displacement
C M O D crack mouth opening displacement
C M O D c critical crack mouth opening displacement
Ciinitial compliance of the P–CMOD curve
Eelastic modulus
fttensile strength
GFfracture energy
GIFracture energy mode I
GF-0specimen without notches
GF-30specimen with a 30-millimeter notch height
GF-50specimen with a 50-millimeter notch height
GF-70specimen with a 70-millimeter notch height
H specimen height
H 0 clip gauge holder thickness
K cracking toughness
K I C i n i initial cracking toughness
K I C u n unstable cracking toughness
Pultultimate load
Piniinitial crack load
vPoisson’s ratio
U0softening area
mgspecimen weight

References

  1. Lee, Y.L.; Tan, C.S.; Lim, S.K.; Mohammad, S.; Lim, J.H. Strength Performance on Different Mix of Cement-Sand Ratio and Sand Condition for Lightweight Foamed Concrete. E3S Web Conf. 2018, 65, 02006. [Google Scholar] [CrossRef] [Green Version]
  2. Gökçe, H.S.; Hatungimana, D.; Ramyar, K. Effect of Fly Ash and Silica Fume on Hardened Properties of Foam Concrete. Constr. Build. Mater. 2019, 194, 1–11. [Google Scholar] [CrossRef]
  3. Ahmad, M.R.; Chen, B.; Farasat Ali Shah, S. Investigate the Influence of Expanded Clay Aggregate and Silica Fume on the Properties of Lightweight Concrete. Constr. Build. Mater. 2019, 220, 253–266. [Google Scholar] [CrossRef]
  4. Wang, X.; Huang, J.; Dai, S.; Ma, B.; Jiang, Q. Investigation of Silica Fume as Foam Cell Stabilizer for Foamed Concrete. Constr. Build. Mater. 2020, 237, 117514. [Google Scholar] [CrossRef]
  5. Hillerborg, A.; Modéer, M.; Petersson, P.E. Analysis of Crack Formation and Crack Growth in Concrete by Means of Fracture Mechanics and Finite Elements. Cem. Concr. Res. 1976, 6, 773–781. [Google Scholar] [CrossRef]
  6. Bažant, Z.P. Size Effect in Blunt Fracture: Concrete, Rock, Metal. J. Eng. Mech. 1984, 110, 518–535. [Google Scholar] [CrossRef]
  7. Bažant, Z.P.; Oh, B.H. Crack Band Theory for Fracture of Concrete. Matériaux Constr. 1983, 16, 155–177. [Google Scholar] [CrossRef] [Green Version]
  8. Nallathambi, P.; Karihaloo, B.L. Determination of Specimen-Size Independent Fracture Toughness of Plain Concrete. Mag. Concr. Res. 1986, 38, 67–76. [Google Scholar] [CrossRef]
  9. Bazant, Z.P.; Kazemi, M.T. Determination of fracture energy, process zone longth and brittleness number from size effect, with application to rock and conerete. Int. J. Fract. 1990, 44, 111–131. [Google Scholar] [CrossRef]
  10. Xu, S.; Reinhardt, H.W. Determination of Double-K Criterion for Crack Propagation in Quasi-brittle fracture, Part II: Experimental investigation of crack propagation. Int. J. Fract. 1999, 98, 111–149. [Google Scholar] [CrossRef]
  11. Rahman, N.A.; Jaini, Z.M. An Experimental Study on the Fracture Energy of Foamed Concrete Using V-Notched Beams. In InCIEC 2014; Springer: Singapore, 2015; pp. 1–13. [Google Scholar] [CrossRef] [Green Version]
  12. Kozłowski, M.; Kadela, M.; Kukiełka, A. Fracture Energy of Foamed Concrete Based on Three-Point Bending Test on Notched Beams. Procedia Eng. 2015, 108, 349–354. [Google Scholar] [CrossRef] [Green Version]
  13. Falliano, D.; De Domenico, D.; Sciarrone, A.; Ricciardi, G.; Restuccia, L.; Tulliani, J.M.C.; Gugliandolo, E. Fracture Behavior of Lightweight Foamed Concrete: The Crucial Role of Curing Conditions. Theor. Appl. Fract. Mech. 2019, 103, 102297. [Google Scholar] [CrossRef]
  14. Xu, P.; Ma, J.; Zhang, M.; Ding, Y.; Meng, L. Fracture Energy Analysis of Concrete Considering the Boundary Effect of Single-Edge Notched Beams. Adv. Civ. Eng. 2018, 2018, 3067236. [Google Scholar] [CrossRef] [Green Version]
  15. Ding, Y.; Bai, Y.; Dai, J.; Shi, C. An Investigation of Softening Laws and Fracture Toughness of Slag-Based Geopolymer Concrete. Materials 2020, 13, 5200. [Google Scholar] [CrossRef] [PubMed]
  16. Bu, J.; Chen, X.; Hu, L.; Yang, H.; Liu, S. Experimental Study on Crack Propagation of Concrete Under Various Loading Rates with Digital Image Correlation Method. Int. J. Concr. Struct. Mater. 2020, 14, 25. [Google Scholar] [CrossRef]
  17. Qing, L.; Su, Y.; Dong, M.; Cheng, Y.; Li, Y. Size effect on double-K fracture parameters of concrete based on fracture extreme theory. Arch. Appl. Mech. 2021, 91, 427–442. [Google Scholar] [CrossRef]
  18. Skarzyński, Ł.; Kozicki, J.; Tejchman, J. Application of DIC Technique to Concrete-Study on Objectivity of Measured Surface Displacements. Exp. Mech. 2013, 53, 1545–1559. [Google Scholar] [CrossRef]
  19. Ohno, K.; Uji, K.; Ueno, A.; Ohtsu, M. Fracture Process Zone in Notched Concrete Beam under Three-Point Bending by Acoustic Emission. Constr. Build. Mater. 2014, 67, 139–145. [Google Scholar] [CrossRef]
  20. Alam, S.Y.; Saliba, J.; Loukili, A. Fracture Examination in Concrete through Combined Digital Image Correlation and Acoustic Emission Techniques. Constr. Build. Mater. 2014, 69, 232–242. [Google Scholar] [CrossRef] [Green Version]
  21. Wu, Z.M.; Rong, H.; Zheng, J.J.; Xu, F.; Dong, W. An Experimental Investigation on the FPZ Properties in Concrete Using Digital Image Correlation Technique. Eng. Fract. Mech. 2011, 78, 2978–2990. [Google Scholar] [CrossRef]
  22. Park, K.; Choi, H.; Paulino, G.H. Assessment of Cohesive Traction-Separation Relationships in ABAQUS: A Comparative Study. Mech. Res. Commun. 2016, 78, 71–78. [Google Scholar] [CrossRef] [Green Version]
  23. Elices, M.; Guinea, G.V.; Gómez, J.; Planas, J. The cohesive zone model: Advantages, limitations and challenges. Eng. Fract. Mech. 2001, 69, 137–163. [Google Scholar] [CrossRef]
  24. Freed, Y.; Banks-Sills, L. A New Cohesive Zone Model for Mixed Mode Interface Fracture in Bimaterials. Eng. Fract. Mech. 2008, 75, 4583–4593. [Google Scholar] [CrossRef]
  25. McGarry, J.P.; Ó Máirtín, É.; Parry, G.; Beltz, G.E. Potential-based and non-potential-based cohesive zone formulations under mixed-mode separation and over-closure. Part I: Theoretical analysis. J. Mech. Phys. Solids 2014, 63, 336–362. [Google Scholar] [CrossRef] [Green Version]
  26. Faron, A.; Rombach, G.A. Simulation of Crack Growth in Reinforced Concrete Beams Using Extended Finite Element Method. Eng. Fail. Anal. 2020, 116, 104698. [Google Scholar] [CrossRef]
  27. Campilho, R.D.S.G.; Banea, M.D.; Neto, J.A.B.P.; Da Silva, L.F.M. Modelling adhesive joints with cohesive zone models: Effect of the cohesive law shape of the adhesive layer. Int. J. Adhes. Adhes. 2013, 44, 48–56. [Google Scholar] [CrossRef] [Green Version]
  28. Yu, Z.; Zhang, J.; Shen, J.; Chen, H. Simulation of Crack Propagation Behavior of Nuclear Graphite by Using XFEM, VCCT and CZM Methods. Nucl. Mater. Energy 2021, 29, 101063. [Google Scholar] [CrossRef]
  29. Ahmad, H.; Sugiman, S.; Jaini, Z.M.; Omar, A.Z. Numerical Modelling of Foamed Concrete Beam under Flexural Using Traction-Separation Relationship. Lat. Am. J. Solids Struct. 2021, 18, 1–13. [Google Scholar] [CrossRef]
  30. Park, K.; Paulino, G.H.; Roesler, J.R. Determination of the Kink Point in the Bilinear Softening Model for Concrete. Eng. Fract. Mech. 2008, 75, 3806–3818. [Google Scholar] [CrossRef]
  31. Petersson, P.E. Crack Growth and Development of Fracture Zones in Plain Concrete and Similar Materials. Ph.D. Thesis, Lund University, Lund, Sweden, 1981. [Google Scholar]
  32. Wittmann, F.H.; Rokugo, K.; Brühwiler, E.; Mihashi, H.; Simonin, P. Fracture Energy and Strain Softening of Concrete as Determined by Means of Compact Tension Specimens. Mater. Struct. 1988, 21, 21–32. [Google Scholar] [CrossRef]
  33. Hu, S.; Fan, B. Study on the Bilinear Softening Mode and Fracture Parameters of Concrete in Low Temperature Environments. Eng. Fract. Mech. 2019, 211, 1–16. [Google Scholar] [CrossRef]
  34. Roelfstra, P.E.; Wittmann, F. Numerical Method to Link Strain Softening with Failure of Concrete. In Fracture Toughness and Fracture Energy of Concrete; Elsevier Science Publishers: Amsterdam, The Netherlands, 1986; pp. 163–175. [Google Scholar]
  35. Kumar, S.; Barai, S.V. Effect of loading condition, specimen geometry, size-effect and softening function on double-K fracture parameters of concrete. Sadhana-Acad. Proc. Eng. Sci. 2012, 37, 3–15. [Google Scholar] [CrossRef] [Green Version]
  36. Zhang, X.; Xu, S.; Zheng, S. Experimental measurement of double-K fracture parameters of concrete with small-size aggregates. Front. Archit. Civ. Eng. China 2007, 1, 448–457. [Google Scholar] [CrossRef]
  37. Yu, K.; Lu, Z. Determining residual double-K fracture toughness of post-fire concrete using analytical and weight function method. Mater. Struct./Mater. Constr. 2014, 47, 839–852. [Google Scholar] [CrossRef]
  38. Kumar, S.; Barai, S.V. Influence of specimen geometry on determination of double-K fracture parameters of concrete: A comparative study. Int. J. Fract. 2008, 149, 47–66. [Google Scholar] [CrossRef]
  39. ASTM-C78-02; Standard Test Method for Flexural Strength of Concrete (Using Simple Beam with Third-Point Loading) 1. ASTM International: West Conshohocken, PA, USA, 2002.
  40. JCI-S-001.2003; Method of Test for Fracture Energy of Concrete by Use of Notched Beam. Japan Concrete Institute Standard: Tokyo, Japan, 2003.
  41. ASTM C469-02; Standard Test Method for Static Modulus of Elasticity and Poisson’s Ratio of Concrete in Compression. ASTM International: West Conshohocken, PA, USA, 2002.
  42. Bažant, Z.P. Concrete Fracture Models: Testing and Practice. Eng. Fract. Mech. 2002, 69, 165–205. [Google Scholar] [CrossRef]
  43. Hillerborg, A. The Theoretical Basis of a Method to Determine the Fracture Energy GF of Concrete. Mater. Struct. 1985, 21, 162. [Google Scholar] [CrossRef]
  44. Munjiza, A.; John, N.W.M. Mesh Size Sensitivity of the Combined FEM/DEM Fracture and Fragmentation Algorithms. Eng. Fract. Mech. 2001, 69, 281–295. [Google Scholar] [CrossRef]
  45. More, S.T.; Bindu, R.S. Effect of Mesh Size on Finite Element Analysis of Plate Structure. Int. J. Eng. Sci. Innov. Technol. 2015, 4, 181–185. [Google Scholar]
  46. Maulana, M.R.; Sugiman, S.; Ahmad, H.; Jaini, Z.M.; Mansor, H. XFEM Modelling and Experimental Observations of Foam Concrete Beam Externally-Bonded with KFRP Sheet. Lat. Am. J. Solids Struct. 2022, 19, 1–12. [Google Scholar] [CrossRef]
  47. Shen, W.; Liang, G.; Lei, J.; Li, C. Thin-Walled Structures Singular Intensity Factor Method to Estimate Notch Stress and N-SIF in Double Edge V-Notched Plate. Thin-Walled Struct. 2021, 169, 108387. [Google Scholar] [CrossRef]
  48. Ye, J.; Gong, Y.; Tao, J.; Cao, T.; Zhao, L.; Zhang, J.; Hu, N. Efficiently Determining the R-Curve and Bridging Traction-Separation Relation of Mode I Delamination in a Simple Way. Compos. Struct. 2022, 288, 115388. [Google Scholar] [CrossRef]
  49. Koslan, M.F.S.; Zaidi, A.M.A.; Othman, M.Z.; Abdullah, S.; Thanakodi, S. The Effect of Mesh Sizing toward Deformation Result in Computational Dynamic Simulation for Blast Loading Application. Mod. Appl. Sci. 2013, 7, 23–28. [Google Scholar] [CrossRef] [Green Version]
  50. Supar, K.; Ahmad, H. Multi-Holes Configurations of Woven Fabric Kenaf Composite Plates: Experimental Works and 2-D Modelling. J. Mech. Eng. Sci. 2018, 12, 3539–3547. [Google Scholar] [CrossRef]
  51. Ahmad, H.; Crocombe, A.D.; Smith, P.A. Strength prediction in CFRP woven laminate bolted double-lap joints under quasi-static loading using XFEM. Compos. Part A Appl. Sci. Manuf. 2014, 56, 192–202. [Google Scholar] [CrossRef] [Green Version]
Figure 1. (a) Cohesive softening stress distribution at the maximum applied load, (b) traction-free crack near the tip, (c) bilinear stress crack opening relationship.
Constrmater 03 00019 g001
Figure 2. Fabrication of the foamed concrete and density checking of each stage.
Constrmater 03 00019 g002
Figure 3. (a) Un-notched beam, (b) notched beam, (c) cylinder of foamed concrete, and (d) UTM testing.
Constrmater 03 00019 g003
Figure 4. Schematic test of (a) the un-notched beam, (b) notched beam (with GF-30), and (c) cylinder of foamed concrete.
Constrmater 03 00019 g004
Figure 5. (a,c) Bilinear softening law and (b,d) P–d curve within 3PBT.
Constrmater 03 00019 g005
Figure 6. Deformation observation using DIC (with testing series GF-30). (a) DIC deformation at initial, (b) DIC deformation at ultimate, (c) DIC deformation at SF1, (d) DIC deformation at SF2, (e) opening notch distance at initial, (f) opening notch distance at ultimate, (g) opening notch distance at SF1, (h) opening notch distance at SF2.
Constrmater 03 00019 g006aConstrmater 03 00019 g006b
Figure 7. Schematic and implementation of XFEM and CZM in FEM.
Constrmater 03 00019 g007
Figure 8. Sensitivity study on (a) global mesh size, (b) damage stabilization cohesive.
Constrmater 03 00019 g008
Figure 9. Damage during (a) Stage 1, (b) Stage 2, (c) Stage 3, (d) Stage 4, (e) Load–displacement plot, and (f) tensile–CMOD plot.
Constrmater 03 00019 g009
Figure 10. Critical crack at ultimate load between (a) DIC deformation, (b) XFEM deformation, and (c) CZM deformation of all series.
Constrmater 03 00019 g010
Figure 11. Load–displacement (a) XFEM, (b) CZM, and tensile strength (c) XFEM, (d) CZM.
Constrmater 03 00019 g011
Table 1. Mix design of foamed concrete for 1 m3.
Binder (kg/m3)Sand (kg/m3)SP
(kg/m3)
Water
(kg/m3)
Foam (liter/m3)f’c
(MPa)
CementSF
1043.9154.94366.2810.99461.5210542.3
Table 2. Testing series of each specimen.
Testing SeriesDimension (mm)
(l × b × h)
Notch Height (mm)StandardSpeed Rate
Control400 × 100 × 100Un-notchedASTM-C78-02 [39]0.5 mm/min
GF-0400 × 100 × 1000JCI-S-001 [40]0.1 mm/min
GF-3030
GF-5050
GF-7070
ED150 × 300-ASTM C469-02 [41]3 kN/sec
Table 3. Parameters of the bilinear softening curve for the experimental observation.
Testing
Series
Pini
(kN)
Pult
(kN)
ft
(MPa)
σ1
(MPa)
w1
(mm)
w2
(mm)
a1
(mm−1)
a2
(mm−1)
b2
(MPa)
GF-03.3334.1012.1530.3800.8202.2502.6230.2140.550
±0.075±0.089±0.105±0.034±0.098±0.052±0.398±0.025±0.104
GF-301.3841.7521.8770.3170.6502.0002.6120.2400.433
±0.135±0.142±0.159±0.057±0.153±0.288±0.398±0.038±0.088
GF-500.5950.7861.6500.2700.7002.3102.1180.1870.350
±0.075±0.052±0.095±0.045±0.115±0.288±0.086±0.045±0.093
GF-700.2440.2541.3030.2700.6702.2032.0820.2000.345
±0.021±0.015±0.058±0.031±0.124±0.288±0.152±0.018±0.101
Table 4. Characterization of foamed concrete.
Testing
Series
a c
(mm)
Enotched beam
(GPa)
Ecylinder
(GPa)
K I C (MPa mm0.5) C M O D c
(mm)
C T O D c
(mm)
GF
(N/mm)
K I C i n i K I C u n K I C C
GF-030.213 13.10.42620.55720.1310.1780.1780.016
±1.145±0.135±0.847±2.175±1.231±0.011±0.011±0.002
GF-3054.45913.26.90723.18616.2780.1230.0750.015
±2.288±0.231±1.172±4.212±3.210±0.015±0.009±0.001
GF-5062.7162.363±1.3534.8756.9632.0880.1490.0240.014
±1.145±0.135±0.847±2.175±1.231±0.011±0.011±0.003
GF-70-−0.0183.697--0.157-0.014
±0.000±0.000±0.746±0.001±0.231±0.005±0.000±0.002
Table 5. Materials and geometry properties.
E
(GPa)
vσ0
(MPa)
GI
(N/mm)
TSL
13.00.281.6520.015MaxPS
Table 6. Elements, nodes, and integration points of the FEM models.
Testing SeriesFEM XFEM Number ofFEM CZM Number of
ElementsNodesIntegration PointsElementsNodesIntegration Points
GF-010,30210,050410,10010,4044
GF-3010,13510,404410,17010,4764
GF-5010,12510,404410,15010,4564
GF-7010,11510,404410,13010,4364
Table 7. Parameter of the bilinear softening curve for FEM.
SeriesTSLPini
(kN)
Pult
(kN)
ft
(MPa)
σ1
(MPa)
w1
(mm)
w2
(mm)
a1
(mm−1)
a2
(mm−1)
b2
(MPa)
GF-0XFEM2.5633.9742.0860.2300.0702.21733.0300.4240.250
CZM2.9854.9282.5870.3500.1502.27415.8300.4670.500
GF-30XFEM0.9381.8321.9630.2200.0802.21522.9560.3500.241
CZM1.1252.4552.3380.2500.1402.34133.9730.4520.300
GF-50XFEM0.5520.9451.9850.2100.0901.65921.5620.3250.236
CZM0.5891.0402.1850.2400.1302.54722.8670.4410.280
GF-70XFEM0.2150.3301.9280.2000.1901.34821.7950.3750.268
CZM0.2580.3402.1660.2350.1602.94222.2070.4100.410
Disclaimer/Publisher’s Note: The statements, opinions and data contained in all publications are solely those of the individual author(s) and contributor(s) and not of MDPI and/or the editor(s). MDPI and/or the editor(s) disclaim responsibility for any injury to people or property resulting from any ideas, methods, instructions or products referred to in the content.

