Influence of Weather, Soil Variability, and Vegetation on Seasonal Ground Movement: A Field Study


Abstract
:1. Introduction
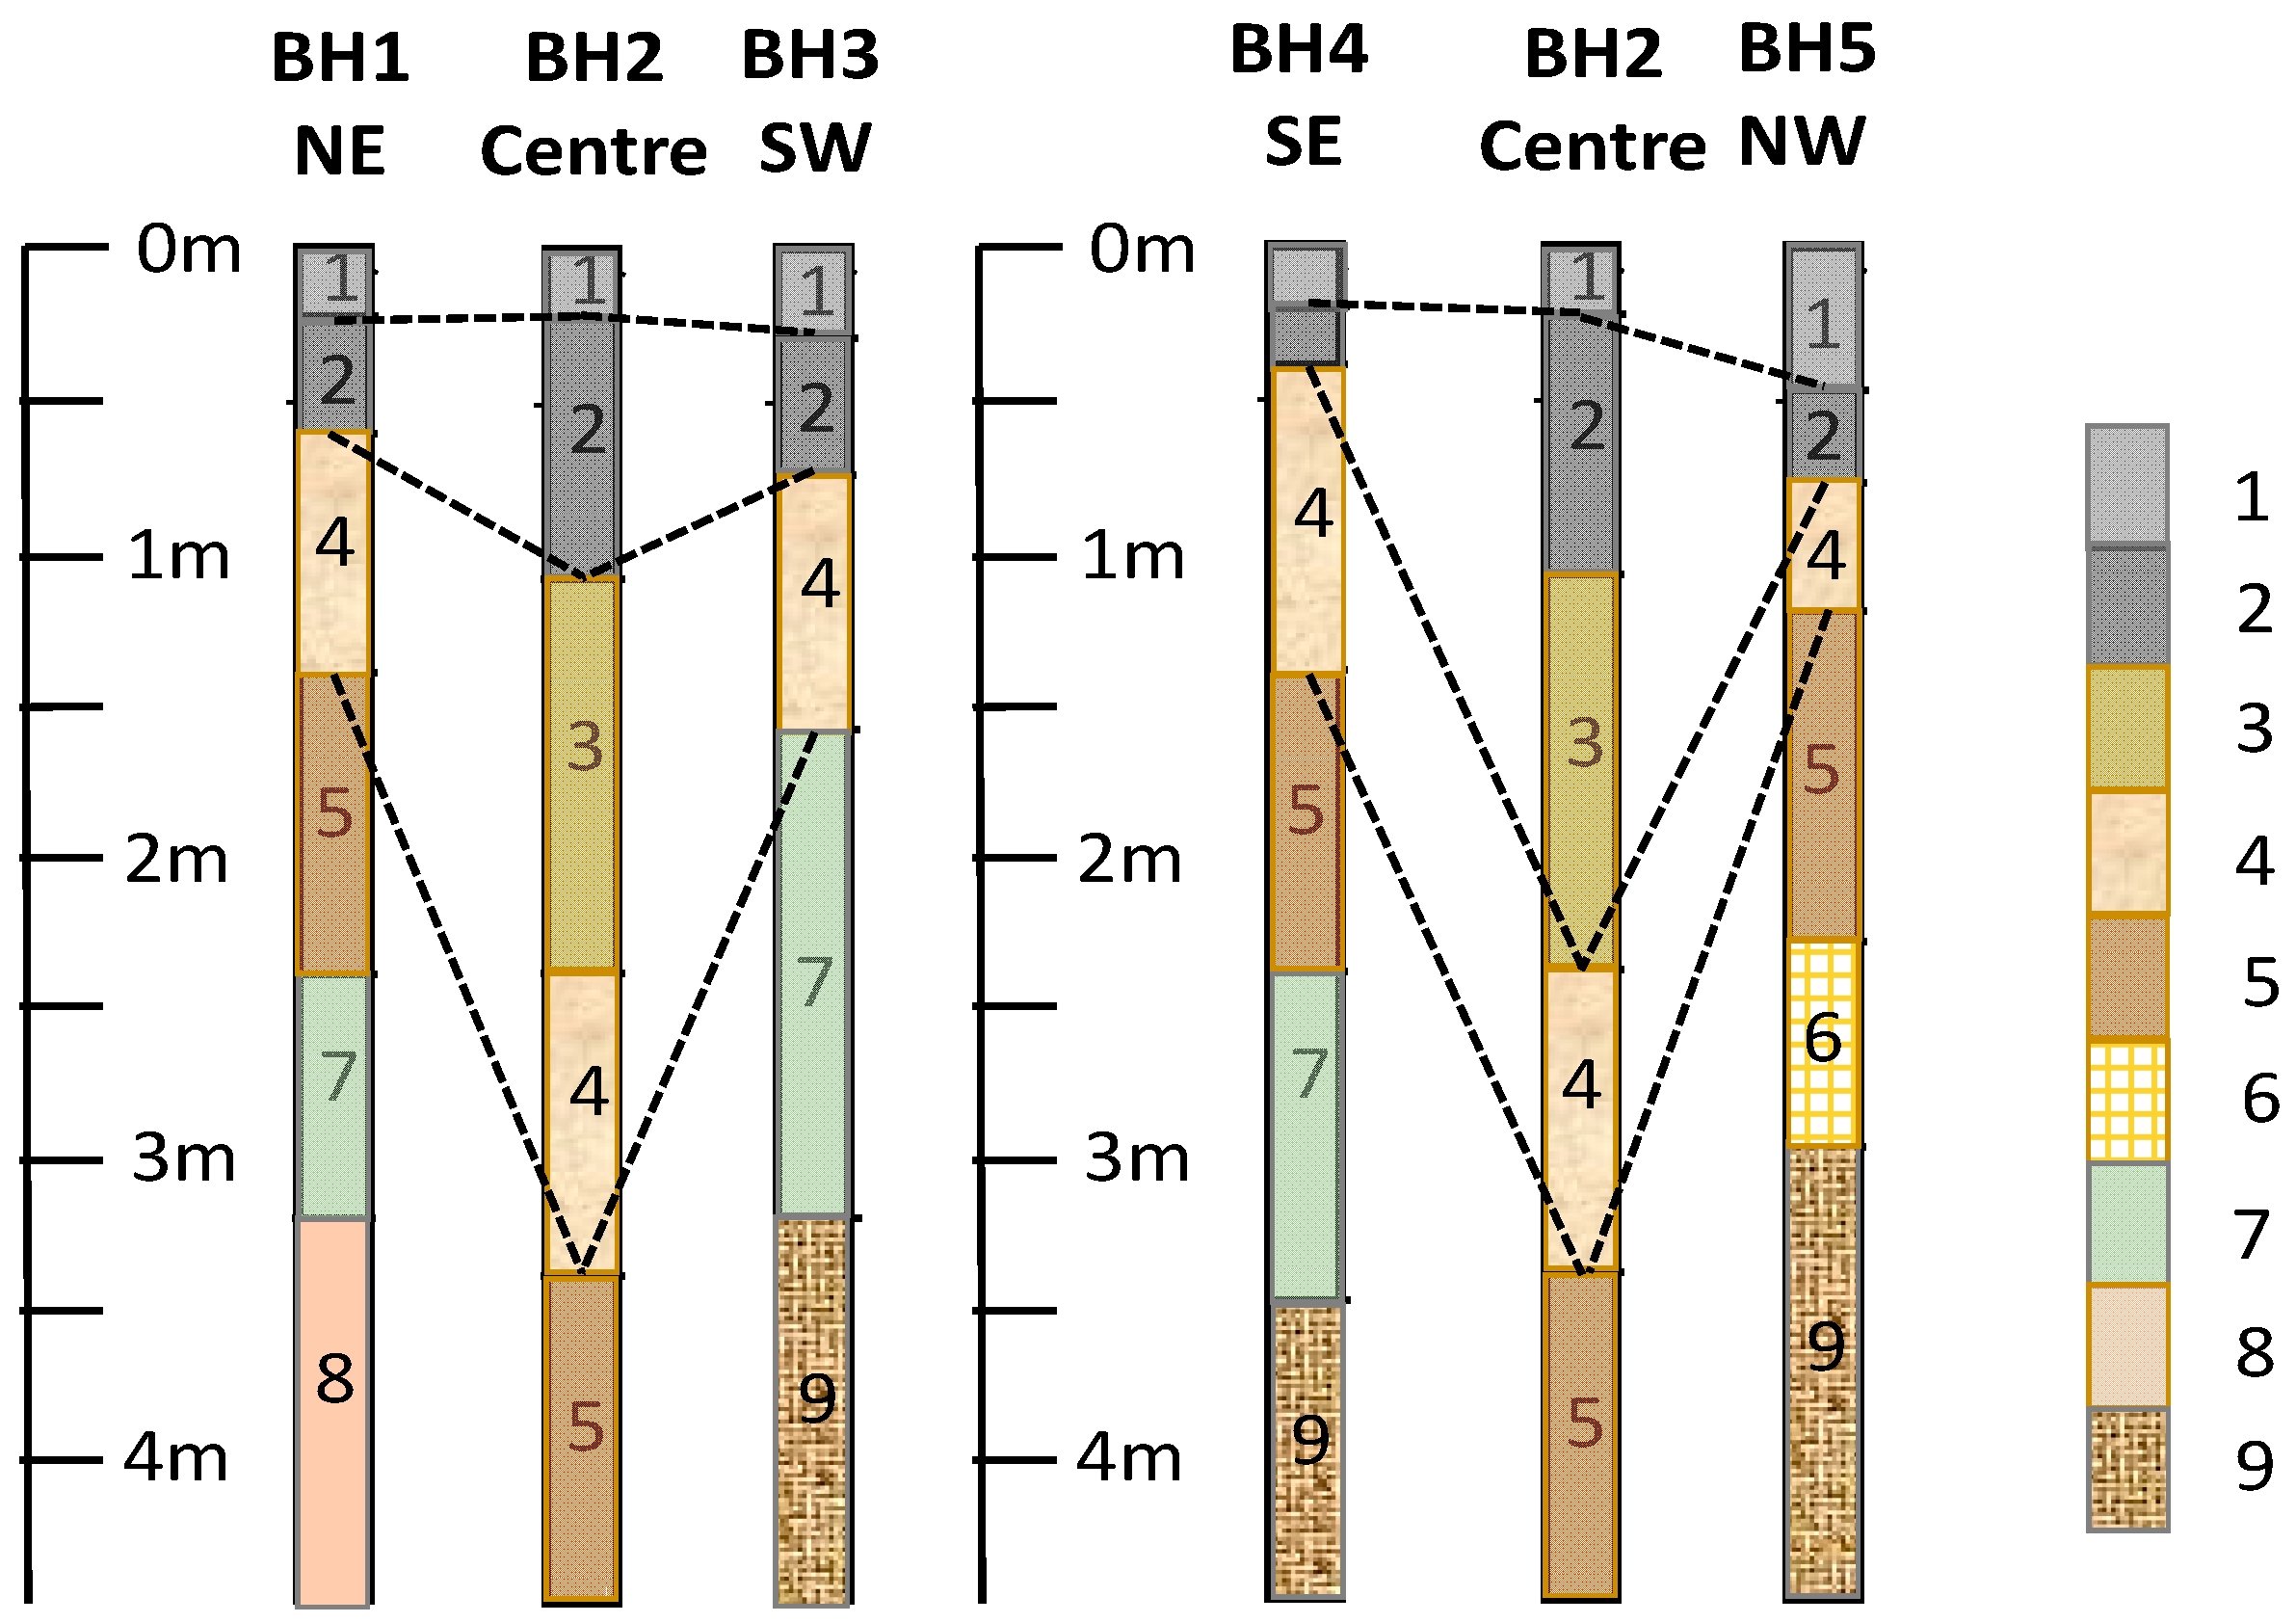
2. Site Description

3. Laboratory Investigation
3.1. Atterberg Limits
3.2. Shrink Swell Indices
3.3. Soil Salinity and Osmotic Suction
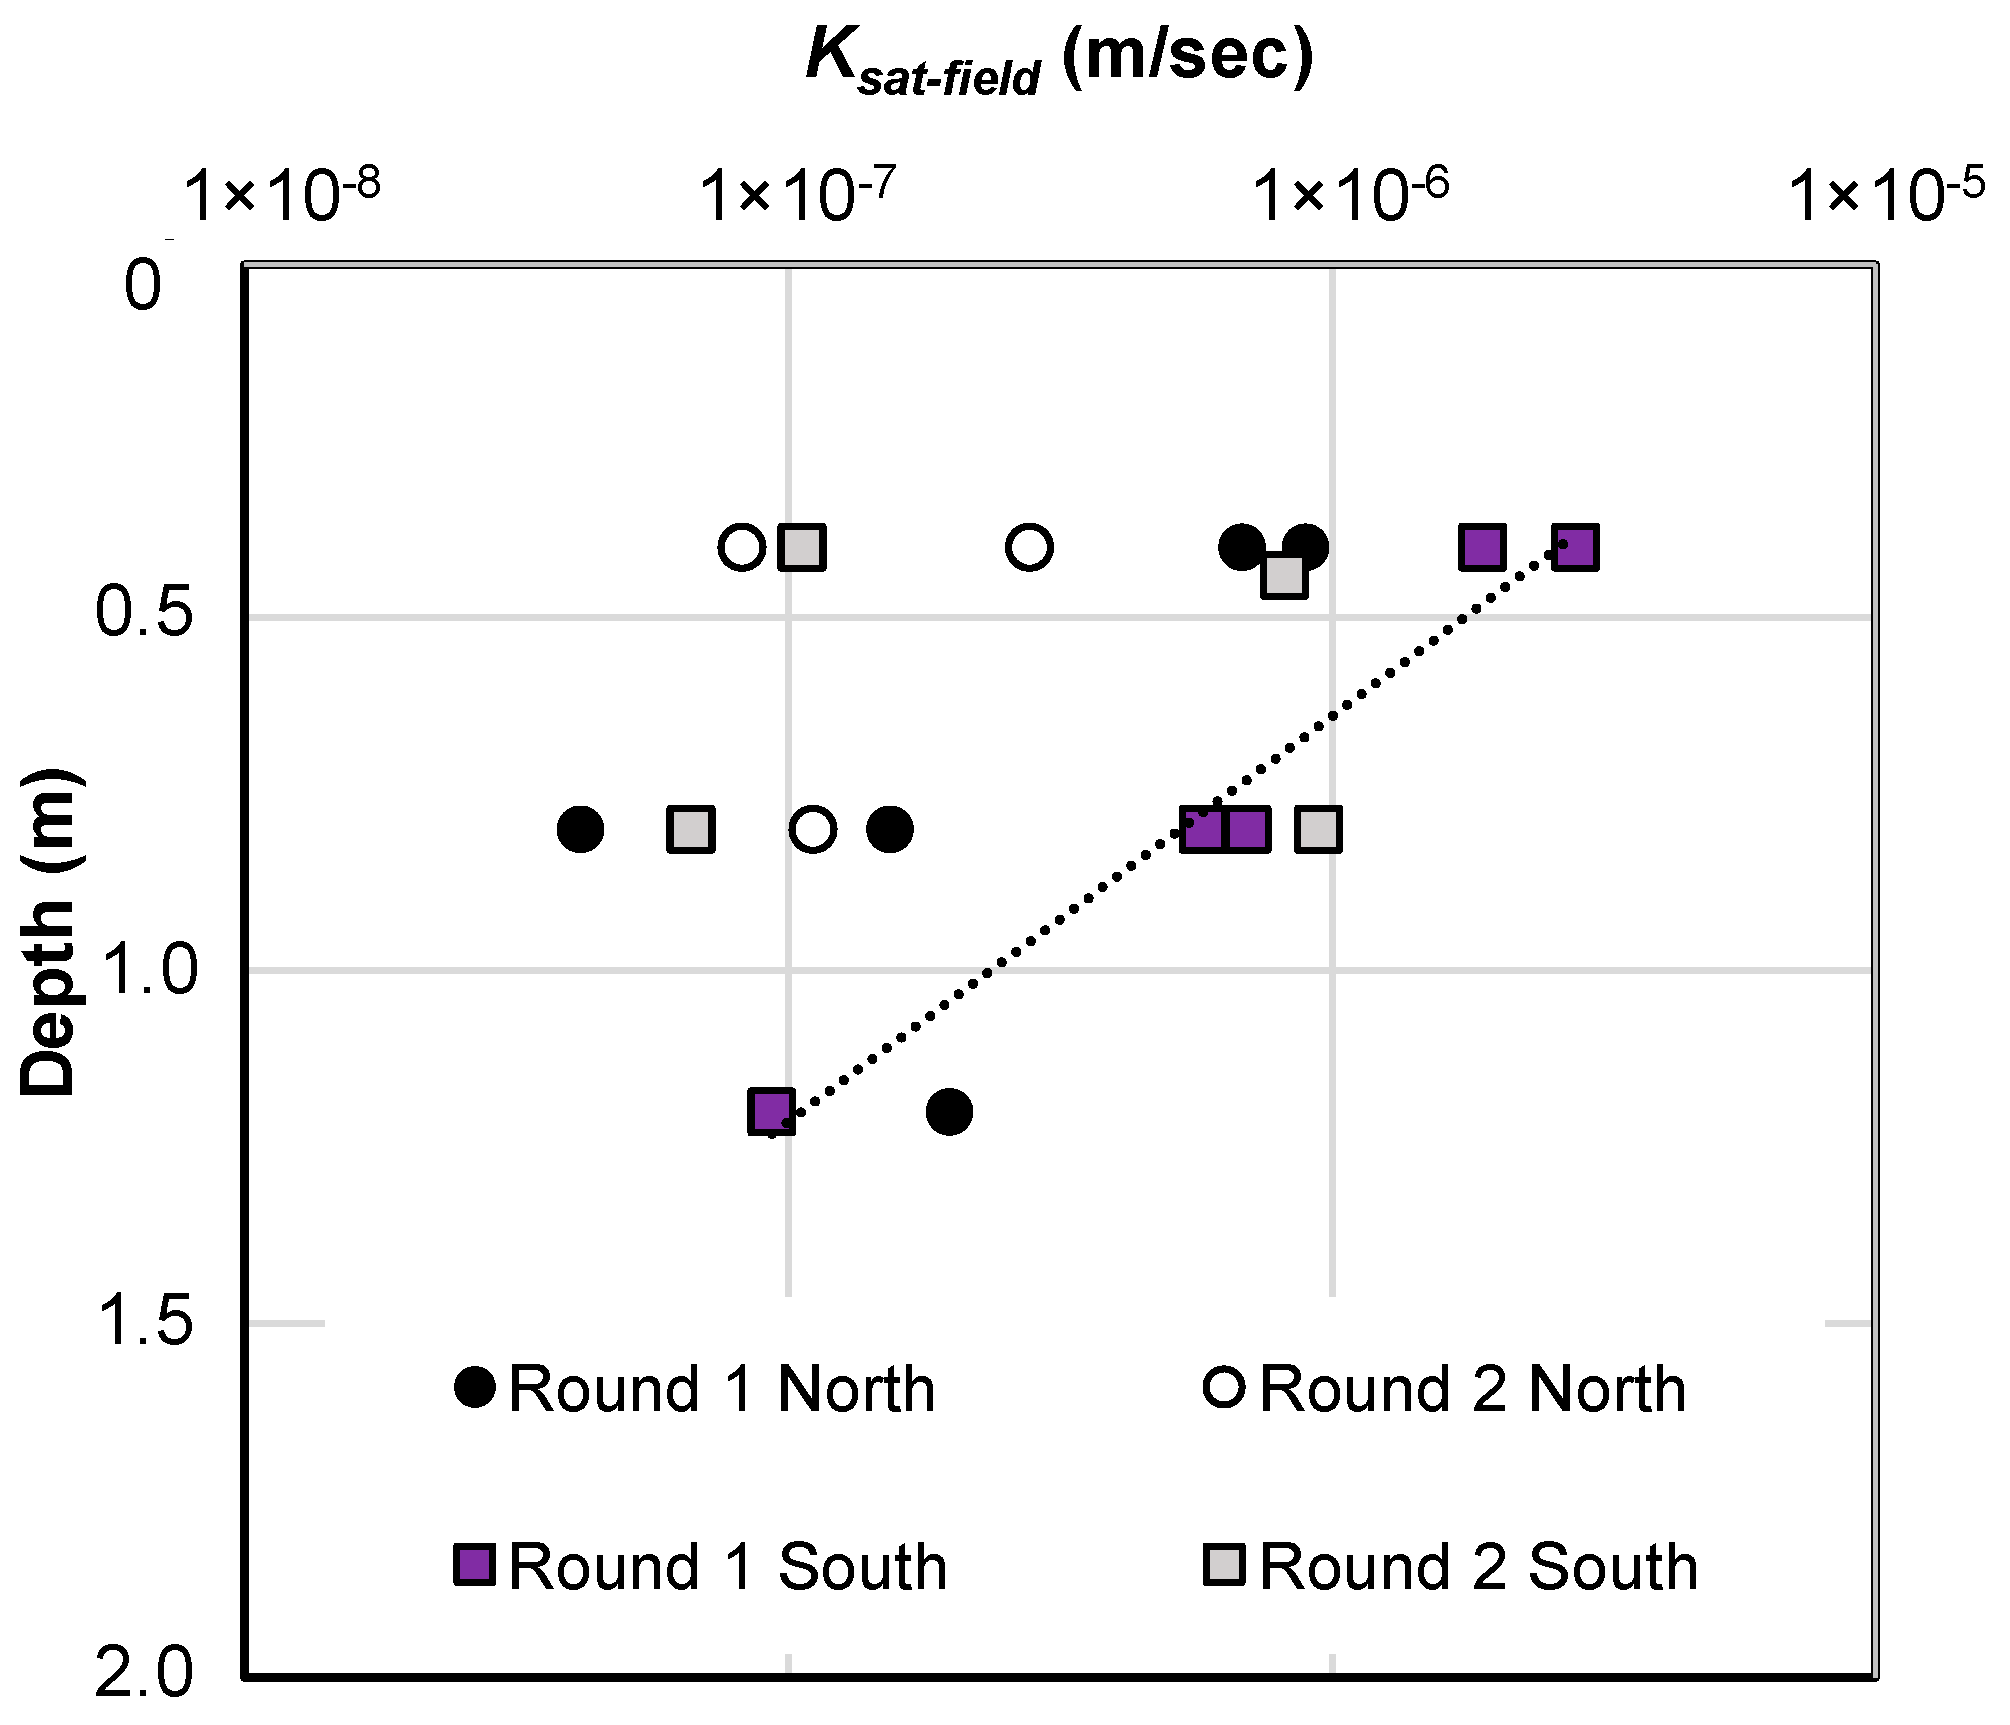
3.4. Hydraulic Conductivity
4. Atmospheric Boundary, Vegetation, Suction Change and Ground Movement
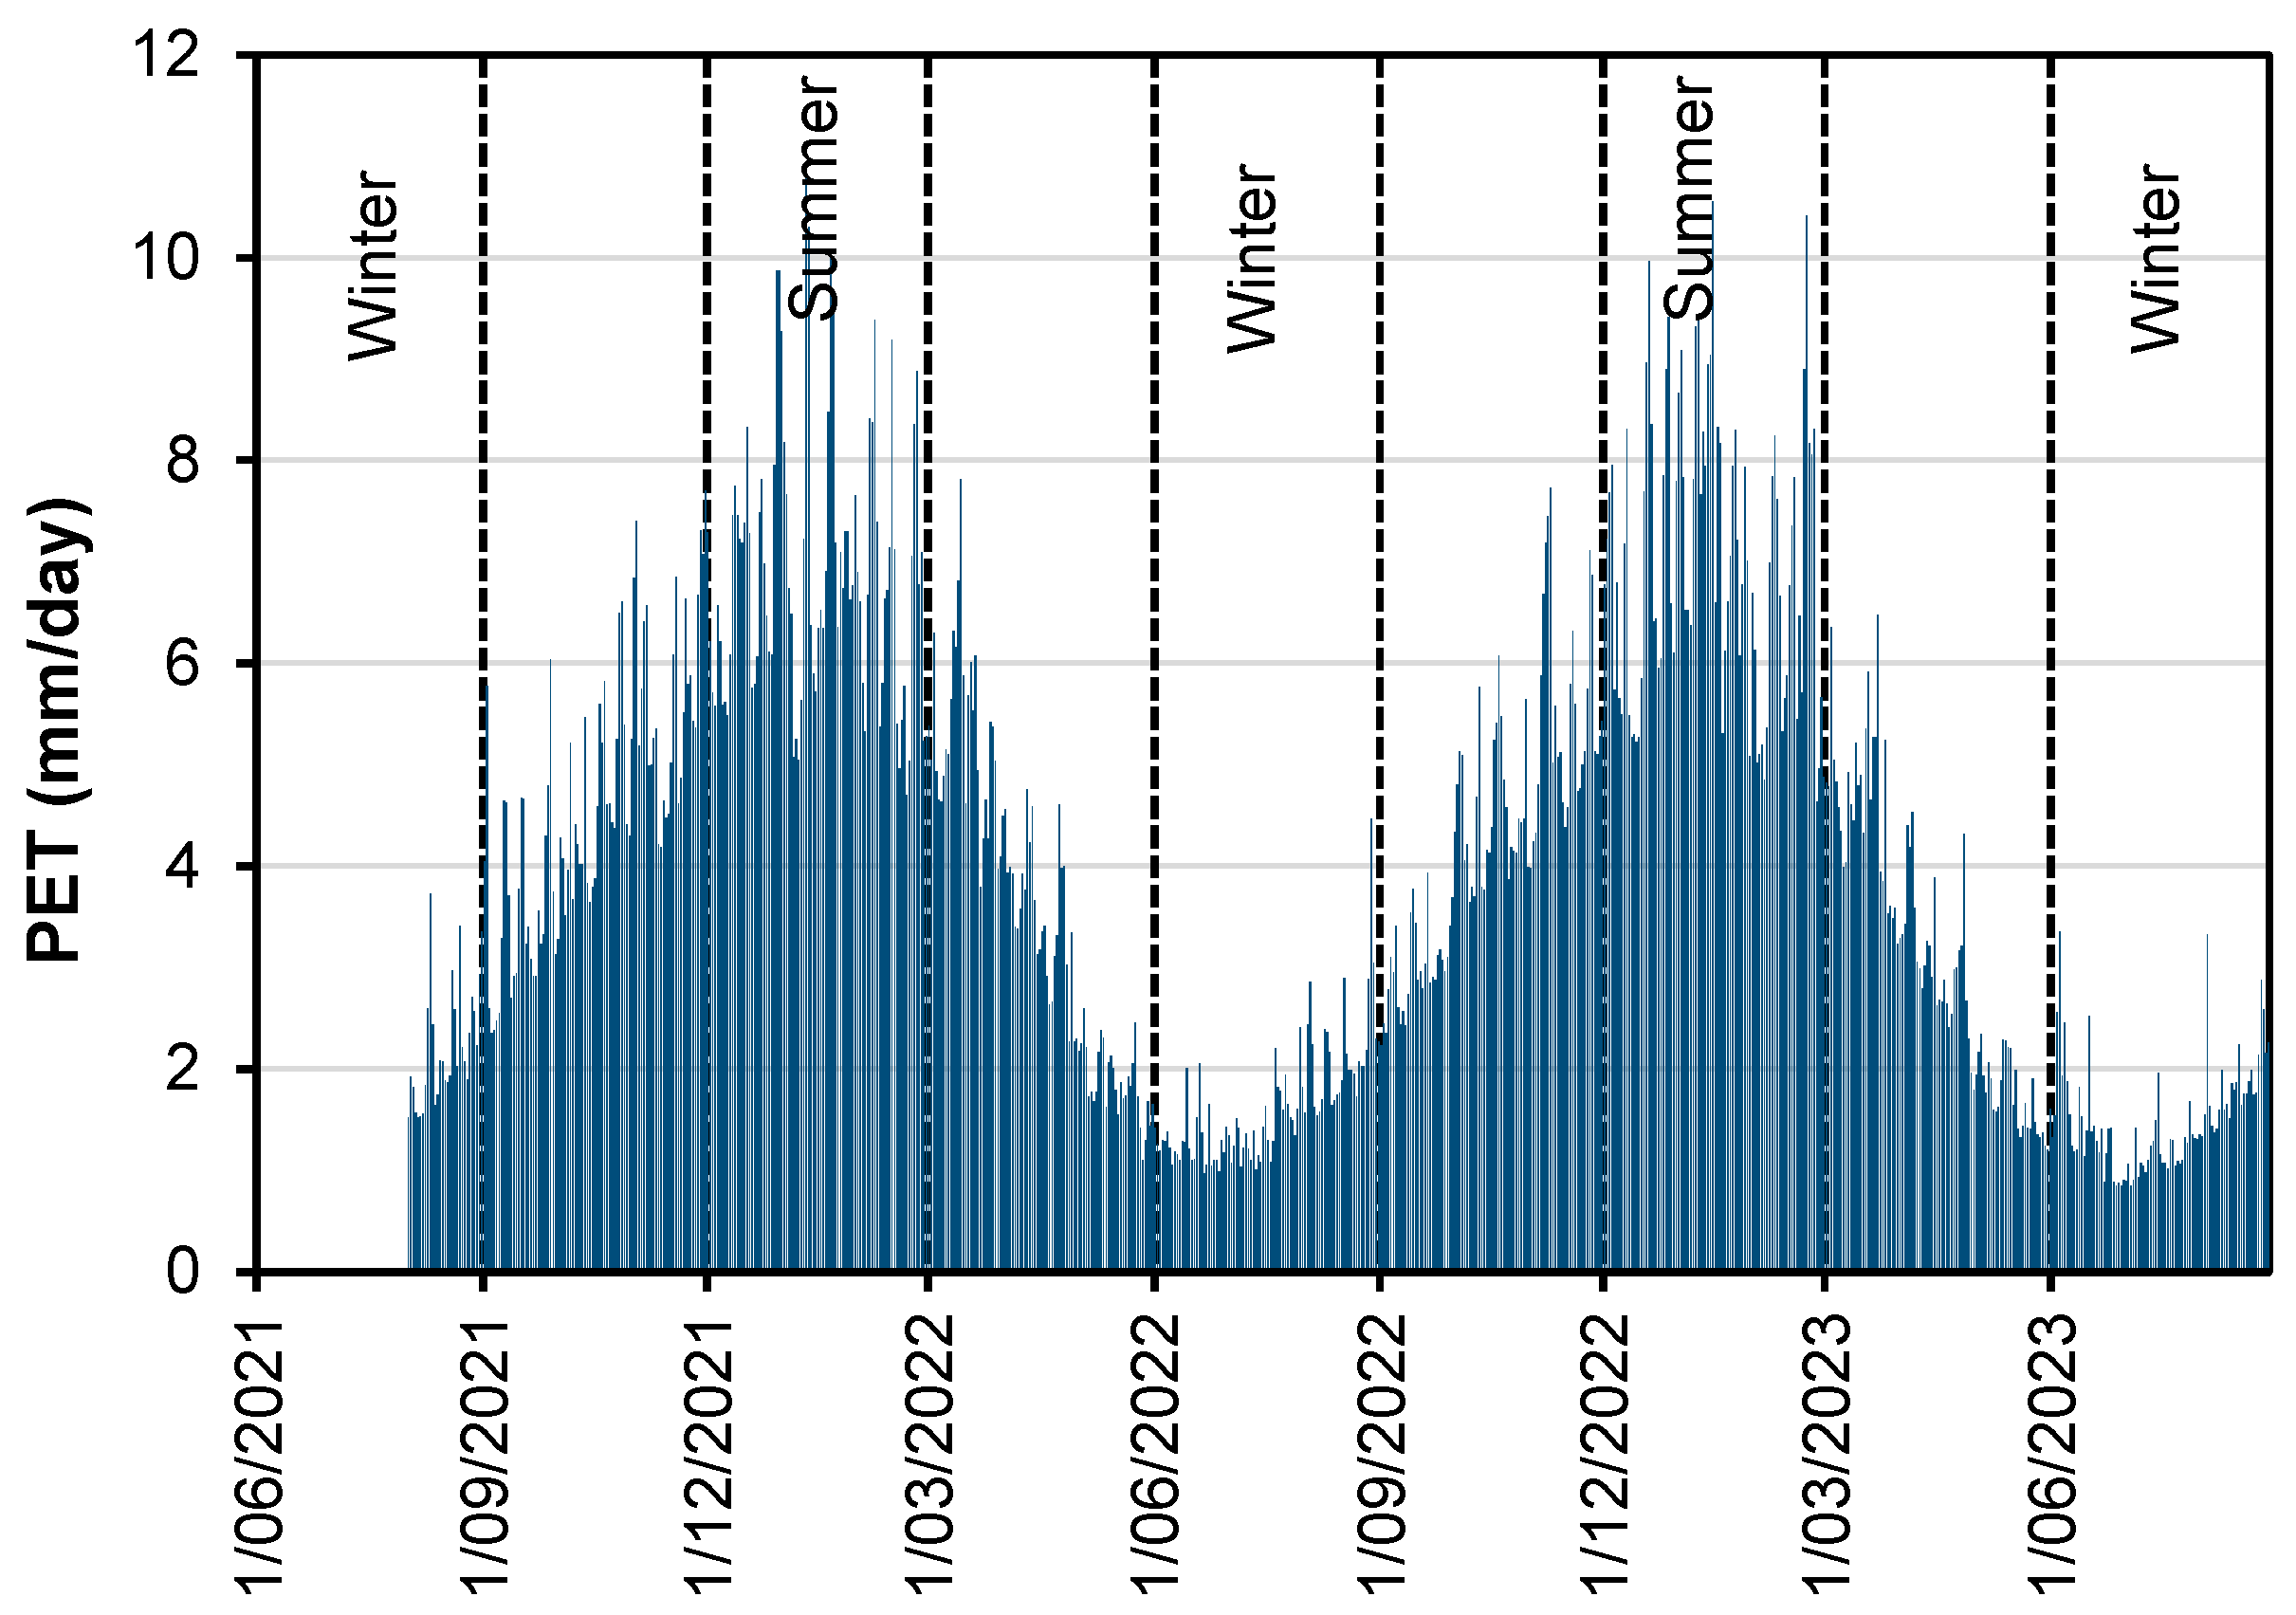
4.1. Weather
4.2. Suction-Depth Profiles
4.3. Ground Movements
4.4. The Influence of Available Water on Ground Movement
5. Hydraulic Conductivity Laboratory vs. Field Observations
6. Soil Reactivity—Visual Tactile vs. Laboratory and Effect of the Initial Moisture State
7. Conclusions
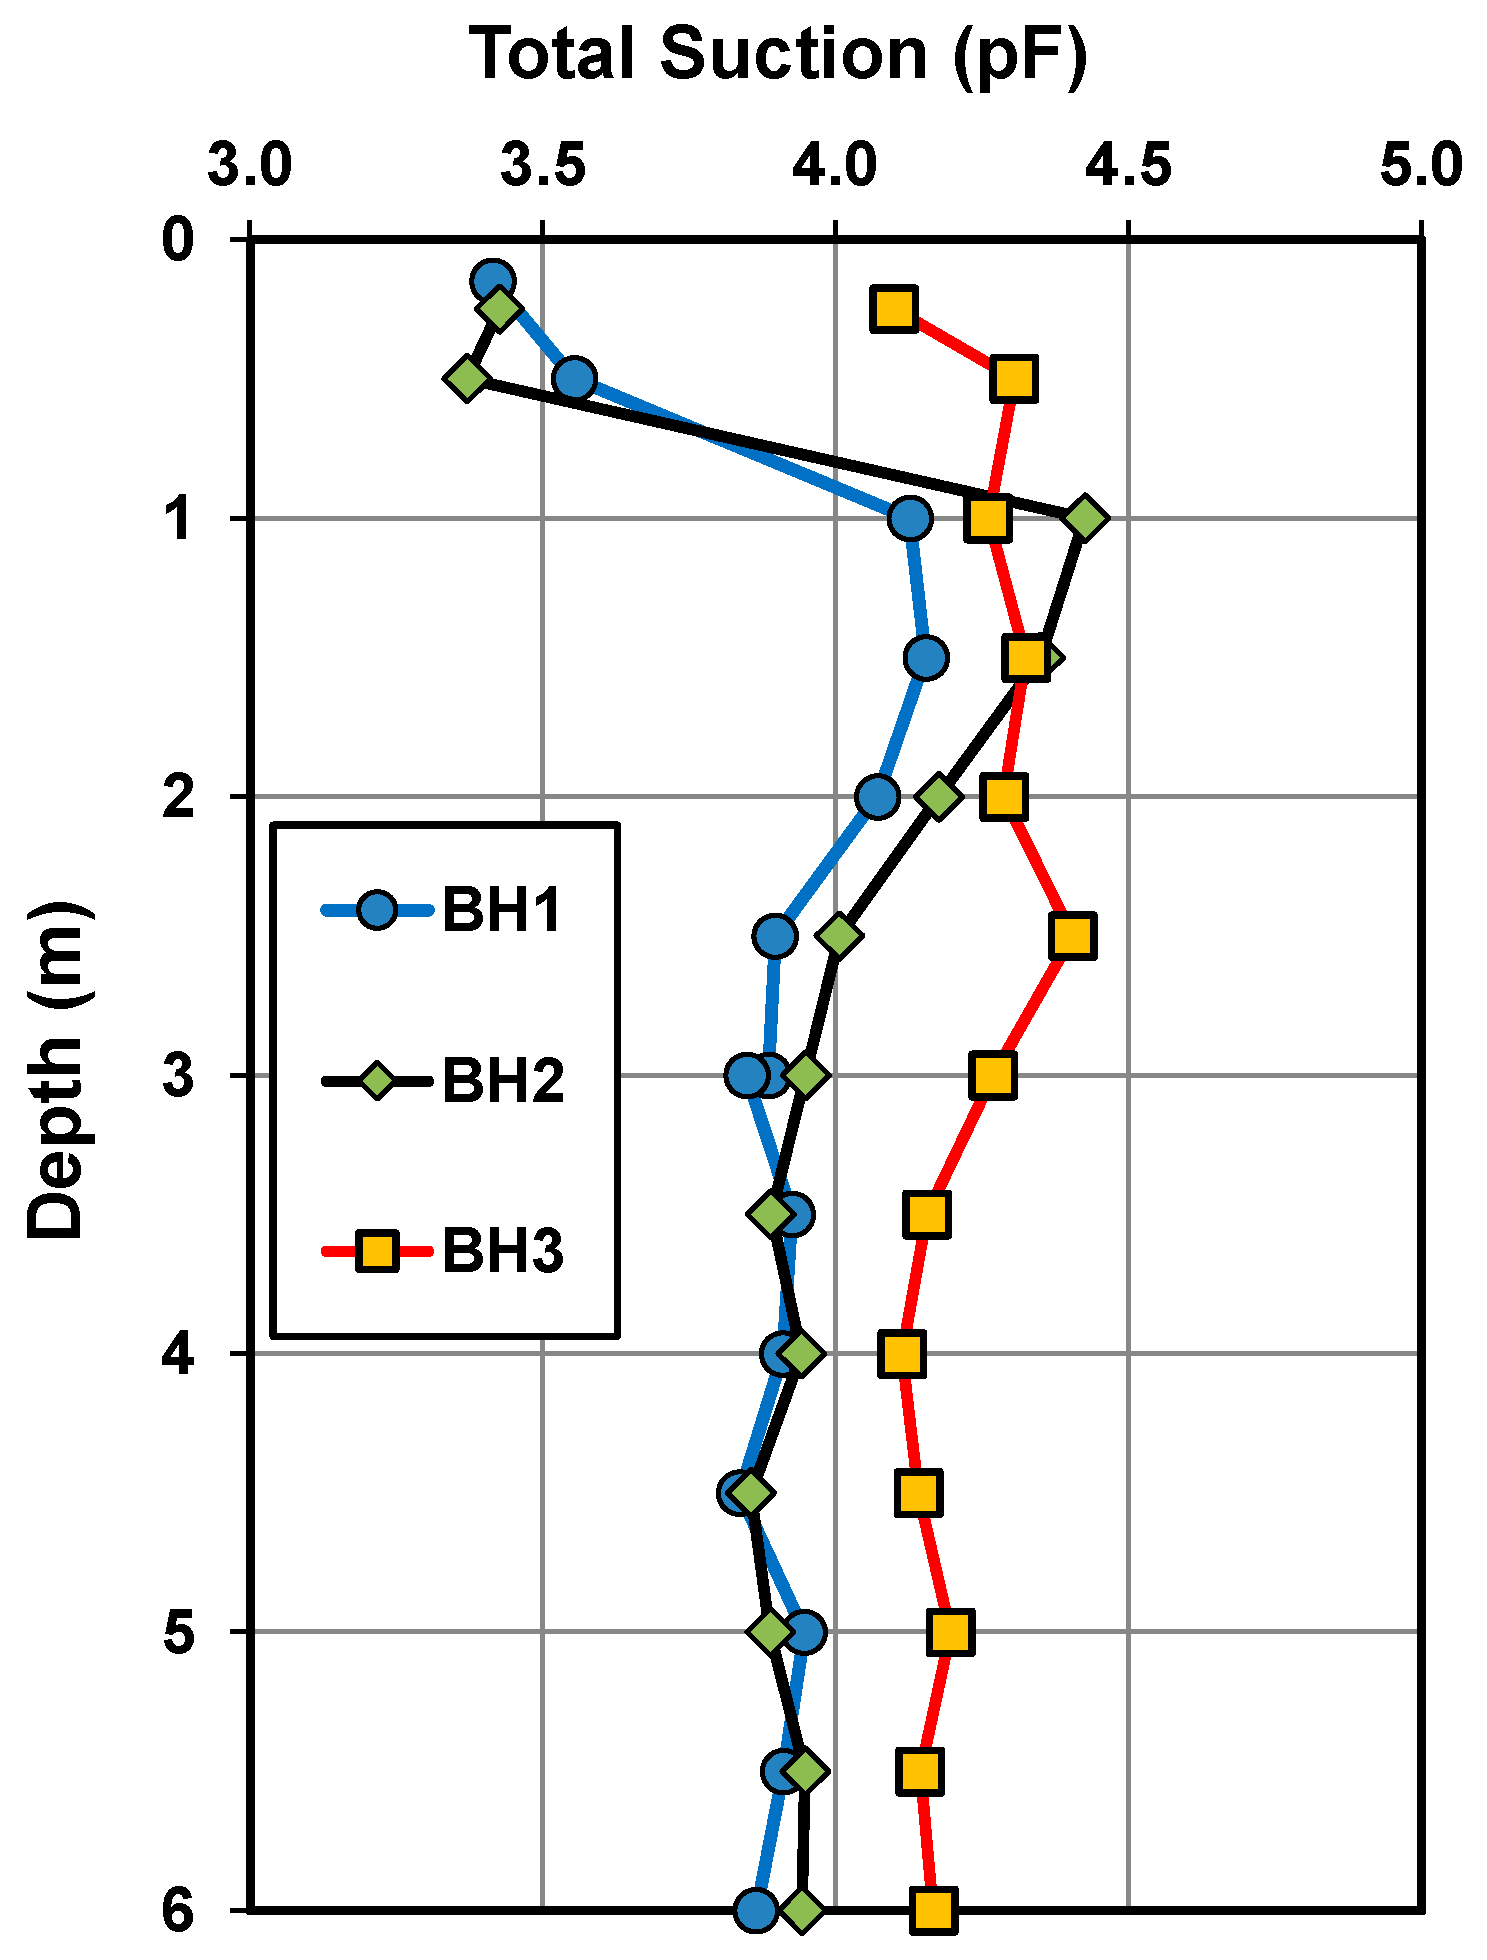
- Seasonal ground movement was reduced generally in areas covered by tree canopies, which was likely due to the long-established deep soil desiccation by the trees and the microclimate created by the tree canopies. Evidence of deep soil desiccation down to 6 m due to the trees was provided by the three suction profiles from September 2019 shown in Figure 6; BH3 near the trees was consistently drier by 0.24 pF below 3.5 m.
- The atmospheric boundary interaction at the soil surface, represented by monthly available water, correlated well with the recorded ground movement well away from the trees around the site, with a time lag of 2 months or so before the soil responded to water availability or deprivation (Figure 12).
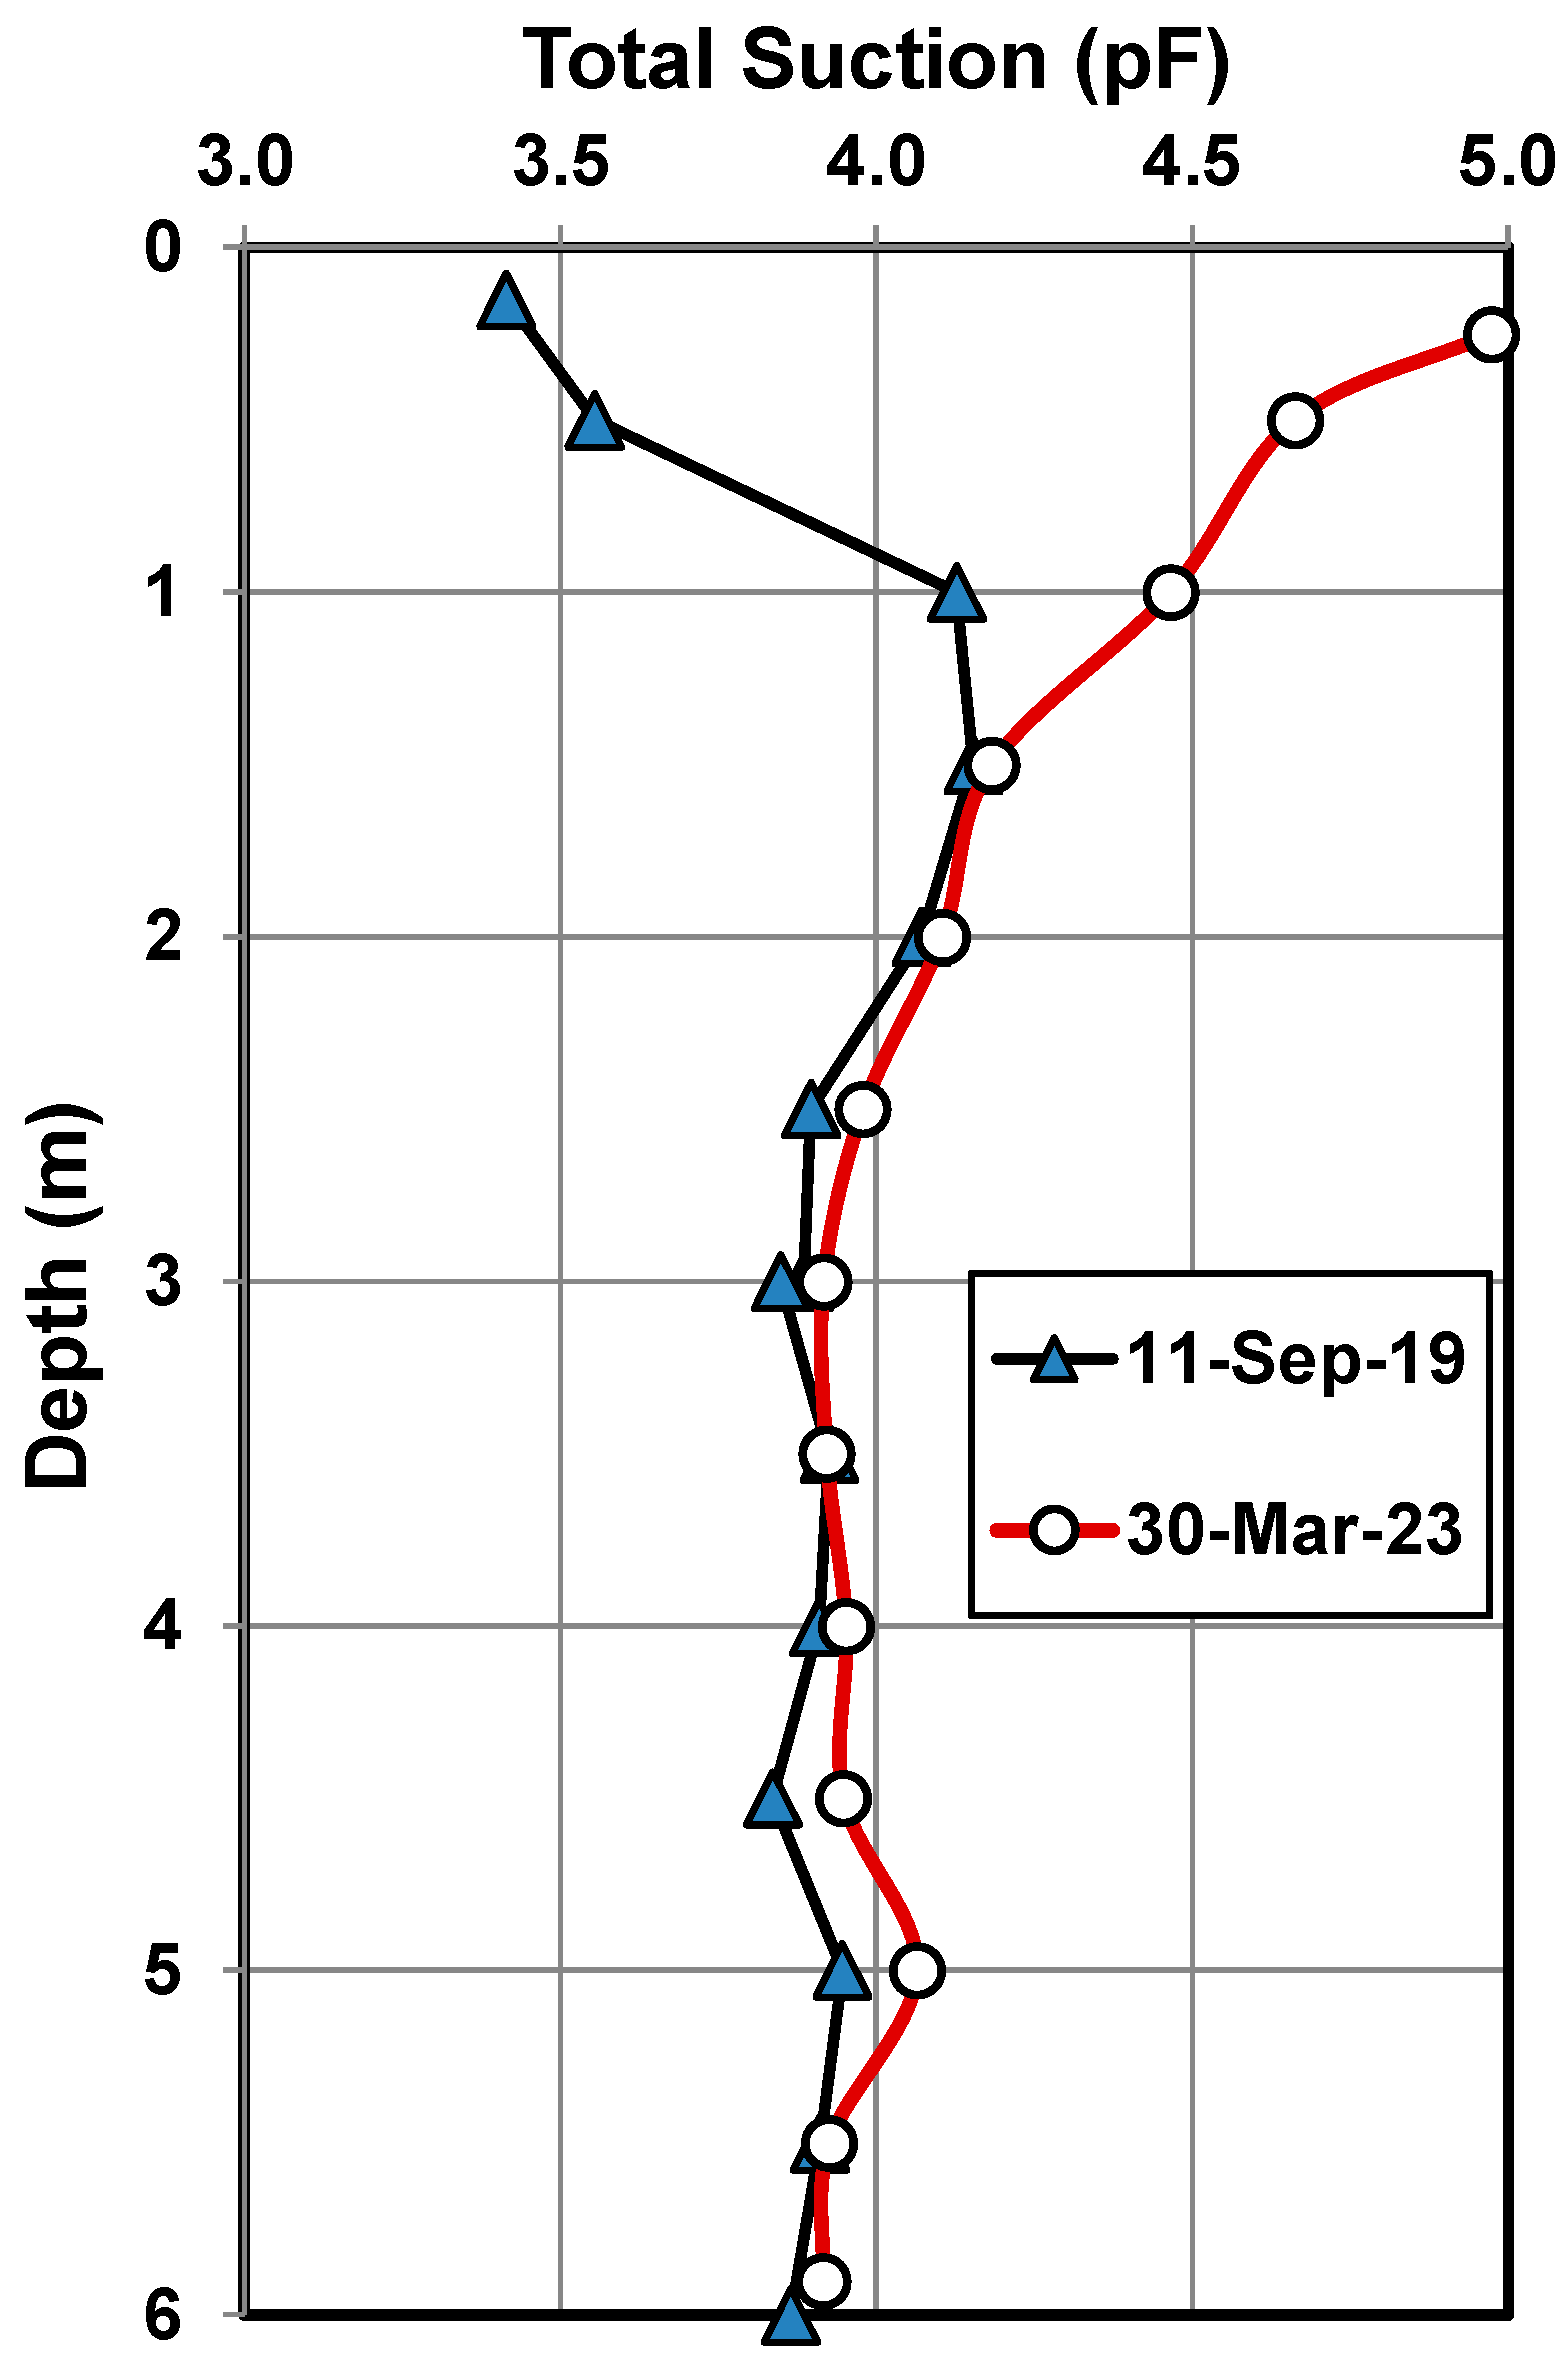
- The apparent depth of seasonal suction change was observed to be 1.5 m (Figure 11) in an area where the local climate can be classified as semi-arid, and the design depth of suction change used in house footing design is 4 m.
- Solute suction estimates based on electrical conductivity testing of 1:5 soil-water solutions gave quite high values when compared with total suctions and were within 0.08 and 0.29 pF of corresponding total suctions values (Figure 7).
- Differences of more than three orders of magnitude were observed between hydraulic conductivity values measured from field and laboratory tests (Figure 3 and Figure 13) and are likely to be due to the presence of cracks and fissures in expansive soils, local heterogeneity and the difficulty fully saturating soil in the field.
8. Further Research
Author Contributions
Funding
Data Availability Statement
Conflicts of Interest
References
- Devkota, B.; Karim, M.R.; Rahman, M.M.; Nguyen, K.; Iqbal, A. Effect of Climate Change on Depth of Suction Change—A Case Study. Geo-Congress 2023, 2023, 649–660. [Google Scholar]
- Richards, B.G.; Peter, P.; Emerson, W.W. The effects of vegetation on the swelling and shrinking of soils in Australia. Géotechnique 1983, 33, 127–139. [Google Scholar] [CrossRef]
- Nelson, J.D.; Chao, K.C.G.; Overton, D.D.; Nelson, E.J. Foundation Engineering for Expansive Soils; Wiley: Hoboken, NJ, USA, 2015. [Google Scholar]
- Cameron, D.A.; Walsh, P.F. Damage to Buildings on Clay Soils; Australian Council of National Trusts and National Trust of Australia (Victoria): Melbourne, Australia, 1984. [Google Scholar]
- Devkota, B.; Karim, M.R.; Rahman, M.M.; Nguyen, H.B.K. Accounting for Expansive Soil Movement in Geotechnical Design—A State-of-the-Art Review. Sustainability 2022, 14, 15662. [Google Scholar] [CrossRef]
- Nelson, J.; Miller, D.J. Expansive Soils: Problems and Practice in Foundation and Pavement Engineering; John Wiley & Sons: Hoboken, NJ, USA, 1992. [Google Scholar]
- Jones, L.D.; Ian, J. Chapter C5—Expansive soils. In Institution of Civil Engineers Manuals Series; Institution of Civil Engineers: London, UK, 2012. [Google Scholar]
- Considine, M.L. Soils shrink, trees drink, and houses crack. ECOS Mag. 1984, 41, 13–15. [Google Scholar]
- Karim, M.R.; Hughes, D.; Kelly, R.; Lynch, K. A rational approach for modelling the meteorologically induced pore water pressure in infrastructure slopes. Eur. J. Environ. Civ. Eng. 2019, 24, 2361–2382. [Google Scholar] [CrossRef]
- Smethurst, J.; Briggs, K.M.; Powrie, W.; Ridley, A.; Butcher, D.J.E. Mechanical and hydrological impacts of tree removal on a clay fill railway embankment. Geotechnique 2015, 65, 869–882. [Google Scholar] [CrossRef]
- Hughes, D.; Karim, M.R.; Briggs, K.; Glendinning, S.; Toll, D.; Dijkstra, T.; Powrie, W.; Dixon, N. A comparison of numerical modelling techniques to predict the effect of climate on infrastructure slopes. In Proceedings of the Geotechnical Engineering for Infrastructure and Development—Proceedings of the XVI European Conference on Soil Mechanics and Geotechnical Engineering, ECSMGE 2015, Edinburgh, UK, 13–17 September 2015; pp. 3663–3668. [Google Scholar]
- Glendinning, S.; Helm, P.R.; Rouainia, M.; Stirling, R.A.; Asquith, J.D.; Hughes, P.N.; Toll, D.G.; Clarke, D.; Powrie, W.; Smethurst, J.; et al. Research-informed design, management and maintenance of infrastructure slopes: Development of a multi-scalar approach. IOP Conf. Ser. Earth Environ. Sci. 2015, 26, 012005. [Google Scholar] [CrossRef]
- Glendinning, S.; Dijkstra, T.; Hughes, P.; Hughes, D.; Smethurst, J.; Dixon, N.; Toll, D. Field Monitoring of infrastructure slopes for asset management in an uncertain climate. In Proceedings of the 16th European Conference on Soil Mechanics and Geotechnical Engineering, Edinburgh, UK, 13–17 September 2015. [Google Scholar]
- Davies, O.; Rouainia, M.; Glendinning, S.; Cash, M.; Trento, V. Investigation of a pore pressure driven slope failure using a coupled hydro-mechanical model. Eng. Geol. 2014, 178, 70–81. [Google Scholar] [CrossRef]
- O’Brien, A.S.; Briggs, K.M.; Smethurst, J.a.; Powrie, W. Wet winter pore pressures in railway embankments. Proc. ICE-Geotech. Eng. 2013, 166, 451–465. [Google Scholar]
- Briggs, K.M.; Smethurst, J.A.; Powrie, W.; O’Brien, A.S.; Butcher, D.J.E. Managing the extent of tree removal from railway earthwork slopes. Ecol. Eng. 2013, 61, 690–696. [Google Scholar] [CrossRef]
- Toll, D.G.; Mendes, J.; Hughes, P.N.; Glendinning, S.; Gallipoli, D. Climate change and the role of unsaturated soil mechanics. Geotech. Eng. J. SEAGS AGSSEA 2012, 43, 76–82. [Google Scholar]
- Smethurst, J.a.; Clarke, D.; Powrie, W. Factors controlling the seasonal variation in soil water content and pore water pressures within a lightly vegetated clay slope. Géotechnique 2012, 62, 429–446. [Google Scholar] [CrossRef]
- Loveridge, F.A.; Spink, T.W.; O’Brien, A.S.; Briggs, K.M.; Butcher, D.J.E. The impact of climate and climate change on infrastructure slopes, with particular reference to southern England. Q. J. Eng. Geol. Hydrogeol. 2010, 43, 461–472. [Google Scholar] [CrossRef]
- Dijkstra, T.; Dixon, N. Climate change and slope stability in the UK: Challenges and approaches. Q. J. Eng. Geol. Hydrogeol. 2010, 43, 371–385. [Google Scholar] [CrossRef]
- Clarke, D.; Smethurst, J.A. Effects of climate change on cycles of wetting and drying in engineered clay slopes in England. Q. J. Eng. Geol. Hydrogeol. 2010, 43, 473–486. [Google Scholar] [CrossRef]
- Rouainia, M.; Davies, O.; O’Brien, T. Numerical modelling of climate effects on slope stability. Proc. Inst. Civ. Eng. Eng. Sustain. 2009, 162, 81–89. [Google Scholar] [CrossRef]
- Hughes, P.N.; Glendinning, S.; Mendes, J.; Parkin, G.; Toll, D.G.; Gallipoli, D.; Miller, P.E. Full-scale testing to assess climate effects on embankments. Proc. Inst. Civ. Eng. Eng. Sustain. 2009, 162, 67–69. [Google Scholar] [CrossRef]
- Toll, D.G.; Mendes, J.; Augarde, C.E.; Karthikeyan, M.; Phoon, K.K.; Gallipoli, D.; Lin, K.Q. Effects of climate change on slopes for transportation infrastructure. In Proceedings of the International Conference on Transportation Geotechnics, Nottingham, UK, 25–27 August 2008. [Google Scholar]
- Smethurst, J.A.; Powrie, W.; Clarke, D. Seasonal changes in pore water pressure in a grass-covered cut slope in London Clay. Géotechnique 2006, 56, 523–537. [Google Scholar] [CrossRef]
- BRAB. Criteria for Selection and Design of Residential Slabs on Ground; Federal Housing Administration: Washington, DC, USA, 1968.
- Walsh, P.F. The Analysis of Stiffened Raft on Expansive Clays; CSIRO Division of Building Research Report: Melbourne, Australia, 1978; p. 14.
- Mitchell, P.W. The design of residential footings on expansive soils. In Proceedings of the First National Local Government Engineering Conference, Adelaide, Australia, 2–27 August 1981; pp. 175–180. [Google Scholar]
- Mitchell, P.W. The Design of Shallow Footings on Expansive Soils. Ph.D. Thesis, University of Adelaide, Adelaide, Australia, 1984. [Google Scholar]
- Mitchell, P.W. Footing Design for Residential Type Structures in Arid Climates. Aust. Geomech. J. 2008, 43, 51–68. [Google Scholar]
- Jewell, S.A.; Mitchell, P.W. The Thornthwaite Moisture Index and seasonal soil movement in Adelaide. Aust. Geomech. J. 2009, 44, 59–68. [Google Scholar]
- Mitchell, P.W. Climate Change Effects on Expansive Soil Movements. In Proceedings of the 18th International Conference on Soil Mechanics and Geotechnical Engineering, Paris, France, 2–6 September 2013. [Google Scholar]
- Karim, M.R.; Rahman, M.M.; Nguyen, K.; Cameron, D.; Iqbal, A.; Ahenkorah, I. Changes in Thornthwaite Moisture Index and reactive soil movements under current and future climate scenarios—A case study. Energies 2021, 14, 6760. [Google Scholar] [CrossRef]
- Karim, M.R.; Rahman, M.M.; Nguyen, H.B.K.; Newsome, P.L.; Cameron, D. TMI soil moisture index for South Australia under current and future climate scenarios. In A Geotechnical Discovery Down Under, Proceedings of the 20th International Conference on Soil Mechanics and Geotechnical Engineering, Sydney, Australia, 1-5 May 2022; Rahman, M.M., Jaksa, M., Eds.; Australian Geomechanics Society: Sydney, Australia, 2022; pp. 2233–2236. [Google Scholar]
- Hu, Y.; Saraceni, P.; Cocks, G.; Zhou, M. TMI Assessment and Climate Zones in Western Australia. Aust. Geomech. J. 2016, 51, 79–89. [Google Scholar]
- Davenport, F. Problem Soils—A West Australian Perspective. Aust. Geomech. 2007, 42, 1–19. [Google Scholar]
- Walsh, P.; Fityus, S.; Kleeman, P. A note on the depth of design suction change for clays in South Western Australia and South Eastern Queensland. Aust. Geomech. 1998, 33, 37–40. [Google Scholar]
- Fityus, S.; Walsh, P.; Kleeman, P. The influence of climate as expressed by the Thornthwaite index on the design depth of moisture change of clay soils in the Hunter Valley. In Proceedings of the Conference on Geotechnical Engineering and Engineering Geology in the Hunter Valley, Newcastle, Australia, 12–14 July 1998; pp. 251–265. [Google Scholar]
- Li, J.; Guo, L. Field Investigation and Numerical Analysis of Residential Building Damaged by Expansive Soil Movement Caused by Tree Root Drying. J. Perform. Constr. Facil. 2017, 31, D4016003. [Google Scholar] [CrossRef]
- Karunarathne, A.N. Investigation of Expansive Soil for Design of Light Residential Footings in Melbourne. Ph.D. Thesis, Swinburne University of Technology, Melbourne, Australia, 2016. [Google Scholar]
- Fernandes, M.; Denis, A.; Fabre, R.; Lataste, J.F.; Chretien, M. In situ study of the shrinkage-swelling of a clay soil over several cycles of drought-rewetting. Eng. Geol. 2015, 192, 63–75. [Google Scholar] [CrossRef]
- Karunarathne, A.; Fardipour, M.; Gad, E.; Rajeev, P.; Disfani, M.; Sivanerupan, S.; Wilson, J. Modelling of climate induced moisture variations and subsequent ground movements in expansive soils. Geotech. Geol. Eng. 2018, 36, 2455–2477. [Google Scholar] [CrossRef]
- Teodosio, B.; Baduge, K.S.K.; Mendis, P. Simulating reactive soil and substructure interaction using a simplified hydro-mechanical finite element model dependent on soil saturation, suction and moisture-swelling relationship. Comput. Geotech. 2020, 119, 103359. [Google Scholar] [CrossRef]
- AS 2870-2011; Residential Slabs and Footings. Standards Australia: Sydney, Australia, 2011.
- Kraehenbuehl, D.N. Pre-European Vegetation of Adelaide: A Survey from the Gawler River to Hallett Cove; Nature Conservation Society of South Australia: Hindmarsh, Australia, 1996. [Google Scholar]
- BOM. Rainfall Update. Available online: http://www.bom.gov.au/climate/rainfall/ (accessed on 7 August 2023).
- EVSA. Urban Heat and Tree Mapping of Adelaide Metropolitan Area. Available online: https://data.environment.sa.gov.au/Climate/Data-Systems/Urban-Heat-Mapping/Pages/default.aspx (accessed on 21 August 2023).
- Google Earth. Research Site Area Plan View. Available online: earth.google.com/web/ (accessed on 7 August 2022).
- Sheard, M.J.; Bowman, G.M. Soils, Stratigraphy and Engineering Geology of Near Surface Materials of the Adelaide Plains; Mines and Energy South Australia: Parkside, Australia, 1996.
- AS 1289.7.1.1; Soil Reactivity Tests—Determination of the Shrinkage Index of a Soil—Shrink-Swell Index, Methods of Testing Soils for Engineering Purposes. Standards Australia: Sydney, Australia, 2003.
- AS 1289.2.2.1; Soil Moisture Content Tests—Determination of the Total Suction of a Soil—Standard Method. Standards Australia: Sydney, Australia, 1998.
- DSNR. Soil Survey Standard Test Method Electrical Conductivity. Available online: https://www.environment.nsw.gov.au/resources/soils/testmethods/ec.pdf (accessed on 22 August 2023).
- Ying, Z.; Benahmed, N.; Cui, Y.-J.; Duc, M. Determining osmotic suction through electrical conductivity for unsaturated low-plasticity soils. J. Rock Mech. Geotech. Eng. 2022, 14, 1946–1955. [Google Scholar] [CrossRef]
- Mata, M.C.; Romero, E.; Ledesma, A. Hydro-chemical effects on water retention in bentonite-sand mixtures. In Proceedings of the 3rd International Conference on Unsaturated Soil, Recife, Brazil, 10–13 March 2002; pp. 283–288. [Google Scholar]
- Indrawan, I.G.B.; Williams, D.J.; Scheuermann, A. Determination of the True Electrical Conductivity of a Saline Clay. In Proceedings of the New Zealand Conference on Geomechanics, Melbourne, Australia, 15–18 July 2012; pp. 1491–1496. [Google Scholar]
- Rowe, P.W.; Barden, L. A New Consolidation Cell. Géotechnique 1966, 16, 162–170. [Google Scholar] [CrossRef]
- GDS. Consolidation Testing System (Rowe & Barden Type) (GDSCTS). Available online: https://www.gdsinstruments.com/__assets__/Products/00026/GDSCTS_Datasheet.pdf (accessed on 21 August 2023).
- ASCE-EWRI. The ASCE Standardized Reference Evapotranspiration Equation. In Standardization of Reference Evapotranspiration Task Committee Final Report, Environmental and Water Resources Institute (EWRI) of the American Society of Civil, Engineers; Allen, R.G., Walter, I.A., Elliot, R.L., Howell, T.A., Itenfisu, D., Jensen, M.E., Snyder, R.L., Eds.; ASCE: Reston, VA, USA, 2005. [Google Scholar]
- Cameron, D.A. The extent of soil desiccation near trees in a semi-arid environment. Geotech. Geol. Eng. 2001, 19, 357–370. [Google Scholar] [CrossRef]
- Cameron, D.A.; Beal, N.S. Estimation of foundation movement and design of footing systems on reactive soils for the effects of trees. Aust. Geomech. J. 2011, 46, 87–104. [Google Scholar]
- Sun, X.; Li, J.; Cameron, D.; Zhou, A.; Bayetto, P.; Moore, G. Assessment of the influence of an Australian native eucalypt, Corymbia maculata, on soil desiccation in a temperate climate. Acta Geotech. 2023. [Google Scholar] [CrossRef]
- Fityus, S.G.; Smith, D.W.; Allman, M.A. Expansive soil test site near Newcastle. J. Geotech. Geoenviron. Eng. 2004, 130, 686–695. [Google Scholar] [CrossRef]
- Geotech Data. Soil Permeability Coefficient. Available online: http://www.geotechdata.info/parameter/permeability (accessed on 23 August 2023).
- Dixon, N.; Crosby, C.J.; Stirling, R.; Hughes, P.N.; Smethurst, J.; Briggs, K.; Hughes, D.; Gunn, D.; Hobbs, P.; Loveridge, F.; et al. In situ measurements of near-surface hydraulic conductivity in engineered clay slopes. Q. J. Eng. Geol. Hydrogeol. 2019, 52, 123–135. [Google Scholar] [CrossRef]
- Richards, B.G. Moisture Equilibria and Moisture Changes in Soils Beneath Covered Areas. A Symposium in Print Convened by Soil Mechanics Section; CSIRO (Australia): Melbourne, Australia; NBRI and CSIR (South Africa): Sydney, Australia, 1965. [Google Scholar]
- Fredlund, D.G.; Houston, S.L.; Nguyen, Q.; Fredlund, M.D. Moisture Movement Through Cracked Clay Soil Profiles. Geotech. Geol. Eng. 2010, 28, 865–888. [Google Scholar] [CrossRef]


| Horizon | Pedology | Colour | Inclusions | USCS |
|---|---|---|---|---|
| 1 | Silt and Sand, clayey | Grey brown | Some fine roots | SC-SM |
| 2 | Clay | Grey brown to black | Trace of sand | CH |
| 3 | Clay | Grey brown orange | Trace of sand | CH |
| 4 | Clay, sandy silty | Grey brown yellow, cream in pockets | Angular gravel to 10 mm, highly calcareous | CI-CH |
| 5 | Clay, silty sandy | Grey orange yellow brown. | Moderately calcareous | CH |
| 6 | Clay, sandy silty | Grey brown yellow, cream in pockets | Angular gravel up to 10 mm | CI-CH |
| 7 | Clay | Grey brown orange, mottled green | Trace of sand, angular gravel to 5 mm | CH |
| 8 | Clay | Grey green mottled orange yellow | Trace of sand | CH |
| 9 | Clay, sandy silty | Grey brown yellow cream | Angular gravel to 10 mm, highly calcareous | CH |
| BH | Depth (m) | Liquid Limit (%) | Plastic Limit (%) | USCS | Soil Description |
|---|---|---|---|---|---|
| N | 0.33 | 47 | 26 | CI | CLAY, tan/yellow-brown, CaCO3 patches, moist |
| N | 0.85 | 60 | 29 | CH | CLAY, tan/yellow-brown, CaCO3 patches, some gravel to 5 mm mm |
| N | 1.15 | 52 | 24 | CH | CLAY, red-brown |
| N | 2.1 | 43 | 21 | CI | CLAY, reddish brown to yellow brown, occ. CaCO3 pocket |
| N | 3.2 | 47 | 23 | CI | CLAY, with fine gravels and occ. large stone (10 to 20 mm), grey brown, mottled yellow, CaCO3 pockets |
| S | 0.4 | 23 | 13 | CL | Black Earth, very dry, powdery/crumbly. |
| S | 0.8 | 47 | 24 | CI | CLAY, tan, CaCO3 patches, stiff and dry |
| S | 1.3 | 55 | 24 | CH | CLAY, red brown, very stiff, small pockets of CaCO3 |
| S | 2.1 | 42.5 | 20 | CI | CLAY, red brown, minor CaCO3 |
| S | 3.1 | 45 | 24 | CI | CLAY, silty, brown/yellow brown with CaCO3 patches and minor gravel |
| BH | Soil Type | Depth (m) | Water Content (%) | Initial Suction, s (pF) | Swell Strain (%) | Shrink Strain (%) | Iss (%/pF) | Mean Iss |
|---|---|---|---|---|---|---|---|---|
| 1 | BE | 0.35 | 30.9 | 3.41 | 0.2 | 8.2 | 4.6 | 4.7 |
| 1 | BE | 0.3 | 16.5 | 4.93 | 11.4 | 2.4 | 4.5 | |
| 2 | BE | 0.7 | 32.6 | 3.91 | 0.7 | 8.4 | 4.9 | |
| 1 | RB | 2.0 | 23.8 | 3.66 | 1.3 | 5.0 | 3.1 | 2.6 |
| 2 | RB | 1.9 | 21.6 | 4.20 | 0.5 | 4.3 | 2.5 | |
| 2 | RB | 1.9 | 21.5 | 4.24 | 1.8 | 3.8 | 2.6 | |
| 2 | RB | 0.75 | 15.1 | 4.68 | 3.0 | 2.2 | 2.1 | |
| 1 | Other | 2.2 | 24.5 | 4.01 | 0.1 | 3.2 | 1.8 | 2.0 |
| 1 | Other | 3.0 | 19.5 | 3.87 | 0.2 | 2.1 | 1.2 | |
| 1 | Other | 3.25 | 25.0 | 3.85 | 0.3 | 4.4 | 2.5 | |
| 2 | Other | 2.95 | 21.8 | 3.90 | 0.2 | 3.9 | 2.2 | |
| 2 | Other | 3.0 | 21.9 | 4.06 | 0.9 | 3.7 | 2.3 |
| BH | Depth (m) | *EC1:5 (mS/m) | Level of Salinity [54] |
|---|---|---|---|
| N | 0.33 | 47 | Slightly saline |
| N | 0.85 | 93 | Highly saline |
| N | 1.15 | 160 | Highly saline |
| N | 2.1 | 178 | Highly saline |
| N | 3.1 | 102 | Highly/moderately saline |
| N | 3.3 | 100 | Moderately saline |
| S | 0.4 | 42 | Slightly saline |
| S | 0.8 | 175 | Highly saline |
| S | 1.3 | 214 | Severely saline |
| S | 2.1 | 166 | Highly saline |
| S | 3.1 | 215 | Severely saline |
Disclaimer/Publisher’s Note: The statements, opinions and data contained in all publications are solely those of the individual author(s) and contributor(s) and not of MDPI and/or the editor(s). MDPI and/or the editor(s) disclaim responsibility for any injury to people or property resulting from any ideas, methods, instructions or products referred to in the content. |
© 2023 by the authors. Licensee MDPI, Basel, Switzerland. This article is an open access article distributed under the terms and conditions of the Creative Commons Attribution (CC BY) license (https://creativecommons.org/licenses/by/4.0/).
Share and Cite
Cameron, D.; Karim, M.R.; Johnson, T.; Rahman, M.M. Influence of Weather, Soil Variability, and Vegetation on Seasonal Ground Movement: A Field Study. Geotechnics 2023, 3, 1085-1103. https://doi.org/10.3390/geotechnics3040059
Cameron D, Karim MR, Johnson T, Rahman MM. Influence of Weather, Soil Variability, and Vegetation on Seasonal Ground Movement: A Field Study. Geotechnics. 2023; 3(4):1085-1103. https://doi.org/10.3390/geotechnics3040059
Chicago/Turabian StyleCameron, Donald, Md Rajibul Karim, Tim Johnson, and Md Mizanur Rahman. 2023. "Influence of Weather, Soil Variability, and Vegetation on Seasonal Ground Movement: A Field Study" Geotechnics 3, no. 4: 1085-1103. https://doi.org/10.3390/geotechnics3040059