Article

Automatic Unfolding of CityGML Buildings to Paper Models

by
Steffen Goebbels
* and
Regina Pohle-Fröhlich
iPattern Institute, Niederrhein University of Applied Sciences, Reinarzstr. 49, 47805 Krefeld, Germany
*
Author to whom correspondence should be addressed.
Geographies 2021, 1(3), 333-345; https://doi.org/10.3390/geographies1030018
Submission received: 28 October 2021 / Revised: 16 November 2021 / Accepted: 24 November 2021 / Published: 1 December 2021
(This article belongs to the Special Issue Geovisualization: Current Trends, Challenges, and Applications)

Abstract

:
3D city models are mainly viewed on computer screens, but many municipalities also use 3D printing to make urban planning tangible. Since 3D color printing is still comparatively expensive and the colors often fade over time, many of these models are monochrome. Here, color textured paper models offer an inexpensive and under-appreciated alternative. In this paper, a greedy algorithm adapted to CityGML building models is presented, which creates print templates for such paper models. These 2D layouts consist of cut edges and fold edges that bound polygons of a building. The polygons can be textured or left blank depending on the existence of CityGML textures. Glue tabs are attached to cut edges. In addition to the haptic 3D visualization, the quality of the 3D models can sometimes be better assessed on the basis of the print templates than from a perspective projection. The unfolding procedure was applied to parts of the freely available CityGML model of Berlin as well as to parts of models of the cities of Dortmund and Krefeld.

1. Introduction

Virtual 3D city models are used for simulation purposes (e.g., solar potential analyzes, flood maps, heat requirement mapping) as well as for vivid visualization of urban planning, e.g., see [1]. They are also a data source for Building Information Modeling (BIM), see [2]. Over the past decade, CityGML (see [3]) and more recently CityJSON (https://cityjson.org/specs/ (accessed on 23 November 2021)), have become the standards for representing 3D city information.
Most CityGML models are currently specified in a level of detail that provides somewhat simplified roof facets and walls but lack detailed facade information. In the CityGML level of detail 1 (LoD 1), the building footprint is extruded to obtain a 3D object with a flat roof. The CityGML level of detail 2 (LoD 2) allows for arbitrary planar roof facets. The representation of facades with windows and doors requires a higher level of detail, which is usually not available. The simple LoD 2 structure with few surfaces, which must also be planar, is ideal as a basis for paper models, cf. [4]. If color printing is used, this is even more true for those models that have been textured with oblique aerial images, see Figure 1.
Physical building models are important for participatory planning because they reduce the level of abstraction, see, e.g., [5]. These models are a tool for exploration and communication, and they can show the interplay between structures and their surrounding environment, see [6]. The role of haptic visualization of geospatial data is described in [7]. Handmade physical architectural models (made of cardboard, plaster, or wood in the past, cf. [8]) are quite expensive but now the presence of virtual 3D models allows for (semi-) automated production. Laser cutting is used to cut (also colored) pieces that have to be assembled manually. One can distinguish between subtractive (CNC milling) and additive techniques (3D printing) as well as forming techniques (deep drawing) to automatically create physical models, cf. [9]. With the advance of cheap 3D printers, various 3D printing techniques like stereolithography, powder printing, and Fused Filament Fabrication (FFF) have been applied to create architectural models in recent years, cf. [10]. Powder printing is capable of reproducing multi-colored surfaces, and many FFF printers allow for a few differently colored filaments within one print process. For example, the city of Essen used color 3D powder printing to reproduce the entire city center, see Figure 2.
However, 3D printing is a slow process, and compared to FFF printing with few colors, color powder 3D printing requires expensive materials and hardware. As the Essen model shows, the colors can fade away over time. In an experiment, we converted CityGML to the STL format, manually increased the level of detail, printed monochrome with a cheap FFF printer, and then manually painted facades. Although the results are promising (Figure 2), the manual effort is tremendous. Textured paper models also show realistic facades but can be assembled without the need of manual coloring in a fraction of 3D print time if there are not too many facets.
Paper models are created from printed 2D layouts by cutting along certain edges and by folding. The transformation of a 3D model to a 2D layout is called unfolding (cf. Section 2.1 for a formal definition). A general heuristic unfolding algorithm based on computing a minimum spanning tree is described in [11].
For CAD programs such as Blender (https://docs.blender.org/manual/en/latest/addons/import_export/paper_model.html (accessed on 23 November 2021)), there exist plug-ins that can be used to convert 3D models into print templates for paper models, cf. [12]. However, currently available free tools do not support an easy conversion of textured CityGML and CityJSON objects into textured CAD models. In contrast to general optimization approaches as described in [13,14], the typical geometry of the building models allows a specific greedy procedure for unfolding the models into 2D structures that results in small 2D layout sizes, see Figure 3.
Until now, it has been an open question if every convex polyhedron can be cut along some of its edges (cut edges) to allow a non-overlapping unfolding onto a 2D plane ([15] pp. 73–75). There exist special polyhedra with convex faces that do not have a non-overlapping unfolding [16]. Many building models do not even consist of only convex polygons. For example, a dormer might be placed over an opening in a roof facet. Then walls and roof of the dormer do not fit into the space of the opening such that no non-overlapping unfolding exists. For practical purposes, this is not a problem as we can generate multiple 2D layout images for a given building if necessary. The next section describes our unfolding approach. It has been implemented for CityGML data only, since CityJSON and CityGML can be easily converted into each other with freely available tools, github.com/citygml4j/citygml-tools (accessed on 23 November 2021). The paper concludes with a discussion of the results.

2. Materials and Methods

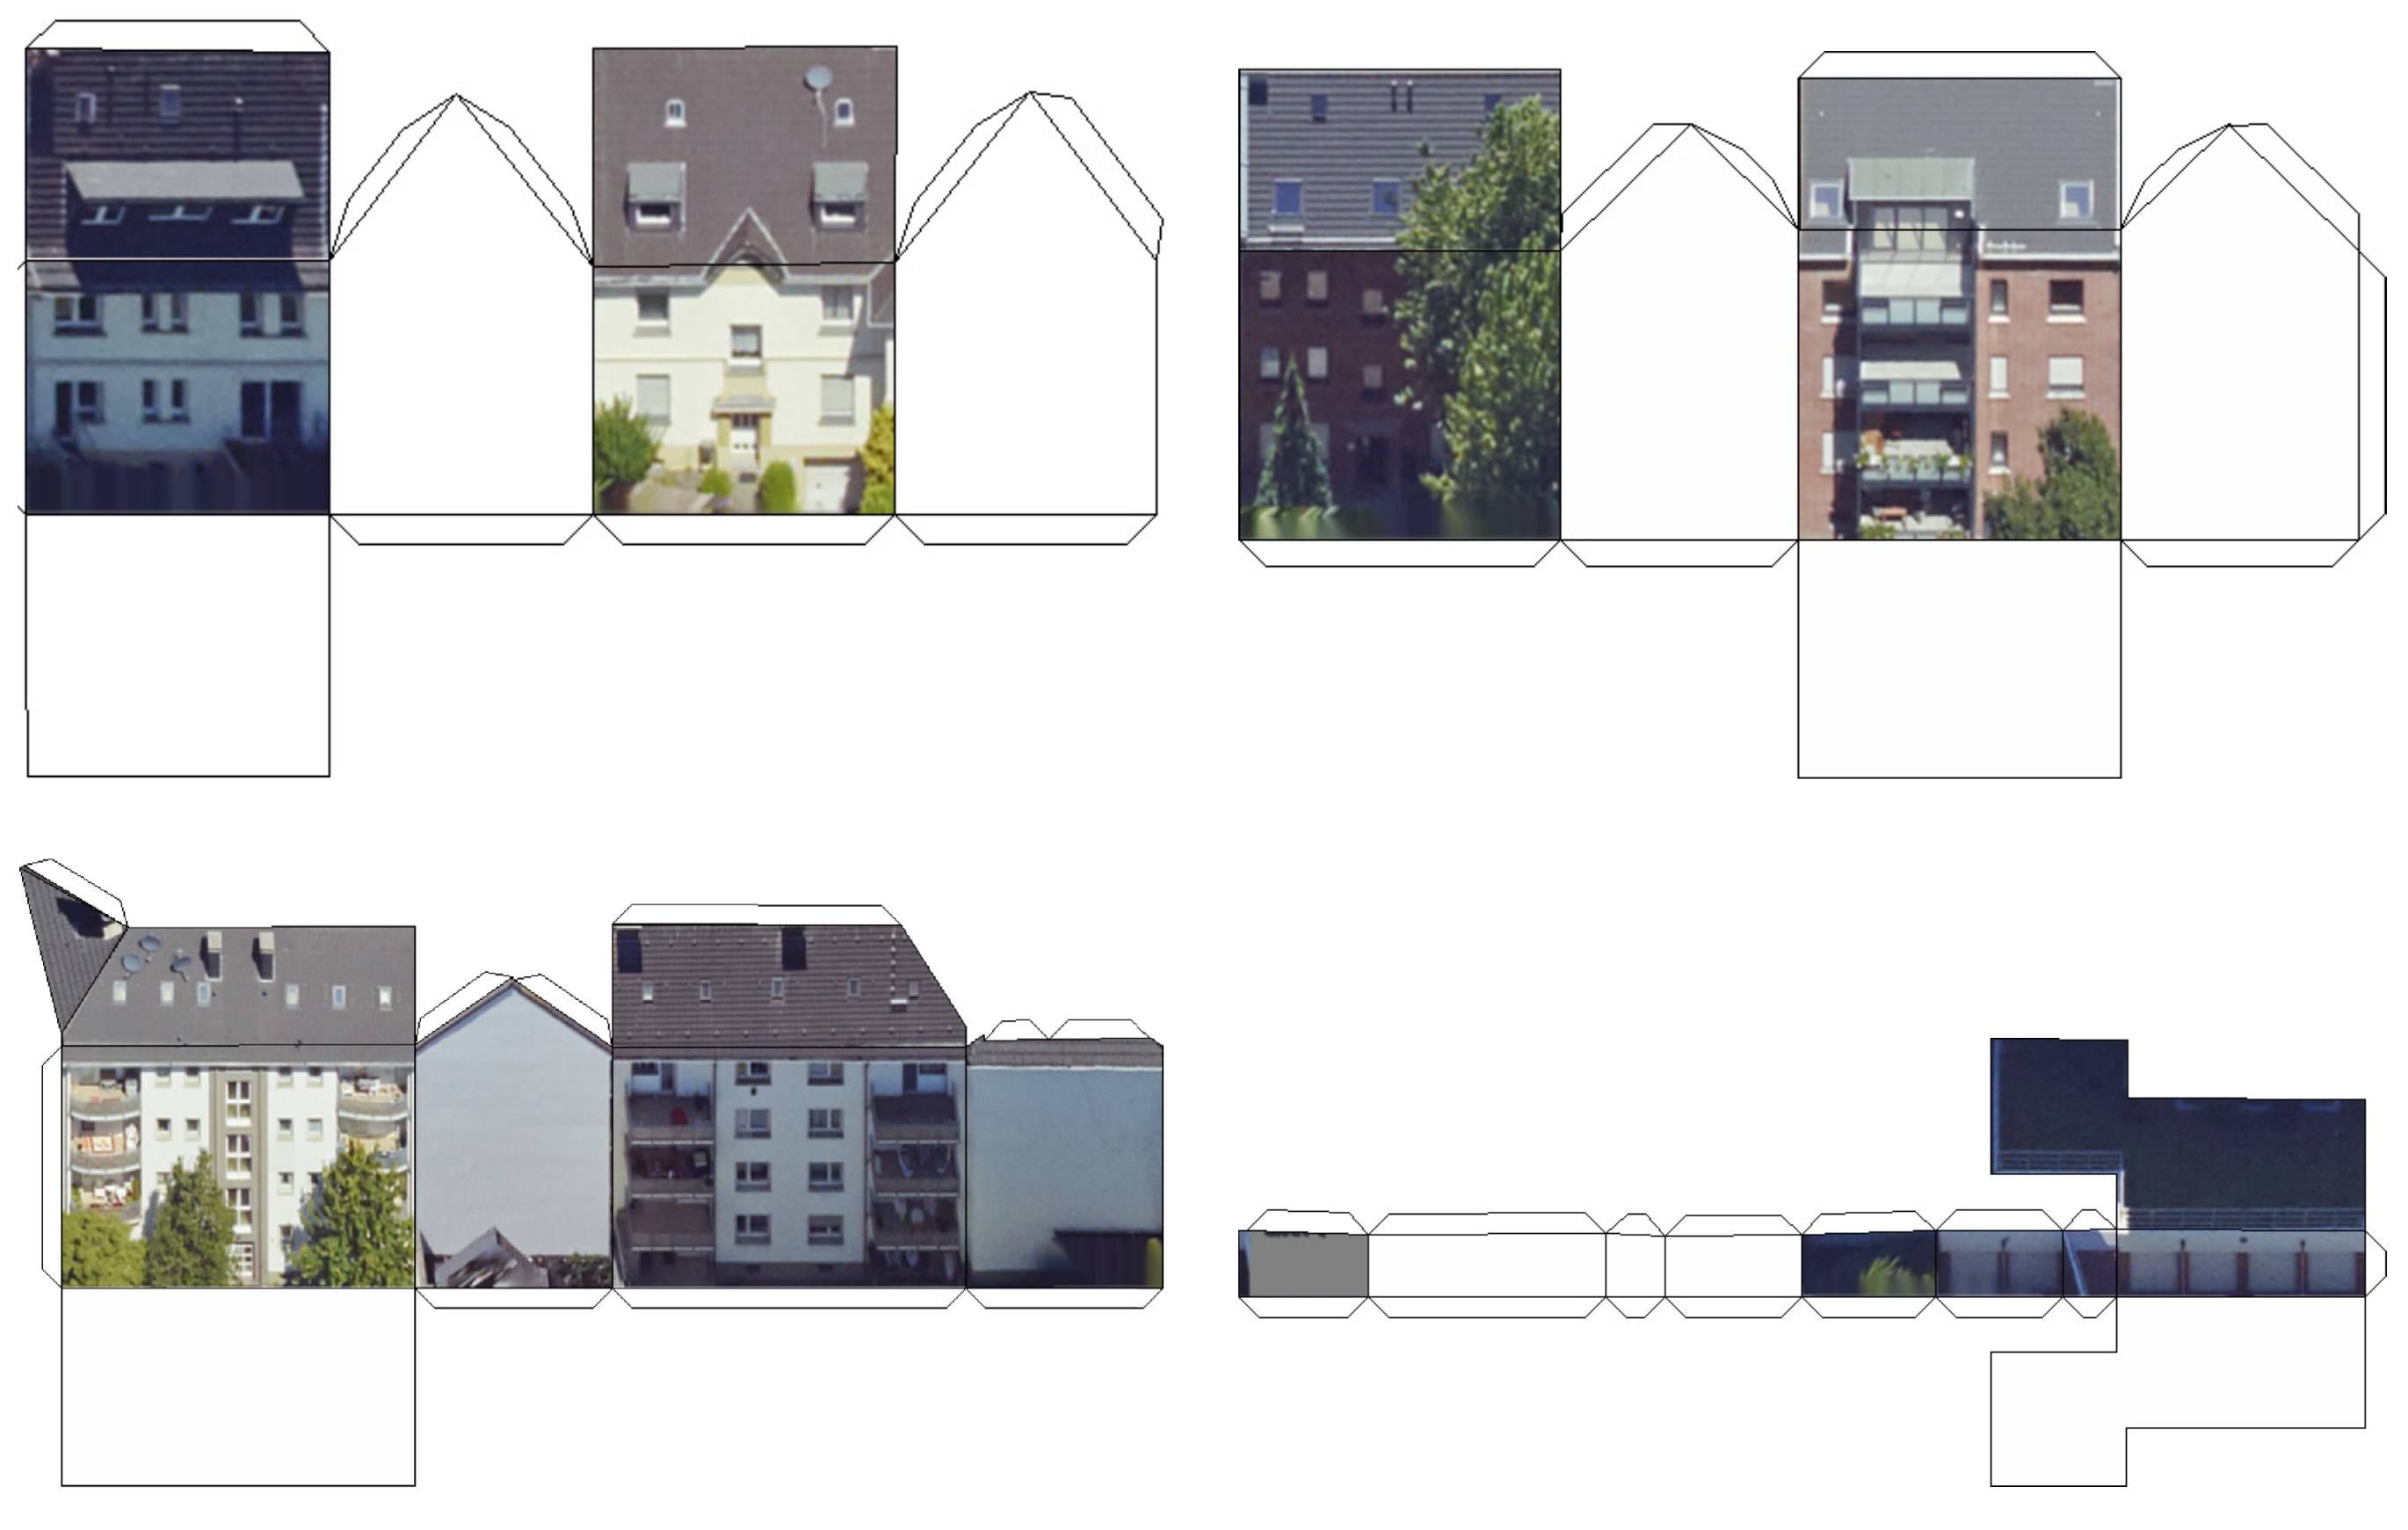
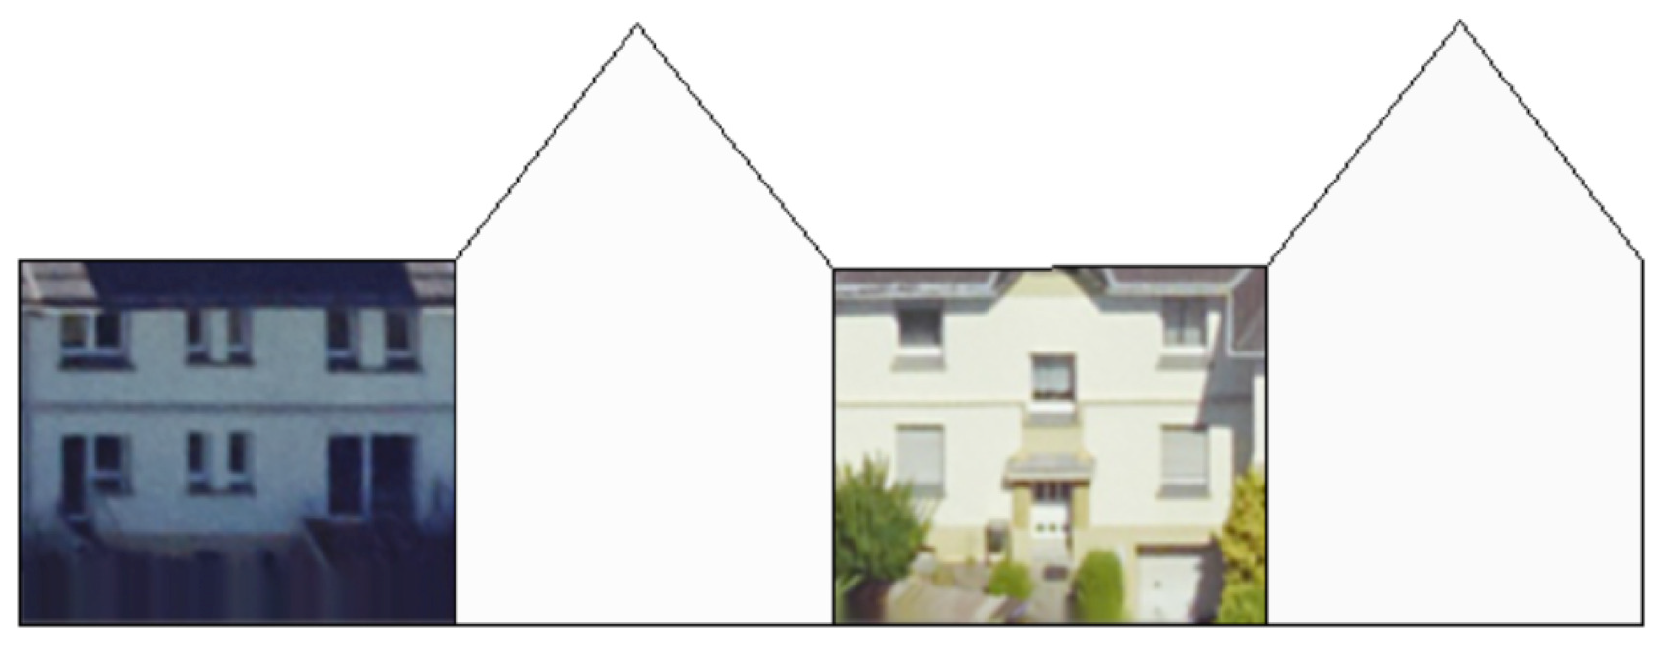
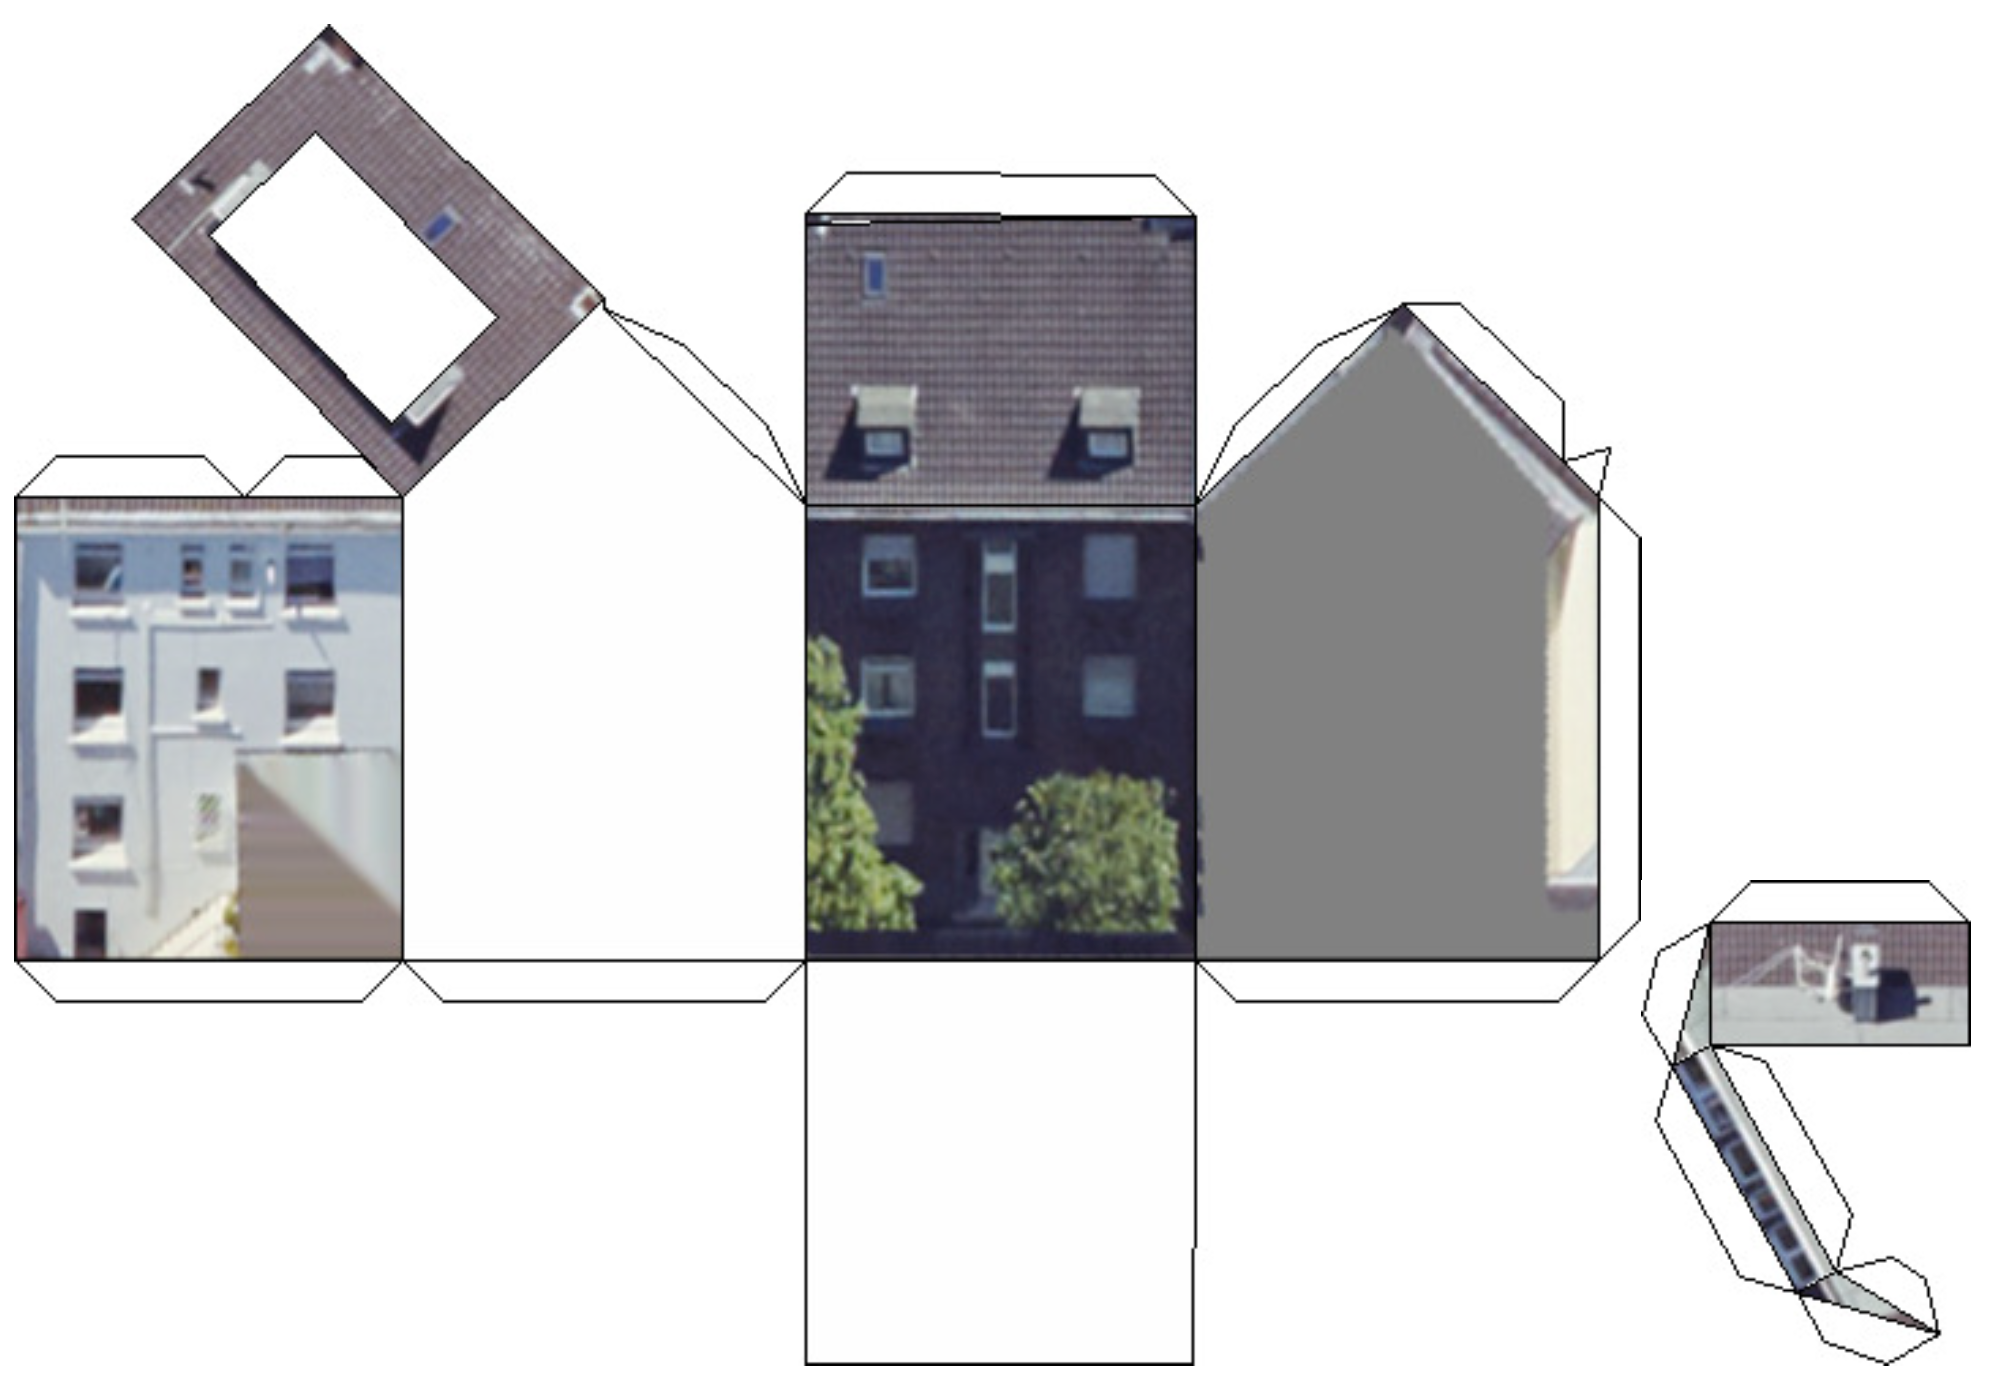
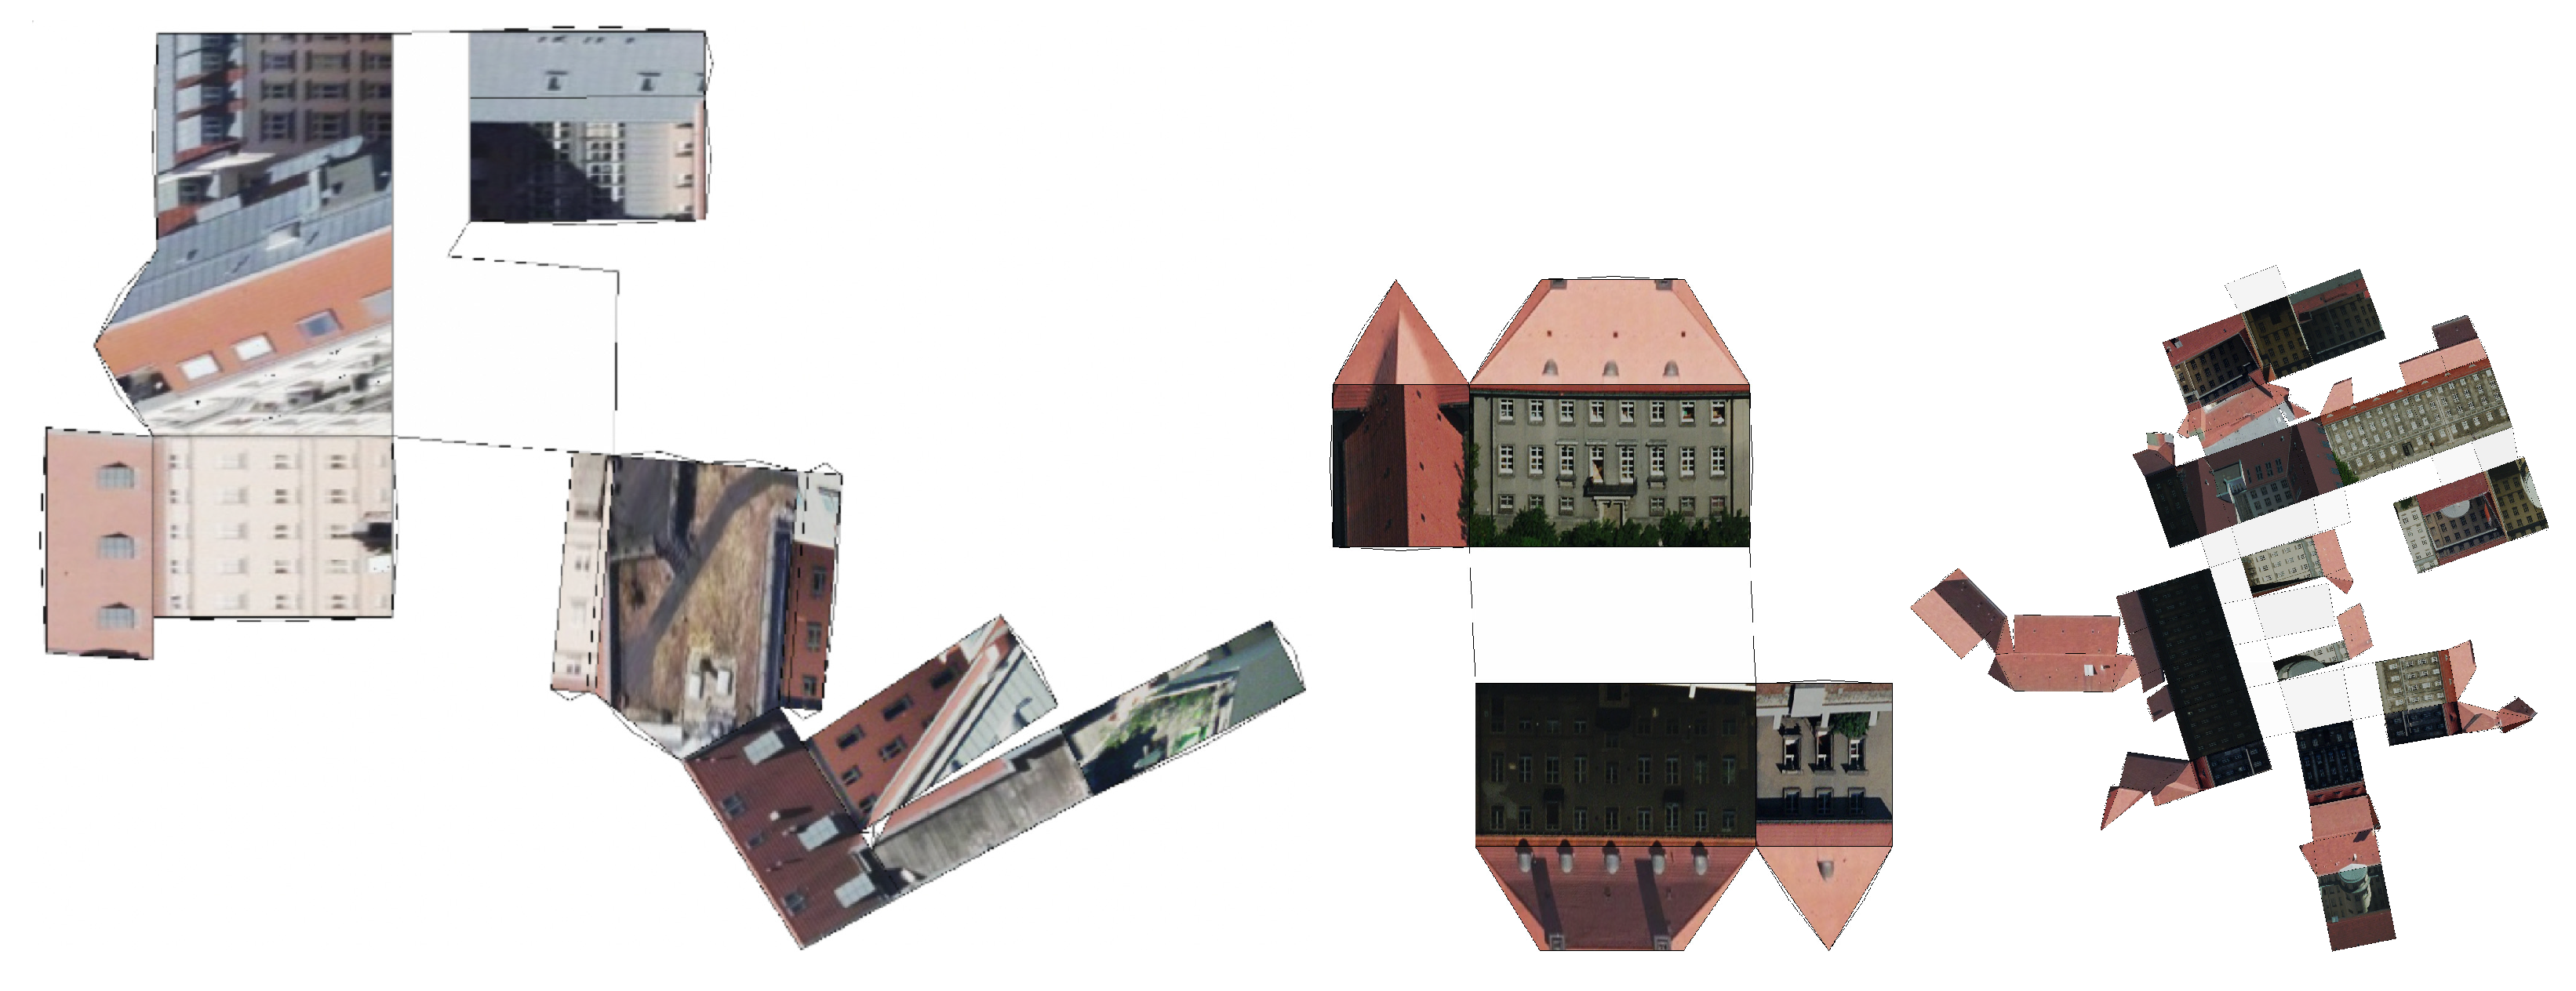
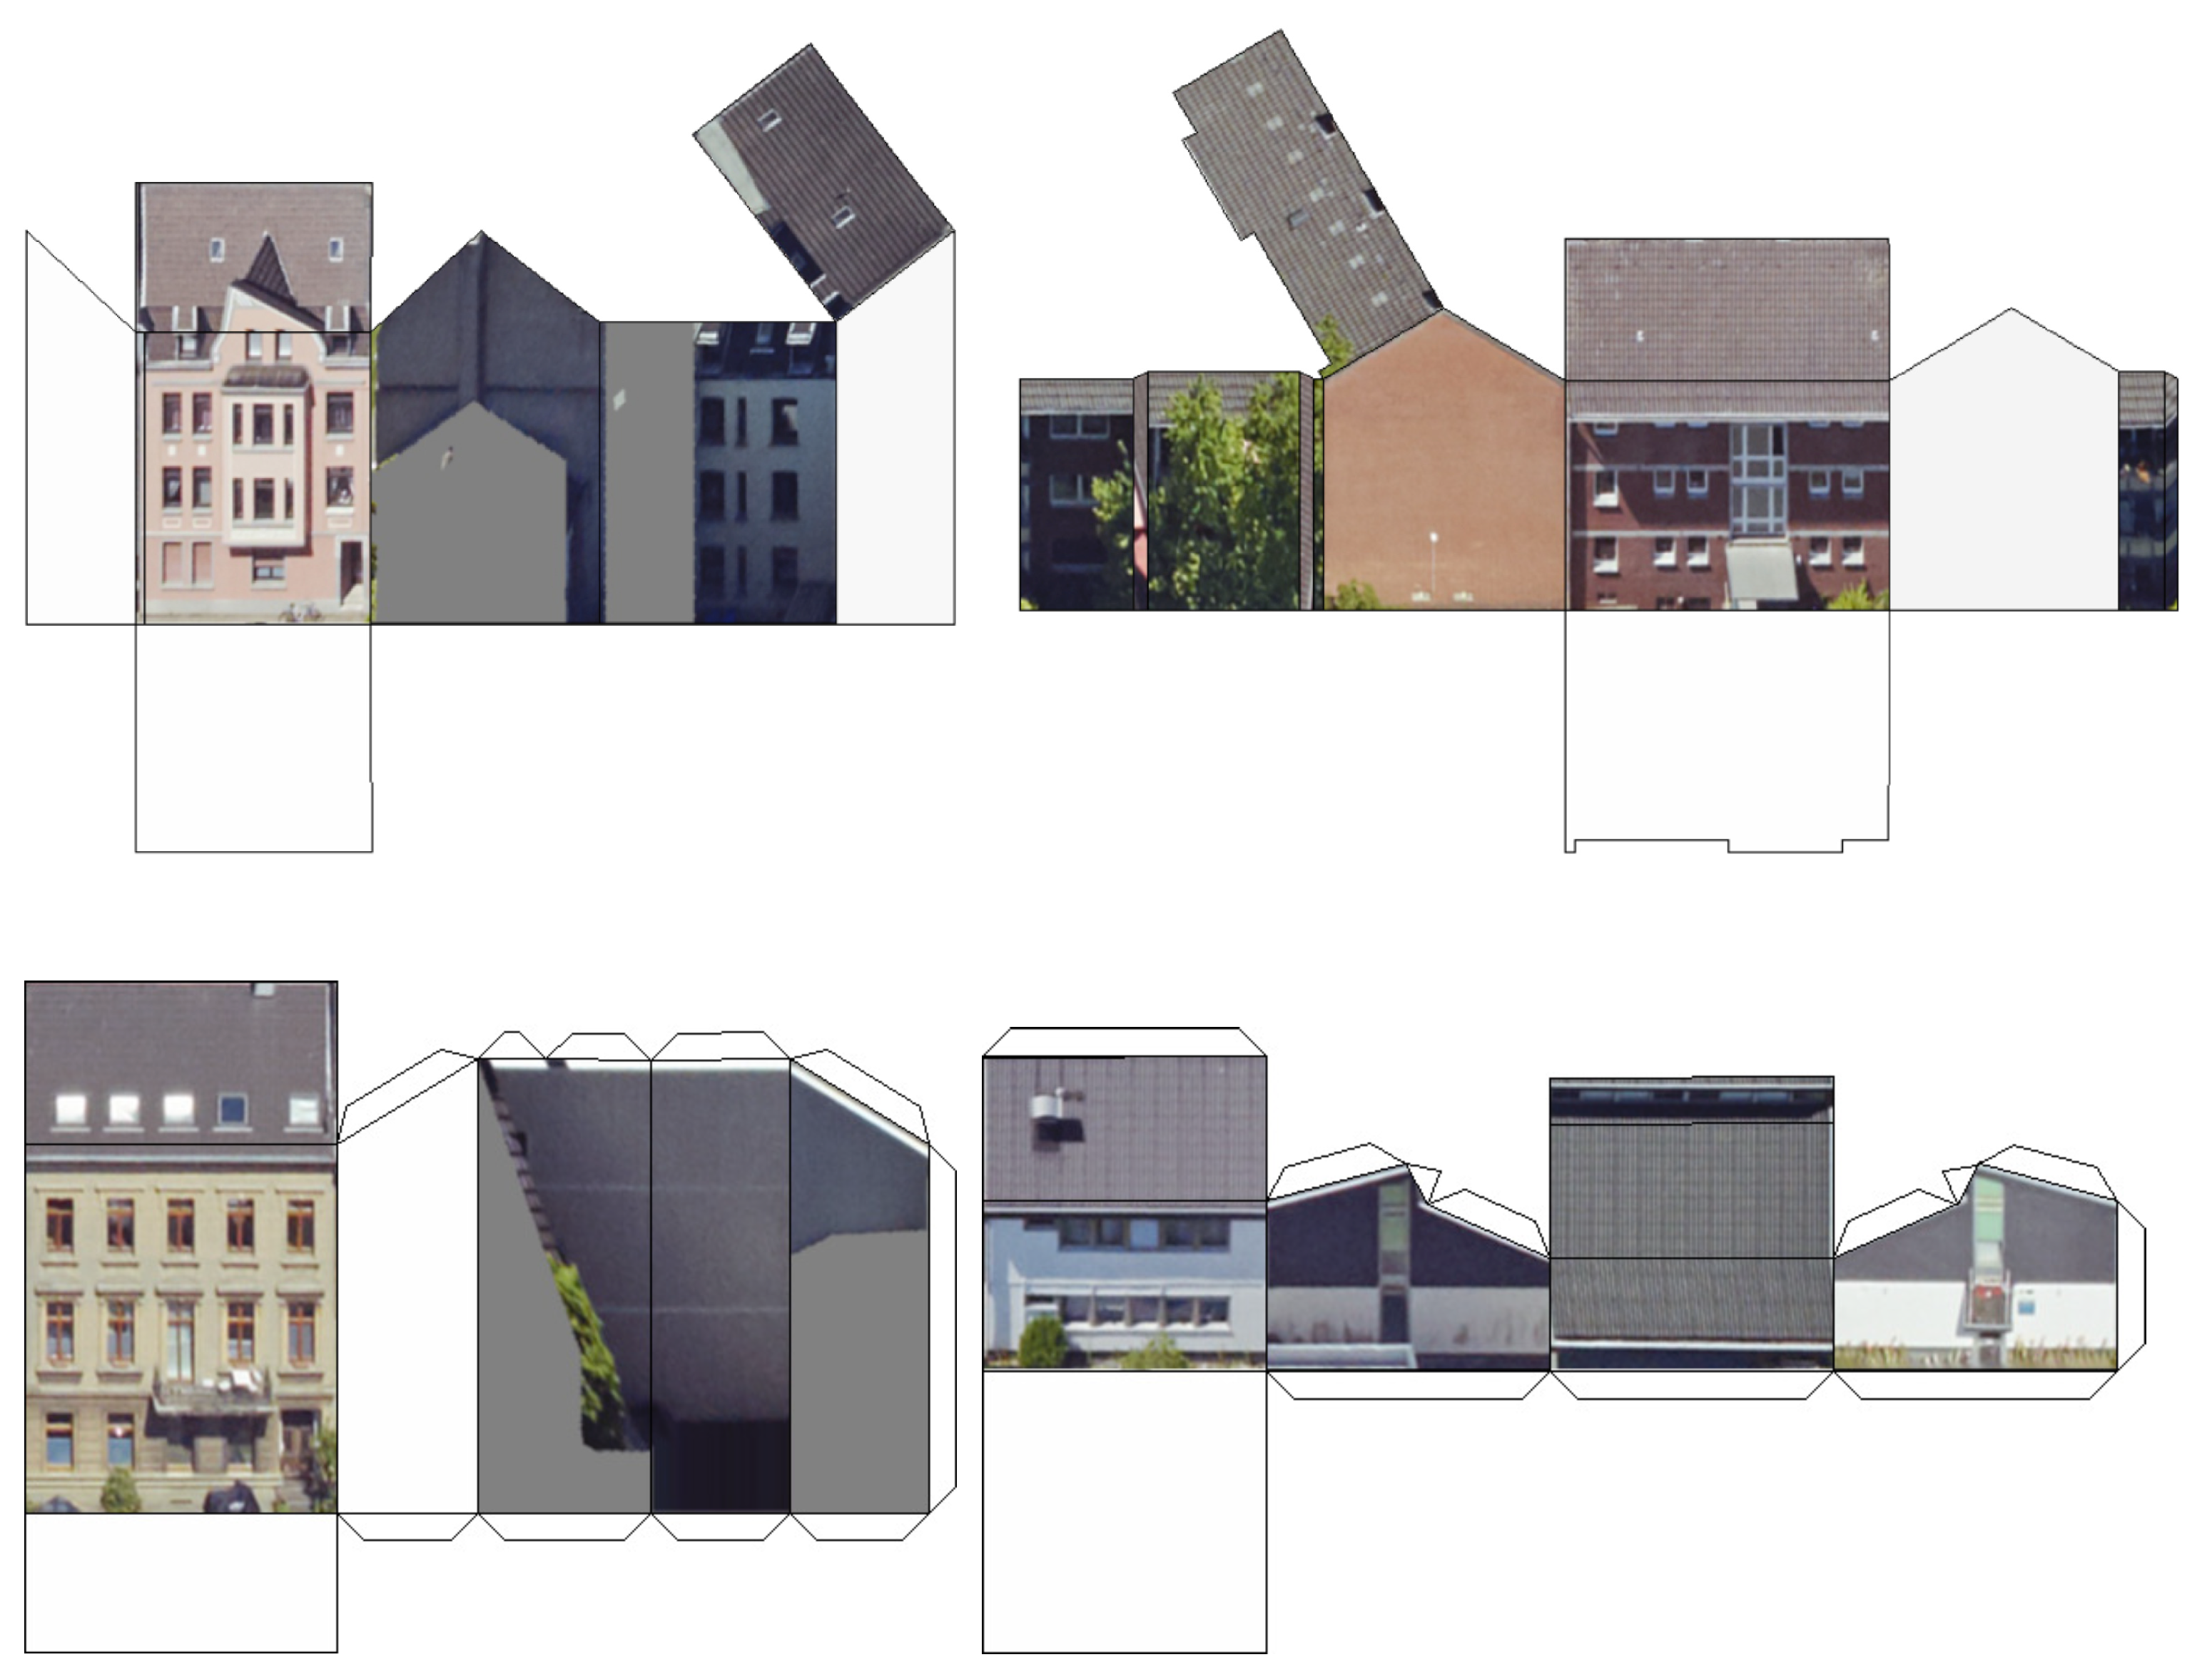
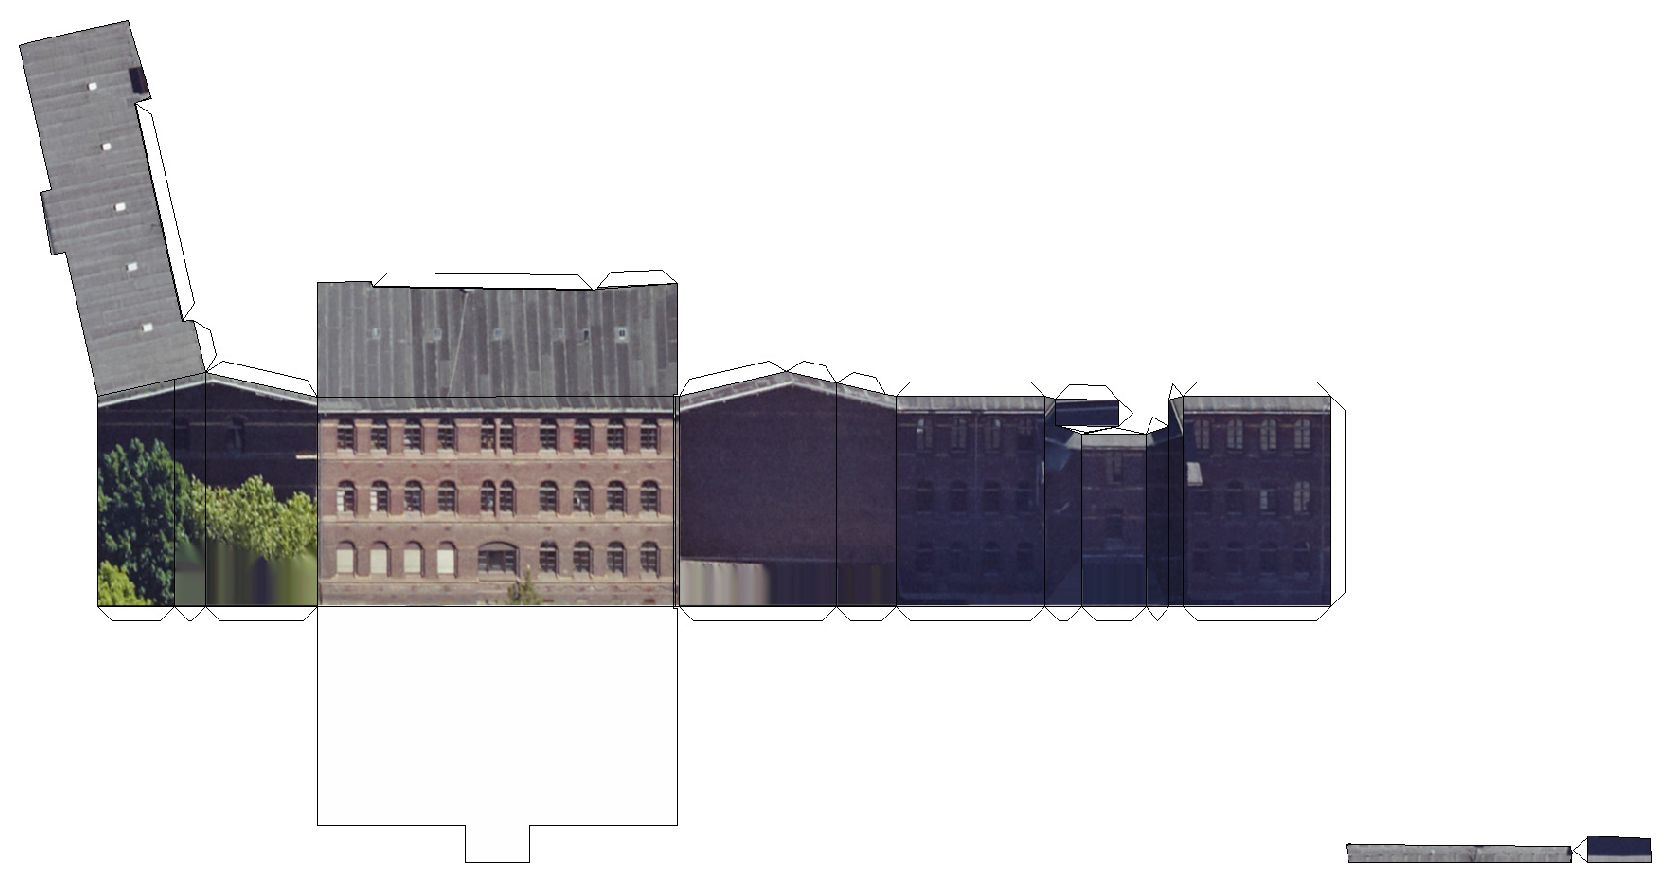
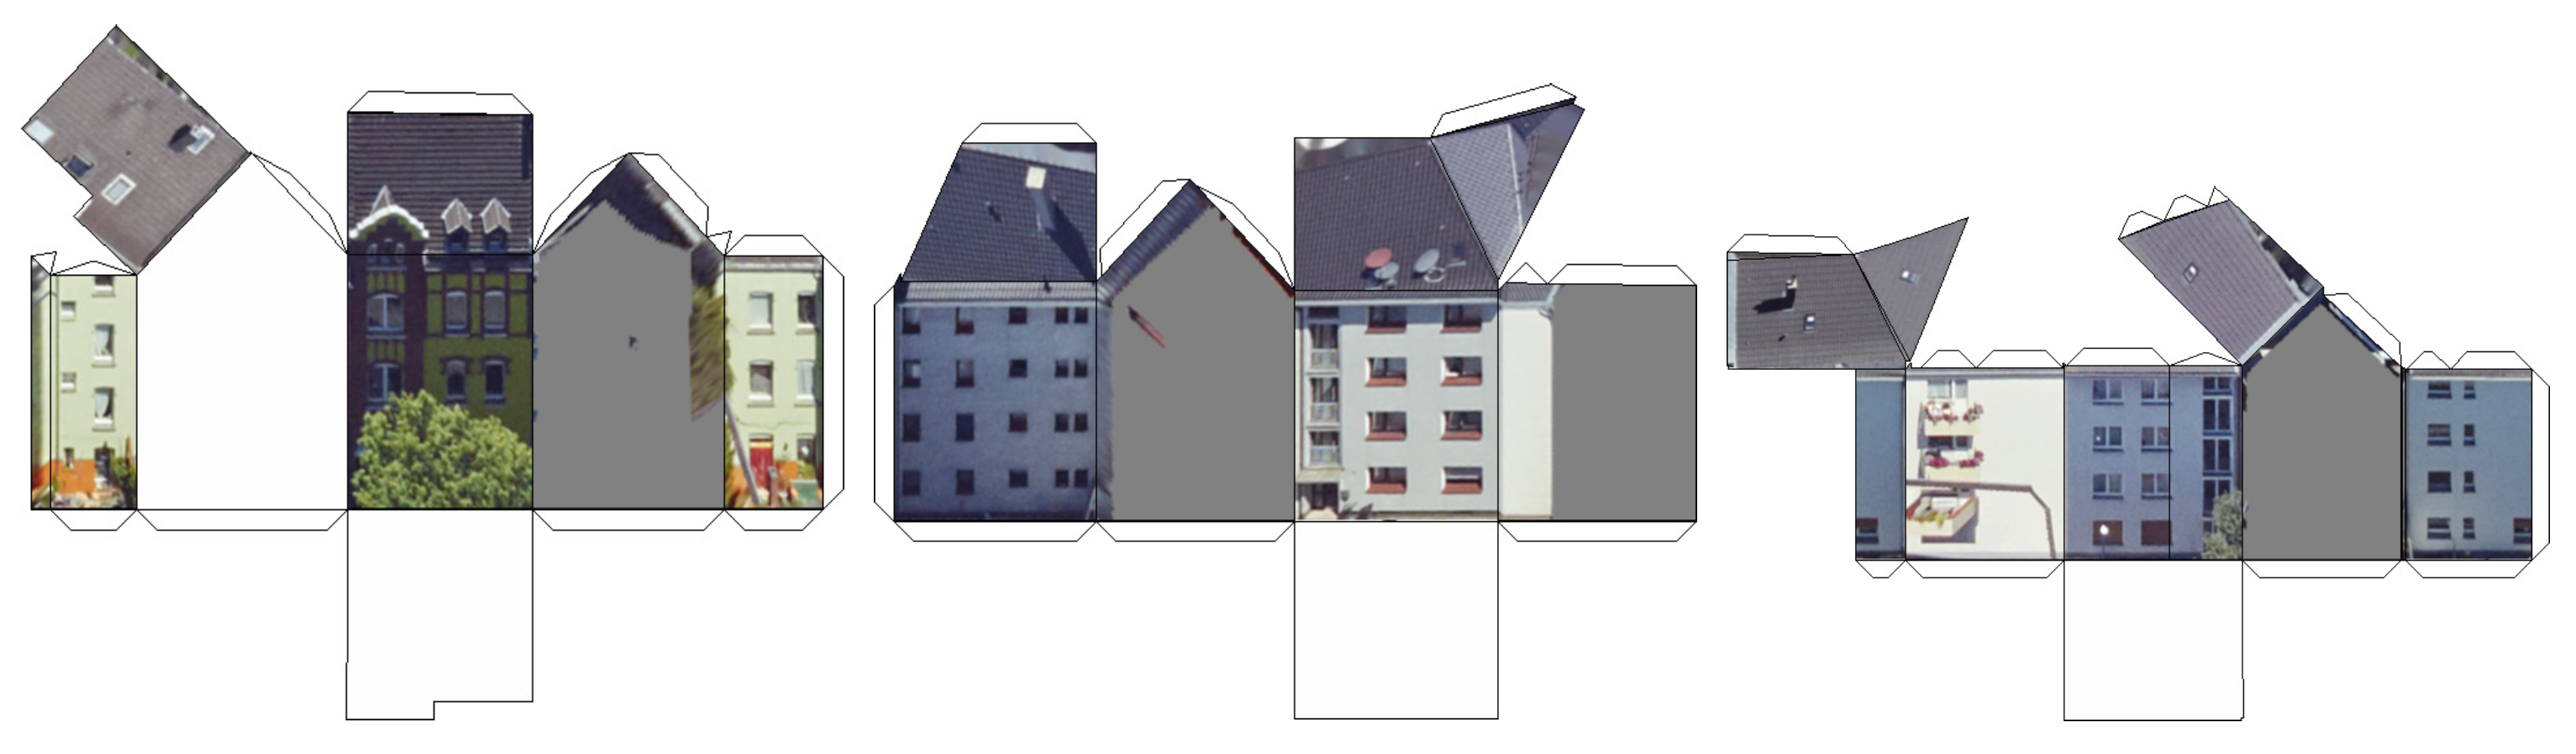
2.1. The Greedy Algorithm

In CityGML, buildings can be divided into building parts that can share opposite walls. Usually, only large buildings are split up into parts. Since 2D layouts of such buildings may not fit on a single page, the proposed algorithm computes a separate unfolding for each building part.
Let V be the set of vertices and E be the set of undirected edges of all polygons of a CityGML building part or building. The graph ( V , E ) describes the outer hull of the (watertight) object, it has exactly one connected component. Its dual graph ( V d , E d ) has a vertex set V d that consists of the CityGML polygons (the faces of graph ( V , E ) are now the vertices), and has a set of edges (1),
E d : = { { p 1 , p 2 } : p 1 p 2 V d have at least one common edge in E } .
The vertex set V d is the disjoint union of a set V d , G of ground plane polygons, a set V d , W of wall polygons, and a set V d , R of roof polygons. We assume that adjacent polygons lie in different planes. Otherwise, they must be merged before applying this algorithm. An unfolding of the CityGML object is a spanning tree of ( V d , E d ) . If and only if this tree has an edge between p 1 and p 2 , then the two polygons have at least one common fold edge in E. Then all common edges of p 1 and p 2 are fold edges and lie on a straight line. Edges in E that are no fold edges are cut edges.
Instead of a spanning tree, our greedy algorithm computes a spanning forest of non-overlapping unfoldings, see Algorithm 1. Unlike the algorithm in [11] that computes a minimal spanning tree of ( V d , E d ) first and then cuts it into a forest to fulfill the non-overlap condition, now the tree is successively constructed by adding new polygons until it can no longer grow due to overlaps. Then a new tree is started.
Polygons are allowed to have openings (interior polygons) in CityGML. Such openings are usually too small to accommodate another polygon along with a neighbor or a glue tab. Therefore, polygons that are adjacent to edges of an inner polygon are not treated within the same tree as in which the inner polygon is considered.
Algorithm 1 Greedy Unfolding
  • componentNo = 0
  • while unprocessed polygons exist do
  •     componentNo:=componentNo+1
  •     Initialize new output image
  •     if componentNo = 1  then
  •         Find a largest ground plane face p G
  •         Find a wall polygon p adjacent to longest edge of p G
  •         Draw p as the first polygon to the output image
  •         while attachable wall polygons exist do
  •                      ▹ An attachable wall polygon is so far not drawn, with an edge adjacent to a drawn wall
  •                                                                   ▹ polygon, such that it can be attached in 2D without overlaps
  •            Draw this polygon attached to the adjacent edge
  •     else
  •         Find a polygon p with largest area size
  •         Draw p as the first polygon to the output image
  •     added : = 1
  •     while added do
  •         added=0;
  •         for all remaining polygons p in descending area size do
  •            Edges e E of p are determined which are also edges of a polygon q already drawn in the
  •               current output image
  •            for each such edge e in descending order (2) do
  •                if p can be attached at e without overlaps then
  •                    Draw polygon p into the output image
  •                    added = 1
CityGML building models have ground plane polygons p G V d , G . All wall polygons p W V d , W , which have vertices with a (largest) ground plane face p G in common, i.e., { p G , p W } E d , can be linked to form an initial tree that is a sub-graph of ( V d , E d ) . Two-wall polygons p W , 1 and p W , 2 can be connected with an edge if and only if they share a common vertex v V with p G , i.e., v is a vertex of all three polygons. The greedy algorithm (Algorithm 1) starts with a wall polygon adjacent to a longest edge of p G , and then iteratively adds more wall polygons until all adjacent polygons are added to the tree or until overlaps occur, see Figure 4. By definition, an unfolding is a spanning tree of the dual graph. It is not guaranteed that cutting along the cut edges and folding along fold edges will result in a planar layout in which polygons do not overlap. This has to be checked additionally (see below).
Iteratively, further polygons p V d are added to the initial tree. For this purpose, the remaining polygons are sorted and processed in descending order by area size. For each of these polygons p, those of its edges e E are determined, which are also edges of a polygon q already added as a vertex in the tree. These edges e are sorted in descending order by a combination of edge length l, type of the matching polygon q, and number of common edges between the two polygons p and q. Edges e with wall and ground plane polygons q V d , W V d , G have a higher priority t = 10 than with roof polygons q V d , R where t = 1 . Thus, roof planes are attached to wall polygons whenever possible. This leads to a compact print size and, if possible, avoids chains of roof polygons on the paper. If the two polygons p and q share more than one edge e, then they are weighted with a low priority m = 0.01 because it might be difficult to later add other polygons between the different shared edges. Otherwise, m is set to one. The overall priority is:
l × t × m .
During the iterative tree assembly, a 2D representation of the unfolding is maintained. The vertices of each considered polygon are projected into the two-dimensional space by computing coordinates with respect to two orthogonal vectors that span the plane of the polygon. In the 2D space, affine transformations are then applied to connect projected polygons along fold edges.
In the described sequence of selected edges e of p, the algorithm tries to extend the tree by connecting p if possible. To this end, checks have to be performed to identify overlaps. Thus, intersection points between 2D edges of p and all other 2D edges so far belonging to polygons of the tree are computed (with the exception of the potential fold edge e used for the connection). In addition, (partially) overlapping edges on a same straight line with the projection of e have to be considered. If there exists an intersection point, the polygon p cannot be connected in this way, and its next selected edge is examined instead.
With this procedure, an attempt is made to connect each remaining polygon with those already present in the tree, see Figure 3. If it succeeds for at least one polygon, the procedure is repeated, as there are now new polygons to connect to.
For most buildings, a single tree and thus a non-overlapping unfolding can be constructed. However, if polygons remain, the largest remaining one is selected, and then the procedure is repeated with this new seed to generate a forest. This happens especially when a polygon has an opening since then the edges of the opening are not considered in the unfolding process, see Figure 5.
Each tree of the forest is used to draw a separate image of the corresponding part of the unfolded model, see Figure 6. Textures are added to polygons in CityGML via the appearance model. They are positioned with an UV mapping using 2D coordinates for each polygon vertex. For simplicity however, we assume that texture coordinates are limited to the interval [ 0 , 1 ] × [ 0 , 1 ] such that no repetitive patterns occur. Such patterns should not occur in automatically textured models from oblique aerial images. Instead of the UV mapping, an affine transform based on three iteratively selected polygon points and their corresponding texture coordinates is applied. After choosing a first point with a smallest x-coordinate, the other points are chosen such that the minimum distance from the previously selected points is maximal. The drawn 2D polygon is filled with the transformed texture image.
Pairs of cut edges separated by unfolding require a glue tab. This must be placed on one of the two corresponding 2D edges in a layout image. To do this, different sizes and shapes of glue tabs are tried iteratively and each is checked for intersections with polygon edges as well as with edges of other glue tabs in the output image. If an intersection occurs, the next smaller size is selected. Building edges shorter than one meter are not given a glue tab.
To print with exact scaling, the typesetting system LaTeX can be used. LaTeX allows to scale included images exactly by specifying the unit truecm. If the page size is exceeded, the 2D layout has to be divided into smaller pieces. This is done by cutting a bounding rectangle into pieces. For optimal positioning of the pieces on the paper, a 2D bin packing problem can be solved, see [11].

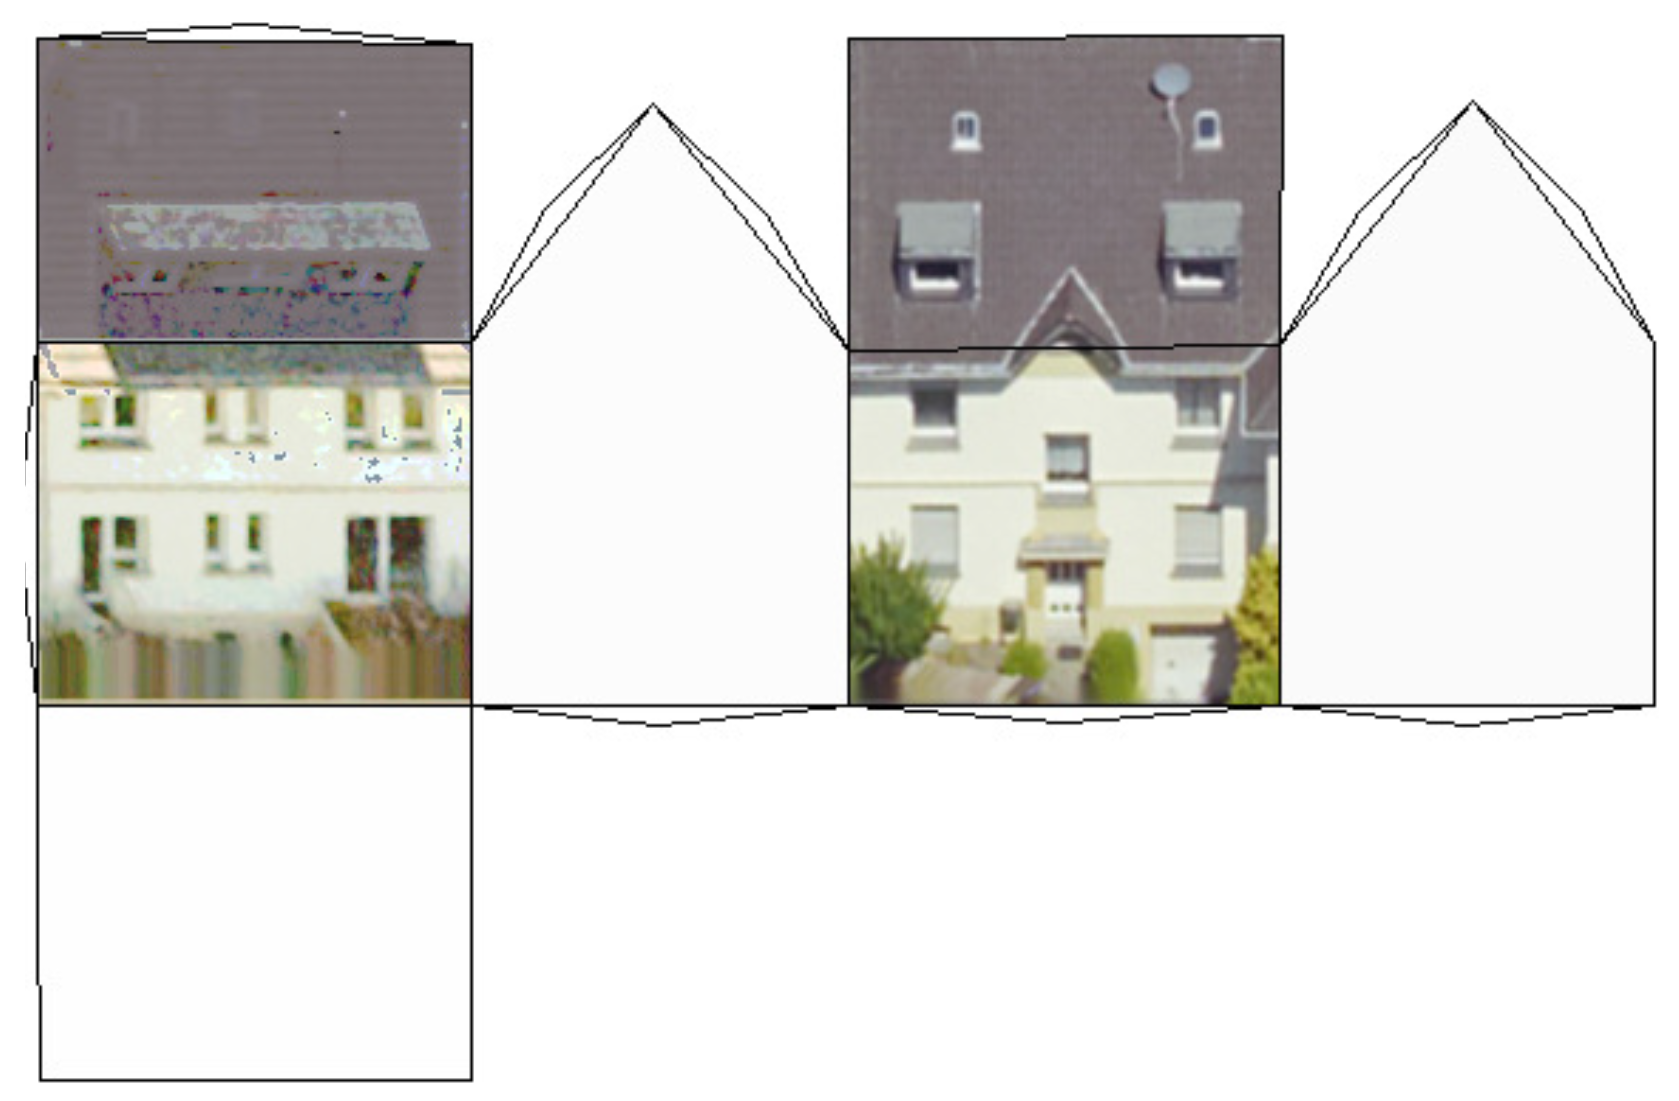
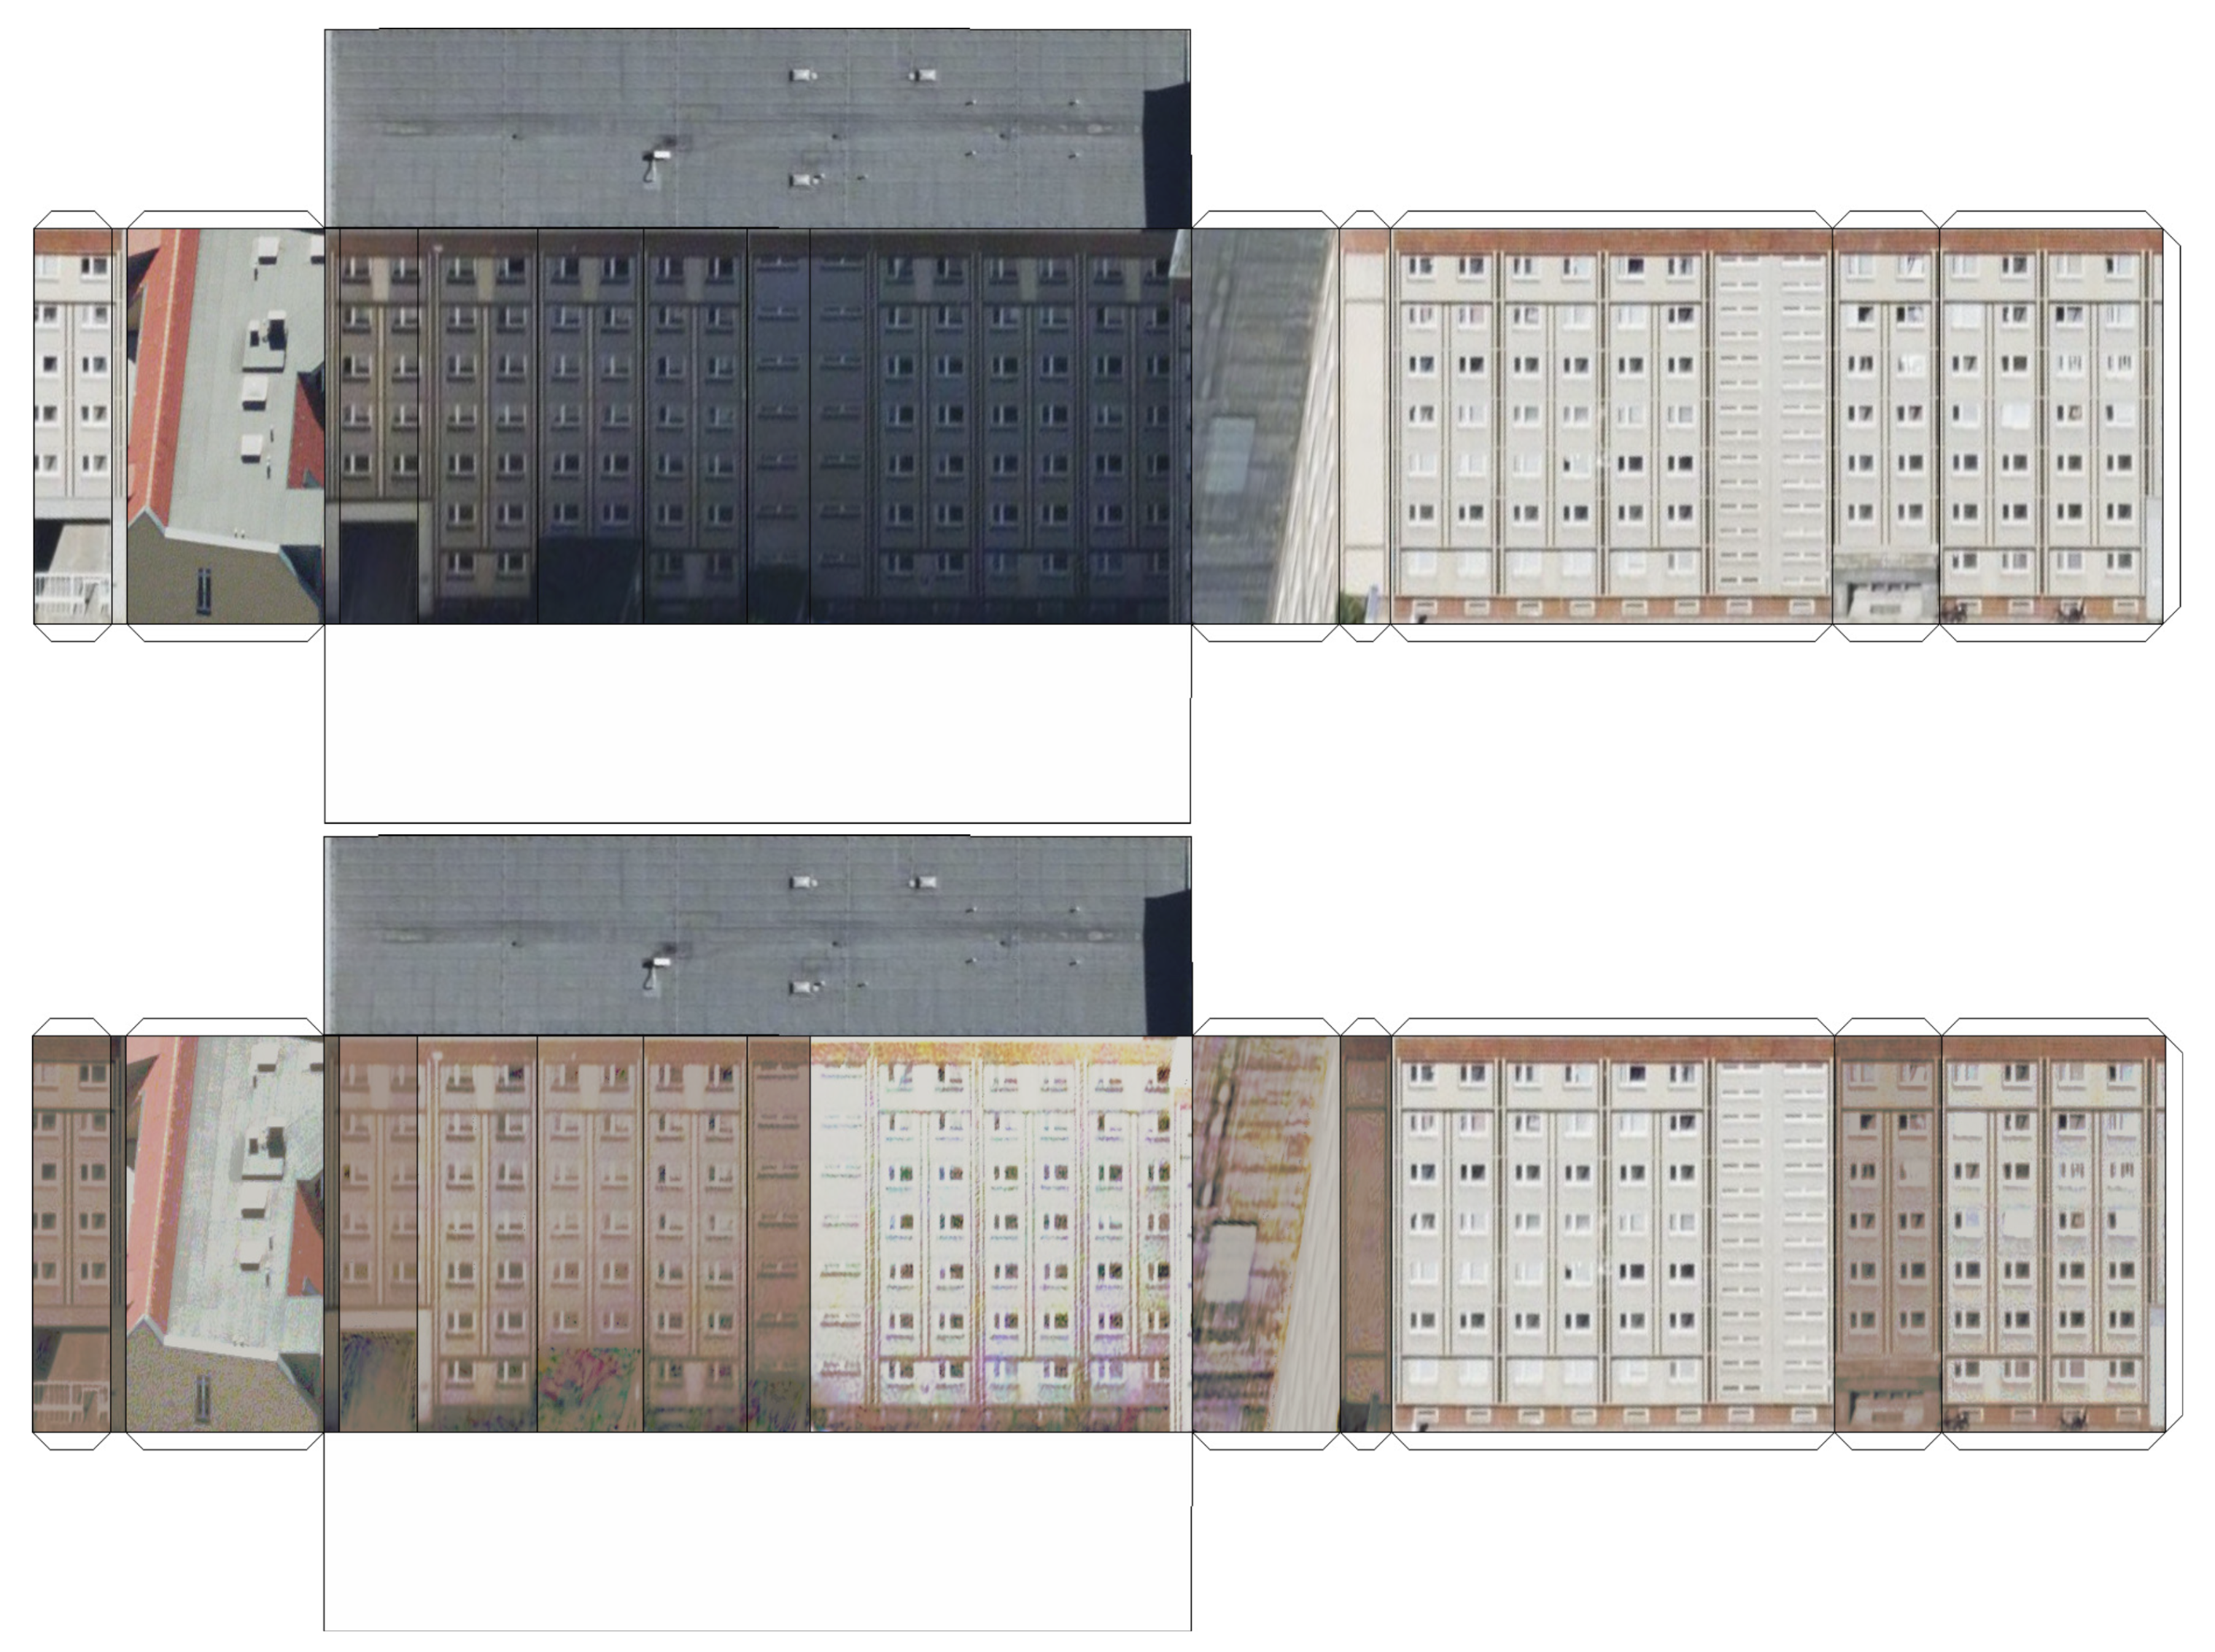
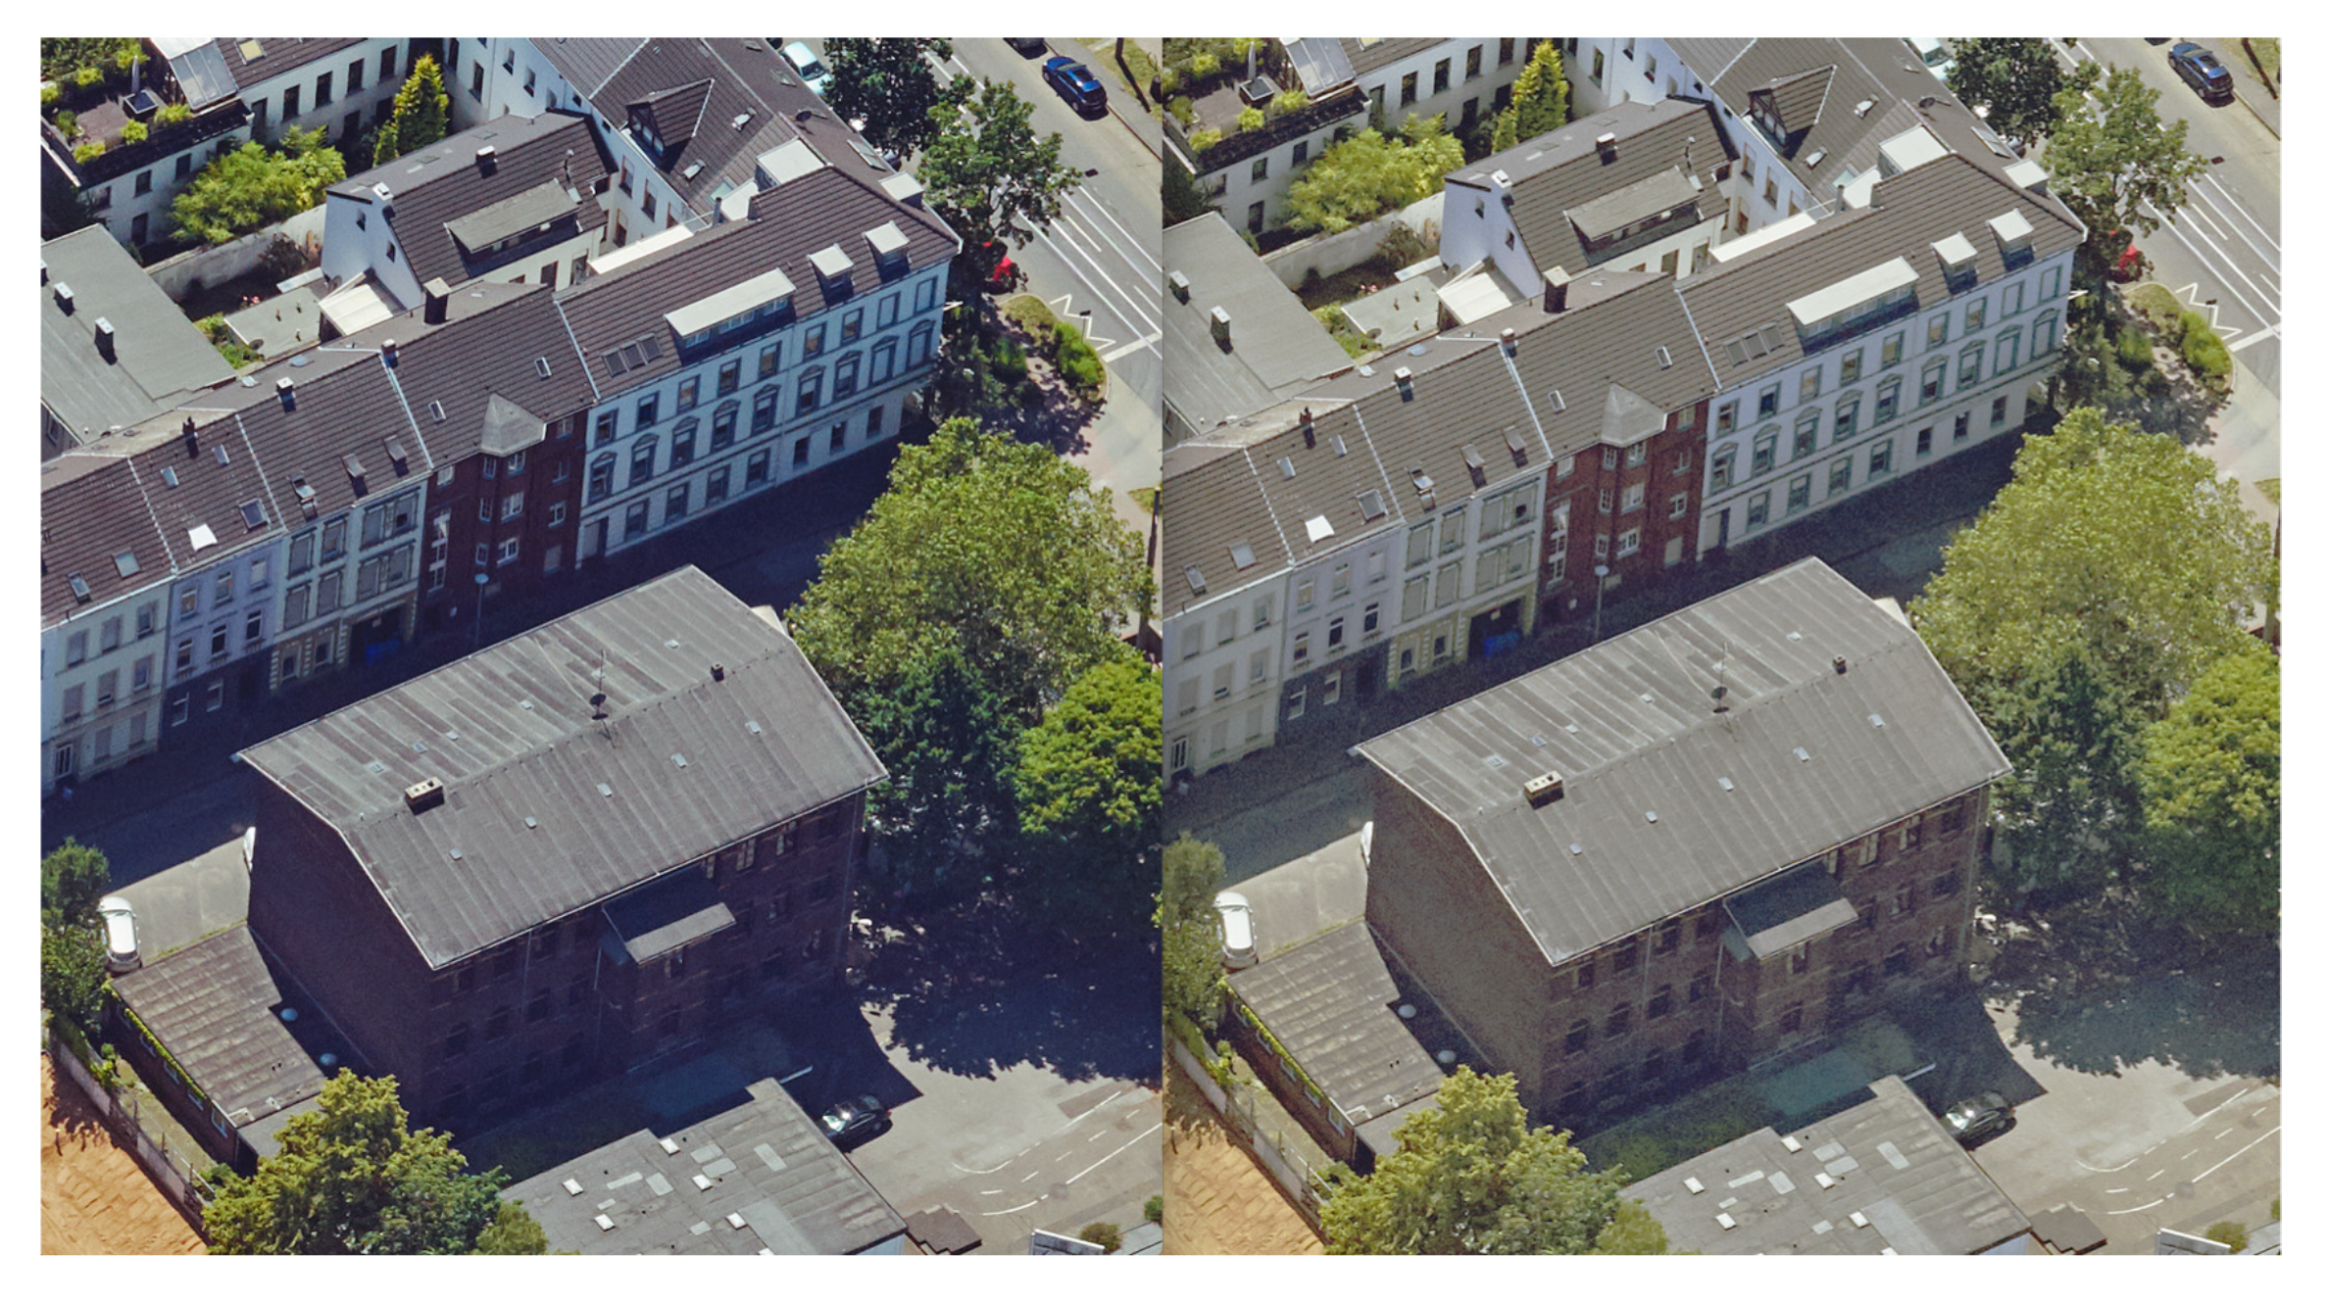
2.2. Data Preparation

We tested the algorithm with single buildings from the textured Berlin LoD 2 CityGML data and a textured LoD 2 city model of Dortmund. These buildings were chosen because of their texture quality. To show that performance is no issue, we also applied the algorithm to all 6485 building parts of two square kilometers of LoD 2 buildings within the interval [330,000; 5,688,000] × [331,000; 5,690,000] of UTM coordinates in zone 32U. This is the area around our institute in Krefeld. The Berlin model is freely available (Berlin Partner für Wirtschaft und Technologie GmbH, https://www.businesslocationcenter.de/downloadportal/ (accessed on 23 November 2021)). Disadvantages of this model are the low resolution of the textures and the fact that the footprint areas are often divided into several ground plane polygons. This can lead to multiple layout images, even if the building can be represented by one. Therefore, we computed are own textured models based on oblique aerial images obtained with IGI UrbanMapper digital aerial survey cameras. The cities of Dortmund and Krefeld supported us not only with these images, but also with meta data indicating camera positions and camera parameters. With these parameters, we applied a perspective transform to match an image area with a CityGML polygon of an LoD 2 city model that was derived with the algorithm in [17] from cadastral footprints and airborne laser scanning point clouds that are available from the state cadastral office of the German state, North Rhine-Westphalia (https://www.bezreg-koeln.nrw.de/brk_internet/geobasis/hoehenmodelle/3d-messdaten/index.html (accessed on 23 November 2021)). The perspective transform was applied before storing the texture images. That allowed us to correctly replace the UV mapping by an affine transform when drawing 2D layouts. The obtained textures had a resolution of more than 100 pixels per square meter. Besides projecting images to model faces, we also identified occluded areas that were then not textured. This is in contrast to the Berlin model, in which all walls are textured, such that occluded segments show perspective distortions, see Figure 7.
Leaving occluded wall and roof segments blank reduces printing costs and actually looks better. This also reveals texture errors, as they can be distinguished from occlusion artifacts. In Figure 5, Figure 6, Figure 7 and Figure 8, occluded areas of partially hidden walls are gray while fully occluded walls are white. To determine occluded areas, we drew the CityGML model with camera parameters of an oblique aerial image by using a Z-buffer. Each facet was assigned a unique color as ID, see Figure 9. Within a drawn polygon, only areas with its corresponding color were visible.

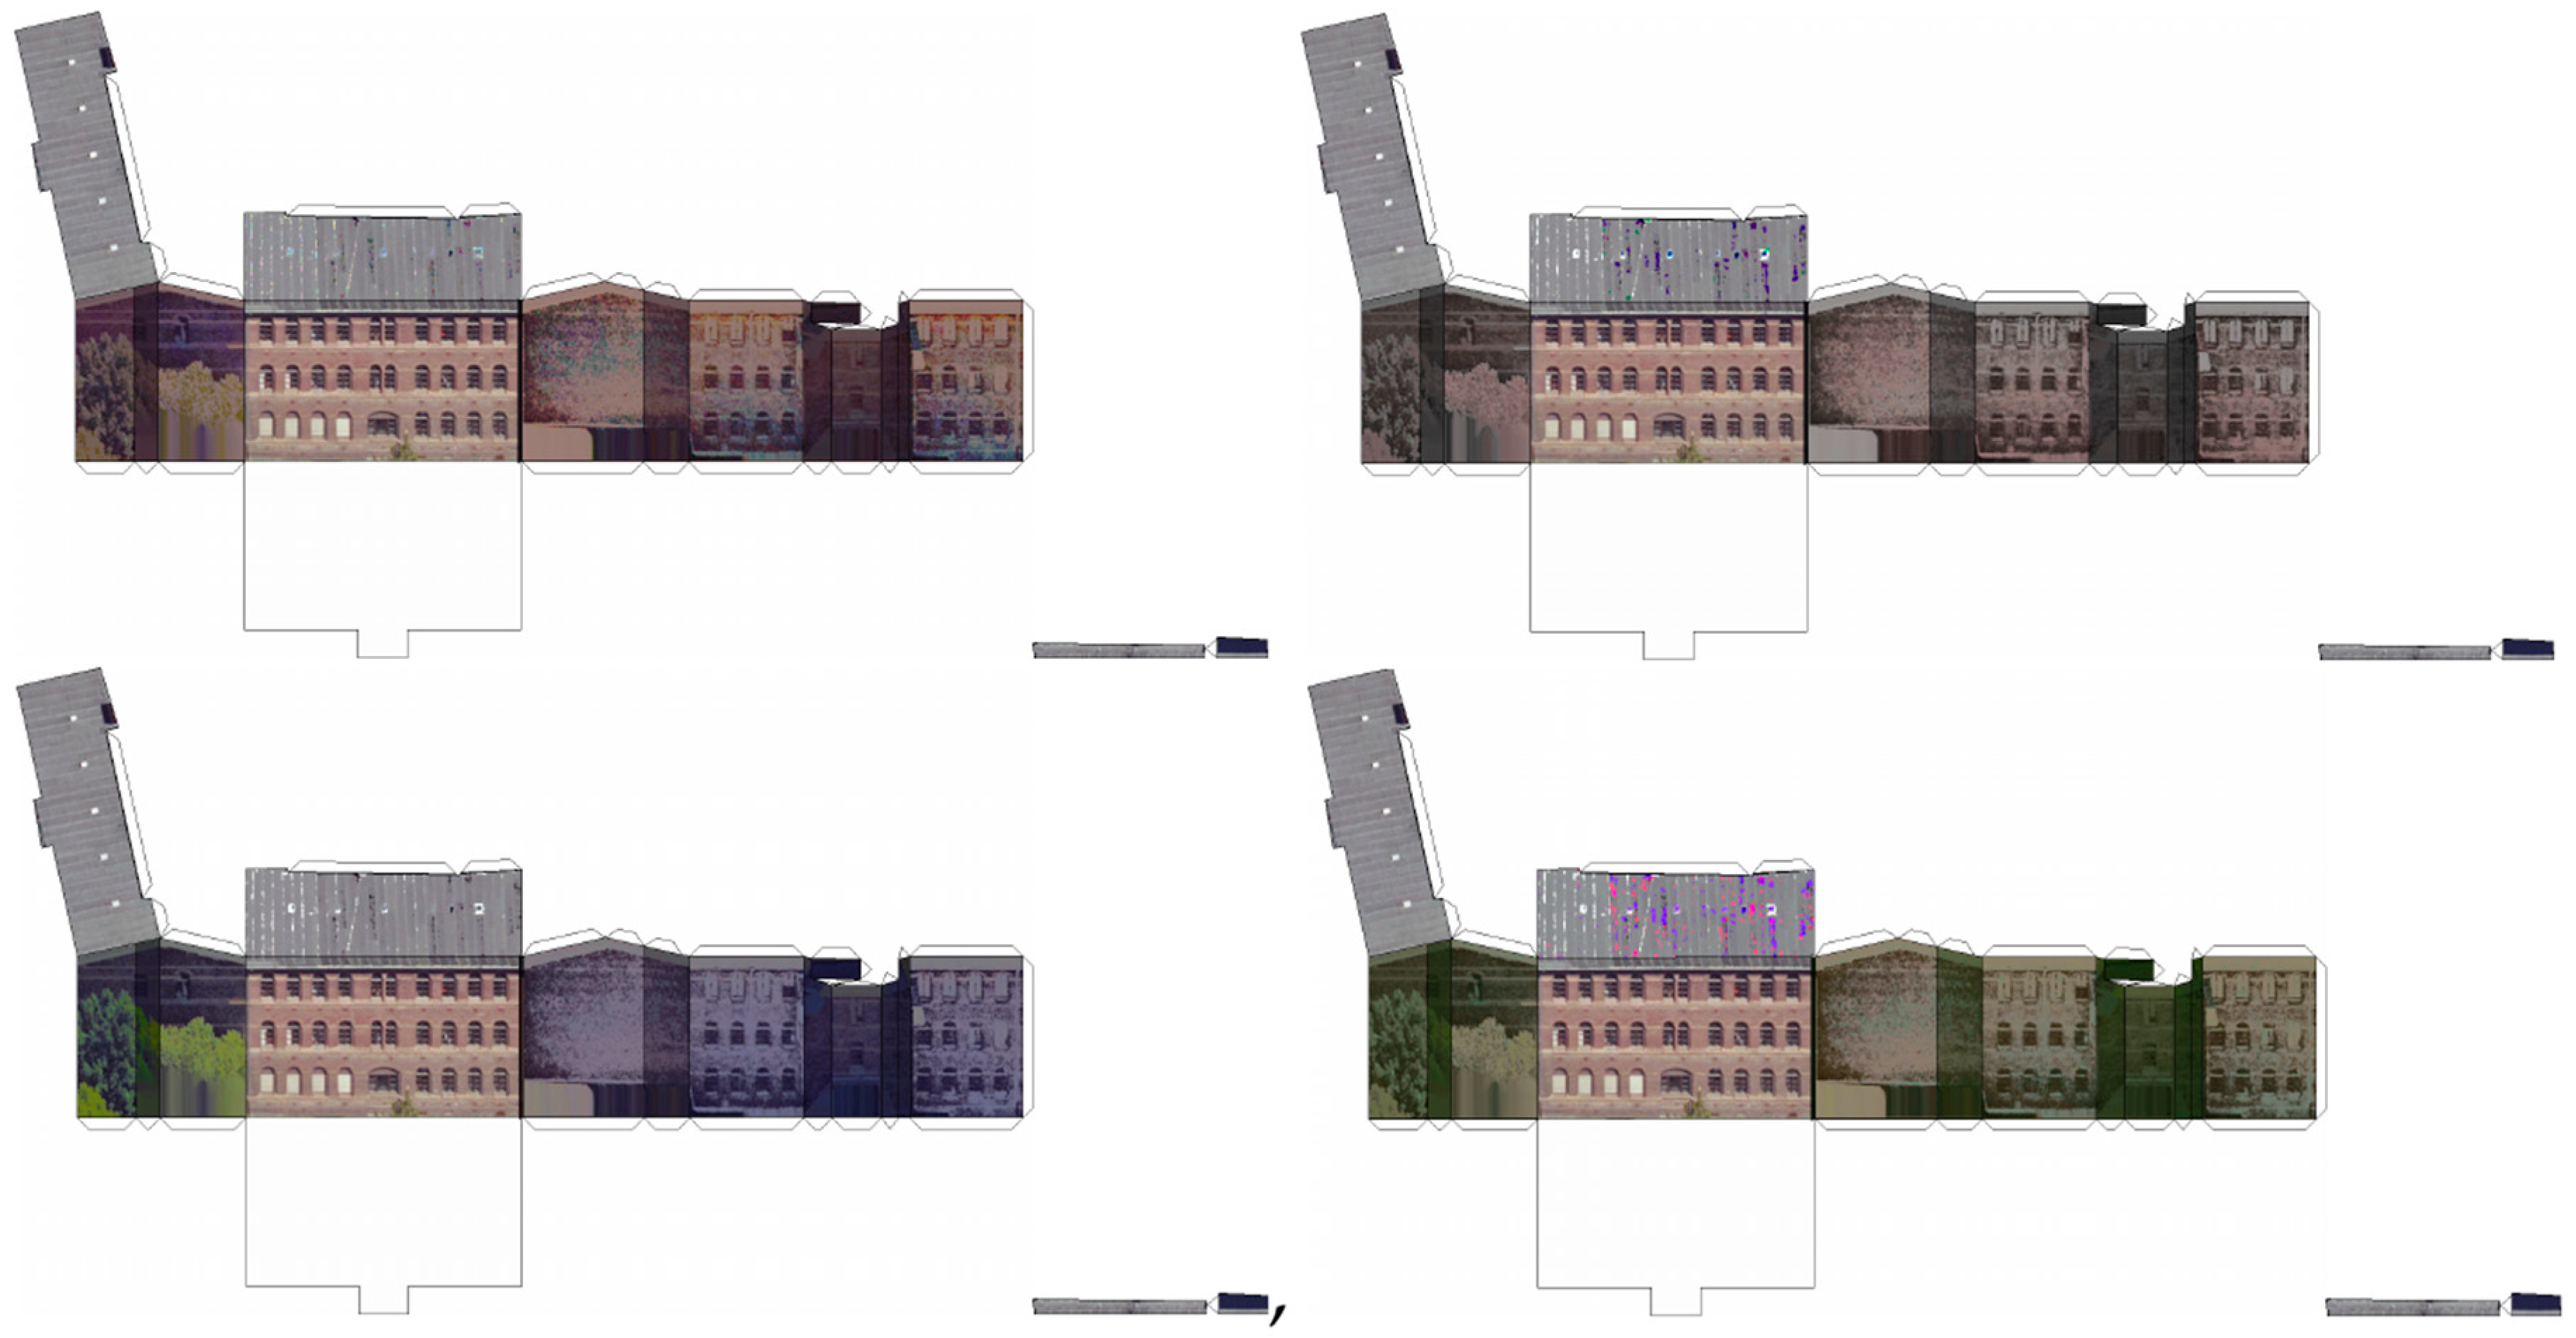
2.3. Histogram Matching

The brightness of texture images in all three city models varies greatly depending on the orientation of polygons towards the sun, see Figure 10. We experimented with histogram matching to adjust the brightness. Pixels outside the polygon, pixels of occluded areas, and green pixels indicating vegetation were masked out. Then we processed wall and roof textures separately. For both sets of images, we determined a reference image each. This is the brightest image with more than half the maximum number of non-masked-out pixels in the set under consideration. Then all other images of the set were adjusted to the reference image, see Figure 11, Figure 12 and Figure 13.
The histogram function:
h c : { 0 , , 255 } N 0 : = { 0 , 1 , 2 , }
counts the occurrence of byte values in an image channel c. When (3) is interpreted as a density function, the corresponding distribution function is H c : { 0 , , 255 } [ 0 , 1 ] defined by:
H c ( k ) : = 0 j k h c ( j ) 0 j 255 h c ( j ) .
Let H ref , c be the distribution Function (4) of channel c of the reference image, and let H A , c be the corresponding distribution function of an image A to be adjusted. Then the classical histogram matching replaces byte values k of channel c of A with k : = min { j { 0 , , 255 } : H ref , c ( j ) H A , c ( k ) } .
We applied an independent histogram matching of RGB channels as well as of HSV channels and also a matching of only the Y channel of the YCbCr color schema, see Figure 13.
However, the histogram-based approach did not work sufficiently. Buildings often looked too different on different sides, with rear facades having a dissimilar color to the corresponding front facade. The different color distribution in connection with independent matching of the RGB channels led to noisy hue values. Much better results were obtained by applying histogram matching to the original aerial images before the generation of the CityGML textures (which unfortunately is not possible when only the final textured models are available, as in the Berlin city model). These much larger images cover up to a thousand buildings. Typically, aerial images are taken with four cameras mounted on an aircraft. During a flight, these cameras look roughly in the directions of north, south, east, and west. We worked with images taken around noon, so the images from the camera facing north were brightest. Using these images as a reference, the other images could be adjusted quite well if adjusted and reference images showed the same area (and therefore had similar color distribution), see Figure 14.

2.4. Implementation

With the Xcode IDE on a MacBook Pro computer with i5 processor, the algorithm was implemented in C++ based on the OpenCV library (https://opencv.org (accessed on 23 November 2021)) that is used for image transformation. All tests were performed on the MacBook with 16 GB memory that was sufficient to handle textures and oblique aerial images.

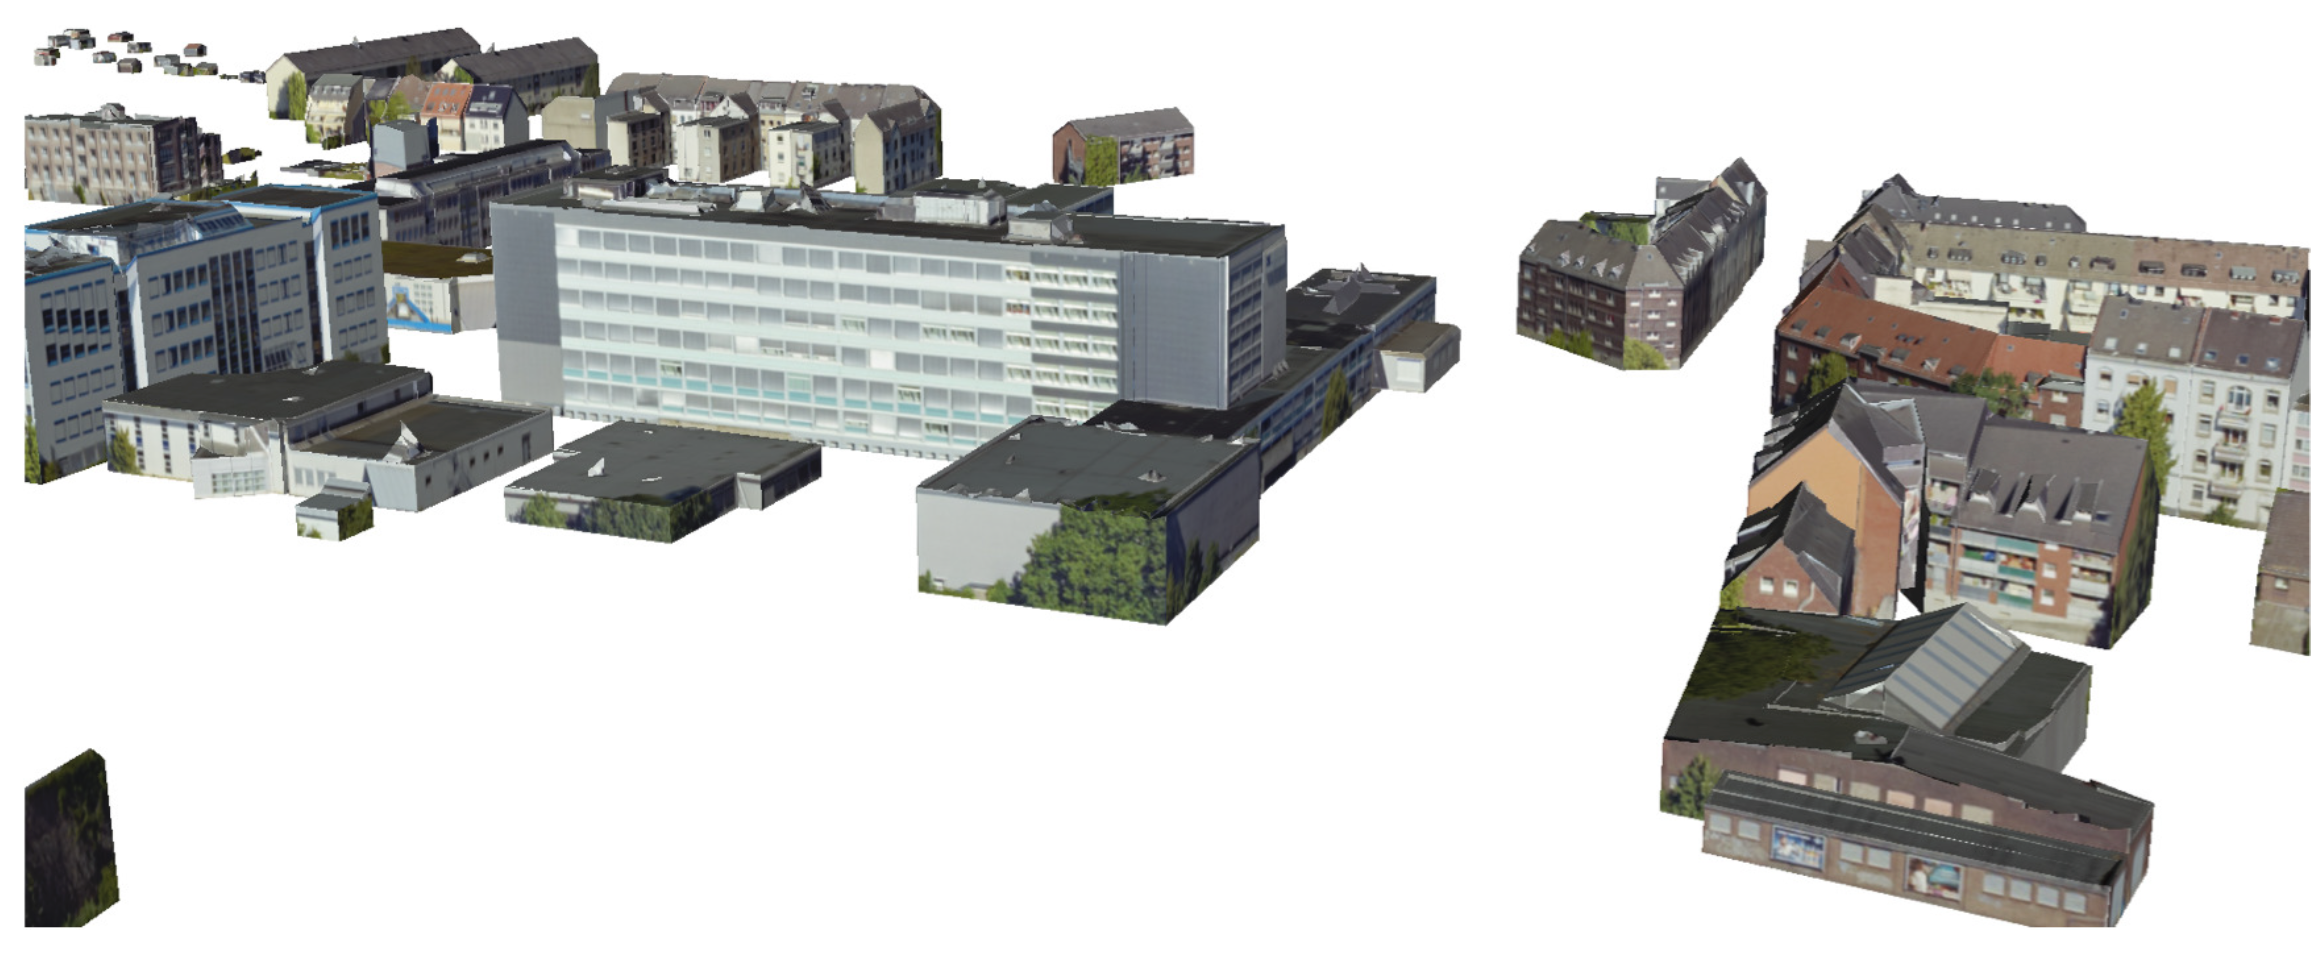
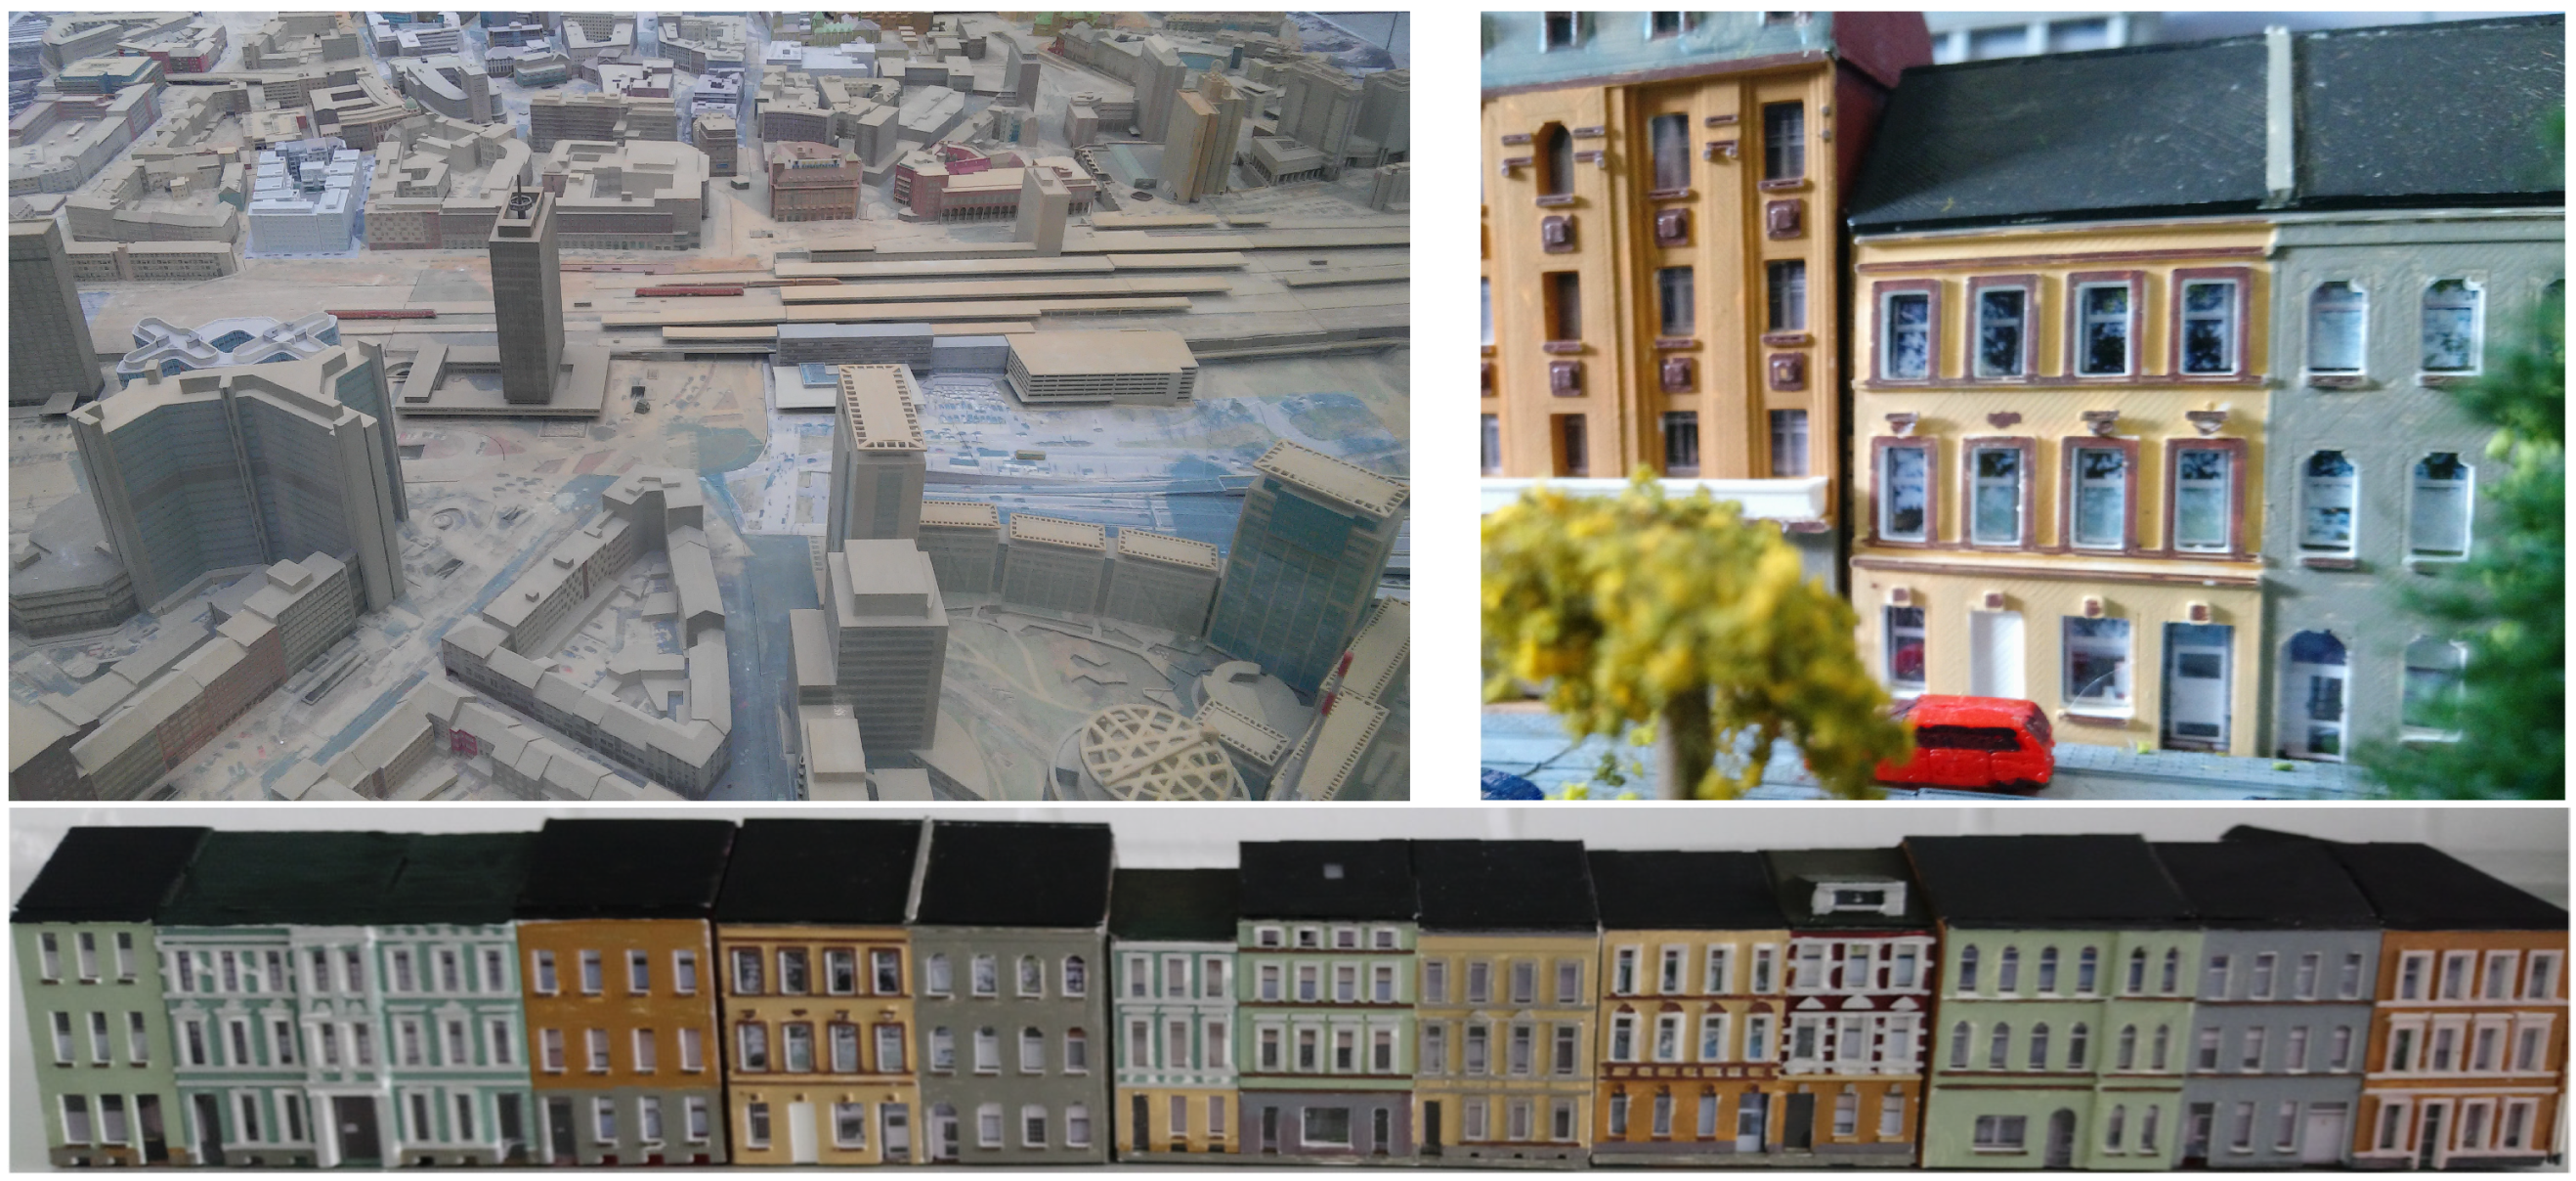
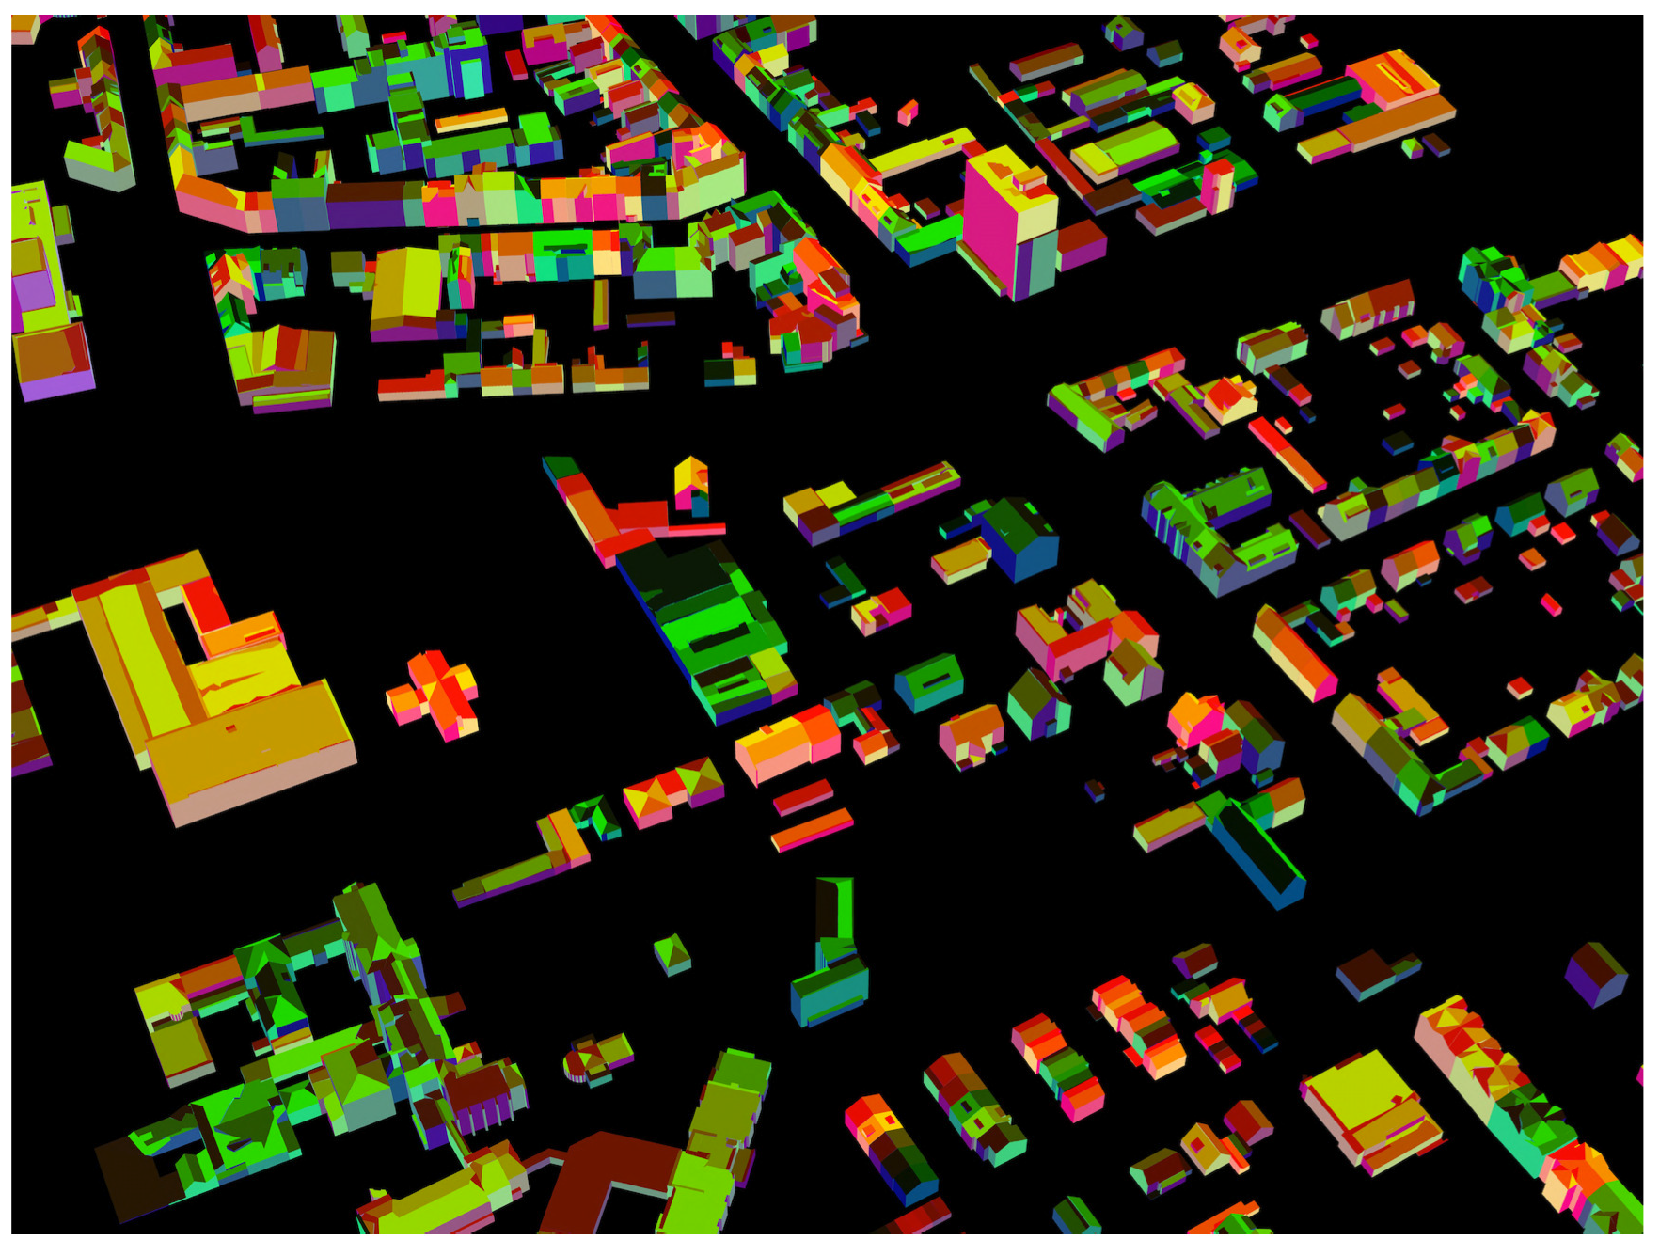
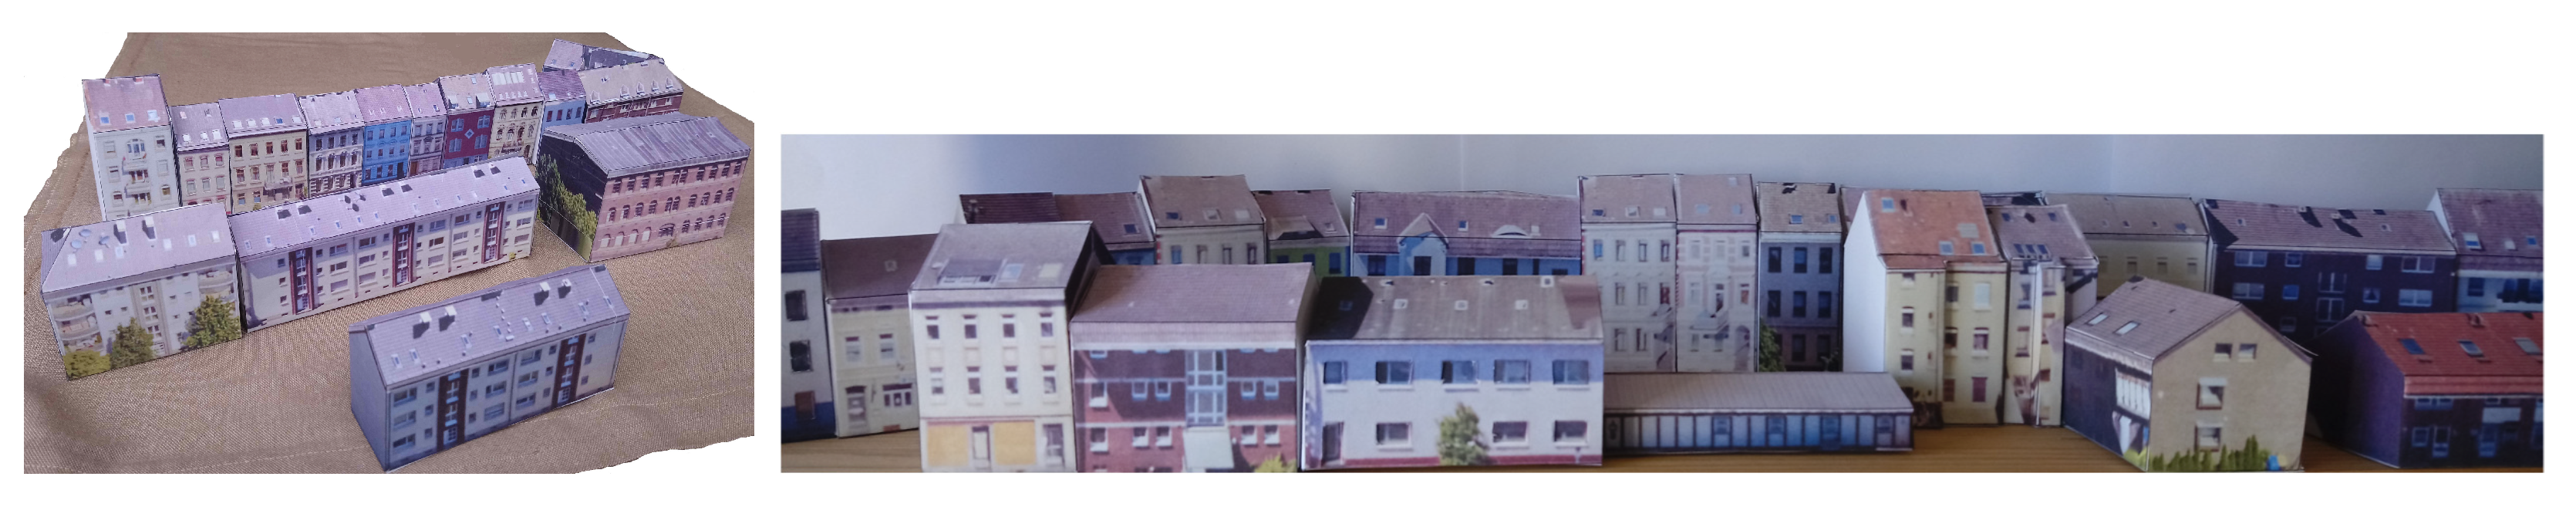
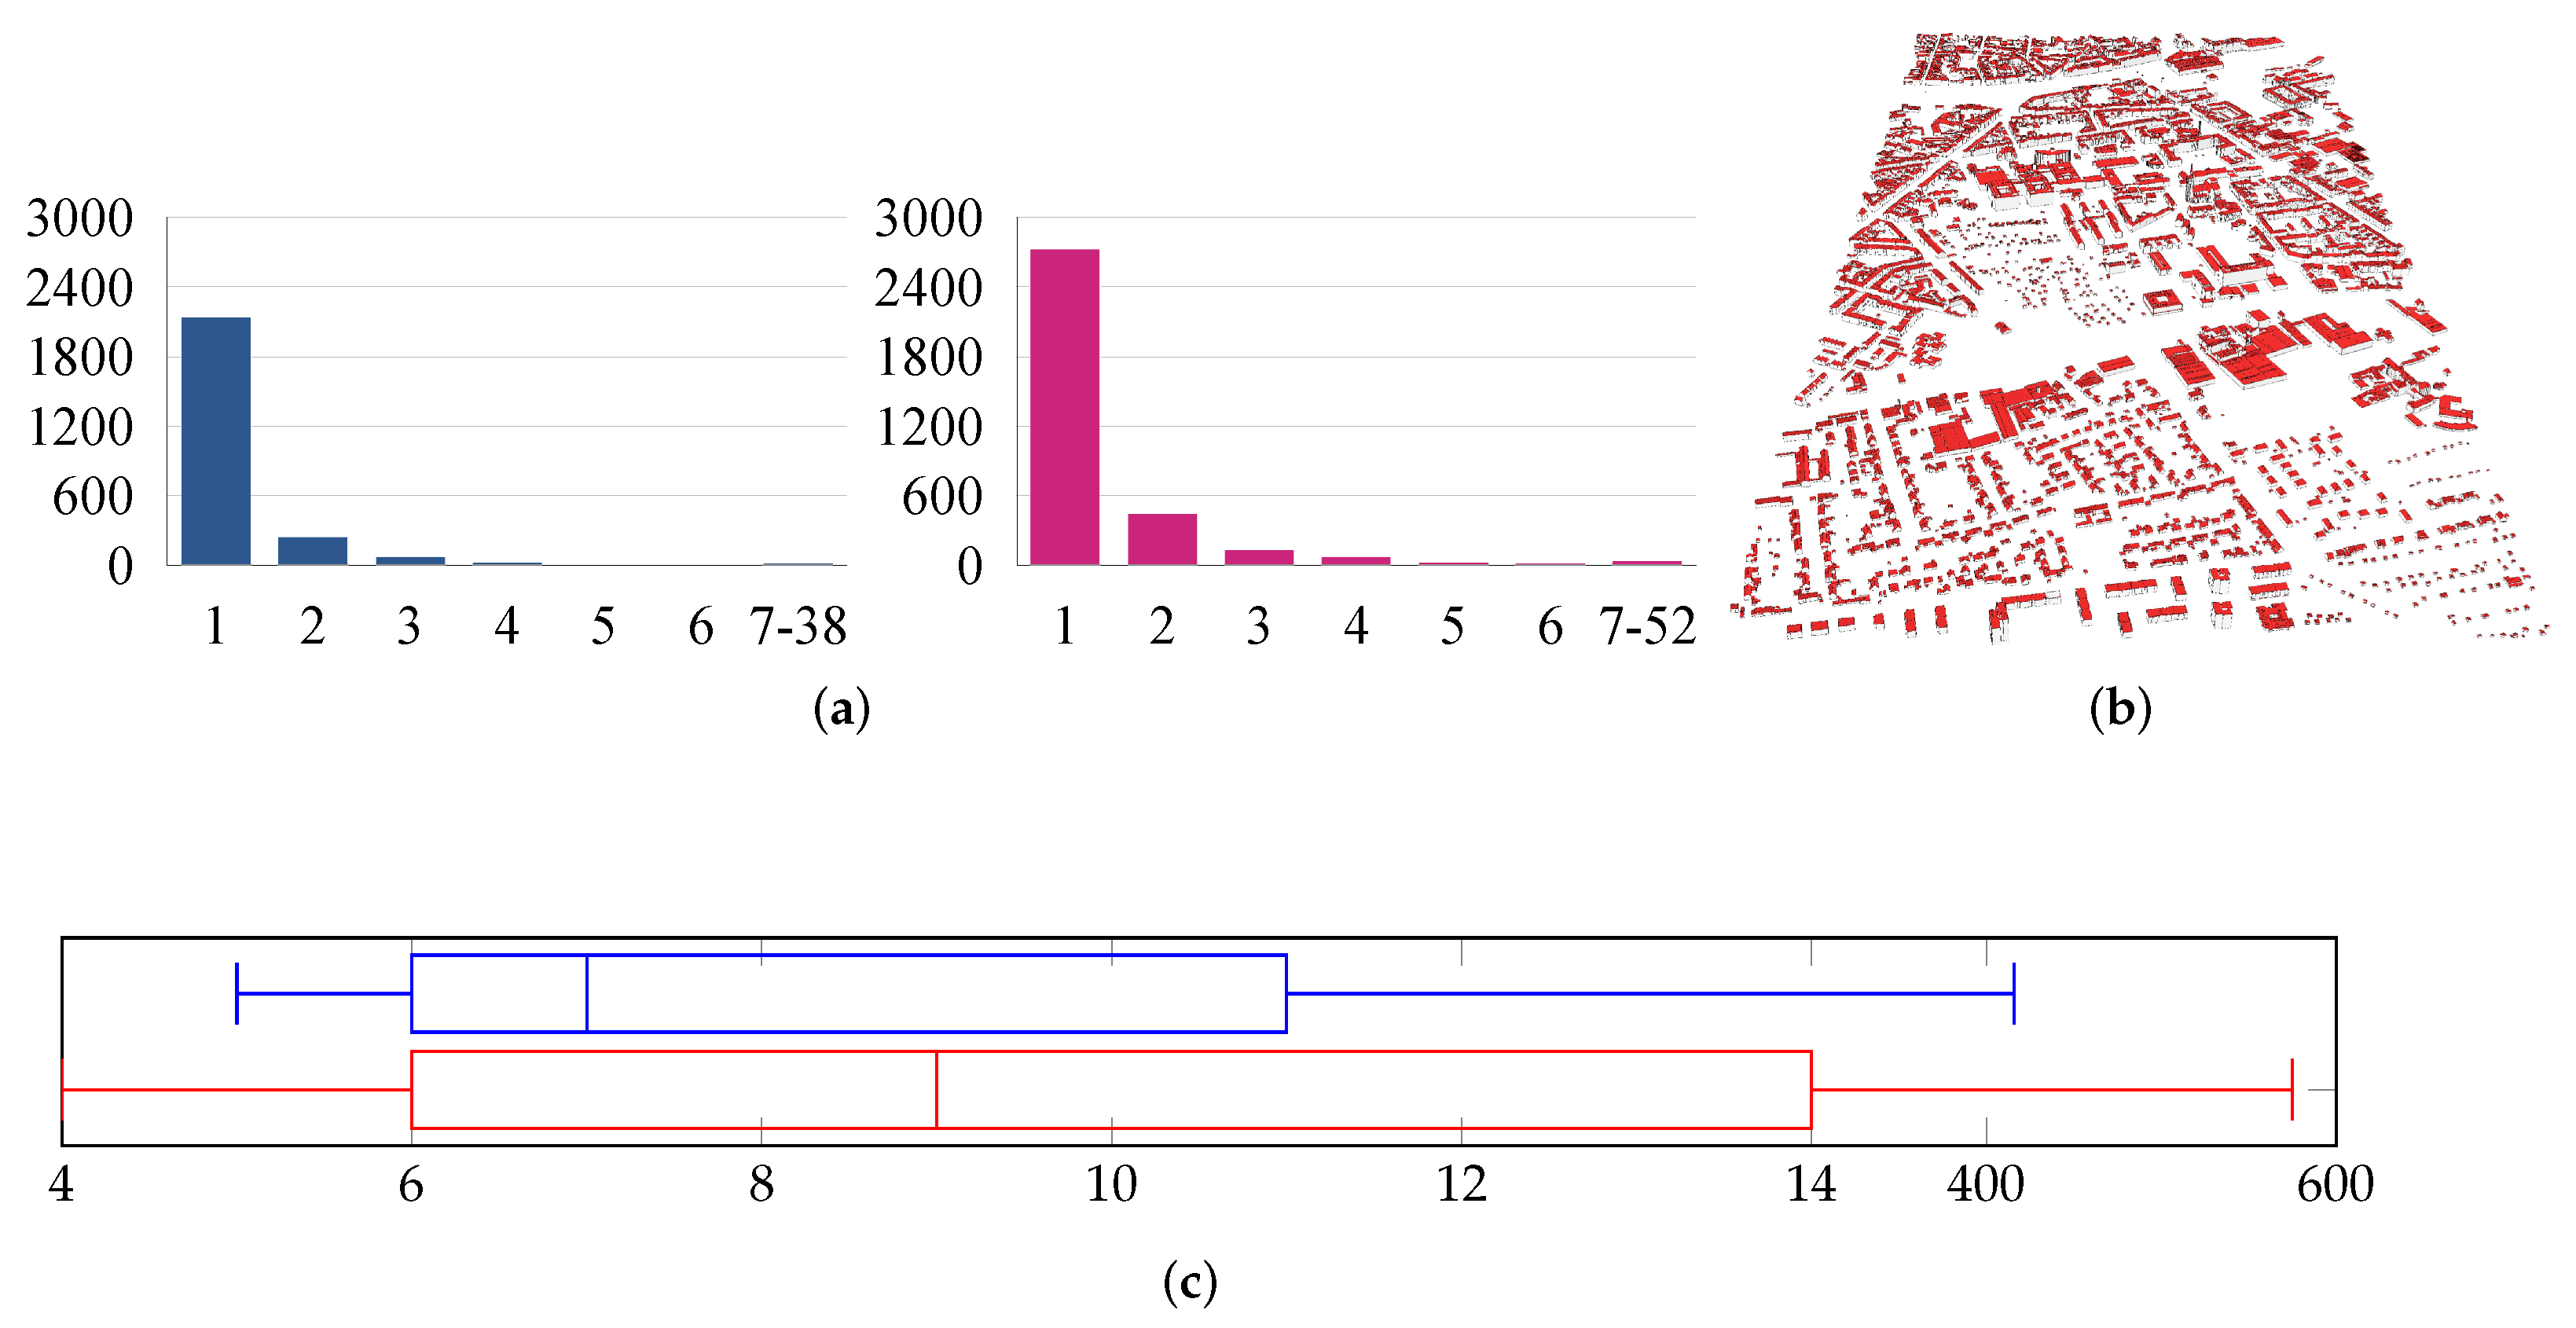
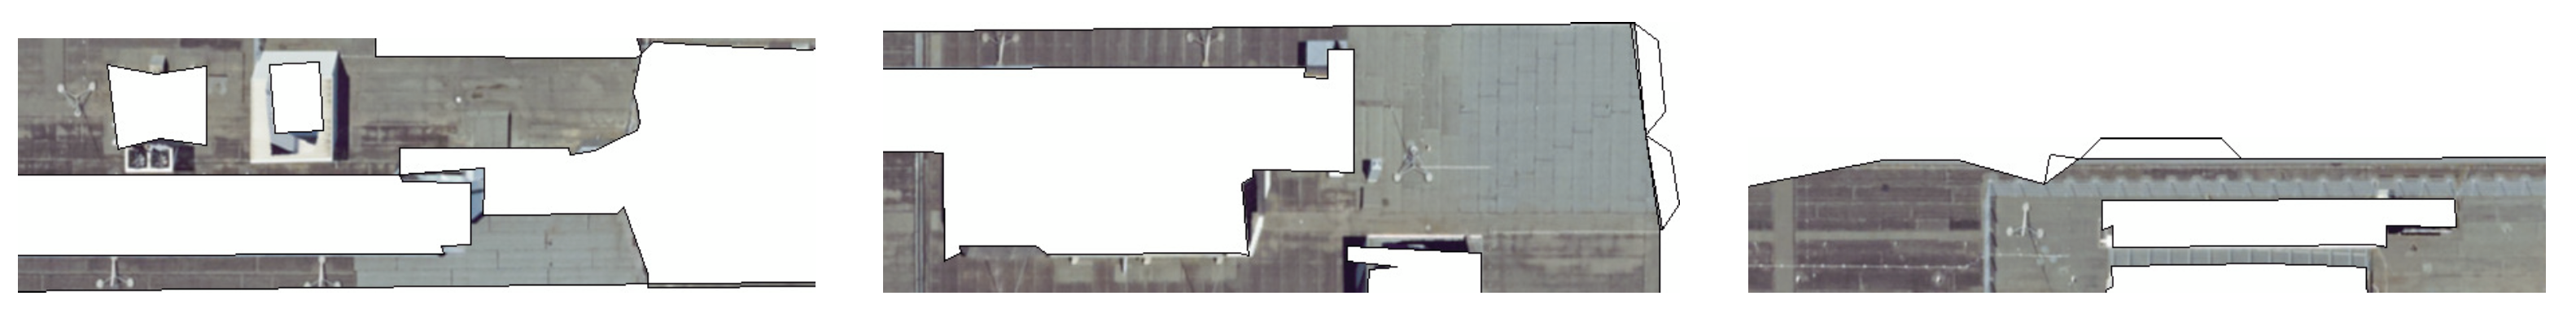
3. Results and Discussion

Due to the greedy approach, the unfolding results were available immediately. Most buildings consist of a few wall and roof facets. Then it is easy to fold the 2D layout back into a physical 3D model as shown in Figure 15. Figure 16 summarizes some numbers for two square kilometer tiles around our institute. The fist tile (blue plots) consists of 2502 building parts and the second consists of 3443 building parts (red plots). The 0.75-quartile of connected layout components in both tiles was one. More precisely, 85% and 79% of all building parts could be unfolded to only one connected component. The 0.95-quantile of connected components was two and three, respectively. A few of these components were needed because of interior polygons (openings). The maximum number of openings per building was eight, but the 0.95-quantile was only zero and one, respectively. The numbers demonstrate that the chosen greedy approach is sufficient.
A higher number of connected components were often associated with buildings that had many small facets, see Figure 17. Such buildings were also difficult to assemble, and the level of detail should be reduced prior to unfolding. A simple but effective technique is to remove openings and any polygons that are inside openings. Another technique reduces the set of building corners to dominant corners, see [18].
The prerequisite that adjacent polygons do not lie in the same plane was sometimes violated. This could lead to cut edges that should be fold edges. Merging faces prior unfolding also requires merging textures. To avoid this effort, the algorithm simply does not draw glue tabs along these cut edges. This is done by temporarily coloring non-textured facets and adding glue tabs only after all polygons are drawn. Then a check is performed to see if the glue tab vertices are already colored. If so, the tab is omitted.
We only checked for occlusion by buildings. Unfortunately, many facades were covered by vegetation. This was indicated by green areas. However, this type of occlusion occurred on some walls to an extent that did not allow inpainting.
The slope angles of some roof surfaces were inaccurate in the CityGML models. In addition, bay windows and balconies were not represented in the simple models. Both problems led to perspective distortions in the textures, which were clearly visible, cf. Figure 18.
Table 1 summarizes our experiences with paper models compared to 3D printing. The main disadvantage of paper models is the manual work required to assemble the printed kits. However, it took less than five minutes to cut out and glue together each of the models shown in Figure 15. Preparation for a 3D print (cleaning, handling of materials, supervising the print, removing support structures, etc.) also takes some time. Nevertheless, unlike color 3D printing, manual interaction limits the paper kit approach to smaller areas like single streets and to simple geometries, i.e., buildings should not consist of too many facets. Facets should not be too small. The size of models is bounded by the paper size and by the build space of a 3D printer, respectively. For both techniques, it is therefore often necessary to (automatically) cut the models into smaller pieces.

4. Conclusions and Future Work

Paper models can potentially be used for urban planning and are a comparatively easy-to-create and cost-effective alternative to virtual 3D visualization as well as manually-created or 3D-printed architectural models.
We presented a greedy algorithm for automatically unfolding CityGML models into paper model kits with exact scaling, so that in most cases only a single piece of paper needs to be cut out, folded, and glued together. However, even without assembling the models, the kits are an alternative to virtual 3D rendering because unfolding to 2D is helpful for finding model and texture errors. The fold edges indicate how the 2D facets fit together in 3D. The 2D rendering shows hidden walls and internal structures that are not readily apparent when viewing virtual city representations. Thus, textures of walls between buildings can be checked. Building models in LoD 2 should consist only of the outer shell such that interior walls indicate errors. At the moment, this 2D representation is also complimentary to some city model viewers (like the “azul” (https://github.com/tudelft3d/azul (accessed on 23 November 2021)) viewer) that are not capable of displaying textures from files. In addition, the current CityJSON plugin for QGIS does not support the appearance module needed to handle textures, see [19].
Our future work will be to apply algorithms for inpainting to occluded image areas so that vegetation is removed from the facade images. It would also be useful to simplify given CityGML models so that cutting and gluing together becomes easier. It should also be investigated how the production process can be simplified by 2D laser cutting. Laser cutting would not only eliminate the need to cut out the layouts, but could also prepare the folding edges by weakening the material. In addition, raised texture patterns would be possible, which could be obtained from the textures.

Author Contributions

Section Histogram Matching: R.P.-F., other sections: S.G.; writing—review and editing, S.G. All authors have read and agreed to the published version of the manuscript.

Funding

This research received no external funding.

Institutional Review Board Statement

Not applicable.

Informed Consent Statement

Not applicable.

Acknowledgments

The authors are grateful to Udo Hannok from the cadastral office of the City of Krefeld for providing the oblique aerial images. The authors are also grateful for valuable comments by the anonymous reviewers as well as by our colleague, Christoph Dalitz.

Conflicts of Interest

The authors declare no conflict of interest.

References

  1. Biljecki, F.; Stoter, J.; Ledoux, H.; Zlatanova, S.; Çöltekin, A. Applications of 3D City Models: State of the Art Review. ISPRS Int. J. Geo-Inf. 2015, 4, 2842–2889. [Google Scholar] [CrossRef] [Green Version]
  2. Kolbe, T.; Donaubauer, A. Semantic 3D City Modeling and BIM; Urban Informatics. The Urban Book Series; Shi, W., Goodchild, M., Batty, M., Kwan, M., Zhang, A., Eds.; Springer: Singapore, 2016; pp. 609–636. [Google Scholar]
  3. Gröger, G.; Kolbe, T.H.; Nagel, C.; Häfele, K.H. OpenGIS City Geography Markup Language (CityGML) Encoding Standard. Version 2.0.0; Open Geospatial Consortium: Arlington, VA, USA, 2012. [Google Scholar]
  4. Schmidt, P.; Stattmann, N. Unfolded; Birkhäuser: Basel, Switzerland, 2012. [Google Scholar]
  5. Al-Kodmany, K. Visualization tools and methods for participatory planning and design. J. Urban Technol. 2001, 8, 1–37. [Google Scholar] [CrossRef]
  6. Hull, C.; Willett, W. Building with Data: Architectural Models as Inspiration for Data Physicalization. In Proceedings of the 2017 CHI Conference on Human Factors in Computing Systems, Denver, CO, USA, 6–11 May 2017; Association for Computing Machinery: New York, NY, USA, 2017; pp. 1217–1264. [Google Scholar]
  7. Griffin, A.L. Feeling It Out: The Use of Haptic Visualization for Exploratory Geographic Analysis. Cartogr. Perspect. 2001, 39, 12–29. [Google Scholar] [CrossRef]
  8. Schilling, A. Architektur und Modellbau: Konzepte-Methoden-Materialien; Birkhäuser: Basel, Switzerland, 2018. [Google Scholar]
  9. Pottmann, H.; Asperl, A.; Hofer, M.; Kilian, A. Die Erstellung von Modellen im Kontext der Architektur. In Architekturgeometrie; Springer: Vienna, Austria, 2010; pp. 423–453. [Google Scholar]
  10. Bañón, C.; Raspall, F. 3D Printing Architecture: Workflows, Applications, and Trends; Springer: Berlin, Germany, 2021. [Google Scholar]
  11. Straub, R.; Prautzsch, H. Creating Optimized Cut-Out Sheets for Paper Models from Meshes. KarlsRuhe Rep. Inform. 2011, 36, 1–15. [Google Scholar]
  12. Cankova, K.; Dovramadjiev, T.; Jecheva, G.V. Methodology for creating 3D paper unfolded models with complex geometry using open-source software and resources with free personal and commercial license. Annu. J. Tech. Univ. Varna Bulg. 2018, 2, 39–46. [Google Scholar]
  13. Haenselmann, T.; Effelsberg, W. Optimal strategies for creating paper models from 3D objects. Multimed. Syst. 2012, 18, 519–532. [Google Scholar] [CrossRef]
  14. Korpitsch, T.; Takahashi, S.; Gröller, E.; Wu, H.Y. Simulated Annealing to Unfold 3D Meshes and Assign Glue Tabs. J. WSCG 2020, 28, 47–56. [Google Scholar] [CrossRef]
  15. Croft, H.; Falconer, K.; Guy, R. Unsolved Problems in Geometry; Springer: Berlin/Heidelberg, Germany, 1991. [Google Scholar]
  16. Bern, M.; Demaine, E.; Eppstein, D.; Kuo, E.; Mantler, A.; Snoeyink, J. Unfoldable polyhedra with convex faces. Comput. Geom. 2003, 24, 51–62. [Google Scholar] [CrossRef] [Green Version]
  17. Goebbels, S.; Pohle-Fröhlich, R. Roof reconstruction from airborne laser scanning data based on image processing methods. ISPRS Ann. Photogramm. Remote Sens. Spatial Inf. Sci. 2016, 3, 407–414. [Google Scholar] [CrossRef] [Green Version]
  18. Goebbels, S. Convergence rates for Fourier partial sums of polygons and periodic splines. J. Fourier Anal. Appl. 2019, 25, 1902–1920. [Google Scholar] [CrossRef]
  19. Vitalis, S.; Arroyo Ohori, K.; Stoter, J. CityJSON in QGIS: Development of an open-source plugin. Trans. GIS 2020, 24, 1147–1164. [Google Scholar] [CrossRef] [PubMed]
Figure 1. Detail of a textured CityGML model of Krefeld.
Geographies 01 00018 g001
Figure 2. Upper left image: 3D-printed city model of Essen, created by “Amt für Geoinformation, Vermessung und Kataster der Stadt Essen”; other images: Manually colored 3D print of buildings in Krefeld.
Geographies 01 00018 g002
Figure 3. Print templates of CityGML buildings with automatically added glue tabs.
Geographies 01 00018 g003
Figure 4. The initial layout consists of wall faces that are adjacent to a ground plane polygon.
Geographies 01 00018 g004
Figure 5. Dormers lead to openings.
Geographies 01 00018 g005
Figure 6. A cupola from the Berlin model forms one connected component belonging to an opening of a roof.
Geographies 01 00018 g006
Figure 7. Examples from the Berlin city model.
Geographies 01 00018 g007
Figure 8. Unfolding examples without and with glue tabs.
Geographies 01 00018 g008
Figure 9. Visibility mask for identifying occluded regions.
Geographies 01 00018 g009
Figure 10. The algorithm divided the layout into three connected components.
Geographies 01 00018 g010
Figure 11. Histogram matching of all RGB channels applied to the first unfolding in Figure 3.
Geographies 01 00018 g011
Figure 12. The comparison of original textures (upper image) and textures adjusted with RGB histogram matching (lower image) shows the limitations of the method. The prerequisite that adjacent polygons do not lie in the same plane is not given with this building of the Berlin model.
Geographies 01 00018 g012
Figure 13. Histogram matching applied to Figure 10, from top left to bottom right: Independent matching of all RGB channels, independent matching of all HSV channels, matching of Y channel in the YUV schema, independent matching of all YUV channels.
Geographies 01 00018 g013
Figure 14. Adjustment of aerial images, (left) detail of the original image, taken in the south direction (showing dark facades in Figure 10 and Figure 13), (right) adjusted image.
Geographies 01 00018 g014
Figure 15. Assembled paper models.
Geographies 01 00018 g015
Figure 16. Blue bars: Square kilometer with southwest corner (330,000; 5,687,000) in zone 32U UTM coordinates, red bars: Square kilometer with southwest corner (330,000; 5,688,000). (a) x-axis: Number of connected components, y-axis: Building parts with this number of connected components; (b) models of the two square kilometer test region; and (c) polygons per building part.
Geographies 01 00018 g016
Figure 17. A fragmented flat roof leads to multiple connected components, three are shown here.
Geographies 01 00018 g017
Figure 18. The left roof surface in the first, the right roof surface in the last image, and two roof polygons in the second image do not perfectly match the texture. The balconies in the last image originate from two aerial images taken from different angles to avoid occluded areas.
Geographies 01 00018 g018
Table 1. Comparison between paper models and 3D print models, colors from dark red to dark green indicate a scale from bad to good.
Paper ModelColor Powder 3D PrintFFF with Multiple Filaments Colors
time needed for model creation
manual interaction
costs of materials and equipment
stability of models
quality of color
number of colors
durability of structure
durability of colors
precision of scale
applicability for simple geometries
applicability for complex geometries
scalability of models
Publisher’s Note: MDPI stays neutral with regard to jurisdictional claims in published maps and institutional affiliations.

