
Gait Biomechanical Parameters Related to Falls in the Elderly: A Systematic Review


Abstract
:1. Introduction
2. Materials and Methods
2.1. Eligibility Criteria
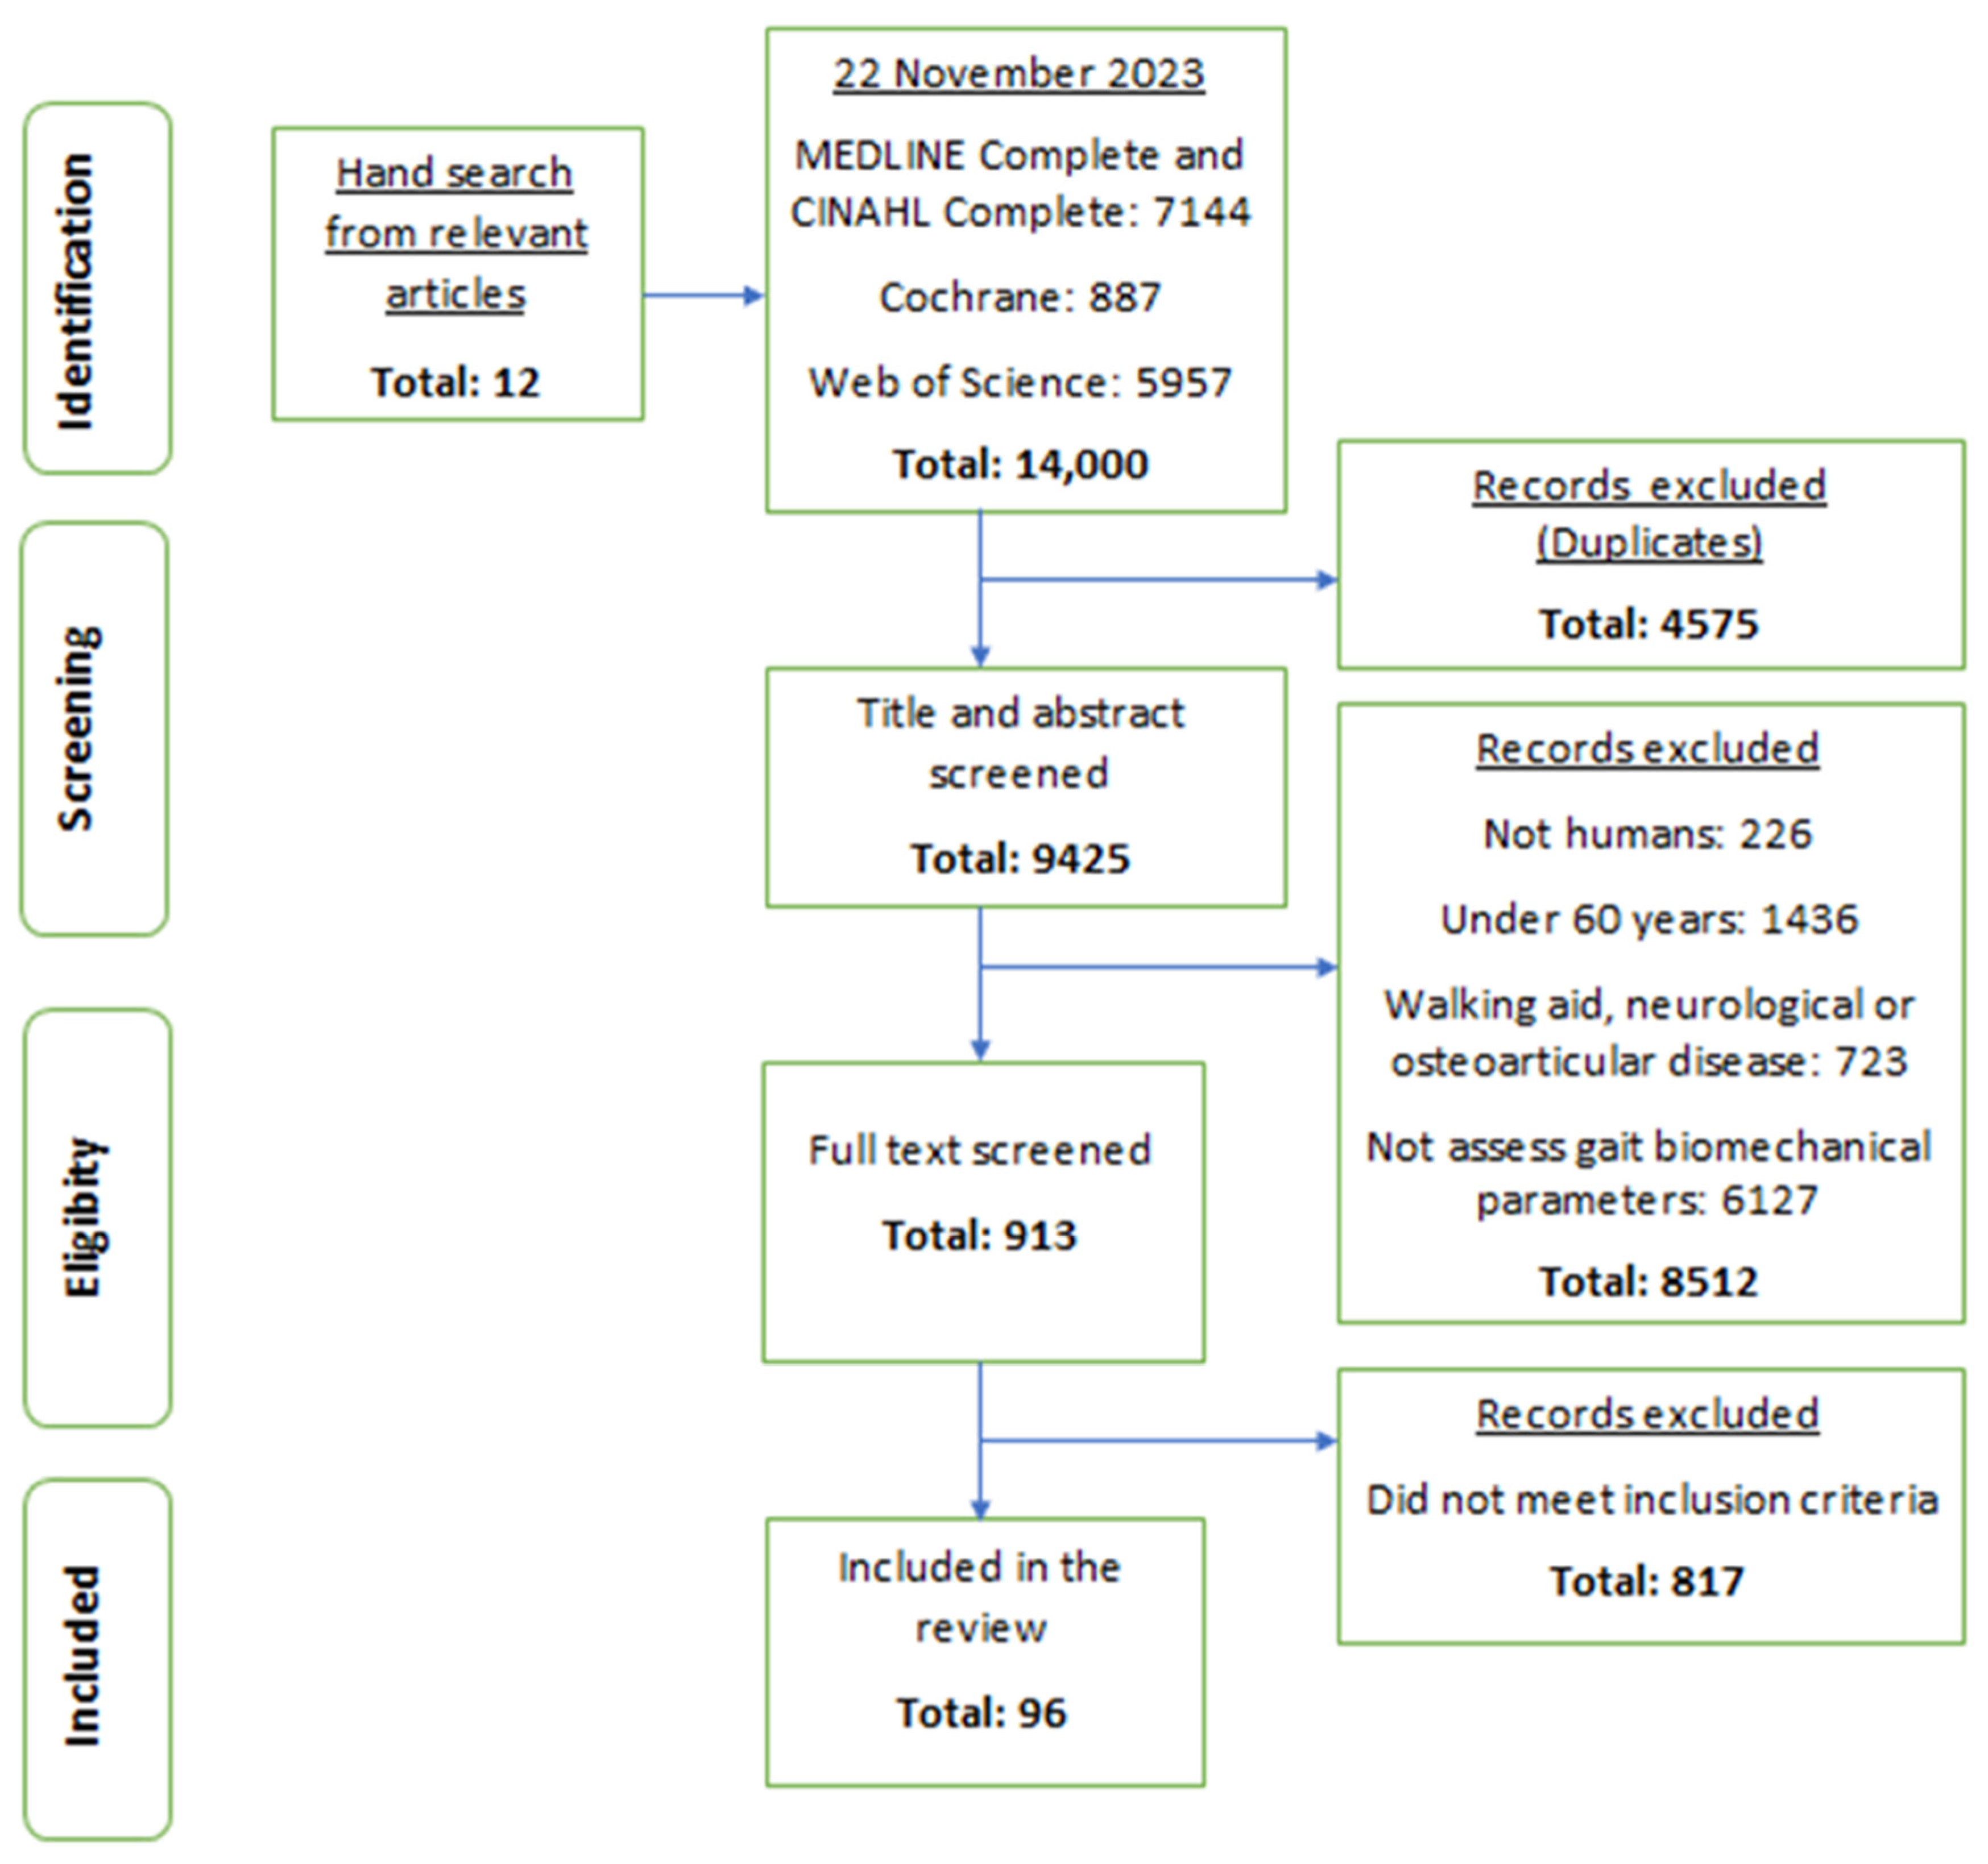
2.2. Search Strategy and Selection Process
2.3. Data Extraction and Synthesis
2.4. Risk of Bias Assessment
3. Results
3.1. Characteristics of the Selected Studies
3.2. Risk of Bias Assessment
3.3. Gait Spatiotemporal Parameters
3.3.1. Gait Speed
3.3.2. Cadence
3.3.3. Stride and Step Length
3.3.4. Stride and Step Time
3.3.5. Stride and Step Width
3.3.6. Stance Phase
3.3.7. Swing Phase
3.3.8. Single Support Phase
3.3.9. Double Support Phase
3.3.10. Base of Support during Gait
3.3.11. Others Parameters
3.4. Kinematic Parameters
3.4.1. Minimum Foot/Toe Clearance
3.4.2. CoM
3.4.3. CoP Kinematics
3.4.4. CoM–CoP Relation
3.4.5. Head, Trunk, and Pelvis Linear Kinematics
3.4.6. Lower Limb Linear Kinematics
3.4.7. Slip Kinematics Parameters
3.5. Angular Kinematic Parameters
3.5.1. Hip
3.5.2. Knee
3.5.3. Ankle
3.5.4. Foot Progression Angle
3.5.5. Foot Angle with Ground
3.5.6. Trunk
3.5.7. Pelvis
3.5.8. Thigh
3.5.9. Shank
3.5.10. Other Parameters
3.6. Kinetic Parameters
3.6.1. Ground Reaction Force
3.6.2. Plantar Pressure
3.7. Dynamic Parameters
3.7.1. Hip Moment
3.7.2. Knee Moment
3.7.3. Ankle Moment
3.7.4. Hip, Knee, and Ankle Power Absorption and Generation
3.7.5. Other Parameters
3.8. EMG Parameters
3.8.1. Muscle Activity
3.8.2. Muscle Synergies and Co-Contraction
3.9. Gait Symmetry and Gait Smoothness
4. Discussion
5. Conclusions
Author Contributions
Funding
Institutional Review Board Statement
Informed Consent Statement
Data Availability Statement
Conflicts of Interest
References
- World Health Organization. Falls. Available online: https://www.who.int/news-room/fact-sheets/detail/falls (accessed on 7 October 2021).
- Stenhagen, M.; Ekström, H.; Nordell, E.; Elmståhl, S. Accidental falls, health-related quality of life and life satisfaction: A prospective study of the general elderly population. Arch. Gerontol. Geriatr. 2014, 58, 95–100. [Google Scholar] [CrossRef] [PubMed]
- Yardley, L.; Smith, H. A prospective study of the relationship between feared consequences of falling and avoidance of activity in community-living older people. Gerontologist 2002, 42, 17–23. [Google Scholar] [CrossRef] [PubMed]
- Ambrose, A.; Cruz, L.; Paul, G. Falls and fractures: A systematic approach to screening and prevention. Maturitas 2015, 82, 85–93. [Google Scholar] [CrossRef]
- World Health Organization. WHO Global Report on Falls Prevention in Older Age; World Health Organization: Geneva, Switzerland, 2007. [Google Scholar]
- Florence, C.; Bergen, G.; Atherly, A.; Burns, E.; Stevens, J.; Drake, C. Medical costs of fatal and nonfatal falls in older adults. J. Am. Geriatr. Soc. 2018, 66, 693–698. [Google Scholar] [CrossRef]
- American Geriatrics Society; British Geriatrics Society; American Academy of Orthopaedic Surgeons Panel on Falls Prevention. Guideline for the prevention of falls in older persons. J. Am. Geriatr. Soc. 2001, 49, 664–672. [Google Scholar] [CrossRef]
- Rubenstein, L. Falls in older people: Epidemiology, risk factors and strategies for prevention. Age Ageing 2006, 35 (Suppl. S2), ii37–ii41. [Google Scholar] [CrossRef] [PubMed]
- Creaby, M.; Cole, M. Gait characteristics and falls in Parkinson’s disease: A systematic review and meta-analysis. Park. Relat. Disord. 2018, 57, 1–8. [Google Scholar] [CrossRef]
- Berg, W.; Alessio, H.; Mills, E.; Tong, C. Circumstances and consequences of falls in independent community-dwelling older adults. Age Ageing 1997, 26, 261–268. [Google Scholar] [CrossRef]
- Barrett, R.; Mills, P.; Begg, R. A systematic review of the effect of ageing and falls history on minimum foot clearance characteristics during level walking. Gait Posture 2010, 32, 429–435. [Google Scholar] [CrossRef]
- Aleixo, P.; Abrantes, J. 3D gait analysis in rheumatoid arthritis postmenopausal women with and without falls history. In Proceedings of the IEEE 2015 4th Portuguese Meeting on Bioengineering (ENBENG), Porto, Portugal, 26–28 February 2015; pp. 1–4. [Google Scholar] [CrossRef]
- Callisaya, M.; Blizzard, L.; Schmidt, M.; Martin, K.L.; McGinley, J.L.; Sanders, L.M.; Srikanth, V.K. Gait, gait variability and the risk of multiple incident falls in older people: A population-based study. Age Ageing 2011, 40, 481–487. [Google Scholar] [CrossRef]
- Verghese, J.; Holtzer, R.; Lipton, R.; Wang, C. Quantitative gait markers and incident fall risk in older adults. J. Gerontol. A Biol. Sci. Med. Sci. 2009, 64A, 896–901. [Google Scholar] [CrossRef]
- Page, M.; McKenzie, J.; Bossuyt, P.; Boutron, I.; Hoffmann, T.; Mulrow, C.; Shamseer, L.; Tetzlaff, J.; Akl, E.; Brennan, S.; et al. The PRISMA 2020 statement: An updated guideline for reporting systematic reviews. BMJ 2021, 372, n71. [Google Scholar] [CrossRef]
- Schwartz, M.; Rozumalski, A. The gait deviation index: A new comprehensive index of gait pathology. Gait Posture 2008, 28, 351–357. [Google Scholar] [CrossRef]
- Page, M.J.; Moher, D.; Bossuyt, P.; Boutron, I.; Hoffmann, T.; Mulrow, C.; Shamseer, L.; Tetzlaff, J.; Akl, E.; Brennan, S.; et al. PRISMA 2020 explanation and elaboration: Updated guidance and exemplars for reporting systematic reviews. BMJ 2021, 372, n160. [Google Scholar] [CrossRef]
- World Health Organization. Integrated Care for Older People: Guidelines on Community-Level Interventions to Manage Declines in Intrinsic Capacity. Available online: https://apps.who.int/iris/handle/10665/258981 (accessed on 7 October 2021).
- Effective Public Health Practice Project. Quality Assessment Tool for Quantitative Studies. Available online: https://www.ephpp.ca/quality-assessment-tool-for-quantitative-studies/ (accessed on 7 October 2022).
- Heitmann, D.; Gossman, M.; Shaddeau, S.; Jackson, J. Balance performance and step width in noninstitutionalized, elderly, female fallers and nonfallers. Phys. Ther. 1989, 69, 923–931. [Google Scholar] [CrossRef]
- Gehlsen, G.; Whaley, M. Falls in the elderly: Part I, gait. Arch. Phys. Med. Rehabil. 1990, 71, 735–738. [Google Scholar] [PubMed]
- Feltner, M.; MacRae, P.; McNitt-Gray, J. Quantitative gait assessment as a predictor of prospective and retrospective falls in community-dwelling older women. Arch. Phys. Med. Rehabil. 1994, 75, 447–453. [Google Scholar] [CrossRef] [PubMed]
- Wolfson, L.; Judge, J.; Whipple, R.; King, M. Strength is a major factor in balance, gait, and the occurrence of falls. J. Gerontol. A Biol. Sci. Med. Sci. 1995, 50A, 64–67. [Google Scholar] [CrossRef]
- Maki, B. Gait changes in older adults: Predictors of falls or indicators of fear? J. Am. Geriatr. Soc. 1997, 45, 313–320. [Google Scholar] [CrossRef]
- Lee, L.; Kerrigan, D. Identification of kinetic differences between fallers and nonfallers in the elderly. Am. J. Phys. Med. Rehabil. 1999, 78, 242–246. [Google Scholar] [CrossRef] [PubMed]
- Nelson, A.; Certo, L.; Lembo, L.; Lopez, D.; Manfredonia, E.; Vanichpong, S.; Zwick, D. The functional ambulation performance of elderly fallers and non-fallers walking at their preferred velocity. NeuroRehabilitation 1999, 13, 141–146. [Google Scholar] [CrossRef]
- Wall, J.; Bell, C.; Campbell, S.; Davis, J. The Timed Get-up-and-Go test revisited: Measurement of the component tasks. J. Rehabil. Res. Dev. 2000, 37, 109–113. Available online: http://www.ncbi.nlm.nih.gov/pubmed/10847578 (accessed on 22 November 2023). [PubMed]
- Hausdorff, J.; Rios, D.; Edelberg, H. Gait variability and fall risk in community-living older adults: A 1-year prospective study. Arch. Phys. Med. Rehabil. 2001, 82, 1050–1056. [Google Scholar] [CrossRef]
- Kerrigan, D.; Lee, L.; Nieto, T.; Markman, J.; Collins, J.; Riley, P. Kinetic alterations independent of walking speed in elderly fallers. Arch. Phys. Med. Rehabil. 2000, 81, 730–735. [Google Scholar] [CrossRef] [PubMed]
- Kerrigan, D.; Lee, L.; Collins, J.; Riley, P.; Lipsitz, L. Reduced hip extension during walking: Healthy elderly and fallers versus young adults. Arch. Phys. Med. Rehabil. 2001, 82, 26–30. [Google Scholar] [CrossRef]
- Kemoun, G.; Thoumie, P.; Boisson, D.; Guieu, J. Ankle dorsiflexion delay can predict falls in the elderly. J. Rehabil. Med. 2002, 34, 278–283. [Google Scholar] [CrossRef]
- Auvinet, B.; Berrut, G.; Touzard, C.; Moutel, L.; Collet, N.; Chaleil, D.; Barrey, E. Gait abnormalities in elderly fallers. J. Aging Phys. Act. 2003, 11, 40–52. [Google Scholar] [CrossRef]
- Mbourou, G.; Lajoie, Y.; Teasdale, N. Step length variability at gait initiation in elderly fallers and non-fallers, and young adults. Gerontology 2003, 49, 21–26. [Google Scholar] [CrossRef] [PubMed]
- Chiba, H.; Ebihara, S.; Tomita, N.; Sasaki, H.; Butler, J. Differential gait kinematics between fallers and non-fallers in community-dwelling elderly people. Geriatr. Gerontol. Int. 2005, 5, 127–134. [Google Scholar] [CrossRef]
- Barak, Y.; Wagenaar, R.; Holt, K. Gait characteristics of elderly people with a history of falls: A dynamic approach. Phys. Ther. 2006, 86, 1501–1510. [Google Scholar] [CrossRef]
- Toulotte, C.; Thevenon, A.; Watelain, E.; Fabre, C. Identification of healthy elderly fallers and non-fallers by gait analysis under dual-task conditions. Clin. Rehabil. 2006, 20, 269–276. [Google Scholar] [CrossRef] [PubMed]
- Karmakar, C.; Khandoker, A.; Begg, R.; Palaniswami, M.; Taylor, S. Understanding ageing effects by approximate entropy analysis of gait variability. In Proceedings of the 29th Annual International Conference of the IEEE Engineering in Medicine and Biology Society, Lyon, France, 22–26 August 2007; IEEE: Piscataway, NJ, USA, 2007; pp. 1965–1968. [Google Scholar] [CrossRef]
- Karmakar, C.; Khandoker, A.; Begg, R.; Palaniswami, M. Understanding ageing effects using complexity analysis of foot–ground clearance during walking. Comput. Methods Biomech. Biomed. Engin. 2013, 16, 554–564. [Google Scholar] [CrossRef]
- Newstead, A.; Walden, J.; Gitter, A. Gait variables differentiating fallers from nonfallers. J. Geriatr. Phys. Ther. 2007, 30, 93–101. [Google Scholar] [CrossRef] [PubMed]
- Barrett, A.; O’Connor, M.; Culhane, K.; Finucane, A.; ÓLaighin, G. A footswitch evaluation of the gait of elderly fallers with and without a diagnosis of orthostatic hypotension and healthy elderly controls. In Proceedings of the 30th Annual International Conference of the IEEE Engineering in Medicine and Biology Society, Vancouver, BC, Canada, 20–25 August 2008; IEEE: Piscataway, NJ, USA, 2008; pp. 5101–5104. [Google Scholar] [CrossRef]
- Khandoker, A.; Palaniswami, M.; Begg, R. A comparative study on approximate entropy measure and poincaré plot indexes of minimum foot clearance variability in the elderly during walking. J. Neuroeng. Rehabil. 2008, 5, 4. [Google Scholar] [CrossRef]
- Khandoker, A.; Taylor, S.; Karmakar, C.; Begg, R.; Palaniswami, M. Investigating scale invariant dynamics in minimum toe clearance variability of the young and elderly during treadmill walking. IEEE Trans. Neural Syst. Rehabil. Eng. 2008, 16, 380–389. [Google Scholar] [CrossRef] [PubMed]
- Lockhart, E.; Liu, J. Differentiating fall-prone and healthy adults using local dynamic stability. Ergonomics 2008, 51, 1860–1872. [Google Scholar] [CrossRef]
- Greany, F.; Di Fabio, R. Models to predict fall history and fall risk for community-dwelling elderly. Phys. Occup. Ther. Geriatr. 2010, 28, 280–296. [Google Scholar] [CrossRef]
- Greene, B.; O’Donovan, A.; Romero-Ortuno, R.; Cogan, L.; Scanaill, C.; Kenny, R. Quantitative falls risk assessment using the timed up and go test. IEEE Trans. Biomed. Eng. 2010, 57, 2918–2926. [Google Scholar] [CrossRef]
- Mickle, K.; Munro, B.; Lord, S.; Menz, H.; Steele, J. Foot pain, plantar pressures, and falls in older people: A prospective study. J. Am. Geriatr. Soc. 2010, 58, 1936–1940. [Google Scholar] [CrossRef]
- Kirkwood, R.; Trede, R.; Moreira, B.; Kirkwood, S.; Pereira, L. Decreased gastrocnemius temporal muscle activation during gait in elderly women with history of recurrent falls. Gait Posture 2011, 34, 60–64. [Google Scholar] [CrossRef]
- Lázaro, M.; González, A.; Latorre, G.; Fernández, C.; Ribera, J. Postural stability in the elderly: Fallers versus non-fallers. Eur. Geriatr. Med. 2011, 2, 1–5. [Google Scholar] [CrossRef]
- Lugade, V.; Lin, V.; Chou, L. Center of mass and base of support interaction during gait. Gait Posture 2011, 33, 406–411. [Google Scholar] [CrossRef]
- Panzer, V.; Wakefield, D.; Hall, C.; Wolfson, L. Mobility assessment: Sensitivity and specificity of measurement sets in older adults. Arch. Phys. Med. Rehabil. 2011, 92, 905–912. [Google Scholar] [CrossRef] [PubMed]
- Scanaill, C.; Greene, B.; Doheny, E.; O’Donovan, K.; O’Shea, T.; O´Donovan, A.; Foran, T.; Cunningham, C.; Kenny, R. Clinical gait assessment of older adults using open platform tools. In Proceedings of the 2011 Annual International Conference of the IEEE Engineering in Medicine and Biology Society, Boston, MA, USA, 30 August–3 September 2011; IEEE: Piscataway, NJ, USA, 2011; pp. 462–465. [Google Scholar] [CrossRef]
- Uemura, K.; Yamada, M.; Nagai, K.; Tanaka, B.; Mori, S.; Ichihashi, N. Fear of falling is associated with prolonged anticipatory postural adjustment during gait initiation under dual-task conditions in older adults. Gait Posture 2012, 35, 282–286. [Google Scholar] [CrossRef] [PubMed]
- Chen, T.; Chou, L. Altered center of mass control during sit-to-walk in elderly adults with and without a history of falling. Gait Posture 2013, 38, 696–701. [Google Scholar] [CrossRef] [PubMed]
- Chen, T.; Chang, C.; Chou, L. Sagittal plane center of mass movement strategy and joint kinetics during sit-to-walk in elderly fallers. Clin. Biomech. 2013, 28, 807–812. [Google Scholar] [CrossRef] [PubMed]
- Chiu, S.; Chou, L. Variability in inter-joint coordination during walking of elderly adults and its association with clinical balance measures. Clin. Biomech. 2013, 28, 454–458. [Google Scholar] [CrossRef] [PubMed]
- Fritz, N.; Worstell, A.; Kloos, A.; Siles, A.; White, S.; Kegelmeyer, D. Backward walking measures are sensitive to age-related changes in mobility and balance. Gait Posture 2013, 37, 593–597. [Google Scholar] [CrossRef] [PubMed]
- Weiss, A.; Brozgol, M.; Dorfman, M.; Herman, T.; Shema, S.; Giladi, N.; Hausdorff, J. Does the evaluation of gait quality during daily life provide insight into fall risk? a novel approach using 3-day accelerometer recordings. Neurorehabil. Neural Repair 2013, 27, 742–752. [Google Scholar] [CrossRef] [PubMed]
- Marques, N.; Hallal, C.; Crozara, L.; Morcelli, M.; Karuka, A.; Navega, M.; Gonçalves, M. Lower limb strength is associated with gait biomechanical abnormalities in older female fallers and non-fallers. Isokinet. Exerc. Sci. 2013, 21, 151–159. [Google Scholar] [CrossRef]
- Marques, N.; LaRoche, D.; Hallal, C.; Crozara, L.; Morcelli, M.; Karuka, A.; Navega, M.; Gonçalves, M. Association between energy cost of walking, muscle activation, and biomechanical parameters in older female fallers and non-fallers. Clin. Biomech. 2013, 28, 330–336. [Google Scholar] [CrossRef] [PubMed]
- Ayoubi, F.; Launay, C.; Kabeshova, A.; Fantino, B.; Annweiler, C.; Beauchet, O. The influence of fear of falling on gait variability: Results from a large elderly population-based cross-sectional study. J. Neuroeng. Rehabil. 2014, 11, 128. [Google Scholar] [CrossRef] [PubMed]
- Barelle, C.; Houel, N.; Koutsouris, D. A cluster analysis approach for the determination of a fall risk level classification. In Proceedings of the IEEE 19th International Workshop on Computer Aided Modeling and Design of Communication Links and Networks (CAMAD), Athens, Greece, 1–3 December 2014; IEEE: Piscataway, NJ, USA, 2014; pp. 130–134. [Google Scholar] [CrossRef]
- Iwata, A.; Sano, Y.; Inoue, J.; Iwata, H.; Fuchioka, S. Movement velocity is a sensitive risk factor of falls in high-functioning older adults. J. Am. Geriatr. Soc. 2014, 62, 1595–1596. [Google Scholar] [CrossRef] [PubMed]
- Kobayashi, Y.; Hobara, H.; Matsushita, S.; Mochimaru, M. Key joint kinematic characteristics of the gait of fallers identified by principal component analysis. J. Biomech. 2014, 47, 2424–2429. [Google Scholar] [CrossRef]
- König, N.; Taylor, W.; Armbrecht, G.; Dietzel, R.; Singh, N. Identification of functional parameters for the classification of older female fallers and prediction of ‘first-time’ fallers. J. R. Soc. Interface 2014, 11, 20140353. [Google Scholar] [CrossRef]
- Mignardot, J.; Deschamps, T.; Barrey, E.; Auvinet, B.; Gilles Berrut, G.; Cornu, C.; Constans, T.; Decker, L. Gait disturbances as specific predictive markers of the first fall onset in elderly people: A two-year prospective observational study. Front. Aging Neurosci. 2014, 6, 22. [Google Scholar] [CrossRef]
- Cebolla, E.; Rodacki, A.; Bento, P. Balance, gait, functionality and strength: Comparison between elderly fallers and non-fallers. Braz. J. Phys. Ther. 2015, 19, 146–151. [Google Scholar] [CrossRef]
- MacAulay, R.; Allaire, T.; Brouillette, R.; Foil, H.; Bruce-Keller, A.; Han, H.; Johnson, W.; Keller, J. Longitudinal assessment of neuropsychological and temporal/spatial gait characteristics of elderly fallers: Taking it all in stride. Front. Aging Neurosci. 2015. [CrossRef]
- Rispens, S.; Schooten, K.; Pijnappels, M.; Daffertshofer, A.; Beek, P.; Dieën, J. Identification of fall risk predictors in daily life measurements. Neurorehabil. Neural Repair 2015, 29, 54–61. [Google Scholar] [CrossRef]
- Wright, R.; Peters, D.; Robinson, P.; Watt, T.; Hollands, M. Older adults who have previously fallen due to a trip walk differently than those who have fallen due to a slip. Gait Posture 2015, 41, 164–169. [Google Scholar] [CrossRef]
- Bounyong, S.; Adachi, S.; Ozawa, J.; Yamada, Y.; Kimura, M.; Watanabe, Y.; Yokoyama, K. Fall risk estimation based on co-contraction of lower limb during walking. In Proceedings of the IEEE International Conference on Consumer Electronics (ICCE), Las Vegas, NV, USA, 7–11 January 2016; IEEE: Piscataway, NJ, USA, 2016; pp. 331–332. [Google Scholar] [CrossRef]
- Fujimoto, M.; Chou, L. Sagittal plane momentum control during walking in elderly fallers. Gait Posture 2016, 45, 121–126. [Google Scholar] [CrossRef]
- Ihlen, E.; Weiss, A.; Bourke, A.; Helbostad, J.; Hausdorff, J. The complexity of daily life walking in older adult community-dwelling fallers and non-fallers. J. Biomech. 2016, 49, 1420–1428. [Google Scholar] [CrossRef]
- Howcroft, J.; Kofman, J.; Lemaire, E.; McIlroy, W. Analysis of dual-task elderly gait in fallers and non-fallers using wearable sensors. J. Biomech. 2016, 49, 992–1001. [Google Scholar] [CrossRef]
- Rinaldi, N.; Moraes, R. Older adults with a history of falls are unable to perform walking and prehension movements simultaneously. Neuroscience 2016, 316, 249–260. [Google Scholar] [CrossRef]
- Rinaldi, N.; Emmerik, R.; Moraes, R. Changes in interlimb coordination during walking and grasping task in older adult fallers and non-fallers. Hum. Mov. Sci. 2017, 55, 121–137. [Google Scholar] [CrossRef]
- Bizovskaa, L.; Svoboda, Z.; Vuillerme, N.; Janura, M. Multiscale and shannon entropies during gait as fall risk predictors—A prospective study. Gait Posture 2017, 52, 5–10. [Google Scholar] [CrossRef] [PubMed]
- Worms, J.; Stins, J.; Wegen, E.; Loram, I.; Beek, P. Influence of focus of attention, reinvestment, and fall history on elderly gait stability. Physiol. Rep. 2017, 5, e13061. [Google Scholar] [CrossRef] [PubMed]
- Worms, J.; Stins, J.; Wegen, E.; Verschueren, S.; Beek, P.; Loram, I. Effects of attentional focus on walking stability in the elderly. Gait Posture 2017, 55, 94–99. [Google Scholar] [CrossRef]
- Marques, N.; Hallal, C.; Spinoso, D.; Morcelli, M.; Crozara, L.; Gonçalves, M. Applying different mathematical variability methods to identify older fallers and non-fallers using gait variability data. Aging Clin. Exp. Res. 2017, 29, 473–481. [Google Scholar] [CrossRef] [PubMed]
- Júnior, R.; Porto, J.; Marques, N.; Magnani, P.; Abreu, D. The effects of a simultaneous cognitive or motor task on the kinematics of walking in older fallers and non-fallers. Hum. Mov. Sci. 2017, 51, 146–152. [Google Scholar] [CrossRef] [PubMed]
- Svoboda, Z.; Bizovska, L.; Janura, M.; Kubonova, E.; Janurova, K.; Vuillerme, N. Variability of spatial-temporal gait parameters and center of pressure displacements during gait in elderly fallers and non-fallers: A 6-month prospective study. PLoS ONE 2017, 12, e0171997. [Google Scholar] [CrossRef] [PubMed]
- Allen, J.; Franz, J. The motor repertoire of older adult fallers may constrain their response to balance perturbations. J. Neurophysiol. 2018, 120, 2368–2378. [Google Scholar] [CrossRef]
- Benson, L.; Cobb, S.; Hyngstrom, A.; Keenan, K.; Luo, J.; O’Connor, K. Identifying trippers and non-trippers based on knee kinematics during obstacle-free walking. Hum. Mov. Sci. 2018, 62, 58–66. [Google Scholar] [CrossRef]
- Kwon, M.; Kwon, Y.; Park, Y.; Kim, J. Comparison of gait patterns in elderly fallers and non-fallers. Technol. Health Care 2018, 26, 427–436. [Google Scholar] [CrossRef] [PubMed]
- Marques, N.; Spinoso, D.; Cardoso, B.; Moreno, V.; Kuroda, M.; Navega, M. Is it possible to predict falls in older adults using gait kinematics? Clin. Biomech. 2018, 59, 15–18. [Google Scholar] [CrossRef]
- Howcroft, J.; Lemaire, E.; Kofman, J.; McIlroy, W. Dual-task elderly gait of prospective fallers and non-fallers: A wearable-sensor based analysis. Sensors 2018, 18, 1275. [Google Scholar] [CrossRef] [PubMed]
- Thompson, J.; Plummer, P.; Franz, J. Age and falls history effects on antagonist leg muscle coactivation during walking with balance perturbations. Clin. Biomech. 2018, 59, 94–100. [Google Scholar] [CrossRef]
- Qiao, M.; Truong, K.; Franz, J. Does local dynamic stability during unperturbed walking predict the response to balance perturbations? an examination across age and falls history. Gait Posture 2018, 62, 80–85. [Google Scholar] [CrossRef]
- Watanabe, K. Relationship between toe clearance strategy and regional regulation of rectus femoris muscle during swing phase in prolonged walking in young and older adults. Front. Physiol 2018, 9, 1274. [Google Scholar] [CrossRef]
- Bueno, G.; Ribeiro, D.; Gervásio, F.; Correia, A.; Menezes, R. Gait profile score identifies changes in gait kinematics in nonfaller, faller, and recurrent faller older adults women. Gait Posture 2019, 72, 76–81. [Google Scholar] [CrossRef]
- Gillain, S.; Boutaayamou, M.; Schwartz, C.; Dardenne, N.; Bruyère, O.; Brüls, O.; Croisier, J.; Salmon, E.; Reginster, J.; Garraux, G.; et al. Gait symmetry in the dual-task condition as a predictor of future falls among independent older adults: A 2-year longitudinal study. Aging Clin. Exp. Res. 2019, 31, 1057–1067. [Google Scholar] [CrossRef]
- Mak, T.; Young, W.; Lam, W.; Tse, A.; Wong, T. The role of attentional focus on walking efficiency among older fallers and non-fallers. Age Ageing 2019, 48, 811–816. [Google Scholar] [CrossRef]
- Yamagata, M.; Tateuchi, H.; Shimizu, I.; Saeki, J.; Ichihashi, N. The relation between limb segment coordination during walking and fall history in community-dwelling older adults. J. Biomech. 2019, 93, 94–100. [Google Scholar] [CrossRef]
- Yamagata, M.; Tateuchi, H.; Shimizu, I.; Ichihashi, N. The effects of fall history on kinematic synergy during walking. J. Biomech. 2019, 82, 204–210. [Google Scholar] [CrossRef]
- Gonzalez, M.; Gates, D.; Rosenblatt, N. The impact of obesity on gait stability in older adults. J. Biomech. 2020, 100, 109585. [Google Scholar] [CrossRef]
- Yamagata, M.; Tateuchi, H.; Shimizu, I.; Saeki, J.; Ichihashi, N. The relation between kinematic synergy to stabilize the center of mass during walking and future fall risks: A 1-year longitudinal study. BMC Geriatr. 2021, 21, 240. [Google Scholar] [CrossRef]
- Pol, F.; Forghany, S.; Hosseini, S.; Taheri, A.; Menz, H. Structural and functional foot and ankle characteristics associated with falls in older people. Gait Posture 2021, 88, 78–83. [Google Scholar] [CrossRef]
- Sadeghi, H.; Shojaedin, S.; Abbasi, A.; Alijanpour, E.; Vieira, M.; Svoboda, Z.; Nazarpour, K. Lower-extremity intra-joint coordination and its variability between fallers and non-fallers during gait. Appl. Sci. 2021, 11, 2840. [Google Scholar] [CrossRef]
- Figueiredo, A.; Balbinot, G.; Brauner, F.; Schiavo, A.; Urbanetto, M.; Mestriner, R. History of falls alters movement smoothness and time taken to complete a functional mobility task in the oldest-old: A case-control study. Exp. Gerontol. 2022, 167, 111918. [Google Scholar] [CrossRef]
- Nascimento, M.; Gouveia, E.; Gouveia, B.; Marques, A.; Martins, F.; Przednowek, K.; França, C.; Peralta, M.; Ihle, A. Associations of gait speed, cadence, gait stability ratio, and body balance with falls in older adults. Int. J. Environ. Res. Public Health 2022, 19, 13926. [Google Scholar] [CrossRef]
- Yoshida, K.; Commandeur, D.; Hundza, S.; Klimstra, M. Detecting differences in gait initiation between older adult fallers and non-fallers through multivariate functional principal component analysis. J. Biomech. 2022, 144, 111342. [Google Scholar] [CrossRef]
- Baba, T.; Watanabe, M.; Ogihara, H.; Handa, S.; Sasamoto, K.; Okada, S.; Okuizumi, H.; Teiji Kimura, T. Validity of temporo-spatial characteristics of gait as an index for fall risk screening in community-dwelling older people. J. Phys. Ther. Sci. 2023, 35, 2022–2153. [Google Scholar] [CrossRef]
- Pijnappels, M.; Bobbert, M.; Dieën, J. Push-off reactions in recovery after tripping discriminate young subjects, older non-fallers and older fallers. Gait Posture 2005, 21, 388–394. [Google Scholar] [CrossRef] [PubMed]
- Bhatt, T.; Espy, D.; Yang, F.; Pai, Y. Dynamic gait stability, clinical correlates, and prognosis of falls among community-dwelling older adults. Arch. Phys. Med. Rehabil. 2011, 92, 799–805. [Google Scholar] [CrossRef] [PubMed]
- Pavol, M.; Owings, M.; Foley, K.; Grabiner, M. Gait characteristics as risk factors for falling from trips induced in older adults. J. Gerontol. A Biol. Sci. Med. Sci. 1999, 54, M583–M590. [Google Scholar] [CrossRef] [PubMed]
- Lockhart, T.; Woldstad, J.; Smith, J. Effects of age-related gait changes on the biomechanics of slips and falls. Ergonomics 2003, 46, 1136–1160. [Google Scholar] [CrossRef] [PubMed]
- Pavol, M.; Owings, M.; Foley, K.; Grabiner, M. Mechanisms leading to a fall from an induced trip in healthy older adults. J. Gerontol. A Biol. Sci. Med. Sci. 2001, 56, M428–M437. [Google Scholar] [CrossRef] [PubMed]
- Espy, D.; Pai, Y. Relationship of frontal plane center of mass control variables to slip outcomes. J. Geriatr. Phys. Ther. 2007, 30, 137. [Google Scholar] [CrossRef]
- Yang, F.; Pai, Y. Can stability really predict an impending slip-related fall among older adults? J. Biomech. 2014, 47, 3876–3881. [Google Scholar] [CrossRef] [PubMed]
- Sawers, A.; Pai, Y.; Bhatt, T.; Ting, L. Neuromuscular responses differ between slip-induced falls and recoveries in older adults. J. Neurophysiol. 2017, 117, 509–522. [Google Scholar] [CrossRef]
- Sawers, A.; Bhatt, T. Neuromuscular determinants of slip-induced falls and recoveries in older adults. J. Neurophysiol. 2018, 120, 1534–1546. [Google Scholar] [CrossRef]
- Bruijn, S.; Sloot, L.; Kingma, I.; Pijnappels, M. Contribution of arm movements to balance recovery after tripping in older adults. J. Biomech. 2022, 133, 110981. [Google Scholar] [CrossRef] [PubMed]
- Wang, S.; Miranda, F.; Wang, Y.; Rasheed, R.; Bhatt, T. Near-fall detection in unexpected slips during over-ground locomotion with body-worn sensors among older adults. Sensors 2022, 22, 3334. [Google Scholar] [CrossRef] [PubMed]
- Wang, S.; Bhatt, T. Kinematic measures for recovery strategy identification following an obstacle-induced trip in gait. J. Mot. Behav. 2023, 55, 193–201. [Google Scholar] [CrossRef] [PubMed]
- Fukuchi, C.; Fukuchi, R.; Duarte, M. Effects of walking speed on gait biomechanics in healthy participants: A systematic review and meta-analysis. Syst. Rev. 2019, 8, 153. [Google Scholar] [CrossRef] [PubMed]
- Moosabhoy, M.; Gard, S. Methodology for determining the sensitivity of swing leg toe clearance and leg length to swing leg joint angles during gait. Gait Posture 2006, 24, 493–501. [Google Scholar] [CrossRef] [PubMed]
- Aleixo, P.; Atalaia, T.; Patto, J.; Abrantes, J. Minimum toe clearance lower limb angle joints strategies within rheumatoid arthritis post-menopausal women. Gait Posture 2019, 73, 476–477. [Google Scholar] [CrossRef]
- Bhudarally, M.; Aleixo, P.; Atalaia, T.; Abrantes, J. Swing limb biomechanics and minimum toe clearance in rheumatoid arthritis post-menopausal women fallers and non-fallers. Gait Posture 2020, 81, 40–41. [Google Scholar] [CrossRef]
- Aleixo, P.; Atalaia, T.; Patto, J.; Abrantes, J. The effect of a proprioceptive exercises programme on disease activity and gait biomechanical parameters of post-menopausal women with rheumatoid arthritis. In Rheumatoid Arthritis; Toumi, H., Ed.; IntechOpen: London, UK, 2022. [Google Scholar] [CrossRef]
- Aleixo, P.; Abrantes, J. Proprioceptive and strength exercise guidelines to prevent falls in the elderly related to biomechanical movement characteristics. Healthcare 2024, 12, 186. [Google Scholar] [CrossRef]
- Aleixo, P.; Atalaia, T.; Abrantes, J. Dynamic joint stiffness: A critical review. In Advances in Medicine and Biology; Berhardt, V., Ed.; Nova Science Publishers, Inc.: Hauppauge, NY, USA, 2021; Volume 175, pp. 1–96. [Google Scholar]
- Aleixo, P.; Atalaia, T.; Patto, J.; Abrantes, J. Sit-to-stand of rheumatoid arthritis post-menopausal women vs. healthy post-menopausal—Antero-posterior displacement of centre of gravity and centre of pressure. Gait Posture 2018, 65, 384–385. [Google Scholar] [CrossRef]
- Caron, O.; Gelat, T.; Rougier, P.; Blanchi, J. A comparative analysis of the center of gravity and center of pressure trajectory path lengths in standing posture: An estimation of active stiffness. J. Appl. Biomech. 2000, 16, 234–247. [Google Scholar] [CrossRef] [PubMed]
- Takeda, K.; Mani, H.; Hasegawa, N.; Sato, Y.; Tanaka, S.; Maejima, H.; Asaka, T. Adaptation effects in static postural control by providing simultaneous visual feedback of center of pressure and center of gravity. J. Physiol. Anthr. 2017, 36, 31. [Google Scholar] [CrossRef] [PubMed]
- Schmitt, A.; Baudendistel, S.; Lipat, A.; White, T.; Raffegeau, T.; Hass, C. Walking indoors, outdoors, and on a treadmill: Gait differences in healthy young and older adults. Gait Posture 2021, 90, 468–474. [Google Scholar] [CrossRef] [PubMed]
- Di Paolo, S.; Lopomo, N.; Villa, F. Rehabilitation and return to sport assessment after anterior cruciate ligament injury: Quantifying joint kinematics during complex high-speed tasks through wearable sensors. Sensors 2021, 21, 2331. [Google Scholar] [CrossRef] [PubMed]
- Müller, B.; Ilg, W.; Giese, M.; Ludolph, N. Validation of enhanced kinect sensor based motion capturing for gait assessment. PLoS ONE 2017, 12, e0175813. [Google Scholar] [CrossRef]
- Springer, S.; Seligmann, G. Validity of the kinect for gait assessment: A focused review. Sensors 2016, 16, 194. [Google Scholar] [CrossRef]
- Aleixo, P.; Patto, J.; Abrantes, J. Dynamic joint stiffness of the ankle in rheumatoid arthritis postmenopausal women fallers and non-fallers. Gait Posture 2017, 57, 324–325. [Google Scholar] [CrossRef]


| Study | Inclusion and/or Exclusion Criteria Definition of Fall | Sample Characteristics | Gait Assessment | Gait Parameters Related to Falls (Fallers vs. Non-Fallers) | Gait Parameters Not Related to Falls (Fallers vs. Non-Fallers) |
|---|---|---|---|---|---|
| Heitmann et al., 1989 [20] | Exclusion criteria: Parkinson’s disease; multiple sclerosis; or residual effects from a stroke. Inclusion criteria: able to walk 90 feet without an assistive device and to be independent in activities of daily living. Definition of fall: not reported. | Community-dwelling elderly women: 26 fallers (≥1 fall in past year; 75.1 ± 7.7 years). 84 non-fallers (73.1 ± 7.0 years). | Subjects walked on paper walkways making ink prints for step-width measurements. 3 trials were performed; the best one was used for analysis. | Step width (cm): 7.44 vs. 6.54; step width variability (SD; cm): 3.60 vs. 3.35. | |
| Gehlsen & Whaley, 1990 [21] | Exclusion criteria: uncontrolled hypertension; angina pectoris; recent myocardial infarction; or disabling injury to legs and back. Definition of fall: not reported. | Community-dwelling elderly: 25 fallers (≥1 fall in past 10 months; 7 males; 72.4 ± 4.7 years). 30 non-fallers (12 males; 71.3 ± 4.4 years). | Subjects walked on a treadmill at 4 km/h and 6 km/h. They were filmed by two cameras (64 Hz; sagittal and frontal planes). MTC was analyzed. | 6 km/h: heel width (cm): 7.39 vs. 6.41. | 4 km/h: heel width (cm): 7.77 vs. 7.19. 4 km/h and 6 km/h: stride length (m): 0.58 vs. 0.59; 0.73 vs. 0.72; MTC (cm): 1.15 vs. 0.70; 0.77 vs. 0.68; single support phase (s): 0.49 vs. 0.50; 0.45 vs. 0.44; double support phase (s): 0.14 vs. 0.15; 0.11 vs. 0.11; swing phase (s): 0.35 vs. 0.35; 0.34 vs. 0.34; cadence (stride/s): 2.05 vs. 2.01; 2.26 vs. 2.21; hip displacement (°): 65–104 vs. 64–105; knee displacement (°): 9–62 vs. 8–63; 7–63 vs. 8–62; ankle displacement (°): 98–120 vs. 97–120; 103–125 vs. 99–122. |
| Feltner et al., 1994 [22] | Exclusion and inclusion criteria: not reported. Definition of fall: event that results in a subject coming to rest inadvertently on the ground. | Community-dwelling elderly women: 6 fallers (≥1 fall in past year; 71.7 ± 2.6 years). 11 non-fallers (74.4 ± 1.7 years). | Subjects walked at their preferred gait speed across an 8.2 m walkway filmed by two cameras (60 Hz; sagittal and frontal planes). At least 3 trials were collected, and the trial with a complete stride in the side view camera footage was used for analysis. AP and ML velocities of CoM were calculated. | Stride length (m): 1.12 vs. 1.16; right and left step length (m): 0.57 vs. 0.60, 0.54 vs. 0.56; step width (m): 0.22 vs. 0.22; stride time (s): 1.05 vs. 1.02; right and left step time (s): 0.59 vs. 0.53, 0.46 vs. 0.50; single support (%): 69.8 vs. 68.5; swing phase (%): 31.1 vs. 32.9; CoM AP velocity (m/s): 1.08 vs. 1.14; CoM ML velocity (m/s): −0.19 vs. −0.20; minimum and maximum hip position (°): −6 vs. −10; 26 vs. 26; minimum and maximum knee position (°): 175 vs. 175; 118 vs. 116; minimum and maximum ankle position (°): 12 vs. 8; −12 vs. −14; width of the base of support (m): 0.14 vs. 0.15. | |
| Wolfson et al., 1995 [23] | Exclusion criteria: terminal illness; severe dementia; non-ambulatory status; required use of a walker; amputations; severe arthritis; major impairment due to neurologic disease; or episodes of loss of consciousness. Definition of fall: not reported. | Community-dwelling elderly: 18 fallers (≥2 falls in past year; mean age 82.2 years). 15 non-fallers (mean age 84.6 years). | Not reported. | Gait speed (m/s): 0.37 vs. 0.64; stride length (m): 0.53 vs. 0.82. | |
| Maki, 1997 [24] | Inclusion criteria: able to walk 10 m with or without a walking aid and understand verbal instructions. Definition of fall: event that results in a subject coming to rest inadvertently on the ground. | Community-dwelling elderly: 43 fallers (≥1 fall in 1-year follow-up; 8 males; 82.8 ± 6.2 years). 32 non-fallers (6 males; 81.0 ± 6.7 years). | Subjects walked with their own footwear at their preferred gait speed across an 8 m walkway. Four trials were filmed but only the last two were included in the analysis. | Stride length variability (SD): higher values in fallers; double support phase variability (SD): higher values in fallers; gait speed variability (SD): higher values in fallers. | Stride length; stride time; double support phase; gait speed; stride width variability (SD); stride time variability (SD). |
| Lee & Kerrigan, 1999 [25] | Exclusion criteria: musculoskeletal, neurological, or cardiac diseases. Definition of fall: event that results in a subject coming to rest inadvertently on the ground or other lower level. | Community-dwelling elderly: 15 fallers (≥2 falls in past 6 months; 7 males; 77.0 ± 9.0 years). 15 non-fallers (8 males; 75.0 ± 5.0 years). | Subjects walked barefoot or with their shoes at a preferred gait speed across a 30-foot walkway. Kinematic data (using a 4-camera optoelectronic motion analysis system at 100 Hz) and ground reaction forces (using 2 force plates) were collected during 3 trials. | Gait speed (m/s): 0.41 vs. 0.82; cadence (steps/s): 86 vs. 111; step length (m): 0.24 vs. 0.40; hip flexion moment (Nm/kg): 0.96 vs. 0.44; hip adduction moment (Nm/kg): 1.49 vs. 0.69; knee varus moment (Nm/kg): 0.86 vs. 0.33; knee extension moment (Nm/kg): 0.40 vs. 0.21; ankle dorsiflexion moment (Nm/kg): 1.59 vs. 0.91; ankle plantarflexion moment (Nm/kg): 0.075 vs. 0.139; ankle eversion moment (Nm/kg): 0.43 vs. 0.13; knee power absorption (W/kg): 0.98 vs. 1.66; ankle power absorption (W/kg): 0.76 vs. 0.41. | Hip extension moment (Nm/kg): 0.67 vs. 0.74; knee flexion moment (Nm/kg): 0.59 vs. 0.46; ankle inversion moment (Nm/kg): 014 vs. 0.07; hip power generation (W/kg): 1.23 vs. 1.18; knee power generation (W/kg): 0.54 vs. 0.55; ankle power generation (W/kg): 2.03 vs. 2.04; hip power absorption (W/kg): 0.44 vs. 0.61. |
| Nelson et al., 1999 [26] | Inclusion criteria: independent subjects. Definition of fall: not reported. | Community-dwelling elderly: 11 fallers (1 male; 79.4 ± 8.7 years). 13 non-fallers (4 males; 80.1 ± 6.0 years). | Subjects walked on an electronic walkway at their preferred gait speed and completed 4 trials. | Gait speed (m/s): 0.82 vs. 1.25; left and right step times (s): 0.61 vs. 0.53, 0.60 vs. 0.52; left and right heel to heel base of support (cm): 12.5 vs. 9.7, 12.4 vs. 9.6; left and right double support phase (%): 35.0 vs. 26.0, 34.0 vs. 26.0. | |
| Wall et al., 2000 [27] | Exclusion and inclusion criteria: not reported. Definition of fall: not reported. | Community-dwelling elderly: 10 fallers (≥2 falls in past 2 years; 75.8 ± 9.3 years). 10 non-fallers (72.7 ± 4.0 years). | Gait was assessed during an expanded Timed Up and Go test. A 10 m walkway was used. A stopwatch recorded the intervals between each phase. | Front walk: gait speed (m/s): 0.81 vs. 1.23. Return walk: gait speed (m/s): 0.78 vs. 1.23. | |
| Hausdorff et al., 2001 [28] | Exclusion criteria: unable to follow simple instructions; nursing home residents; or life expectancy of less than 1 year. Definition of fall: not reported. | Community-dwelling elderly (16 males; 80.3 ± 5.9 years): 20 fallers (≥1 fall in 1-year follow-up). 32 non-fallers. | Subjects walked at their preferred gait speed for up to 6 min, wearing force-sensitive insoles that measured the gait rhythm on a stride-to-stride basis. | Stride time variability (SD; s): 0.11 vs. 0.05; swing time variability (SD; s): 0.04 vs. 0.03. | Gait speed (m/s): 0.71 vs. 0.91 (statistical tendency for difference, p = 0.078). |
| Kerrigan et al., 2001 [30] Kerrigan et al., 2000 [29] | Exclusion criteria: acute medical illness; diagnosis or symptoms of unstable angina or congestive heart failure; pulmonary disease diagnosis or symptoms; neurologic disorders that impair mobility; major orthopedic diagnosis in the lower back, pelvis, or lower extremities; or active joint or musculoskeletal pain. Additional exclusion criteria for fallers: falls secondary to syncope, acute illness, or other specific causes including metabolic disorders; medication side effects, true vertigo; or neurologic or lower extremity orthopedic diagnoses. Definition of fall: event that results in a subject coming to rest inadvertently on the ground or other lower level. | Community-dwelling elderly: 16 fallers (≥2 falls in last 6 months; 8 males; 77.0 ± 7.8 years). 23 non-fallers (10 males; 73.2 ± 5.6 years). | Subjects walked barefoot at their preferred and fast gait speed across a 10 m walkway. Kinematic data were collected during 3 trials using an optoelectronic motion analysis system at 100 Hz and ground reaction forces using 2 force plates. | Preferred gait speed: gait speed (m/s): 0.89 vs. 1.21; stride length (m): 0.98 vs. 1.22; hip flexion moment (Nm/kg): 0.53 vs. 0.38; hip extension moment (Nm/kg): 0.22 vs. 0.54; hip power absorption (W/kg): 0.13 vs. 0.40; hip power generation during pre-swing (W/kg): 0.43 vs. 0.92; hip adduction moment (Nm/kg): 0.47 vs. 0.57; knee flexion moment during mid-stance (Nm/kg): 0.15 vs. 0.27; knee flexion moment during pre-swing (Nm/kg): 0.07 vs. 0.24; knee power absorption during pre-swing (W/kg): 0.31 vs. 1.29; ankle power generation during pre-swing (W/kg): 1.10 vs. 1.74; hip extension (°): 11 vs. 14. Fast gait speed: gait speed (m/s): 1.34 vs. 1.57; stride length (m): 1.17 vs. 1.34; hip extension (°): 12 vs. 14. | Preferred speed: cadence (steps/min): 107 vs. 120; hip flexion moment during swing (Nm/kg): 0.08 vs. 0.11; hip power generation during loading response (W/kg): 0.50 vs. 0.50; hip abduction moment (Nm/kg): 0.08 vs. 0.07; hip internal rotation moment (Nm/kg): 0.14 vs. 0.14; hip external rotation moment (Nm/kg): 0.09 vs. 0.12; knee extension moment during terminal stance (Nm/kg): 0.16 vs. 0.16; knee power absorption during loading response (W/kg): 0.14 vs. 0.27; knee power generation during mid-stance (W/kg): 0.25 vs. 0.35; knee varus moment (Nm/kg): 0.25 vs. 0.27; knee valgus moment (Nm/kg): 0.02 vs. 0.02; knee internal rotation moment (Nm/kg): 0.14 vs. 0.13; knee external rotation moment (Nm/kg): 0.10 vs. 0.11; ankle plantarflexion moment (Nm/kg): 0.06 vs. 0.09; ankle dorsiflexion moment (Nm/kg): 0.73 vs. 0.75; ankle power absorption (W/kg): 0.43 vs. 0.44; ankle inversion moment (Nm/kg): 0.02 vs. 0.05; ankle eversion moment (Nm/kg): 0.18 vs. 0.11; ankle internal rotation moment (Nm/kg): 0.17 vs. 0.16; ankle external rotation moment (Nm/kg): 0.09 vs. 0.09; hip flexion (°): 21 vs. 26; knee flexion during stance (°): 11 vs. 17; knee extension during stance (°): 2 vs. 2; knee flexion during swing (°): 52 vs. 58; knee extension during swing (°): 2 vs. 3; ankle plantarflexion during initial stance (°): 8 vs. 8; ankle dorsiflexion during mid-stance (°): 8 vs. 9; ankle plantarflexion (°): 14 vs. 15; ankle dorsiflexion during swing (°): 2 vs. 2; peak anterior pelvic tilt (°): 3 vs. 3. Fast gait speed: cadence (steps/min): 138 vs. 140; hip flexion (°): 25 vs. 30; knee flexion during stance (°): 16 vs. 21; knee extension during stance (°): 3 vs. 2; knee flexion during swing (°): 55 vs. 61; knee extension during swing (°): 3 vs. 6; ankle plantarflexion initial during stance (°): 8 vs. 7; ankle dorsiflexion during mid-stance (°): 6 vs. 7; ankle plantarflexion (°): 14 vs. 16; ankle dorsiflexion during swing (°): 1 vs. 2; peak anterior pelvic tilt (°): 4 vs. 4. |
| Kemoun et al., 2002 [31] | Exclusion and inclusion criteria: not reported. Definition of fall: unexpected event when a subject falls to the ground from the same or an upper level (including falls on stairs and onto a piece of furniture). | Community-dwelling elderly (66.7 ± 4.8 years): 16 fallers (≥1 fall in 1-year follow-up; 12 males). 38 non-fallers (26 males). | Subjects walked barefoot at their preferred gait speed across a 10 m walkway. Kinematic data were collected during 5 trials using a 5-camera optoelectronic motion analysis system at 50 Hz and ground reaction force using two integrated force platforms at 250 Hz. | Gait speed (m/s): 0.96 vs. 1.29; double support phase (%): 27.8 vs. 23.2; ankle moment peak (Nm/kg): 25 vs. 23; ankle plantarflexion during second double support (°): 19 vs. 23; ankle dorsiflexion at beginning of swing (°): 7 vs. 13; hip power variation (W/kg): 1.02 vs. 2.04; hip moment peak (Nm/kg): −0.54 vs. −0.97; hip moment variation (Nm/kg): 0.88 vs. 1.60; hip displacement (°): 40 vs. 47. | Cadence (step/min): 99 vs. 108 (statistical tendency for difference, p = 0.059); stride length (m): 1.12 vs. 1.31; step length (m): 0.57 vs. 0.65; stride time (s): 1.20 vs. 1.11 (statistical tendency for difference, p = 0.058); single support phase (%): 37 vs. 38.2; step time (%): 49.3 vs. 50.0; single support start (%): 13.5 vs. 13.6; double support start (%): 50.7 vs. 50.0; swing start (%): 64.6 vs. 62.1 (statistical tendency for difference, p = 0.077); ankle power peak (W/kg): 2.5 vs. 3.1; ankle moment peak (Nm/kg): 1.58 vs. 1.54; knee power peak (W/kg): −0.81 vs. −1.35; knee power variation (W/kg): 0.91 vs. 1.42; knee moment peak (Nm/kg): −0.17 vs. −0.04; knee moment variation (Nm/kg): 0.74 vs. 0.74; knee position peak (°): 62 vs. 63; knee displacement (°): 50 vs. 52; hip power peak (W/kg): −0.93 vs. −1.23; hip position peak (°): 57 vs. 61. |
| Auvinet et al., 2003 [32] | Inclusion criteria (fallers): recently hospitalized due to falls; living at home; and no pelvic or leg length asymmetries. Inclusion criteria (non-fallers): no history of musculoskeletal, neurological, or gait disorder; living at home; and no marked pelvic asymmetry or leg length differences. Definition of fall: not reported. | Community-dwelling elderly: 20 fallers (≥1 fall in past year; 2 males; 80.7 ± 5.2 years). 33 non-fallers (18 males; 77.2 ± 6.5 years). | Subjects walked at their preferred gait speed across a 10 m walkway using their own shoes. Gait parameters were collected using an accelerometer sensor system (50 Hz). | Gait speed (m/s): 0.73 vs. 1.24; stride length (m): 0.86 vs. 1.28; stride frequency-cadence (Hz): 0.86 vs. 0.97; stride symmetry: 173 vs. 211. | |
| Mbourou et al., 2003 [33] | Exclusion criteria: Parkinson’s disease or Alzheimer’s disease. Inclusion criteria (fallers): living in a nursing home. Definition of fall: not reported. | Elderly: 9 fallers (≥1 fall in past year; mean age 80.0 years, range 74.0–91.0). 8 non-fallers (mean age 73.0 years, range 66.0–82.0). | Subjects were asked to initiate gait and walk at least 3 strides. The length of the first step and subsequent strides were collected using transducers. Gait parameters were derived from the displacement signal obtained from each foot. More than 10 trials were collected. | First step length (m): 0.30 vs. 0.53; first step length variability (SD; m): 0.13 vs. 0.06; first double support phase (%): 32 vs. 22; second stride length (m): 0.68 vs. 0.92; second stride length variability (SD; m): 0.10 vs. 0.05; double support phase for subsequent strides (%): 37 vs. 32. | |
| Pijnappels et al., 2005 [103] | Exclusion and inclusion criteria: not reported. Definition of fall: when the vertical force in the ropes exceeded 200 N during trials when one obstacle appeared from the ground unexpectedly to catch the subject’s swing limb. | Community-dwelling elderly: 7 fallers (when the vertical force in the ropes exceeded 200 N during trip trials; 1 male; 67.9 ± 2.6 years). 4 non-fallers (3 males; 66.5 ± 3.3 years). | Subjects walked at preferred gait speed over a platform. Kinematic and ground reaction force data were collected using a 4-camera optoelectronic motion analysis system and a force plate (100 Hz). | Stance time; double support time. | |
| Chiba et al., 2005 [34] | Exclusion criteria: Mini Mental Status Examination score < 24; arthritis in lower limbs; back, knee, or hip chronic pain; Parkinson’s disease; Ménière’s syndrome; cerebellar signs; or peripheral neuropathy under standard neuropsychological assessment. Inclusion criteria: being medically stable; comprehending the nature of the study and our instructions; and being able to stand up and walk independently without an assistance device. Definition of fall: a sudden unintentional change in position causing a subject to land at a lower level or ground. | Community-dwelling elderly: 25 fallers (≥2 falls in past year; 11 males; 76.0 ± 6.6 years). 31 non-fallers (11 males; 74.9 ± 7.2 years). | Subjects walked barefoot or with their own shoes on a 6 m walkway. During 2 continuous trials, kinematic data were collected using a 5-camera optoelectronic motion analysis system (60 Hz). MTC was analyzed. | Gait speed (m/s): 0.66 vs. 0.99; stride length (m): 0.77 vs. 1.06; stride time (s): 1.20 vs. 1.08; MTC (mm): 12.0 vs. 15.2; MTC variability (CV; %): 29 vs. 25; maximum foot angle with ground (°): 7.4 vs. 14.3; variability in the maximum foot angle with ground (CV; %): 34 vs. 19; maximal ML displacement of trunk center (mm): 0.23 vs. 0.18; variability in the maximal ML displacement of trunk center (CV; %): 6 vs. 1. | |
| Barak et al., 2006 [35] | Exclusion criteria: cardiopulmonary, musculoskeletal, somatosensory, or neurological disorders or severe visual and vestibular loss. Definition of fall: not reported. | Community-dwelling elderly: 21 fallers (≥1 fall in last 6 months; 8 males; 73.8 ± 6.4 years). 27 non-fallers (14 males; 72.1 ± 4.9 years). | Subjects walked at their preferred gait speed; treadmill speed was gradually increased from 0.18 m/s to 1.52 m/s in steps of 0.225 m/s and then decreased. During 1 min in each step, kinematic data were collected using an optoelectronic motion analysis system (100 Hz). CoM was calculated. | Effects of gait speed: cadence: in all gait speeds; stride length: only in 1.3 m/s gait speed; CoM lateral sway: from 1.07 m/s gait speed; ankle plantarflexion: from 1.07 m/s gait speed; hip extension: from 0.85 m/s gait speed; hip flexion: from 0.85 m/s gait speed; hip flexion variability: only in 1.52 m/s gait speed. Effects of stride frequency: stride length: in 1.1 and 1.2 stride frequencies; lateral body sway: in 0.6–1.1 stride frequencies; hip extension: in 0.5–1.0 stride frequencies; hip extension variability: in 0.9–1.2 stride frequencies; hip flexion: in 1.0 stride frequency; hip flexion variability: in 0.9–1.2 stride frequency. | Effects of stride frequency: ankle plantarflexion. |
| Toulotte et al., 2006 [36] | Exclusion criteria: lower limb fracture or surgery; use of walking aid or foot orthosis; cognitive disorders; auditory, ocular, or vestibular problems; head trauma with/without loss of consciousness; stroke; carpal tunnel syndrome; or sores on lower limbs or corns. Inclusion criteria: ≥60 years and stable medical treatment (for at least 3 months). Definition of fall: any event that led to an unplanned contact with a supporting surface. | Community-dwelling elderly women: 21 fallers (≥1 fall in past 2 years; 70.4 ± 6.4 years). 19 non-fallers (67.0 ± 4.8 years). | Subjects walked at preferred gait speed across a 10 m walkway. During 10 trials, kinematic data were collected using an optoelectronic motion analysis system (50 Hz) and three force plates (250 Hz). | Cadence (steps/min): 116 vs. 119; gait speed (m/s): 1.08 vs. 1.12; stride time (s): 1.04 vs. 1.02; step time (s): 0.53 vs. 0.51; single support time (s): 0.48 vs. 0.48; stride length (m): 1.13 vs. 1.09; step length (m): 0.56 vs. 0.60. | |
| Karmakar et al., 2012 [38] Karmakar et al., 2007 [37] | Exclusion and inclusion criteria: not reported. Definition of fall: not reported. | Community-dwelling elderly women: 10 fallers (≥1 fall in past year; 72.2 ± 3.1 years). 27 non-fallers (69.1 ± 5.1 years). | Subjects walked on a treadmill at preferred gait speed. During the first 500 continuous gait cycles, MTC data were collected using a 2D motion analysis system and analyzed by an ApEn and a SampEn. ApEn was calculated with m = 3 and r from 0 to 90% of the calculated SD. SampEn was calculated with m varying from 2 to 4 and r from 0 to 90% of the calculated SD. | Gait speed (m/s): 0.91 vs. 1.29; MTC (cm): 2.02 vs. 1.25; MTC variability (SD; cm): 0.47 vs. 0.32. For r < 0.26 * SD, the mean MTC ApEn of fallers was higher than non-fallers. For r ≥ 0.26 * SD, the mean MTC ApEn of fallers was smaller than non-fallers. MTC SampEn values of fallers were lower compared to non-fallers for all m and r. | |
| Newstead et al., 2007 [39] | Exclusion criteria: neurological or orthopedic conditions. Inclusion criteria: ≥60 years; be able to walk 1 mile nonstop; and free of neurological or orthopedic impairments. Definition of fall: not reported. | Community-dwelling elderly: 18 fallers (≥1 fall in past year; 3 males; 78.1 ± 7.2 years). 30 non-fallers (6 males; 75.8 ± 5.1 years). | Subjects walked 5–7 trials at three different gait speeds (slow, preferred, and fast) across a 10 m walkway using laced walking shoes. Spatiotemporal data were collected using a 6-camera optoelectronic motion analysis system (60 Hz) and four force plates (250 Hz). | Preferred gait speed: gait speed (lower fallers); cadence (lower fallers); step length (lower fallers); stride length (lower fallers); single support time (lower fallers); double support time (higher fallers). Fast gait speed: stride length (lower fallers); cadence (lower fallers); gait speed (lower fallers). | Slow gait speed: gait speed; cadence; step length; stride length; single support time; double support time. Fast gait speed: step length; single support time; double support time. |
| Barrett et al., 2008 [40] | Exclusion criteria: limited pulmonary and cardiac function; use of pacemakers; or cognitive impairment. Inclusion criteria: independent ambulation for at least 6 m. Definition of fall: subject who had fallen from vertical to horizontal. | Community-dwelling elderly: 9 fallers (≥2 falls in past year; 5 males; 76.0 ± 5.0 years). 10 non-fallers (5 males 69.0 ± 5.0 years). | Subjects walked at preferred gait speed over a 6 m walkway. Gait events were detected using footswitches embedded in the left shoe. Three walks were recorded for analysis. | Stance time (higher fallers); stride time (higher fallers); stance phase (higher fallers); stance time variability (SD; higher fallers); stride time variability (SD; higher fallers). | Swing time; swing time variability (SD). |
| Khandoker et al., 2008 [41] | Exclusion and inclusion criteria: not reported. Definition of fall: not reported. | Community-dwelling elderly: 10 fallers (≥1 fall; 72.2 ± 3.1 years). 14 non-fallers (71.0 ± 2.1 years). | Subjects walked 10–20 min on the treadmill. MTC data were collected using a 2D motion analysis system (50 Hz) and analyzed by ApEn and Poincaré Plot Indexes. ApEn was calculated with m = 3 and r from 0 to 90%. SampEn was calculated with m varying from 2 to 3 and r from 15%. | MTC ApEn values: 0.18 vs. 0.13; MFC variability (SD; cm): 0.48 vs. 0.35; Poincaré width: 0.72 vs. 0.51; Poincaré length: 1.15 vs. 0.89. | MFC (cm): 2.01 vs. 1.65; Poincaré width/Poincaré length: 0.64 vs. 0.64. |
| Khandoker et al., 2008 [42] | Exclusion and inclusion criteria: not reported. Definition of fall: not reported. | Community-dwelling elderly women: 10 fallers (≥1 fall in past year; 72.2 ± 3.1 years). 27 non-fallers (69.1 ± 5.1 years). | Subjects walked 10 min on a treadmill at preferred gait speed. MTC data were collected using a 2D motion analysis system (50 Hz). The following variability indices were quantified: Poincaré plot indices (SD1, SD2, SD1/SD2); wavelet-based multiscale exponent; and detrended fluctuation analysis exponent to investigate the presence of long-range correlations in MTC time series. | MTC (cm): 2.02 vs. 1.25. Wavelet-based multiscale exponent, SD1/SD2, and SD2 of critical MTC parameters were found to be potential markers to be able to reliably identify fallers from non-fallers. | |
| Lockhart & Liu, 2008 [43] | Exclusion and inclusion criteria: not reported. Definition of fall: not reported. | Community-dwelling elderly: 4 fallers (≥1 fall in past 6 months; 70.1 ± 3.0 years). 4 non-fallers (71.3 ± 6.5 years). | Subjects walked for 1 min on a treadmill at their preferred gait speed. One dual-axial accelerometer was placed on the right anterior superior iliac spine (125 Hz). Maximum Lyapunov exponent was used to analyze these data. Two infrared-reflective markers were placed bilaterally on the heels for kinematic capture with a 6-camera optoelectronic motion analysis system (120 Hz). | Maximum Lyapunov exponent: 2.39 vs. 1.99; step length (m): 0.33 vs. 0.60; gait speed (m/s): 0.57 vs. 1.16. | Heel contact velocity (m/s): 0.32 vs. 0.43; step duration (s): 1.19 vs. 1.04. |
| Verghese et al., 2009 [14] | Exclusion criteria: severe audiovisual loss; bed-bound due to illness; or institutionalization. Definition of fall: unintentionally coming down on the floor or to a lower level, not due to a major intrinsic or extrinsic event. | Community-dwelling elderly (227 males; mean age 80.6 years): 226 fallers (115 fell once and 111 had recurrent falls; mean age 81.1 years). 371 non-fallers (mean age 80.1 years). | Subjects walked at preferred gait speed during 2 trials on a computerized walkway with embedded pressure sensors using comfortable footwear. Generalized estimating equations with a binomial distribution to model the probability of fall. | Slower gait speed (risk ratio per 10 cm/s decrease 1.069, 95% confidence interval: 1.001–1.142) is associated with a higher risk of falls. Predicted fall risk: swing phase (RR 1.406, 95% confidence interval 1.027–1.926); double-support phase (RR 1.165, 95% confidence interval: 1.026–1.321); swing time variability–CV (RR 1.007, 95% confidence interval: 1.004–1.010); stride length variability–CV (RR 1.076, 95% confidence interval: 1.030–1.111). | |
| Greany & Di Fabio, 2010 [44] | Inclusion criteria: ≥70 years; living at home; can walk at least 30 feet without stopping; Mini Mental Status Examination score > 23; corrected visual acuity of at least 20/70; and peripheral visual field of 30°. Definition of fall: unintentionally coming to rest on the ground. | Community-dwelling elderly: 12 fallers (≥1 fall in past year; 3 males, 86.0 ± 4.8 years). 21 non-fallers (7 males, 81.0 ± 5.0 years). | Subjects walked quickly but safely along a walkway of four irregularly spaced stepping targets. During 6 trials, a video-based motion analysis system was used for collecting kinematic data. | Maximum foot AP velocity (m/s): 1.91 vs. 2.05; maximum foot vertical velocity (m/s): 0.54 vs. 0.53; average foot AP velocity (m/s): 0.36 vs. 0.36; step time (s): 1.64 vs. 1.51; step length (m): 0.76 vs. 0.83; swing time (s): 0.67 vs. 0.68; double support time (s): 0.45 vs. 0.35. | |
| Greene et al., 2010 [45] | Inclusion criteria: ≥60 years; able to walk independently with or without help; and able to provide informed consent. Definition of fall: unexpected loss of stability resulting in coming to rest on the floor or an object below the knee level. | Community-dwelling elderly: 207 fallers (≥1 fall in past 5 years; 44 males; 74.0 ± 7.3 years). 142 non-fallers (59 males; 71.1 ± 6.9 years). | Gait was assessed during the Timed Up and Go test through two wearable tri-axial accelerometer sensors placed on each shank. | Cadence (steps/min): 99 vs. 108; double support (s): 0.4 vs. 0.5; step time (s): 0.7 vs. 0.6; minimum shank ML angular velocity (lower fallers); mean shank ML angular velocity (lower fallers); maximum shank ML angular velocity (lower fallers); minimum shank AP angular velocity (lower fallers); mean shank AP angular velocity (lower fallers); maximum shank AP angular velocity (lower fallers). | Stance time (s): 0.8 vs. 0.8; single support time (s): 0.8 vs. 0.8; stride time (s): 1.2 vs. 1.2; swing time (s): 0.5 vs. 0.5; single support time variability (CV; %): 22.9 vs. 21.1; double support variability (CV; %): 80.7 vs. 82.6; swing time variability (CV; s): 28.1 vs. 31.0; stride time variability (CV; s): 24.0 vs. 23.4; step time variability (CV; s): 42.0 vs. 40.3; stance time variability (CV; s): 43.3 vs. 45.0. |
| Mickle et al., 2010 [46] | Inclusion criteria: ≥60 years; living independently in the community; passed the Short Portable Mental Status Questionnaire; able to ambulate for at least 10 m with or without aid; no neurological diseases; and own transport to a testing venue in the community. Definition of fall: unintentionally coming to rest on the ground or other lower level, not as a result of a major intrinsic event (e.g., stroke). | Community-dwelling elderly: 107 fallers (≥1 fall in 1-year follow-up; 49 males; 71.6 years). 196 non-fallers (105 males; 71.2 years). | Five trials were recorded with a two-step gait initiation protocol at a preferred walking speed. A pressure platform was used. | Peak pressure (KPa): 776 vs. 699; pressure–time integral (KPa): 349 vs. 311. | |
| Bhatt et al., 2011 [104] | Exclusion criteria: Folstein Mini Mental Status Examination score < 25 or classified as osteopenic or osteoporotic. Definition of fall: if the force recorded on the safety harness load cell force exceeded 30% of the body weight. | Community-dwelling elderly (44 males): 59 fallers (the force recorded on the safety harness load cell force exceeded 30% of the body weight; 71.6 ± 4.6 years). 56 recoveries (71.4 ± 5.1 years). | Subjects walked for 9–12 trials on a 7 m walkway using their own athletic shoes. Kinematic and ground reaction force data were collected during 5 trials using an 8-camera optoelectronic motion analysis system (120 Hz) and one force platform (600 Hz). | Absolute CoM velocity (m/s): 0.95 vs. 1.0; step length (m): 0.34 vs. 0.34. | |
| Kirkwood et al., 2011 [47] | Exclusion criteria: orthopedic or neurological diseases that could affect gait performance. Inclusion criteria: female; ≥60 years; and ability to walk without assistance. Definition of fall: unexpected event in which a subject comes to rest on a lower level. | Community-dwelling elderly women: 45 fallers (≥2 falls in past 12 months; 74.0 ± 5.6 years). 44 non-fallers (absence of falls or 1 fall in past 12 months; 70.7 ± 5.4 years). | Subjects walked barefoot on a 6 m rubber mat while EMG recorded soleus, tibialis anterior, and gastrocnemius muscle signals. Footswitches tracked gait events. | Gastrocnemius activity during stance phase (%): 16.9 vs. 19.8; stride time (s): 1.2 vs. 1.3. | Tibialis anterior activity during stance phase (%): 9.2 vs. 9.3; soleus activity during stance phase (%): 22.1 vs. 24.9; gastrocnemius latency activity (s): 0.30 vs. 0.30; tibialis anterior latency activity (s): 0.04 vs. 0.03; soleus latency activity (s): 0.30 vs. 0.30; swing phase (%): 40.2 vs. 39.7; stance phase (%): 59.8 vs. 60.3. |
| Lázaro et al., 2011 [48] | Exclusion criteria: ≥65 years; severe cognitive deterioration; unable to stand; or terminally ill. Inclusion criteria (fallers): had visited their General Practitioner or Geriatrician due to the occurrence of falls. Definition of fall: not reported. | Community-dwelling elderly: 99 fallers (≥2 falls in past 6 months; 17 males; 78.0 ± 5.0 years). 113 non-fallers (no falls in past 6 months). | Gait assessments of subjects were evaluated using the Walk Across test. | Gait speed (m/s): 0.34 vs. 0.50. | |
| Lugade et al., 2011 [49] | Inclusion criteria: no history of head trauma, neurological or heart diseases; muscle, joint, or orthopedic disorder; visual impairment that was uncorrected by glasses; persistent vertigo; or lightheadedness. Definition of fall: not reported. | Community-dwelling elderly: 10 fallers (≥1 fall in past year; 78.9 ± 4.9 years). 10 non-fallers (75.4 ± 7.0 years). | Subjects walked barefoot at preferred gait speed along a 10 m walkway. Kinematic and ground reaction force data were collected during 5 trials using an 8-camera optoelectronic motion analysis system (60 Hz) and two integrated force platforms. CoM and CoP data were calculated. | Gait speed (m/s): 1.02 vs. 1.26; CoM–CoP AP distance at heel strike (cm): 41.6 vs. 52.4. | At heel strike (CoM inside base of support): CoM stability margin (cm): 3.9 vs. 3.5; distance to centroid (cm): 2.5 vs. 2.2; interaction of the CoM position and velocity distance to border (cm): 17.5 vs. 18.7; time to contact (s): 0.17 vs. 0.15; base of support (m2): 0.40 vs. 0.43. At toe-off (CoM outside base of support): CoM separation (cm): 8.3 vs. 10.4; distance to centroid (cm): 21.4 vs. 23.4; time to contact (s): 0.12 vs. 0.11; base of support area (m2): 0.23 vs. 0.22; CoM–CoP ML distance at heel strike (cm): 6.6 vs. 7.3. |
| Panzer et al., 2011 [50] | Exclusion criteria: Mini Mental Status Examination score < 24; body mass index ≥30 kg/m2; blindness; neurologic, orthopedic, or visual disorders that impair mobility; or non-English speaking. Definition of fall: not reported. | Community-dwelling elderly: 47 fallers (≥2 non-injury falls or ≥1 injury fall in past year; 80.1 ± 6.2 years). 27 non-fallers (75.1 ± 6.5 years). | Two self-paced out and back walks (8.1 m) were performed; average gait speed was calculated, and the fastest performance was used. | Average gait speed (m/s): 0.64 vs. 0.86. | |
| Scanaill et al., 2011 [51] | Exclusion and inclusion criteria: not reported. Definition of fall: not reported. | Community-dwelling elderly: 182 fallers (>1 fall in past year or ≥1 fall that resulted in a loss of consciousness, a fractured bone, or severe injury in past year; 40 males; 74.5 ± 7.2 years). 139 non-fallers (60 males; 70.3 ± 6.8 years). | Subjects walked at a preferred gait speed along a 6 m pressure-sensing walkway. Two kinematic sensors were worn on the subject’s shanks. | Stride length (m): 1.08 vs. 1.23; stride width (m): 0.12 vs. 0.11; step length (m): 0.54 vs. 0.61; step width (m): 0.56 vs. 0.63. | Stride time (s): 1.23 vs. 1.20; stance time (s): 0.81 vs. 0.79; swing time (s): 0.51 vs. 0.50; step time (s): 0.66 vs. 0.66; single support (%): 75.9 vs. 78.2; double support (%): 34.6 vs. 34.3. Variability (CV): stride length (%): 8.6 vs. 7.8; stride width (%): 25.0 vs. 25.3; step length (%): 14.1 vs. 12.7; step width (%): 12.4 vs. 10.6; base width (%): 24.7 vs. 25.3; stride time (%): 19.2 vs. 18.6; stance time (%): 30.3 vs. 33.0; swing time (%): 32.4 vs. 31.0; step time (%): 34.2 vs. 31.8; single support (%): 21.4 vs. 20.1; double support (%): 61.4 vs. 62.6. |
| Uemura et al., 2012 [52] | Exclusion criteria: severe cardiac, pulmonary, or musculoskeletal disorders; diseases associated with a high risk of falling; inability to execute arithmetic tasks; serious visual impairment not correctable with spectacles; or inability to follow multiple commands. Inclusion criteria: ≥65 years; minimal hearing and visual impairments; and ability to ambulate independently. Definition of fall: an event where a subject unintentionally comes to rest on the ground or another lower level; falls resulting from extraordinary environmental factors were excluded. | Community-dwelling elderly (65–93 years): 22 fallers (≥1 fall in past year). 35 non-fallers. | Subjects walked along a 2 m walkway as quickly as possible after a visual cue. CoP data were collected by force plate during 3 trials. Step initiation—first ML deviation of CoP towards swing leg. Reaction phase—time from cue to step initiation. Anticipatory postural adjustment phase—time from step initiation to foot-off. | Reaction phase (s): 0.31 vs. 0.29; anticipatory postural adjustment phase (s): 0.46 vs. 0.44. | |
| Chen & Chou, 2013 [53] | Inclusion criteria: walk without an assistive device; no history of neurological or musculoskeletal deficits (e.g., amputation, cerebral vascular accident, significant head trauma, or Parkinson’s disease); and no uncorrectable visual impairment, vestibular dysfunction, or dementia. Definition of fall: unexpected event where the subject falls to the ground from an upper level; falls caused by syncope or major intrinsic events were excluded. | Community-dwelling elderly: 15 fallers (≥2 falls in past year; 4 males; 77.7 ± 7.7 years). 15 non-fallers (6 males; 76.2 ± 4.2 years). | Subjects performed the Timed Up and Go test while barefoot. Kinematic and CoM data and ground reaction force were collected during 4 trials using a 10-camera optoelectronic motion analysis system (600 Hz) and one force platform (960 Hz). | Step length (m): 0.42 vs. 0.52; CoM AP velocity at stance-off (lower fallers); AP inclination of CoM–ankle at stance-off (°): −2.4 vs. −6.8; total CoM kinetic energy at swing-off (J): 6.6 vs. 10.4; total CoM kinetic energy at stance-off (J): 20.6 vs. 31.9. | Step width (m): 0.23 vs. 0.21; CoM AP velocity at swing-off; AP inclination of CoM–ankle at swing-off (°): 7.7 vs. 6.9. |
| Chen et al., 2013 [54] | Inclusion criteria: walk without an assistive device; no history of neurological or musculoskeletal deficits (e.g., amputation, cerebral vascular accident, significant head trauma, or Parkinson’s disease); and no uncorrectable visual impairment, vestibular dysfunction, or dementia. Definition of fall: unexpected event where the subject falls to the ground from an upper level; falls caused by syncope or major intrinsic events were excluded. | Community-dwelling elderly: 10 fallers (≥2 falls in past year; 2 males; 75.9 ± 4.1 years). 10 non-fallers (3 males; 75.5 ± 3.0 years). | Subjects performed the Timed Up and Go test while barefoot. Kinematic and CoM data and ground reaction force were collected during 4 trials using a 10-camera optoelectronic motion analysis system (600 Hz) and one force platform (960 Hz). | Braking force (N/kg): −0.83 vs. −0.43 propulsive force (N/kg): 3.48 vs. 5.04; ankle moment at swing-off: 0.11 vs. −0.03. | Trunk angle (°): 32.9 vs. 31.4; hip moment at swing-off (Nm/kg): 0.45 vs. 0.48; knee moment at swing-off (Nm/kg): 0.42 vs. 0.54. |
| Chiu & Chou, 2013 [55] | Inclusion criteria: no current histories of neurological or musculoskeletal deficits that affect walking and no uncorrectable visual impairment, vestibular dysfunction, dementia, or depression. Definition of fall: not reported. | Community-dwelling elderly: 15 fallers (≥2 falls in past year; 3 males; 72.9 ± 4.1 years). 15 non-fallers (8 males; 75.7 ± 4.7 years). | Subjects walked barefoot along a 10 m walkway at preferred gait speed. Kinematic data were collected during 5 trials using a 10-camera optoelectronic motion analysis system (60 Hz). SD is used to analyze variability. | Gait speed (m/s): 1.07 vs. 1.22; stance phase (%): 62.6 vs. 60.9; swing phase (%): 37.4 vs. 39.1; single support (%): 37.4 vs. 39.0; double support (%): 25.2 vs. 21.9. Variability in inter-joint coordination during stance phase (SD): knee–ankle (higher fallers); ankle (higher fallers). Variability inter-joint coordination during swing phase (SD): knee–ankle (higher fallers). | Cadence (steps/min): 115 vs. 116. Variability inter-joint coordination during stance phase (SD): hip; knee; hip–knee. Variability inter-joint coordination during swing phase (SD): hip; knee; ankle; hip–knee. |
| Fritz et al., 2013 [56] | Exclusion criteria: orthopedic or neurologic conditions that altered walking. Inclusion criteria: capable of walking unassisted for more than 10 feet and understanding the study’s objective. Definition of fall: not reported. | Community-dwelling elderly: 12 fallers (≥1 fall in past 6 months; 86.3 ± 4.7 years). 50 non-fallers (85.4 ± 7.1 years). | Subjects walked during 3 trials at a preferred gait speed along a 6 m pressure-sensing walkway. | Gait speed (m/s): 0.89 vs. 1.0; stride length (m): 0.85 vs. 1.02. | Base of support (cm): 12.3 vs. 10.2; swing phase (%): 31.5 vs. 33.4; stance phase (%): 68.4 vs. 66.6; double support (%): 37 vs. 33; step time variability (CV): 7.3 vs. 6.4. |
| Weiss et al., 2013 [57] | Exclusion criteria: previously clinically diagnosed with any gait or balance disorders and Mini Mental Status Examination score < 24. Definition of fall: any stability disturbance that caused significant contact with the floor. | Community-dwelling elderly: 32 fallers (≥2 fall in past year; 35% males; 77.9 ± 5.1 years). 39 non-fallers (<2 fall in past year; 36% males; 78.8 ± 4.4 years). | Subjects walked for 1 min at preferred gait speed (laboratory assessments). A portable tri-axial accelerometer sensor (100 Hz) was worn on the lower back. Subjects also wore a portable accelerometer sensor (100 Hz) for 3 days. | Laboratory assessment: gait speed (m/s): 0.97 vs. 1.19; step duration (s): 0.55 vs. 0.52. 3-day assessment: step time; stride time. Fallers presented higher variability in the lower back vertical axis and lower variability in the lower back ML axis. | |
| Marques et al., 2013 [59] Marques et al., 2013 [58] | Exclusion criteria: Mini Mental Status Examination score < 20; cardiovascular disease; Berg balance scale score < 36; hemiparesis; pain of the lower limbs or trunk; or progressive motor disorder. Definition of fall: any stability disturbance that caused significant contact with the floor. | Community-dwelling elderly women: 15 fallers (≥1 fall in past year; 69.6 ± 8.0 years). 22 non-fallers (66.1 ± 6.2 years). | Subjects walked at preferred gait speed for 1 min on a walkway and for 10 min on a treadmill. Gait kinematic parameters and EMG activity were assessed using a 7-camera optoelectronic motion analysis system (100 Hz) and an 8-channel telemetry EMG system (2000 Hz). | Hip position at toe-off (°): 9.5 vs. 5.4; muscle activation at initial stance: biceps femoris (%): 36.4 vs. 24.1; muscle activation at final stance: gluteus maximus (%): 86.4 vs. 52.3; muscle activation before heel contact: internal oblique (%): 8.3 vs. 15.7; biceps femoris (%): 45.5 vs. 31.3. | Gait speed on walkway (m/s): 1.1 vs. 1.3; gait speed on treadmill (m/s): 0.9 vs. 0.9; step time (s): 0.23 vs. 0.26; step length (m): 0.51 vs. 0.50; step width (m): 0.14 vs. 0.17; ankle angular position at heel contact (°): 6.4 vs. 5.9. Muscle activation at initial stance: internal oblique (%): 97.2 vs. 100.3; rectus femoris (%): 143.8 vs. 130.6; tibialis anterior (%): 106.7 vs. 122.8; multifidus (%): 150.5 vs. 147.7, gluteus maximus (%): 154.7 vs. 179.9. Muscle activation at final stance: internal oblique (%): 117.5 vs. 105.1; rectus femoris (%): 89.5 vs. 80.1, multifidus (%): 76.1 vs. 82.8; biceps femoris (%): 43.8 vs. 50.1; gastrocnemius lateralis (%): 91.7 vs. 75.8. Muscle activation before heel contact: rectus femoris (%): 12.7 vs. 15.2; tibialis anterior (%): 40.0 vs. 30.1; multifidus (%): 16.4 vs. 18.4; gluteus maximus (%): 12.0 vs. 16.8; gastrocnemius lateralis (%): 7.2 vs. 14.9. Muscle activation after toe-off: internal oblique (%): 21.6 vs. 20.5; rectus femoris (%): 10.9 vs. 15.9; tibialis anterior (%): 35.1 vs. 31.9; gluteus maximus (%): 6.8 vs. 10.1; biceps femoris (%): 16.2 vs. 13.1; gastrocnemius lateralis (%): 7.9 vs. 12.2. |
| Ayoubi et al., 2014 [60] | Exclusion criteria: <65 years; institutionalization; non–French-speaking; acute medical illness during the past month; diagnosis of dementia; score > 2 on item 22 of Unified Parkinson’s Disease Rating Scale; severe orthopedic diagnoses of lumbar vertebra, pelvis, or lower extremities; or inability to walk 6 m unassisted. Definition of fall: subject unintentionally coming to rest on the ground or other lower level, and not as the result of a major intrinsic event. | Community-dwelling elderly: 109 fallers with a fear of falling (24 males; 71 ± 5.2 years). 101 fallers with no fear of falling (29 males; 70.8 ± 5.5 years). 194 non-fallers with fear of falling (83 males; 70.5 ± 5.0 years). 619 non-fallers with no fear of falling (368 males; 70.3 ± 4.8 years). | Subjects walked 1 trial at their preferred gait speed along a 6 m pressure-sensing walkway. | Fallers with fear of falling vs. non-fallers with no fear of falling: gait speed (m/s): 0.96 vs. 1.11; stride time variability (CV; %): 3.0 vs. 2.0. | Fallers with no fear of falling vs. non-fallers with no fear of falling: gait speed (m/s) 1.07 vs. 1.11; stride time variability (CV; %): 2.0 vs. 2.0. Fallers with no fear of falling vs. non-fallers with fear of falling: gait speed (m/s) 1.07 vs. 1.03; stride time variability (CV; %): 2.0 vs. 3.0. Fallers with fear of falling vs. non-fallers with fear of falling: gait speed (m/s) 0.96 vs. 1.03; stride time variability (CV; %): 3.0 vs. 3.0. |
| Barelle et al., 2014 [61] | Exclusion criteria: vascular stroke with motor or sensory after-effects; Parkinson’s disease; hip or knee prosthesis; or fracture of leg or ankle which would have impaired gait. Definition of fall: not reported. | Community-dwelling elderly: 6 fallers (≥1 fall in past 6 months; 68.0 ± 4.0 years). 6 non-fallers (2 males; 69.0 ± 3.0 years). | Subjects walked at preferred gait speed on a 10 m walkway. Gait kinematic parameters were assessed using an 8-camera optoelectronic motion analysis system (100 Hz). | Stride and step length (m): 1.13 vs. 1.18; 0.57 vs. 0.59; stride length (% height): 70 vs. 74; cadence (strides/s): 0.87 vs. 0.92; cadence (steps/s): 1.73 vs. 1.84; step length (% height): 35 vs. 37; cycle time (s): 1.17 vs. 1.09; gait speed (m/s): 0.99 vs. 1.08; hip, knee, ankle displacements (°): 21 vs. 21; 58 vs. 58; 38 vs. 37. | |
| Iwata et al., 2014 [62] | Exclusion and inclusion criteria: not reported. Definition of fall: any unintended contact with a supporting surface. | Community-dwelling elderly: 28 fallers (≥1 fall in past year; 9 males; 76.0 ± 5.3 years). 84 non-fallers (19 males; 73.5 ± 6.1 years). | Maximum gait speed was measured using a floor-based photocell gait analysis system over a 5 m course. | Maximum gait speed (m/s): 1.8 vs. 1.9. | |
| Kobayashi et al., 2014 [63] | Inclusion criteria: walk independently; normal or corrected-to-normal vision; and no history of neuromuscular disease. Definition of fall: not reported. | Community-dwelling elderly: 18 fallers (≥1 fall in past year; 67.3 ± 3.1 years). 19 non-fallers (67.1 ± 3.3 years). | Subjects walked at preferred gait speed on a 10 m walkway, during 5 trials. Gait kinematic and ground reaction force data were assessed using an optoelectronic motion analysis system (200 Hz) and six force platforms (1000 Hz). Principal component analysis was used to analyze the relationship between the risk of falling and the joint kinematics of the lower limbs. MTC was analyzed. | Gait speed (m/s): 1.21 vs. 1.33; stance time variability (SD; s): 0.014 vs. 0.009. Fallers exhibited greater variability in the hip, knee, and ankle in all planes during the entire swing phase. Fallers exhibited greater variability in the hip and ankle in the frontal plane during the entire stance phase. Fallers exhibited smaller hip flexion and ankle dorsiflexion angles between the mid-stance and late-stance phases. Fallers exhibited larger ankle inversion between the mid-stance and late-stance phases. Fallers exhibited smaller hip abduction during the mid-stance phase. Variability in the joint kinematics is the key characteristic that affects the risk of falling while walking. | MTC (cm): 4.30 vs. 4.24; step length (m): 0.63 vs. 0.67; step width (m): 0.10 vs. 0.09; stance time (s): 0.60 vs. 0.58; swing time (s): 0.41 vs. 0.41; stance phase (%): 64.8 vs. 63.9; MTC variability (SD; cm): 0.27 vs. 0.29; gait speed variability (SD; m/s): 0.04 vs. 0.03; step length variability (SD; m): 17.8 vs. 13.5; step width variability (SD; cm): 16.3 vs. 16.8; swing time variability (SD; s): 0.02 vs. 0.01; stance phase variability (SD; %): 0.90 vs. 0.76. |
| König et al., 2014 [64] | Exclusion criteria: body mass index < 18 or >33 kg/m2; alcoholism; type-1 diabetes; cardiac infarct; chronic hepatitis; celiac and malabsorption diseases; rheumatoid arthritis; cancer; treated for more than 3 months or under treatment with oral corticosteroids; hyperparathyroidism; hyperthyroidism; neurological diseases affecting neuromuscular system; peripheral neurologic diseases; fractures or osteosyntheses; total hip replacement (less than 6 months); unable to follow instructions or unable to walk 10 m without a walking aid; or participation in another study at the same time. Definition of fall: not reported. | Community-dwelling elderly: 38 fallers (≥1 fall in past year; 69.2 ± 4.8 years). 42 non-fallers (68.9 ± 4.5 years). | Subjects walked barefoot at preferred gait speed on a 10 m walkway during 6 trials. Gait kinematic parameters were assessed using an optoelectronic motion analysis system (200 Hz). Principal component analysis was used. | Temporal variability and mean spatial gait parameters. | |
| Mignardot et al., 2014 [65] | Exclusion criteria: refusal or lack of capacity to give consent or hospitalized at the time of screening. Inclusion criteria: 66–75 years; living at home; never fallen; and ability to walk without assistance for at least 30 s. Definition of fall: unintentionally fall on the ground or lower level, not as a result of a major intrinsic event (e.g., as a stroke) or overwhelming hazard. | Community-dwelling elderly: 72 fallers (≥1 fall in 2 years follow-up; 35 males; 71.1 ± 2.7 years). 187 non-fallers (72 males; 69.4 ± 2.5 years). | Subjects walked with their own shoes at preferred gait speed along a 30 m walkway. A tri-axial accelerometer sensor was used (100 Hz). Principal component analysis was used to assess the relationship between gait variables and fall status. | PC1—global kinetics of gait pattern (mechanical power and spatiotemporal variables): fallers (+0 to +6 months) differed from non-fallers and fallers (+6 to +12 months); PC1 had predictive power for the first fall onset during the first six months after the initial screening. PC2—global gait regularity: fallers (+6 to +12 months) differed from non-fallers (+0 to +6 months); PC2 had predictive power for the first fall onset between the 6th and 12th months after initial screening. | PC3—stride time: there was no significant difference between fallers and non-fallers on PC3; PC3 did not have any predictive power for the first fall onset. |
| Cebolla et al., 2015 [66] | Inclusion criteria: ≥60 years; able to perform activities of daily living and walk independently; and no orthopedic problems (e.g., surgery or fractures) or other health problems that impair physical tests. Definition of fall: unintentionally coming to rest on the ground or other lower level, whether or not it produced an injury. | Community-dwelling elderly (13 males): 20 fallers (≥1 fall in past year; 68.0 ± 6.9 years). 42 non-fallers (65.5 ± 4.1 years). | Subjects walked at preferred gait speed on an 8 m walkway during 10 trials. Gait kinematic parameters were assessed using a 6-camera optoelectronic motion analysis system (100 Hz). MTC was analyzed. | MTC (mm): 40 vs. 43. | Stride length (m): 1.11 vs. 1.17; stride time (s): 1.07 vs. 1.08; cadence (strides/s): 0.93 vs. 0.93; gait speed (m/s): 1.04 vs. 1.08; heel vertical velocity at heel strike (m/s): 0.70 vs. 0.76. |
| MacAulay et al., 2015 [67] | Exclusion criteria: Geriatric Depression Scale score ≥ 6 or neurologic or untreated health disorders (e.g., cerebrovascular disease, Parkinson’s disease, traumatic brain injury). Definition of fall: subject unexpectedly lost his stability and unintentionally came unto rest on the ground or other object; events in which participants were able to regain their stability did not count as a fall. | Community-dwelling elderly (128 males): 81 fallers (≥1 fall in past year; 69.9 ± 6.8 years). 312 non-fallers (70.1 ± 6.6 years). | Subjects walked at preferred gait speed along a 6 m pressure-sensing walkway. Four trials were collected. | Stride length (lower fallers). | Step time (s): 1.08 vs. 1.08. |
| Rispens et al., 2015 [68] | Inclusion criteria: Mini Mental Status Examination score > 18 and able to walk at least 20 m with a walking aid. Definition of fall: event that resulted in unintentionally coming to rest on the ground or other lower level. | Community-dwelling elderly (33 males; 78.4 ± 7.8 years): 41 fallers (≥1 fall in past year). 69 non-fallers. | Subjects wear a portable tri-axial accelerometer sensor (100 Hz) for 2 separate weeks. It was attached with an elastic belt around the waist and set along the lumbar spine. Subjects were instructed to wear the accelerometer at all times, except during water activities. Intra-class correlation was used. | Gait speed; gait speed variability (SD); stride time; stride time variability (SD); gait symmetry (harmonic ratio); and gait smoothness (index of harmonicity) were associated with the number of falls in the past year. | Cadence variability (SD). |
| Wright et al., 2015 [69] | Inclusion criteria: able to walk at least 100 m without the use of a gait aid and no neurological disease, head trauma, musculoskeletal impairment, or visual impairment not correctable by lenses. Definition of fall: a loss of balance resulting in the body, or part of the body, coming to rest on the ground. | Community-dwelling elderly: 14 “trip” fallers (≥1 trip fall in past year; 4 males; 71 ± 6 years). 10 “slip” fallers (≥1 slip fall in past year; 4 males; 68 ± 5 years). 16 non-fallers (6 males; 72 ± 5 years). | Subjects walked at preferred gait speed along a walkway. Kinematic and ground reaction forces data were collected during 3 trials using a 14-camera optoelectronic motion analysis system (60 Hz) and two force platforms (120 Hz). CoM and CoP data were calculated. | Differences between fallers (both groups) and non-fallers: CoM–CoP at heel strike (cm): 14.3 vs. 15.3 vs. 12.0. Differences between “slip” fallers and non-fallers: CoM–CoP at foot flat (cm): −14.9 vs. −10.3. Differences between “trip” fallers and “slip” fallers: CoM–CoP at mid-swing (cm): 0.9 vs. 1.2. | “Trip” fallers vs. “slip” fallers vs. non-fallers: gait speed (m/s): 1.19 vs. 1.22 vs. 1.14; stride time (s): 1.06 vs. 1.10 vs. 1.10; stride length (m): 1.26 vs. 1.34 vs. 1.26; CoM–CoP at toe-off (cm): −15.1 vs. −16.5 vs. −14.3; CoM–CoP at late swing (cm): 13.4 vs. 13.2 vs. 11.0; peak braking force (% body mass): −15.9 vs. −16.5 vs. −15.1; instant of peak braking force (% gait cycle): 10.8 vs. 11.2 vs. 10.9; peak propulsive force (% body mass): 17.3 vs. 19.3 vs. 17.1; instant of peak propulsive force (% gait cycle): 54.0 vs. 54.1 vs. 54.3. |
| Bounyong et al., 2016 [70] | Exclusion and inclusion criteria: not reported. Definition of fall: not reported. | Community-dwelling elderly (8 males; 72.3 ± 6.1 years): 17 fallers (≥1 fall in past year). 35 non-fallers. | Subjects walked 6 trials at preferred gait speed along a 5 m walkway. EMG of rectus femoris, biceps femoris, tibialis anterior, and gastrocnemius were collected (1024 Hz). Co-contraction index was determined based on EMG. | Co-contraction index (between tibialis anterior and gastrocnemius) during stance phase (%): 61.8 vs. 57.5. | |
| Fujimoto & Chou, 2016 [71] | Inclusion criteria: no history or clinical evidence of neurological, musculoskeletal, or other medical conditions (neurological pathology, head trauma, cerebrovascular accident, vestibular dysfunction, or visual impairment uncorrectable by lenses). Definition of fall: not reported. | Community-dwelling elderly: 15 fallers (≥2 falls in past year; 3 males; 71.9 ± 4.3 years). 15 non-fallers (6 males; 70.0 ± 3.2 years). | Subjects walked barefoot at preferred gait speed along a 10 m walkway. Kinematic data were collected during 6 trials using an 8-camera optoelectronic motion analysis system (60 Hz). CoM was calculated. | CoM position at toe-off (m/s): −0.30 vs. −0.47; CoM mean velocity (m/s): 1.03 vs. 1.29; CoM mean velocity at toe-off (m/s): 1.29 vs. 1.61; CoM acceleration peak prior to toe-off (m/s): 0.38 vs. 0.49; CoM AP acceleration peak (lower fallers). | |
| Ihlen et al., 2016 [72] | Exclusion and inclusion criteria: not reported. Definition of fall: not reported. | Community-dwelling elderly (78.4 ± 4.7 years): 32 fallers (≥2 falls in past year). 39 non-fallers. | Subjects wear a tri-axial accelerometer (100 Hz) for 3 days over the lower back. The refined composite multiscale entropy and refined multiscale permutation entropy were applied to trunk acceleration and velocity signals in the AP, ML, and vertical directions. | Refined composite multiscale entropy is higher for non-fallers compared to fallers for trunk AP, ML, and vertical acceleration. Refined multiscale permutation entropy is higher for non-fallers compared to fallers for trunk ML acceleration in the intermediate and large scales. Refined multiscale permutation entropy is lower for non-fallers compared to fallers for trunk vertical acceleration in the intermediate and large scales. | |
| Howcroft et al., 2016 [73] | Exclusion criteria: cognitive disorder (self-reported) or unable to walk for 6 min without an assistive device. Inclusion criteria: ≥65 years. Definition of fall: event that results in a subject coming to rest unintentionally on the ground or other lower level, excluding falls resulting from a stroke or overwhelming hazard. | Community-dwelling elderly: 24 fallers (≥1 fall in past 6 months; 13 males; 76.3 ± 7.0 years). 76 non-fallers (31 males; 75.3 ± 6.6 years). | Subjects walked 7.62 m while wearing pressure-sensing insoles (120 Hz) and tri-axial accelerometers on the head, pelvis, and left and right shanks (50 Hz). CoP data were analyzed. Maximum Lyapunov exponent, ratio of even to odd harmonics, SD, and CV are used to analyze data variability. | Head variability (SD; higher fallers); ratio of even to odd harmonics pelvis AP (lower fallers). | CoP ML deviation time (s): 0.03 vs. 0.03; minimum CoP velocity (m/s): 0.03 vs. 0.03; mean CoP velocity (m/s): 0.30 vs. 0.30; median CoP velocity (m/s): 0.24 vs. 0.21; gait speed (m/s): 1.24 vs. 1.20; cadence (steps/min): 112 vs. 111; stride time (s): 1.09 vs. 1.09; stance time (s): 0.71 vs. 0.72; swing time (s): 0.38 vs. 0.38; stride time (CV; %): 3 vs. 3; stance time (CV; %): 5 vs. 6; swing time (CV; %): 8 vs. 11; stance phase (%): 64.6 vs. 65.9; double-support phase (%): 14.6 vs. 15.9; CoP AP displacement (CV; %): 495 vs. 463; CoP ML displacement (CV; %): 650 vs. 666; Impulse during foot-strike to first peak (Ns/kg): 1.20 vs. 1.20; Impulse during MTC to second peak (Ns/kg): 1.47 vs. 1.67; Impulse during second peak to foot-off (Ns/kg): 0.97 vs. 1.08; Impulse during foot-strike to MTC (Ns/kg): 2.35 vs. 2.40; Impulse during MTC to foot-off (Ns/kg): 2.36 vs. 2.67; Impulse during foot-strike to foot-off (Ns/kg): 4.65 vs. 4.99; maximum Lyapunov exponent. |
| Rinaldi & Moraes, 2016 [74] Rinaldi et al., 2017 [75] | Exclusion criteria: Mini Mental Status Examination score < 24; vestibular dysfunction; or unable to walk without assistance. Inclusion criteria: no history of neurological or musculoskeletal disorders and no incorrigible visual impairment. Definition of fall: event in which a subject comes unintentionally to the ground or to some lower level. | Community-dwelling elderly women: 15 fallers (≥1 fall in past year; 70.1 ± 5.1 years). 15 non-fallers (71.8 ± 5.8 years). | Subjects walked at preferred gait speed. Gait kinematic data were assessed using an 8-camera optoelectronic motion analysis system (100 Hz). CoM data were analyzed. | Gait speed (m/s): 1.06 vs. 1.23; step width (m): 0.09 vs. 0.06; step time (s): 0.62 vs. 0.52; gait speed (m/s): 0.64 vs. 0.93; CoM AP velocity (m/s): 0.39 vs. 0.75; percentage of CoM AP velocity (%): 60 vs. 30; margin of dynamic stability in AP direction (m): 0.07 vs. 0.02; margin of dynamic stability in ML direction (m): 0.04 vs. 0.01. | |
| Bizovska et al., 2017 [76] | Exclusion criteria: musculoskeletal problems or injuries and surgical interventions that were performed within 2 years of the study. Inclusion criteria: ≥60 years and ability to stand and walk without any support. Definition of fall: unexpected event in which the participants come to rest on the ground or lower level. Falls related to sports, such as skiing and cycling, and those caused by a great external force were excluded. | Community-dwelling elderly: 38 fallers (≥1 fall in 6 months follow-up; median 70.9 years). 101 non-fallers (median 70.6 years). | Subjects walked at preferred gait speed along a 30 m walkway for 5 min wearing comfortable sports shoes. Tri-axial accelerometers were attached to L5 and shanks (296.3 Hz). The index of complexity, the computed from multiscale entropy, and the Shannon entropy were used to analyze data variability. | ShE: trunk AP direction: 0.34 vs. 0.31; ShE shanks ML direction: 0.41 vs. 0.37. | Gait speed (m/s): 1.22 vs. 1.23; stride time (s): 1.03 vs. 1.05. Shannon entropy: trunk vertical direction: 0.44 vs. 0.43; trunk ML direction: 0.16 vs. 0.17; shanks vertical direction: 0.59 vs. 0.57; shanks AP direction: 0.58 vs. 0.58. Index of complexity: trunk vertical direction: 12.5 vs. 12.4; trunk ML direction: 17.3 vs. 18.0; trunk AP direction: 9.9 vs. 10.2; shanks vertical direction: 9.0 vs. 8.6; shanks ML direction: 15.20 vs. 15.20; shanks AP direction: 8.5 vs. 8.5. Computed from multiscale entropy. |
| de Melker Worms et al., 2017 [77] | Exclusion criteria: Mini Mental Status Examination score < 25; rheumatoid arthritis in lower extremities; cerebral vascular disease; Parkinson’s disease; peripheral neuropathy; cardiac arrest; bypass treatment; any other neurological or cardiovascular impairment; or unable to walk for 10 min without a walking aid. Definition of fall: event in which a subject unintentionally comes to rest on the ground or other lower level. | Community-dwelling elderly (8 males): 9 fallers (≥1 fall in past year; 70.4 ± 3.6 years). 19 non-fallers (69.3 ± 3.6 years). | Subjects walked at 1 m/s on a treadmill. Two bouts of 5 min of walking. Gait kinematic data were assessed using a 10-camera optoelectronic motion analysis system. CoM was analyzed. | Stance time (CV; %): 3.5 vs. 3.0; local divergence exponent of the CoM velocity: 0.97 vs. 0.88. | Step length (m): 0.51 vs. 0.55; step width (m): 0.15 vs. 0.13; stance time (s): 0.69 vs. 0.73; swing time (s): 0.38 vs. 0.41; step length (CV; %): 4.5 vs. 4.2; step width (CV; %): 15.6 vs. 18.6; swing time (CV; %): 4.9 vs. 4.4. |
| de Melker Worms et al., 2017 [78] | Exclusion criteria: Mini Mental State Examination score < 25. Inclusion criteria: ≥65 years and able to walk independently for 10 min. Definition of fall: event in which a subject unintentionally comes to rest on the ground or other lower level. | Community-dwelling elderly: 8 fallers (≥1 fall in past year). 17 non-fallers. | Subjects walked at 1 m/s on a treadmill. Two bouts of 5 min of walking and two slips were induced. Gait kinematic data were assessed using a 10-camera optoelectronic motion analysis system (100 Hz). | Step length of the recovery step; step width of the recovery step; step length variability in the recovery step (CV); step width variability in the recovery step (CV). | |
| Júnior et al., 2017 [80] | Exclusion criteria: unable to walk without help; severe impairment of stability; or Mini Mental Status Examination score < 13 for elderly illiterate, <18 for 1–7 years of education, <26 for ≥8 years of education. Definition of fall: event in which a subject comes to rest on the ground or lower level. | Community-dwelling elderly: 27 fallers (1 fall in past 6 months; 1 male; 68.0 ± 5.7 years). 35 non-fallers (11 males; 68.0 ± 4.8 years). | Subjects walked at preferred gait speed during 3 trials along an 8 m pressure-sensing walkway. | Gait speed (m/s): 1.12 vs. 1.27 (statistical tendency for difference, p = 0.060); cadence (steps/min): 113 vs. 112; step length (m): 0.60 vs. 0.63; stride time (s): 1.06 vs. 1.07; single support phase (%): 37.6 vs. 38.4; stride time variability (CV; %): 2.8 vs. 2.7. | |
| Marques et al., 2017 [79] | Exclusion criteria: musculoskeletal pain, fractures, or severe soft tissue injury during the previous 6 months or neurological, cardiovascular, or respiratory diseases. Definition of fall: any stability disturbance that caused a subject’s body to have significant contact with the floor. | Community-dwelling elderly women: 16 fallers (≥1 injury fall in past year; 69.6 ± 8.1 years). 19 non-fallers (66.1 ± 6.2 years). | Subjects walked on a treadmill at preferred gait speed. Kinematic data were collected using a telemetry data acquisition system and gait phases using pressure sensors (2000 Hz). SDNN: SD of all time intervals. SDANN: SD of means of intervals taken every five strides. SDNNi: mean of SD of intervals. rMSSD: root-mean-square of differences between intervals. Triangular index: geometric method calculated based on a histogram of intervals. | Stance time: SDNN (higher fallers); SDNNi (higher fallers); rMSSD (higher fallers); CV (higher fallers). Swing time: SDANN (higher fallers). Step time: SDNN (higher fallers); SDNNi (higher fallers); rMSSD (higher fallers); triangular index (higher fallers). | Preferred gait speed (m/s): 0.90 vs. 0.90. Stance time: SDANN; triangular index. Swing time: SDNN; DNNi; rMSSD; CV; triangular index. Step time: SDANN; CV. |
| Svoboda et al., 2017 [81] | Exclusion criteria: neurological or vestibular diseases or surgery in lower limbs or spine in the last 2 years. Inclusion criteria: ≥60 years; ability to walk without an assistive device; and ability to stand unassisted without any support during common everyday activities. Definition of fall: unexpected event in which the subject comes to rest on the ground or lower level. | Community-dwelling elderly: 31 fallers (≥1 fall in past 6 months; 4 males; 70.9 ± 6.2 years). 94 non-fallers (19 males; 70.4 ± 6.6 years). | Subjects walked barefoot on a 10 m walkway. Each subject participated in 5 trials at preferred, defined (between 1.00 and 1.22 m/s), and fast gait speed. Ground reaction force data were collected using two force platforms. CV and SD were used to analyze variability. CoP ML and AP displacements were calculated. | Preferred gait speed: gait speed (CV; %): 5.9 vs. 5.0. Defined gait speed: gait speed (CV; %): 6.1 vs. 5.0; CoP ML displacement variability during pre-swing (SD; mm): 1.14 vs. 0.85. Fast gait speed: step width variability (CV; %): 27.7 vs. 22.7. | Preferred gait speed: step length: 0.58 vs. 0.59; step width (cm): 9.5 vs. 10.3; step time (s): 0.53 vs. 0.53; gait speed (m/s): 1.11 vs. 1.13; step length (CV; %): 3.1 vs. 3.1; step width (CV; %): 23.7 vs. 24.3; step time (CV; %): 4.1 vs. 3.5; CoP ML and AP displacements variabilities during loading response (mm): 3.11 vs. 3.20; 5.36 vs. 5.03; CoP ML and AP displacements variabilities during mid-stance (mm): 0.16 vs. 0.16; 0.45 vs. 0.47; CoP ML and AP displacements variabilities during terminal stance (mm): 0.15 vs. 0.15; 0.56 vs. 0.58; CoP ML and AP displacements variabilities during pre-swing (mm): 0.99 vs. 0.87; 3.16 vs. 2.37. Defined gait speed: step length: 0.58 vs. 0.59; step width (cm): 9.7 vs. 10.0; step time (s): 0.52 vs. 0.53; gait speed (m/s): 1.12 vs. 1.11; step length (CV; %): 3.3 vs. 3.0; step width (CV; %): 24.6 vs. 26.3; step time (CV; %): 4.1 vs. 3.7; COP ML and AP displacements variabilities during loading response (mm): 3.11 vs. 3.10; 6.03 vs. 5.18; CoP ML and AP displacements variabilities during mid-stance (mm): 0.15 vs. 0.16; 0.43 vs. 0.44; CoP ML and AP displacements variabilities during terminal stance (mm): 0.15 vs. 0.15; 0.57 vs. 0.57; CoP AP displacement variability during pre-swing (mm): 3.59 vs. 2.22. Fast gait speed: step length: 0.65 vs. 0.66; step width (cm): 9.6 vs. 10.4; step time (s): 0.43 vs. 0.44; gait speed (m/s): 1.53 vs. 1.50; step length (CV; %): 3.7 vs. 3.3; step time (CV; %): 3.8 vs. 3.6; gait speed (CV; %): 5.2 vs. 4.6; CoP ML and AP displacements variabilities during loading response (mm): 4.44 vs. 3.91; 8.54 vs. 8.06; CoP ML and AP displacements variabilities during mid-stance (mm): 0.25 vs. 0.23; 1.06 vs. 0.97; CoP ML and AP displacements variabilities during terminal stance (mm): 0.17 vs. 0.17; 0.81 vs. 0.69. |
| Allen & Franz, 2018 [82] | Exclusion criteria: body mass index ≥ 30 kg/m2; sedentary lifestyle; neurologic or orthopedic diseases; taking medication that causes dizziness; or normal or corrected to normal vision. Definition of fall: unintentionally coming to the ground or some lower level, and other than as a sustaining violent blow, loss of consciousness, or sudden onset of paralysis. | Community-dwelling elderly: 10 fallers (≥1 fall in past year; 3 males; 77.7 ± 7.7 years). 11 non-fallers (5 males; 75.1 ± 5.8 years). | Preferred gait speed on a walkway was calculated using two photocells. Subjects walked at preferred gait speed on a treadmill. Kinematic data were assessed using a 14-camera optoelectronic motion analysis system (100 Hz). EMG of leg was recorded (1000 Hz). | Muscle synergy: 2.7 vs. 3.1. Variance in leg muscle recruitment accounted for by one module (larger fallers). | Preferred gait speed (m/s): 1.04 vs. 1.17 (statistical tendency for the difference, p = 0.060). Hip flexion and adduction angular position peaks; knee flexion and ankle dorsiflexion angular position peaks. |
| Benson et al., 2018 [83] | Exclusion criteria: able to walk without an assistive device for 5 min or Mini Mental State Examination score < 22. Definition of fall: unintentionally coming to rest on the ground. | Community-dwelling elderly: 10 fallers (≥1 fall in past 6 months; 5 males; 75.3 years). 10 non-fallers (3 males; 71.9 years). | Subjects walked at preferred gait speed on a treadmill with laboratory shoes. Kinematic data were assessed using a 10-camera optoelectronic motion analysis system (100 Hz). | Knee displacement; knee angle peak. | |
| Howcroft et al., 2018 [86] | Exclusion criteria: cognitive disorder (self-reported) or unable to walk for 6 min without an assistive device. Inclusion criteria: ≥65 years and without a fall in the 6 months before evaluation. Definition of fall: event that results in a subject coming to rest unintentionally on the ground or other lower level, excluding falls resulting from a stroke or overwhelming hazard. | Community-dwelling elderly: 28 fallers (≥1 fall in 6 months follow-up; 14 males; 75.0 ± 8.2 years). 47 non-fallers (17 males; 75.3 ± 5.5 years). | Subjects walked 7.62 m while wearing pressure-sensing insoles (120 Hz) and tri-axial accelerometers on the head, pelvis, and left and right shanks (50 Hz). CoP AP and ML displacements were calculated. Fast Fourier transform first quartile and CV were used to analyze data variability. | Fast Fourier transform first quartile of left shank ML displacement was lower in fallers. Fast Fourier transform first quartile of right shank vertical displacement was lower in fallers. | Gait speed (m/s): 1.17 vs. 1.22; cadence (steps/min): 110 vs. 112; stride time (s): 1.11 vs. 1.09; stance time (s): 0.73 vs. 0.72; swing time (s): 0.38 vs. 0.37; stride time (CV; %): 3.0 vs. 3.0; stride time symmetry index: 2.13 vs. 2.18; lateral deviation length (mm): 0.9 vs. 1.0; ML deviation time (s): 0.03 vs. 0.03; CoP minimum velocity (m/s): 0.03 vs. 0.03; CoP mean velocity (m/s): 0.28 vs. 0.29; CoP median velocity (m/s): 0.25 vs. 0.25; CoP AP (CV; %): 4.9 vs. 4.5; CoP ML (CV; %): 6.6 vs. 6.7. Impulse foot-strike to 1st peak (Ns/kg): 1.22 vs. 1.20; Impulse 1st peak to minimum (Ns/kg): 1.22 vs. 1.27; impulse minimum to 2nd peak (Ns/kg): 1.83 vs. 1.58; impulse 2nd peak to foot-off (Ns/kg): 1.14 vs. 1.05; impulse foot-strike to minimum (Ns/kg): 2.36 vs. 2.44; impulse minimum to foot-off (Ns/kg): 2.89 vs. 2.56; impulse foot-strike to foot-off (Ns/kg): 5.19 vs. 4.89. |
| Kwon et al., 2018 [84] | Exclusion criteria: not walking independently without assistance devices or any diseases that affected physical activity (e.g., musculoskeletal disease, neurological disease, and cardiovascular disorders). Definition of fall: not reported. | Community-dwelling elderly: 38 fallers (≥1 fall in past year; 10 males; 74.8 ± 5.7 years). 38 non-fallers (74.5 ± 5.0 years). | Subjects walked at preferred gait speed along a pressure-sensing walkway. Three trials were recorded for each subject. SD was calculated. | Gait speed (m/s): 1.01 vs. 1.09; swing phase (%): 36.6 vs. 37.7; stance phase (%): 63.4 vs. 62.4; double support (%): 26.6 vs. 24.5; step time variability (SD; s): 0.04 vs. 0.02; step length (m): 0.54 vs. 0.57; time peak force at maximal weight acceptance and mid-stance (s): 0.22 vs. 0.19; 0.37 vs. 0.34. | Single support (%): 36.9 vs. 37.5; step time (s): 0.55 vs. 0.53; step length variability (SD; cm): 2.6 vs. 2.7; foot progression angle (°): 8.0 vs. 6.5; peak force at maximal weight acceptance, mid-stance, and push-off (N/kg): 1.07 vs. 1.07; 0.82 vs. 0.81; 1.02 vs. 1.01; time to reach push-off (s): 0.56 vs. 0.55. |
| Marques et al., 2018 [85] | Inclusion criteria: 60–80 years; no use of any gait assistive device; no history of progressive or non-progressive neurological disease; normal cognition; normal or corrected vision; and no cardiovascular, metabolic, or musculoskeletal dysfunction that could impact the safe performance of data collection. Definition of fall: not reported. | Community-dwelling elderly: 53 fallers (≥1 fall in past year; 67.6 ± 5.3 years). 49 non-fallers (64.5 ± 7.1 years). | Subjects walked at preferred gait speed along a 14 m walkway. Six to ten trials were recorded until the subjects completed 50 consecutive strides. Two footswitches were attached on the heel and on the base of the first metatarsus (1000 Hz). | Gait speed (m/s): 1.01 vs. 1.12; stance time (s): 0.58 vs. 0.48; swing time (s): 0.48 vs. 0.57; stride time (s): 1.11 vs. 1.02; double-support time (s): 0.15 vs. 0.10; stride length (m): 1.02 vs. 1.16; stance time variability (SD; s): 0.12 vs. 0.05. | Swing time variability (SD; s): 0.25 vs. 0.17; stride time variability (SD; s): 0.23 vs. 0.21. |
| Thompson et al., 2018 [88] Qiao et al., 2018 [87] | Exclusion criteria: body mass index ≥ 30 kg/m2; sedentary lifestyle; orthopedic or neurological condition; or taking medication that causes dizziness. Definition of fall: unintentionally coming to the ground or some lower level for reasons other than a violent blow, loss of consciousness, or sudden onset of paralysis. | Community-dwelling elderly: 11 fallers (≥1 fall in past year; 4 males; 78.3 ± 7.6 years). 11 non-fallers (5 males; 75.3 ± 5.4 years). | Subjects walked at preferred gait speed on a treadmill (in an immersive virtual environment). Kinematic data were assessed using a 14-camera optoelectronic motion analysis system (100 Hz). EMG of leg was recorded (1000 Hz). | Step length (m): 0.62 vs. 0.64; step length variability (SD; cm): 2.7 vs. 2.7; step width (m): 11.2 vs. 12.9; step width variability (SD; cm): 3.3 vs. 2.8. Lower leg antagonist co-activation. | |
| Watanabe, 2018 [89] | Exclusion criteria: women. Inclusion criteria: no history of any musculoskeletal or neurological disorder. Definition of fall: not reported. | Community-dwelling elderly males: 6 fallers (1 fall in past year; 69.0 ± 3.7 years). 7 non-fallers (73.3 ± 6.5 years). | Subjects walked on a treadmill at preferred gait speed for 20 min. Lower extremity kinematics were collected using a 6-camera optoelectronic motion analysis system (100 Hz). EMG data (rectus femoris muscle) were recorded. MTC was analyzed. | MTC decreased with time in non-fallers but not in fallers. | Preferred gait speed (m/s): 1.28 vs. 1.33; 5–10 min: cadence (steps/min): 118 vs. 120; toe off (% gait cycle): 63.2 vs. 61.1; MTC (% gait cycle): 84.3 vs. 82.4. 15–20 min: cadence (steps/min): 116 vs. 117; toe off (% gait cycle): 63.3 vs. 61.2; MTC (% gait cycle): 84.0 vs. 82.3. Variability in the rectus femoris activation decreased with time in fallers and non-fallers. |
| Bueno et al., 2019 [90] | Inclusion criteria: woman; ≥65 years; independent walking without aids; absence of previous surgeries in lower limbs, pelvis, or spine; Mini Mental Status Examination score > 14; body mass index ≥ 30 kg/m2; rheumatoid arthritis; neuromuscular or neurodegenerative diseases; diabetes mellitus; and no visual impairment. Definition of fall: unexpected event in which the subject comes to rest on the ground or lower level (excluded coming to rest against furniture or wall). | Community-dwelling elderly women: 10 recurrent fallers (≥2 falls in past year; 71.0 ± 6.8 years). 12 fallers (1 fall in past year; 72.7 ± 5.6 years). 27 non-fallers (72.5 ± 6.8 years). | Subjects walked barefoot at preferred gait speed along a 9 m walkway. Kinematic data were collected using a 7-camera optoelectronic motion analysis system (120 Hz). | Fallers vs. Recurrent fallers vs. Non-fallers: gait speed (m/s): 1.02 vs. 0.99 vs. 1.00; cadence (step/min): 110 vs. 113 vs. 109; stride length (m): 1.10 vs. 1.04 vs. 1.02; hip flexion/extension (°): 8.2 vs. 7.1 vs. 8.2; knee flexion/extension (°): 7.1 vs. 8.1 vs. 7.6; ankle dorsiflexion/plantarflexion (°): 4.7 vs. 4.5 vs. 4.5; hip adduction/abduction (°): 4.7 vs. 5.2 vs. 4.2; hip rotation (°): 6.4 vs. 6.9 vs. 6.6; foot progression angle (°): 5.8 vs. 6.1 vs. 6.0. | |
| Mak et al., 2019 [92] | Exclusion criteria: Mini Mental Status Examination score < 24; neurological impairment; acquired static visual acuity worse than 20/40; or unable to walk independently indoors. Definition of fall: not reported. | Community-dwelling elderly (40 males; 70.3 ± 4.8 years): 37 fallers (≥1 fall in past year; 7 males; 70.7 ± 5.0 years). 97 non-fallers (33 males; 70.1 ± 4.7 years). | Subjects walked along a 6 m walkway at preferred gait speed. Average muscle activity indices of lower limb co-contractions were measured using surface EMG. | Shank and thigh muscle co-contractions were higher in fallers. Lower limb muscle co-contractions were higher in fallers. | |
| Gillain et al., 2019 [91] | Exclusion criteria: ≥1 fall in the past year; use of a walking aid; gait disorders or an increased fall risk related to neurological or osteoarticular diseases; dementia; hip or knee prosthesis in the previous year; pain when walking; acute respiratory or cardiac illness; recent hospitalization; untreated or uncontrolled comorbidities; use of neuroleptic and sedative drugs; or presence of a cardiac pacing device. Definition of fall: unexpected event in which the subject comes to rest on the ground. | Community-dwelling elderly (48 males; 71.3 ± 5.4 years): 35 fallers (≥1 fall in 2 years follow-up; 18 males; 72.0 ± 6.9 years). 61 non-fallers (30 males; 70.9 ± 4.3 years). | Subjects walked with their own shoes at preferred and fast gait speed. Kinematic data were collected using a tri-axial accelerometer attached to the lumbar position and a 24-camera optoelectronic motion analysis system (120 Hz). Variability was analyzed using the CV. MTC was analyzed. | Preferred gait speed: stride length (m): 1.30 vs. 1.37. Fast gait speed: gait speed (m/s): 1.64 vs. 1.74; stride length (m): 1.47 vs. 1.60; | Preferred gait speed: gait speed (m/s): 1.24 vs. 1.31. Preferred gait speed and fast gait speed: cadence (stride/s): 0.96 vs. 0.96; 1.10 vs. 1.08; MTC (mm): 17.3 vs. 17.8; 18.0 vs. 20.6; median MTC (mm): 17.4 vs. 17.7; 18.7 vs. 20.8; MTC variability (SD; mm): 5.0 vs. 4.1; 4.5 vs. 4.5; MTC variability (CV; %): 27.0 vs. 24.3; 26.1 vs. 27.6; MTC-minimum (mm): 10.8 vs. 12.0; 9.8 vs. 9.1. |
| Yamagata et al., 2019 [93] | Exclusion criteria: neurological disorders or musculoskeletal injuries that would affect performance or inability to walk without assistance. Definition of fall: an unexpected event during which the subjects come to rest on the ground or other lower level. | Community-dwelling elderly: 12 fallers (≥1 fall in 1 year follow-up; 78.0 ± 4.7 years). 16 non-fallers (73.8 ± 7.9 years). | Subjects walked at preferred gait speed on a 6 m walkway. Kinematic data were assessed by an 8-camera optoelectronic motion analysis system (100 Hz). CoM was calculated. SD analyzed variability. | Gait speed (m/s): 1.1 vs. 1.3; CoM distance at toe-off and at heel strike (cm): 22.9 vs. 25.3; 19.7 vs. 2.26; variability in right shank angle in the sagittal plane during mid-swing (SD; rad): 6.41 vs. 5.21. | Segment angles (foot, shank, thigh, pelvis); segment angles variability (foot, shank, thigh, pelvis). Step width during early swing, mid-swing, and late-swing (m): 0.13 vs. 0.14; 0.15 vs. 0.17; 0.14 vs. 0.16; step width variability during early swing, mid-swing, and late-swing (m): 0.018 vs. 0.023; 0.011 vs. 0.0127; 0.019 vs. 0.020. |
| Yamagata et al., 2019 [94] | Exclusion criteria: neurological disorders or musculoskeletal injuries that would affect performance or inability to walk without assistance. Definition of fall: an unexpected event during which the subjects come to rest on the ground or other lower level. | Community-dwelling elderly: 10 fallers (≥1 fall in past year; 78.0 ± 2.7 years). 14 non-fallers (75.1 ± 5.4 years). | Subjects walked at preferred gait speed on a 6 m walkway. Kinematic data were assessed by an 8-camera optoelectronic motion analysis system (100 Hz). SD is used to analyze variability. Uncontrolled manifold analysis was used to assess how variability in segmental configurations affects the frontal trajectory of the swing foot. | Step length (m): 0.52 vs. 0.56; right shank angle in early swing (lower fallers); shank angle variability during early and mid-swing (higher fallers); variability of the vertical distance between feet (higher fallers). Fallers: higher variability in segmental configurations in all phases; in ML direction, kinematic synergy was higher during the early and late swing; higher kinematic synergy in the vertical direction. | Gait speed (m/s) (statistical tendency for the difference, p = 0.060): 1.01 vs. 1.25; step width (m): 0.11 vs. 0.10; cadence (steps/min): 97 vs. 99; swing phase (%): 36.7 vs. 35.2; stride length ratio: 0.9 vs. 0.9. In all planes, there were no differences in segment angles (foot, shank, thigh, pelvis); segment angle variability (foot, shank, thigh, pelvis). Vertical and ML distances between feet. Variability ML distance between feet. |
| Gonzalez et al., 2020 [95] | Inclusion criteria: ability to walk one mile at any pace with minimum rest and body mass index = 18.5–24.9 kg/m2 or ≥30 kg/m2. Exclusion criteria: use of an assistive device for walking; artificial joint replacement; history of diabetic peripheral neuropathy, neurological conditions that interfere with gait; body mass index = 25–29.9 kg/m2; compromised range of motion in the lower limb or trunk; untreated hypertension or cardiovascular diseases; or T-score ≤ 2.5 for the femoral neck. Definition of fall: not reported. | Community-dwelling elderly: 16 fallers (≥1 fall in 1-year follow-up). 16 non-fallers. | Subjects walked on a treadmill for 10 min at preferred gait speed. Kinematic data of the 10th thoracic vertebra were assessed by an 8-camera optoelectronic motion analysis system (100 Hz). Short-term exponents were used to analyze the data variability for each direction (larger positive exponents indicate higher instability). | Short-term exponents of the ML, AP, or vertical displacements. | |
| Pol et al., 2021 [97] | Exclusion criteria: <60 years; Short Portable Mental Status Questionnaire score < 7; unable to ambulate for at least 10 m without an assistive device; diabetic foot syndrome; neurological diseases; or lower extremity surgery. Definition of fall: unintentionally coming to the ground or other lower surface, not as a result of a major intrinsic event or an overwhelming hazard. | Community-dwelling elderly: 74 fallers (≥1 fall in past year; 20 males; 71.9 ± 4.9 years). 113 non-fallers (61 males; 69.9 ± 5.5 years). | Three trials were recorded for each subject’s dominant limb using a two-step gait initiation protocol at a comfortable walking speed. Foot function was assessed using barefoot plantar pressure analysis (50 Hz). CoP was calculated. | CoP excursion index (%): 14.69 vs. 17.58, total pressure–time integral (% body weight * second/cm2): 3.75 vs. 3.23; pressure–time integral of medial forefoot (% body weight * second/cm2): 1.84 vs. 1.39. | Pressure–time integral of medial heel (% body weight * second/cm2): 1.52 vs. 1.44; pressure–time integral of lateral heel (% body weight * second/cm2): 1.48 vs. 1.36; pressure–time integral of medial midfoot (% body weight * second/cm2): 0.99 vs. 0.87; pressure–time integral of lateral midfoot (% body weight * second/cm2): 1.30 vs. 1.21; pressure–time integral of central forefoot (% body weight * second/cm2): 1.73 vs. 1.71; pressure–time integral of lateral forefoot (% body weight * second/cm2): 1.75 vs. 1.79; pressure–time integral of hallux (% body weight * second/cm2): 2.35 vs. 1.80; pressure–time integral of second toe (% body weight * second/cm2): 0.90 vs. 0.78; pressure–time integral of lateral toes (% body weight * second/cm2): 0.84 vs. 0.73; Regional CoP velocity–heel, midfoot, forefoot, and toes (cm/s): 25.6 vs. 28.1; 16.1 vs. 18.8; 19.1 vs. 18.1; 43.8 vs. 48.4. |
| Sadeghi et al., 2021 [98] | Exclusion criteria: need help for walking; difficulties in understanding instructions; or receiving hospice care. Definition of fall: not reported. | Community-dwelling elderly: 13 fallers (>1 fall in past year; 72.5 ± 7.1 years). 13 non-fallers (73.1 ± 7.1 years). | Subjects walk barefoot at preferred gait speed on a 10 m walkway. Kinematic data from 10 gait cycles were collected by a 10-camera optoelectronic motion analysis system (100 Hz). | Cadence (steps/min): 98 vs. 115; gait speed (m/s): 0.74 vs. 1.04; stride time (s): 1.27 vs. 1.05; stride length (m): 0.90 vs. 1.08; double support time (s): 0.30 vs. 0.26. Ankle-to-knee, knee-to-hip, and ankle-to-hip coordination patterns. Less coordination variability in fallers. | Step width (m): 0.10 vs. 0.10; ankle displacement (°): 25 vs. 23; knee displacement (°): 47 vs. 44; hip displacement (°): 42 vs. 41. |
| Yamagata et al., 2021 [96] | Exclusion criteria: neurological disorders or musculoskeletal injuries that would affect performance or inability to walk without assistance. Definition of fall: an unexpected event during which the subjects come to rest on the ground or other lower level. | Community-dwelling elderly: 10 fallers (≥1 fall in past year; 78.0 ± 2.7 years). 14 non-fallers (75.1 ± 5.4 years). | Subjects walked at preferred gait speed on a 6 m walkway. Kinematic data were assessed by an 8-camera optoelectronic motion analysis system (100 Hz). CoM was calculated. Variance is used to analyze variability. | CoM vertical direction variability (higher fallers). | CoM displacements. CoM ML direction variability. |
| Figueiredo et al., 2022 [99] | Inclusion criteria: ≥80 years; any gender; ability to walk independently; and ability to understand the verbal commands to carry out assessment. Exclusion criteria: uncertain about their history of falls; had been hospitalized for >7 days in the 3 months before assessment; or had a severe orthopedic, neurological, respiratory, cardiovascular, visual, or hearing disease. Definition of fall: unexpected and unexplained event in which the subject inadvertently comes to the ground. | Community-dwelling elderly: 32 fallers (≥1 fall in past 6 months; 7 males; 89.9 ± 4.4 years). 32 non-fallers (5 males; 88.6 ± 4.1 years). | Subjects walked during the Timed Up and Go test. Kinematic data were collected using a tri-axial accelerometer attached between the L5 and S1 vertebrae. Spectral arc length metrics are used to quantify gait smoothness. | Spectral arc length in AP, ML, and vertical directions. | |
| Nascimento et al., 2022 [100] | Inclusion criteria: residing in the community; 60–79 years; and able to walk independently. Exclusion criteria: medical contraindications for submaximal exercise, according to American College of Sports Medicine guidelines, or inability to understand or follow investigation protocols. Definition of fall: not reported. | Community-dwelling elderly: 225 fallers (>1 fall in past year; 70.1 ± 5.6 years). 394 non-fallers (69.2 ± 5.4 years). | Subjects walked a distance of 30 feet at their preferred gait speed. Gait speed is calculated by dividing the distance walked by the time needed. Cadence is calculated by dividing the number of steps taken in space during the 30-foot walk test by the time taken to cover that distance. | Gait speed (m/s): 1.20 vs. 1.28. | Cadence (steps/s): 1.90 vs. 1.92. |
| Yoshida et al., 2022 [101] | Exclusion criteria: diagnosis of dementia, recent major illness, neurological, sensory, or mobility impairment, or musculoskeletal disorders or injuries. Definition of fall: event that resulted in a person coming to rest unintentionally on the ground or other lower level, not as the result of a major intrinsic event or an overwhelming hazard. | Community-dwelling elderly: 28 fallers (≥1 fall in past year; 7 males; 77.5 ± 4.9 years). 28 non-fallers (12 males; 78.1 ± 5.3 years). | Gait initiation was assessed using two force platforms (1024 Hz). CoP was calculated. | First step length (m): 0.61 vs. 0.66; CoP ML displacement during weight transfer (m): 0.13 vs. 0.12. | Weight transfer time (s): 0.99 vs. 0.96; forward progression time (s): 0.48 vs. 0.49; first step time (s): 0.55 vs. 0.57; ground contact time (s): 0.69 vs. 0.68; first step width (m): 0.17 vs. 0.17; CoP AP displacement during weight transfer (m): 0.043 vs. 0.048; CoP AP displacement during forward progress (m): 0.181 vs. 0.170; CoP ML displacement during forward progress (m): 0.023 vs. 0.023; CoP AP displacement during first step (m): 0.228 vs. 0.225; CoP ML displacement during first step (m): 0.023 vs. 0.021. |
| Baba et al., 2023 [102] | Inclusion criteria: ≥65 years and ability to walk independently without using aids. Exclusion criteria: stroke diagnosis, Parkinson’s disease, rheumatism; or history of hip or knee surgery. Definition of fall: unintentional landing on the ground, floor, or lower level. | Community-dwelling elderly: 16 fallers (≥1 fall in past year; 4 males; 84.6 ± 5.7 years). 34 non-fallers (3 males; 81.7 ± 6.1 years). | Subjects walked barefoot on a walkway at preferred gait speed. Kinematic data were collected using an inertial sensor system. | Gait speed (m/s): 0.83 vs. 0.92; foot angle with ground (°): 13.6 vs. 18.3. | Stride time (s): 1.10 vs. 1.03; stride length (m): 0.87 vs. 0.96; cadence (steps/min): 114 vs. 117; stance phase (%): 65.0 vs. 64.7; single support (%): 35.4 vs. 35.9; double support (%): 21.2 vs. 21.0; maximum ankle plantarflexion: 10.8 vs. 9.0; maximum ankle dorsiflexion: 9.7 vs. 9.4; maximum knee flexion: 40.4 vs. 41.7; maximum knee extension: 0.5 vs. 0.5; maximum hip flexion: 25.2 vs. 27.3; maximum hip extension: 13.5 vs. 13.2. |
| Study | Inclusion and/or Exclusion Criteria Definition of Fall | Sample Characteristics | Gait Assessment | Gait Parameters Related to Falls (Fallers vs. Recoveries) | Gait Parameters Not Related to Falls (Fallers vs. Recoveries) |
|---|---|---|---|---|---|
| Pavol et al., 1999 [105] | Exclusion criteria: neurological, musculoskeletal, cardiovascular, pulmonary, cognitive, and other systemic disorders; history of repeated falling; or minimum bone mineral density of the femoral neck of 0.65 g/cm2. | Community-dwelling elderly: 10 fallers (body’s subject being at least 50% supported by the safety harness). 39 recoveries. | Subjects walked on a 7 m walkway at their preferred gait speed using a safety harness. One trip was induced using a mechanical obstacle (5.1 cm from the ground). Kinematic data were collected using a 6-camera optoelectronic motion analysis system (60 Hz). | Gait speed (m/s): 1.31 vs. 1.18; step time (s): 0.50 vs. 0.54; step length (% body mass): 43.1 vs. 39.9. | Step width (cm): 8.9 vs. 9.2; trunk flexion (°): 11 vs. 9; gait phase of trip (% stride length): 59 vs. 59. |
| Lockhart et al., 2003 [106] | Exclusion criteria: based on an exam conducted by a physician to ensure that they were in generally good physical health and a peripheral neuropathy examination (below 50% of the norm). | Community-dwelling elderly (7 males: 75.5 ± 6.8 years): 7 fallers. 7 non-fallers. | Subjects walked on a 20 m circular track for 10 min using a safety harness. Two slips were induced. Four video cameras and two force plates were used to collect 3D data and the ground reaction forces (60 Hz). | Coefficient of friction after a heel strike (horizontal ground reaction force/vertical ground reaction force) was lower in fallers; horizontal heel contact velocity was higher in fallers. | |
| Pijnappels et al., 2005 [103] | Exclusion and inclusion criteria: not reported. | Community-dwelling elderly: 7 fallers (when the vertical force in the ropes exceeded 200 N during trials when one obstacle appeared from the ground unexpectedly to catch the subject’s swing limb. 1 male; 67.9 ± 2.6 years). 4 non-fallers (3 males; 66.5 ± 3.3 years). | Subjects walked at preferred gait speed over a platform and were tripped several times by an obstacle that appeared from the floor. A safety harness prevented subjects from falling. Kinematic and ground reaction force data were collected using a 4-camera optoelectronic motion analysis system and a force plate (100 Hz). | Total angular momentum; angular momentum at push-off. | Gait speed; stride length; obstacle contact phase; stance time of the support limb; double support time; swing phase time of the recovery limb; hip horizontal displacement; hip height at end push-off; rate of change of moment generation in ankle, knee, and hip; hip extension moment, knee flexion moment and ankle plantarflexion moment peak in the support limb. |
| Pavol et al., 2001 [107] | Exclusion criteria: neurological, musculoskeletal, cardiovascular, pulmonary, cognitive, and other systemic disorders; history of repeated falling; or minimum bone mineral density of the femoral neck of 0.65 g/cm2. | Community-dwelling elderly. The recovery attempts were classified as a lowering or an elevating strategy. Elevating strategy: 1 faller. 11 recoveries. | Subjects walked on a 7 m walkway at their preferred gait speed using a safety harness. One trip was induced using a mechanical obstacle (5.1 cm from the ground). Kinematic collected using a 6-camera optoelectronic motion analysis system (60 Hz). Ground reaction forces were collected by two force plates (1000 Hz). | Hip horizontal velocity at time of trip (% body height/s): 92.5 vs. 68.0; hip horizontal velocity at 0.1 s post-trip (%/s): 86.5 vs. 67.4; time from trip to follow-through toe-off (s): 0.40 vs. 0.45; ankle–hip angular position at time of loading (°): 11.9 vs. 8.9; hip height at heel strike (% body height): 51.1 vs. 54.5; trunk inclination from vertical at heel strike (°): 58.5 vs. 37.3; lumbar flexion at heel strike (°): 45.2 vs. 23.1; minimum hip–ankle distance (% body height): 42.4 vs. 47.4; maximum trunk inclination from vertical (°): 83.5 vs. 49.7; maximum lumbar flexion at heel strike (°): 70.3 vs. 35.3. | Trunk inclination at time of trip (°): 14.3 vs. 8.7; hip vertical velocity 0.1 s post-trip (% body height): −8.1 vs. −9.3; lumbar flexion at time of loading (°): 17.2 vs. 6.7; recovery step length (% body height): 51.8 vs. 49.8; recovery stride length (% body height): 93.2 vs. 89.7; obstacle–ankle distance at heel strike (% body height): 32.6 vs. 32.2; minimum hip–ankle distance (% body height): 31.0 vs. 34.5; maximum ankle ground clearance (% body height): 24.0 vs. 22.1; time from trip-to-ground contact (s): 0.40 vs. 0.45; maximum horizontal ankle velocity (% body height/s): 203 vs. 225; average horizontal ankle velocity (% body height/s): 56 vs. 54; ankle–hip angle at heel strike (°): 0.3 vs. −7.6; maximum hip vertical velocity (% body height/s): 20.7 vs. 29.1. |
| Pavol et al., 2001 [107] | Exclusion criteria: neurological, musculoskeletal, cardiovascular, pulmonary, cognitive, and other systemic disorders; history of repeated falling; or minimum bone mineral density of the femoral neck of 0.65 g/cm2. | Community-dwelling elderly. The recovery attempts were classified as a lowering or an elevating strategy. Lowering strategy: 5 fallers during-step fall (body’s subject being at least 50% supported by safety harness). 3 fallers after-step fall (body’s subject being at least 50% supported by safety harness). 26 recoveries. | Subjects walked on a 7 m walkway at their preferred gait speed using a safety harness. One trip was induced using a mechanical obstacle (5.1 cm from the ground). Kinematic data were collected using a 6-camera optoelectronic motion analysis system (60 Hz). Ground reaction forces were collected by two force plates (1000 Hz). | Fallers during-step fall vs. recoveries: hip horizontal velocity at trip (% body height/s): 91.3 vs. 68.2; hip horizontal velocity at 0.1 s post-trip (% body height/s): 94.5 vs. 72.9; time from trip to support limb loading (s): 0.27 vs. 0.16; ankle–hip angle at time of loading (°): 23.6 vs. 9.8; recovery step length (% body height): 36.9 vs. 49.4; recovery stride length (% body height): 51.4 vs. 59.9; obstacle–ankle distance at ground contact (% body height): 32.0 vs. 39.6; recovery step time (s): 0.21 vs. 0.27; hip height at ground foot contact (% body height): 47.2 vs. 54.5; ankle–hip angle at heel strike (°): 12.7 vs. −10.1; trunk inclination from vertical at heel strike (°): 48.3 vs. 36.0; maximum lumbar flexion at heel strike (°): 23.1 vs. 35.6. Fallers after-step fall vs. recoveries: trunk inclination at trip (°): 18.8 vs. 9.1; trunk inclination from vertical at ground foot contact (°): 55.2 vs. 36.0; lumbar flexion at ground foot contact (°): 38.7 vs. 23.5; maximum hip vertical velocity (% body height): −0.4 vs. 32.2; minimum hip–ankle distance (% body height): 41.0 vs. 47.3; maximum trunk inclination from vertical at ground foot contact (°): 74.6 vs. 46.6; maximum lumbar flexion at ground foot contact (°): 54.4 vs. 35.6. | Fallers during-step fall vs. recoveries: trunk inclination at time of trip (°): 7.5 vs. 9.1; hip vertical velocity at 0.1 s post-trip (body height/s): −11.8 vs. −9.8; time from trip to follow-through toe-off (s): 0.49 vs. 0.50; lumbar flexion at time of loading (°): 6.4 vs. 6.1; minimum hip–ankle distance at recovery step (% body height): 31.8 vs. 33.0; maximum ankle ground clearance (% body height): 23.8 vs. 24.7; time from trip to recovery foot toe-off (s): 0.28 vs. 0.26; time from trip to ground contact (s): 0.49 vs. 0.52; maximum horizontal ankle velocity (% body height/s): 227 vs. 263; average horizontal ankle velocity (% body height/s): 109 vs. 115; lumbar flexion at ground foot contact (°): 22.1 vs. 23.5; Fallers after-step fall vs. recoveries: hip horizontal velocity at time of trip (% body height/s): 79.4 vs. 68.2; hip horizontal velocity at 0.1 s post-trip (% body height/s): 82.2 vs. 72.9; hip vertical velocity at 0.1 s post-trip (% body height/s): −7.2 vs. −9.8; time from trip to support limb loading (s): 0.14 vs. 0.16; time from trip to follow-through toe-off (s): 0.52 vs. 0.50; ankle–hip angle at time of loading (°): 9.1 vs. 9.8; lumbar flexion at time of loading (°): 15.4 vs. 6.1; recovery step length (% body height): 49.1 vs. 49.4; recovery stride length (% body height): 61.7 vs. 59.9; obstacle–ankle distance at heel strike (% body height): 40.0 vs. 39.6; minimum hip–ankle distance (% body height): 28.8 vs. 33.0; time from trip to recovery foot toe-off (s): 0.24 vs. 0.26; time from trip to heel strike (s): 0.51 vs. 0.52; recovery step duration (s): 0.26 vs. 0.270; maximum horizontal ankle velocity (% body height/s): 264 vs. 263; average horizontal ankle velocity (% body height/s): 117 vs. 115; hip height (% body height): 50.9 vs. 54.5, ankle–hip angle (°): −7.8 vs. −10.1. |
| Espy & Pai, 2007 [108] | Inclusion criteria: ≥65 years. | Community-dwelling elderly: 19 fallers (subjects who fell during an unexpected induced slip). 15 non-fallers (subjects who recover during an unexpected induced slip). | Subjects walked on an instrumented walkway while wearing a safety harness. After 10 unperturbed trials, an unexpected slip was induced under the right heel. Motion data were used to calculate frontal plane variables. | Step width; CoM lateral position; CoM velocity. | |
| Bhatt et al., 2011 [104] | Exclusion criteria: Folstein Mini Mental Status Examination score < 25 or classified as osteopenic or osteoporotic. | Community-dwelling elderly (44 males): 59 fallers (the force recorded on the safety harness load cell force exceeded 30% of the body weight; 71.6 ± 4.6 years). 56 recoveries (71.4 ± 5.1 years). | Subjects walked for 9–12 trials on a 7 m walkway using their own athletic shoes and were then exposed to one unannounced slip. Kinematic and ground reaction force data were collected during 5 trials using an 8-camera optoelectronic motion analysis system (120 Hz) and one force platform (600 Hz). | Dynamic gait stability: −0.16 vs. −0.13. | |
| Yang & Pai, 2014 [109] | Exclusion criteria: any known neurological, musculoskeletal, or other systemic disorder that would have affected their postural control. | Community-dwelling elderly: 98 fallers (the force recorded on the safety harness load cell force exceeded 30% of the body weight; 22 males; 71.8 ± 5.5 years). 89 recoveries (37 males; 71.9 ± 4.8 years). | Subjects walked for 20 trials on a 7 m instrumented walkway at preferred gait speed and were then exposed to one unannounced slip. Kinematic data were collected using an 8-camera optoelectronic motion analysis system (120 Hz) and ground reaction force using four force platforms (600 Hz). | Step width (SD; m): 0.031 vs. 0.027; dynamic stability of CoM against backward falling: −0.18 vs. −0.16. | Step length (SD; m): 0.070 vs. 0.062; step time (SD; s): 0.044 vs. 0.041; margin of stability: 0.039 vs. 0.051; Floquet multiplier: 0.422 vs. 0.432; Lyapunov exponent (short-term): 0.671 vs. 0.737; Lyapunov exponent (long-term): 0.034 vs. 0.026. |
| Sawers et al., 2016 [110] | Inclusion criteria: participants who experienced a “split” slip with the slipping and trailing feet traveling apart were included. | Community-dwelling elderly: 15 fallers (unable to regain their stability after an unexpected induced slip; 2 males; 71.0 ± 2.0 years). 13 recoveries (able to recover their stability and continue walking after an unexpected induced slip; 8 males; 72.0 ± 5.0 years). | Subjects walked on a 7 m walkway at their preferred gait speed using a safety harness. One unexpected slip was induced. Kinematic collected using an optoelectronic motion analysis system (120 Hz). EMG of TA, MG, VL, and BF were recorded (600 Hz). | Slip distance (m): 0.78 vs. 0.61; EMG onset latencies/slip leg (s): VL (right): 0.239 vs. 0.186; BF (right): 0.170 vs. 0.120. Muscle synergies recruited during slip and non-slip trials: 3.7 vs. 4.7. | Slip time (s): 0.82 vs. 0.94; peak slip velocity (m/s): 2.00 vs. 1.84; dynamic stability: −0.18 vs. −0.16; gait speed (m/s): 0.89 vs. 1.00; shank angle (°): 74 vs. 73. EMG onset latencies/slip leg (s): TA (right): 0.173 vs. 0.151; MG (right): 0.234 vs. 0.232; EMG onset latencies/nonslip leg (s): TA (left): 0.162 vs. 0.157; MG (left): 0.215 vs. 0.198, VL (left): 0.165 vs. 0.154; BF (left): 0.150 vs. 0.155; EMG onset peak magnitude/slip leg: TA (right): 2.30 vs. 2.28; MG (right): 2.32 vs. 2.32; VL (right): 2.09 vs. 2.36; BF (right): 3.45 vs. 3.87; EMG Onset peak magnitude/nonslip leg: TA (left): 2.86 vs. 2.58; MG (left): 1.64 vs. 1.87; VL (left): 4.75 vs. 3.56; BF (left): 3.75 vs. 3.22. |
| Sawers & Bhatt, 2018 [111] | Inclusion criteria: participants who experienced a feet-forward slip (with both feet moving forward) were included. | Community-dwelling elderly: 12 fallers (when peak force recorded by the load cell in line with the overhead harness exceeded 30% of the subject’s body weight; 2 males; 73.0 ± 4.9 years). 13 recoveries (7 males; 74.0 ± 4.1 years). | Subjects walked on a 7 m walkway at their preferred gait speed using a safety harness. One unexpected slip was induced. Kinematic data were collected using an optoelectronic motion analysis system (120 Hz). Ground reaction forces were collected (600 Hz). | Lower limb joint angle: knee flexion (higher flexion fallers). Number of muscle synergies recruited: 4 vs. 5. | Peak slip velocity (m/s): 2.28 vs. 2.14; slip duration (s): 0.68 vs. 0.70; slip distance (m): 0.74 vs. 0.62; shank angle (°): 75.8 vs. 75.0; step length (m): 0.30 vs. 0.32; dynamic stability: −0.124 vs. −0.155; gait speed (m/s): 1.13 vs. 1.02 (statistical tendency for the difference, p = 0.093). Lower limb joint angle: hip flexion/extension; knee extension; ankle dorsiflexion/plantar-flexion. |
| Bruijn et al., 2022 [112] | Exclusion criteria: orthopedic, neuromuscular, cardiac, or visual problems. | Community-dwelling elderly: 5 fallers. 11 recoveries. | Subjects walked on a 12 m walkway at their preferred gait speed using a safety harness. One unexpected slip was induced. Kinematic data were collected using an optoelectronic motion analysis system (50 Hz). Ground reaction forces were collected (1000 Hz). | Sagittal plane forward body rotation at touchdown. | Gait speed (m/s): 1.48 vs. 1.43; time between impact and touchdown (s): 0.46 vs. 0.50; arm movements. |
| Wang et al., 2022 [113] | Inclusion criteria: ≥60 years. Exclusion criteria: recently (≤6 months) self-reported diagnosed neurological, musculoskeletal, or other systemic disorder. | Community-dwelling elderly: 229 falls (the recovery foot landing posterior to the sliding foot based on the location of heel markers). 569 recoveries. | Subjects walked with their own shoes on a 12 m walkway at their preferred gait speed using a safety harness. Unexpected slips were induced. Kinematic data were collected using an 8-camera optoelectronic motion analysis system (120 Hz). Ground reaction forces were collected (600 Hz). | Stride length (m): 0.41 vs. 0.70; slip distance (m): 0.31 vs. 0.08; slip velocity (m/s): 1.12 vs. −0.34; trunk angle (°): 4.9 vs. −1.5. | |
| Wang & Bhatt, 2023 [114] | Inclusion criteria: ≥60 years. Exclusion criteria: recently (≤6 months) self-reported diagnosed neurological, musculoskeletal, or other systemic disorder. | Community-dwelling elderly: 61 fallers (the peak moving average force of the load cell over a 1 s period was ≥4.5% of body weight). 56 recoveries. | Subjects walked with their own shoes on a 12 m walkway at their preferred gait speed using a safety harness. Unexpected slips were induced. Kinematic data were collected using an 8-camera optoelectronic motion analysis system (120 Hz). Ground reaction forces were collected (600 Hz). CoM was calculated. | Margin of stability at tripping foot touchdown: 1.39 vs. 0.95; maximum step length (m): 0.11 vs. 0.04; maximum CoM velocity (m/s): 0.59 vs. 0.21; peak trunk angle (°): 23.7 vs. 6.9. | Margin of stability at tripping foot lift-off: 1.03 vs. 0.96; margin of stability at pre-tripping foot touchdown: 2.38 vs. 2.24. |
| Study | Selection Bias | Study Design | Confounders | Blinding | Data Collection Methods | Withdrawals and Dropouts | Global |
|---|---|---|---|---|---|---|---|
| Heitmann et al., 1989 [20] | 3 | 3 | 3 | 2 | 3 | 2 | 3 |
| Gehlsen & Whaley, 1990 [21] | 3 | 3 | 3 | 2 | 1 | 2 | 3 |
| Feltner et al., 1994 [22] | 3 | 3 | 3 | 2 | 1 | 2 | 3 |
| Wolfson et al., 1995 [23] | 3 | 3 | 3 | 2 | 3 | 2 | 3 |
| Maki, 1997 [24] | 3 | 3 | 1 | 1 | 1 | 1 | 3 |
| Lee & Kerrigan, 1999 [25] | 3 | 3 | 3 | 2 | 1 | 2 | 3 |
| Nelson et al., 1999 [26] | 3 | 3 | 3 | 2 | 1 | 2 | 3 |
| Pavol et al., 1999 [105] | 3 | 3 | 1 | 1 | 1 | 2 | 3 |
| Wall et al., 2000 [27] | 3 | 3 | 3 | 2 | 3 | 2 | 3 |
| Hausdorff et al., 2001 [28] | 3 | 3 | 3 | 1 | 1 | 1 | 3 |
| Kerrigan et al., 2000 [29] | 3 | 3 | 3 | 2 | 1 | 2 | 3 |
| Kerrigan et al., 2001 [30] | 3 | 3 | 3 | 2 | 1 | 2 | 3 |
| Pavol et al., 2001 [107] | 3 | 3 | 1 | 1 | 1 | 2 | 3 |
| Kemoun et al., 2002 [31] | 3 | 3 | 3 | 1 | 1 | 1 | 3 |
| Auvinet et al., 2003 [32] | 3 | 3 | 3 | 2 | 1 | 2 | 3 |
| Mbourou et al., 2003 [33] | 3 | 3 | 3 | 2 | 1 | 2 | 3 |
| Lockhart et al., 2003 [106] | 3 | 3 | 3 | 1 | 1 | 2 | 3 |
| Chiba et al., 2005 [34] | 3 | 3 | 1 | 2 | 1 | 2 | 3 |
| Pijnappels et al., 2005 [103] | 3 | 3 | 3 | 1 | 1 | 2 | 3 |
| Barak et al., 2006 [35] | 3 | 3 | 3 | 2 | 1 | 2 | 3 |
| Toulotte et al., 2006 [36] | 3 | 3 | 1 | 2 | 1 | 2 | 3 |
| Espy & Pai, 2007 [108] | 3 | 3 | 3 | 1 | 1 | 2 | 3 |
| Karmakar et al., 2007 [37] | 3 | 3 | 3 | 2 | 1 | 2 | 3 |
| Newstead et al., 2007 [39] | 3 | 3 | 1 | 2 | 1 | 2 | 3 |
| Barrett et al., 2008 [40] | 3 | 3 | 3 | 2 | 1 | 2 | 3 |
| Khandoker et al., 2008 [41] | 3 | 3 | 3 | 2 | 1 | 2 | 3 |
| Khandoker et al., 2008 [42] | 3 | 3 | 3 | 2 | 1 | 2 | 3 |
| Lockhart & Liu, 2008 [43] | 3 | 3 | 3 | 2 | 1 | 2 | 3 |
| Verghese et al., 2009 [14] | 2 | 3 | 1 | 1 | 1 | 1 | 2 |
| Greany & Di Fabio, 2010 [44] | 3 | 3 | 3 | 2 | 1 | 2 | 3 |
| Greene et al., 2010 [45] | 2 | 3 | 3 | 2 | 1 | 2 | 3 |
| Mickle et al., 2010 [46] | 2 | 3 | 1 | 1 | 1 | 1 | 3 |
| Bhatt et al., 2011 [104] | 3 | 3 | 3 | 1 | 1 | 2 | 3 |
| Kirkwood et al., 2011 [47] | 3 | 3 | 3 | 2 | 1 | 2 | 3 |
| Lázaro et al., 2011 [48] | 2 | 3 | 3 | 2 | 3 | 2 | 3 |
| Lugade et al., 2011 [49] | 3 | 3 | 3 | 2 | 1 | 2 | 3 |
| Panzer et al., 2011 [50] | 3 | 3 | 3 | 2 | 3 | 2 | 3 |
| Scanaill et al., 2011 [51] | 2 | 3 | 3 | 2 | 1 | 2 | 3 |
| Karmakar et al., 2012 [38] | 3 | 3 | 3 | 2 | 1 | 2 | 3 |
| Uemura et al., 2012 [52] | 3 | 3 | 1 | 2 | 1 | 2 | 3 |
| Chen & Chou, 2013 [53] | 3 | 3 | 3 | 2 | 1 | 2 | 3 |
| Chen et al., 2013 [54] | 3 | 3 | 3 | 2 | 1 | 2 | 3 |
| Chiu & Chou, 2013 [55] | 3 | 3 | 3 | 2 | 1 | 2 | 3 |
| Fritz et al., 2013 [56] | 3 | 3 | 3 | 2 | 1 | 2 | 3 |
| Marques et al., 2013 [58] | 3 | 1 | 3 | 2 | 1 | 2 | 3 |
| Marques et al., 2013 [59] | 3 | 1 | 3 | 2 | 1 | 2 | 3 |
| Weiss et al., 2013 [57] | 3 | 3 | 1 | 2 | 1 | 2 | 3 |
| Ayoubi et al., 2014 [60] | 2 | 3 | 3 | 2 | 1 | 2 | 3 |
| Barelle et al., 2014 [61] | 3 | 3 | 3 | 2 | 1 | 2 | 3 |
| Iwata et al., 2014 [62] | 3 | 3 | 3 | 2 | 1 | 2 | 3 |
| Kobayashi et al., 2014 [63] | 3 | 3 | 3 | 2 | 1 | 2 | 3 |
| König et al., 2014 [64] | 3 | 3 | 1 | 2 | 1 | 2 | 3 |
| Mignardot et al., 2014 [65] | 2 | 3 | 1 | 1 | 1 | 1 | 2 |
| Yang & Pai, 2014 [109] | 2 | 3 | 3 | 1 | 1 | 2 | 3 |
| Cebolla et al., 2015 [66] | 3 | 3 | 3 | 2 | 1 | 2 | 3 |
| MacAulay et al., 2015 [67] | 2 | 3 | 3 | 2 | 1 | 2 | 3 |
| Rispens et al., 2015 [68] | 3 | 3 | 3 | 2 | 1 | 2 | 3 |
| Wright et al., 2015 [69] | 3 | 3 | 3 | 2 | 1 | 2 | 3 |
| Bounyong et al., 2016 [70] | 3 | 3 | 3 | 2 | 1 | 2 | 3 |
| Fujimoto & Chou, 2016 [71] | 3 | 3 | 3 | 2 | 1 | 2 | 3 |
| Howcroft et al., 2016 [73] | 2 | 3 | 3 | 2 | 1 | 2 | 3 |
| Ihlen et al., 2016 [72] | 3 | 3 | 3 | 2 | 1 | 2 | 3 |
| Rinaldi et al., 2016 [74] | 3 | 3 | 3 | 2 | 1 | 2 | 3 |
| Sawers et al., 2016 [110] | 3 | 3 | 3 | 1 | 1 | 2 | 3 |
| Bizovska et al., 2017 [76] | 2 | 3 | 3 | 1 | 1 | 1 | 3 |
| de Melker Worms et al., 2017 [77] | 3 | 3 | 3 | 2 | 1 | 2 | 3 |
| de Melker Worms et al., 2017 [78] | 3 | 3 | 3 | 2 | 1 | 2 | 3 |
| Marques et al., 2017 [79] | 3 | 3 | 1 | 2 | 1 | 2 | 3 |
| Júnior et al., 2017 [80] | 3 | 3 | 3 | 2 | 1 | 2 | 3 |
| Rinaldi et al., 2017 [75] | 3 | 3 | 3 | 2 | 1 | 2 | 3 |
| Svoboda et al., 2017 [81] | 2 | 3 | 3 | 2 | 1 | 2 | 3 |
| Allen & Franz, 2018 [82] | 3 | 3 | 3 | 2 | 1 | 2 | 3 |
| Benson et al., 2018 [83] | 3 | 3 | 3 | 2 | 1 | 2 | 3 |
| Howcroft et al., 2018 [86] | 3 | 3 | 3 | 1 | 1 | 1 | 3 |
| Kwon et al., 2018 [84] | 3 | 3 | 3 | 2 | 1 | 2 | 3 |
| Marques et al., 2018 [85] | 3 | 3 | 1 | 2 | 1 | 2 | 3 |
| Qiao et al., 2018 [88] | 3 | 3 | 3 | 2 | 1 | 2 | 3 |
| Sawers & Bhatt, 2018 [111] | 3 | 3 | 3 | 1 | 1 | 2 | 3 |
| Thompson et al., 2018 [87] | 3 | 3 | 3 | 2 | 1 | 2 | 3 |
| Watanabe et al., 2018 [89] | 3 | 3 | 3 | 2 | 1 | 2 | 3 |
| Bueno et al., 2019 [90] | 3 | 3 | 3 | 2 | 1 | 2 | 3 |
| Gillian et al., 2019 [91] | 2 | 3 | 1 | 1 | 1 | 1 | 2 |
| Mak et al., 2019 [92] | 2 | 3 | 3 | 2 | 1 | 2 | 3 |
| Yamagata et al., 2019 [93] | 3 | 3 | 3 | 1 | 1 | 2 | 3 |
| Yamagata et al., 2019 [94] | 3 | 3 | 3 | 1 | 1 | 1 | 3 |
| Gonzalez et al., 2020 [95] | 3 | 3 | 3 | 2 | 1 | 1 | 3 |
| Pol et al., 2021 [97] | 2 | 3 | 1 | 2 | 1 | 2 | 2 |
| Sadeghi et al., 2021 [98] | 3 | 3 | 3 | 2 | 1 | 2 | 3 |
| Yamagata et al., 2021 [96] | 3 | 3 | 3 | 1 | 1 | 1 | 3 |
| Bruijn et al., 2022 [112] | 3 | 3 | 3 | 1 | 1 | 2 | 3 |
| Figueiredo et al., 2022 [99] | 3 | 3 | 1 | 2 | 1 | 2 | 3 |
| Nascimento et al., 2022 [100] | 2 | 3 | 1 | 2 | 3 | 2 | 2 |
| Wang et al., 2022 [113] | 1 | 3 | 3 | 1 | 1 | 2 | 3 |
| Yoshida et al., 2022 [101] | 2 | 3 | 3 | 2 | 1 | 2 | 3 |
| Baba et al., 2023 [102] | 3 | 3 | 3 | 2 | 1 | 2 | 3 |
| Wang & Bhatt, 2023 [114] | 1 | 3 | 3 | 1 | 1 | 2 | 3 |
Disclaimer/Publisher’s Note: The statements, opinions and data contained in all publications are solely those of the individual author(s) and contributor(s) and not of MDPI and/or the editor(s). MDPI and/or the editor(s) disclaim responsibility for any injury to people or property resulting from any ideas, methods, instructions or products referred to in the content. |
© 2024 by the authors. Licensee MDPI, Basel, Switzerland. This article is an open access article distributed under the terms and conditions of the Creative Commons Attribution (CC BY) license (https://creativecommons.org/licenses/by/4.0/).
Share and Cite
Silva, J.; Atalaia, T.; Abrantes, J.; Aleixo, P. Gait Biomechanical Parameters Related to Falls in the Elderly: A Systematic Review. Biomechanics 2024, 4, 165-218. https://doi.org/10.3390/biomechanics4010011
Silva J, Atalaia T, Abrantes J, Aleixo P. Gait Biomechanical Parameters Related to Falls in the Elderly: A Systematic Review. Biomechanics. 2024; 4(1):165-218. https://doi.org/10.3390/biomechanics4010011
Chicago/Turabian StyleSilva, Jullyanne, Tiago Atalaia, João Abrantes, and Pedro Aleixo. 2024. "Gait Biomechanical Parameters Related to Falls in the Elderly: A Systematic Review" Biomechanics 4, no. 1: 165-218. https://doi.org/10.3390/biomechanics4010011