
Locomotor Adaptation Training to Prevent Mobility Disability

 , , , and
Abstract
:1. Introduction
2. Materials and Methods
2.1. Functional Testing
2.2. Cardiovascular Testing
2.3. Cognitive Testing
2.4. Gait Testing
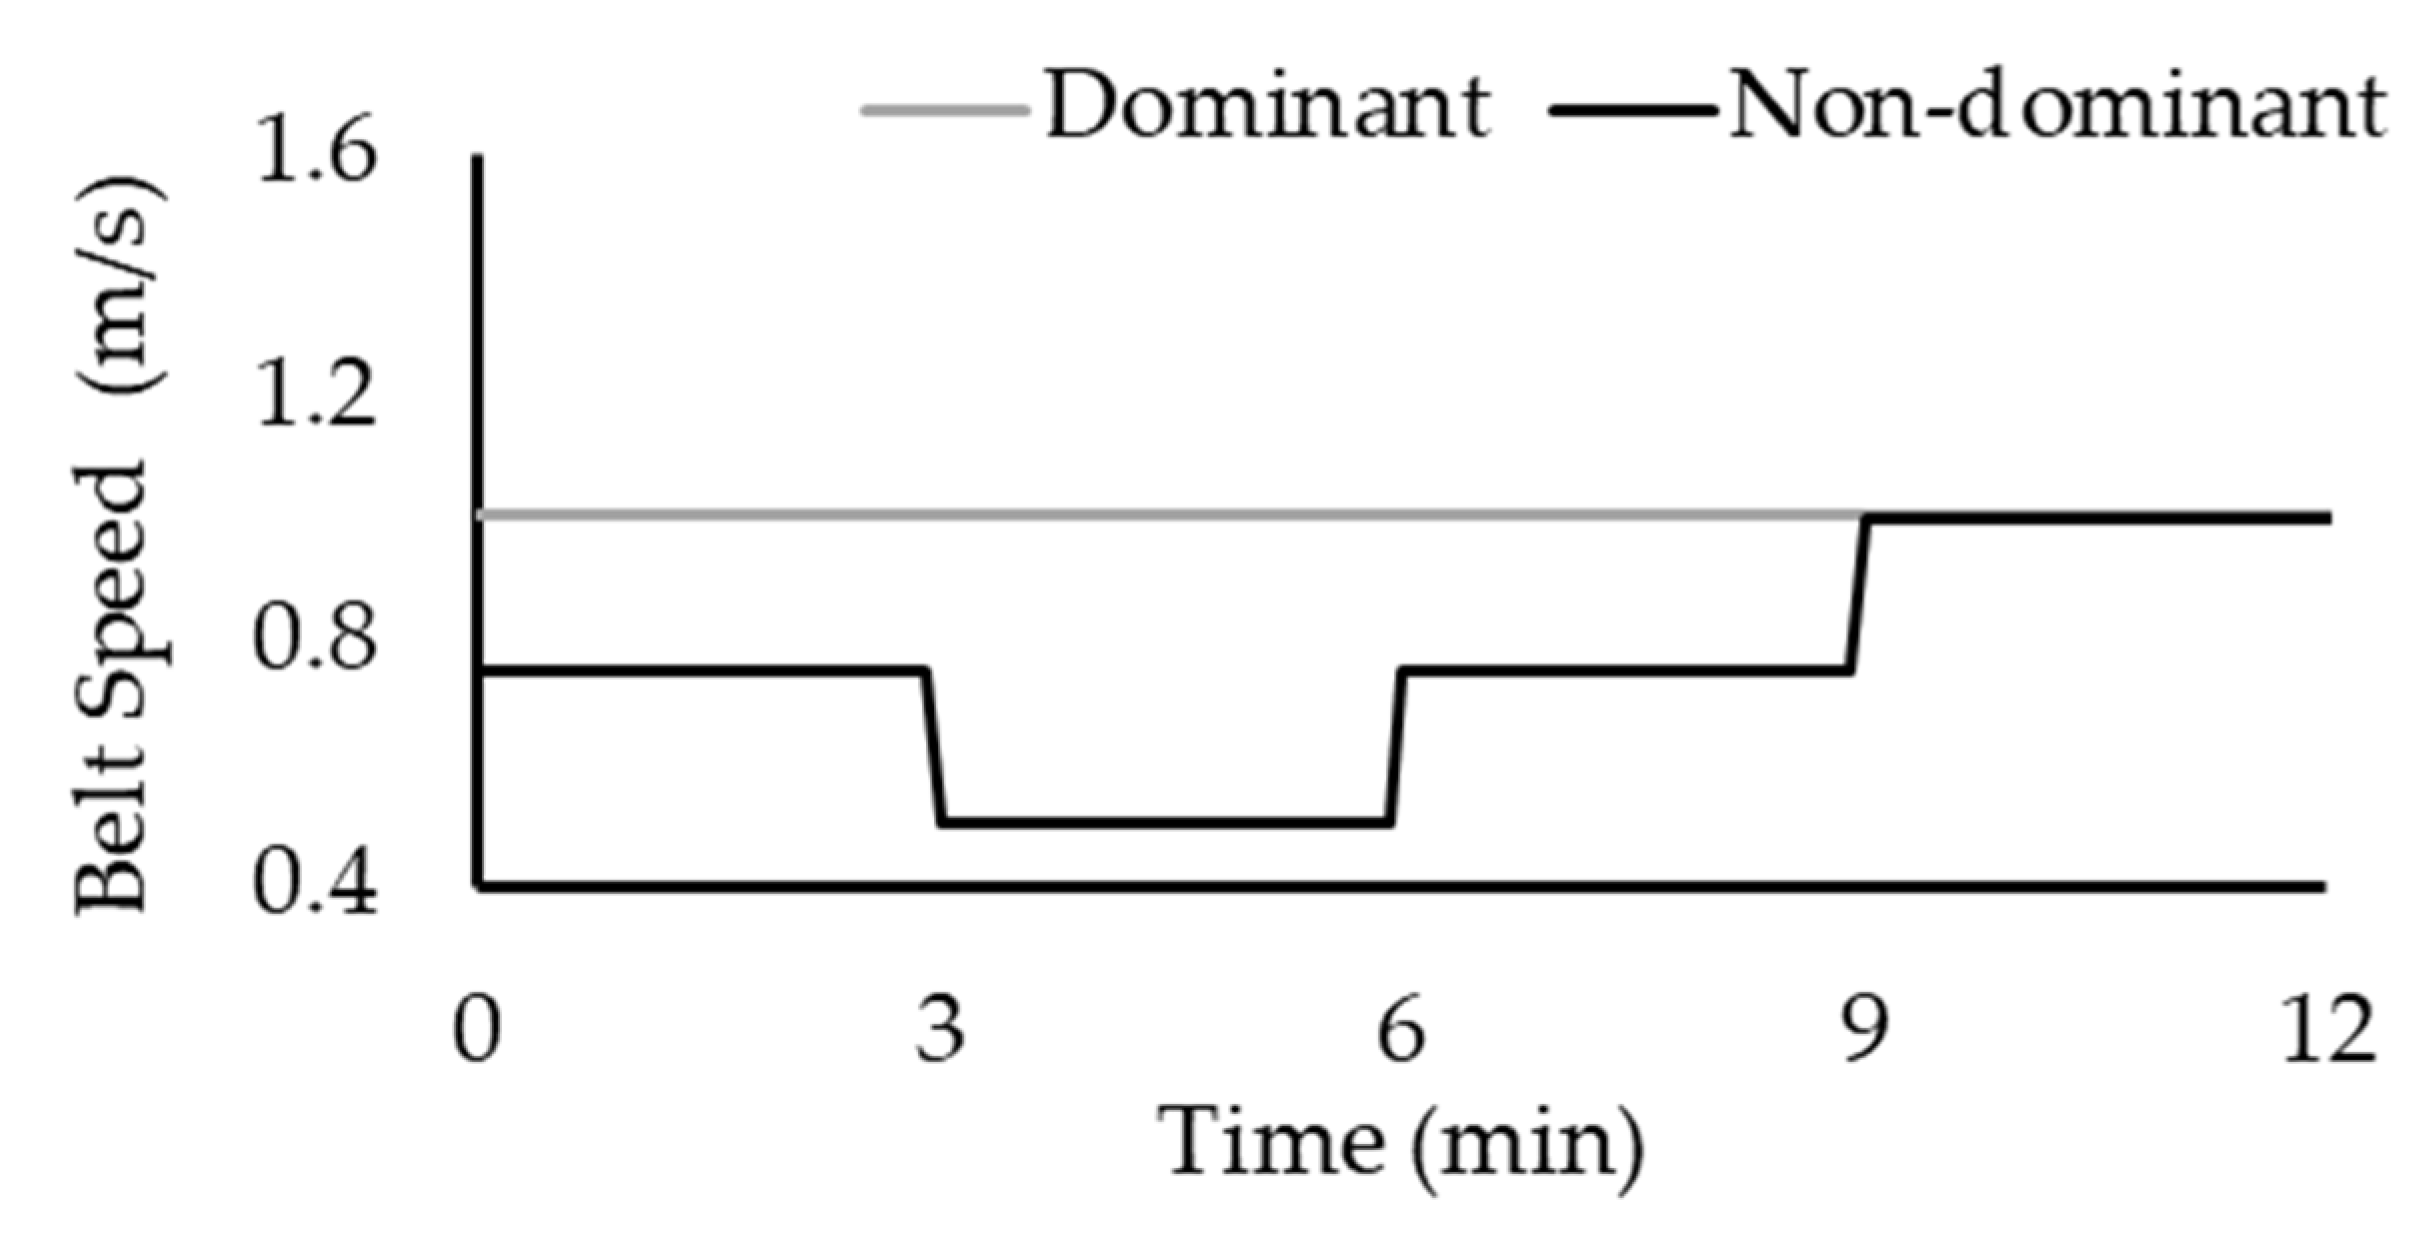
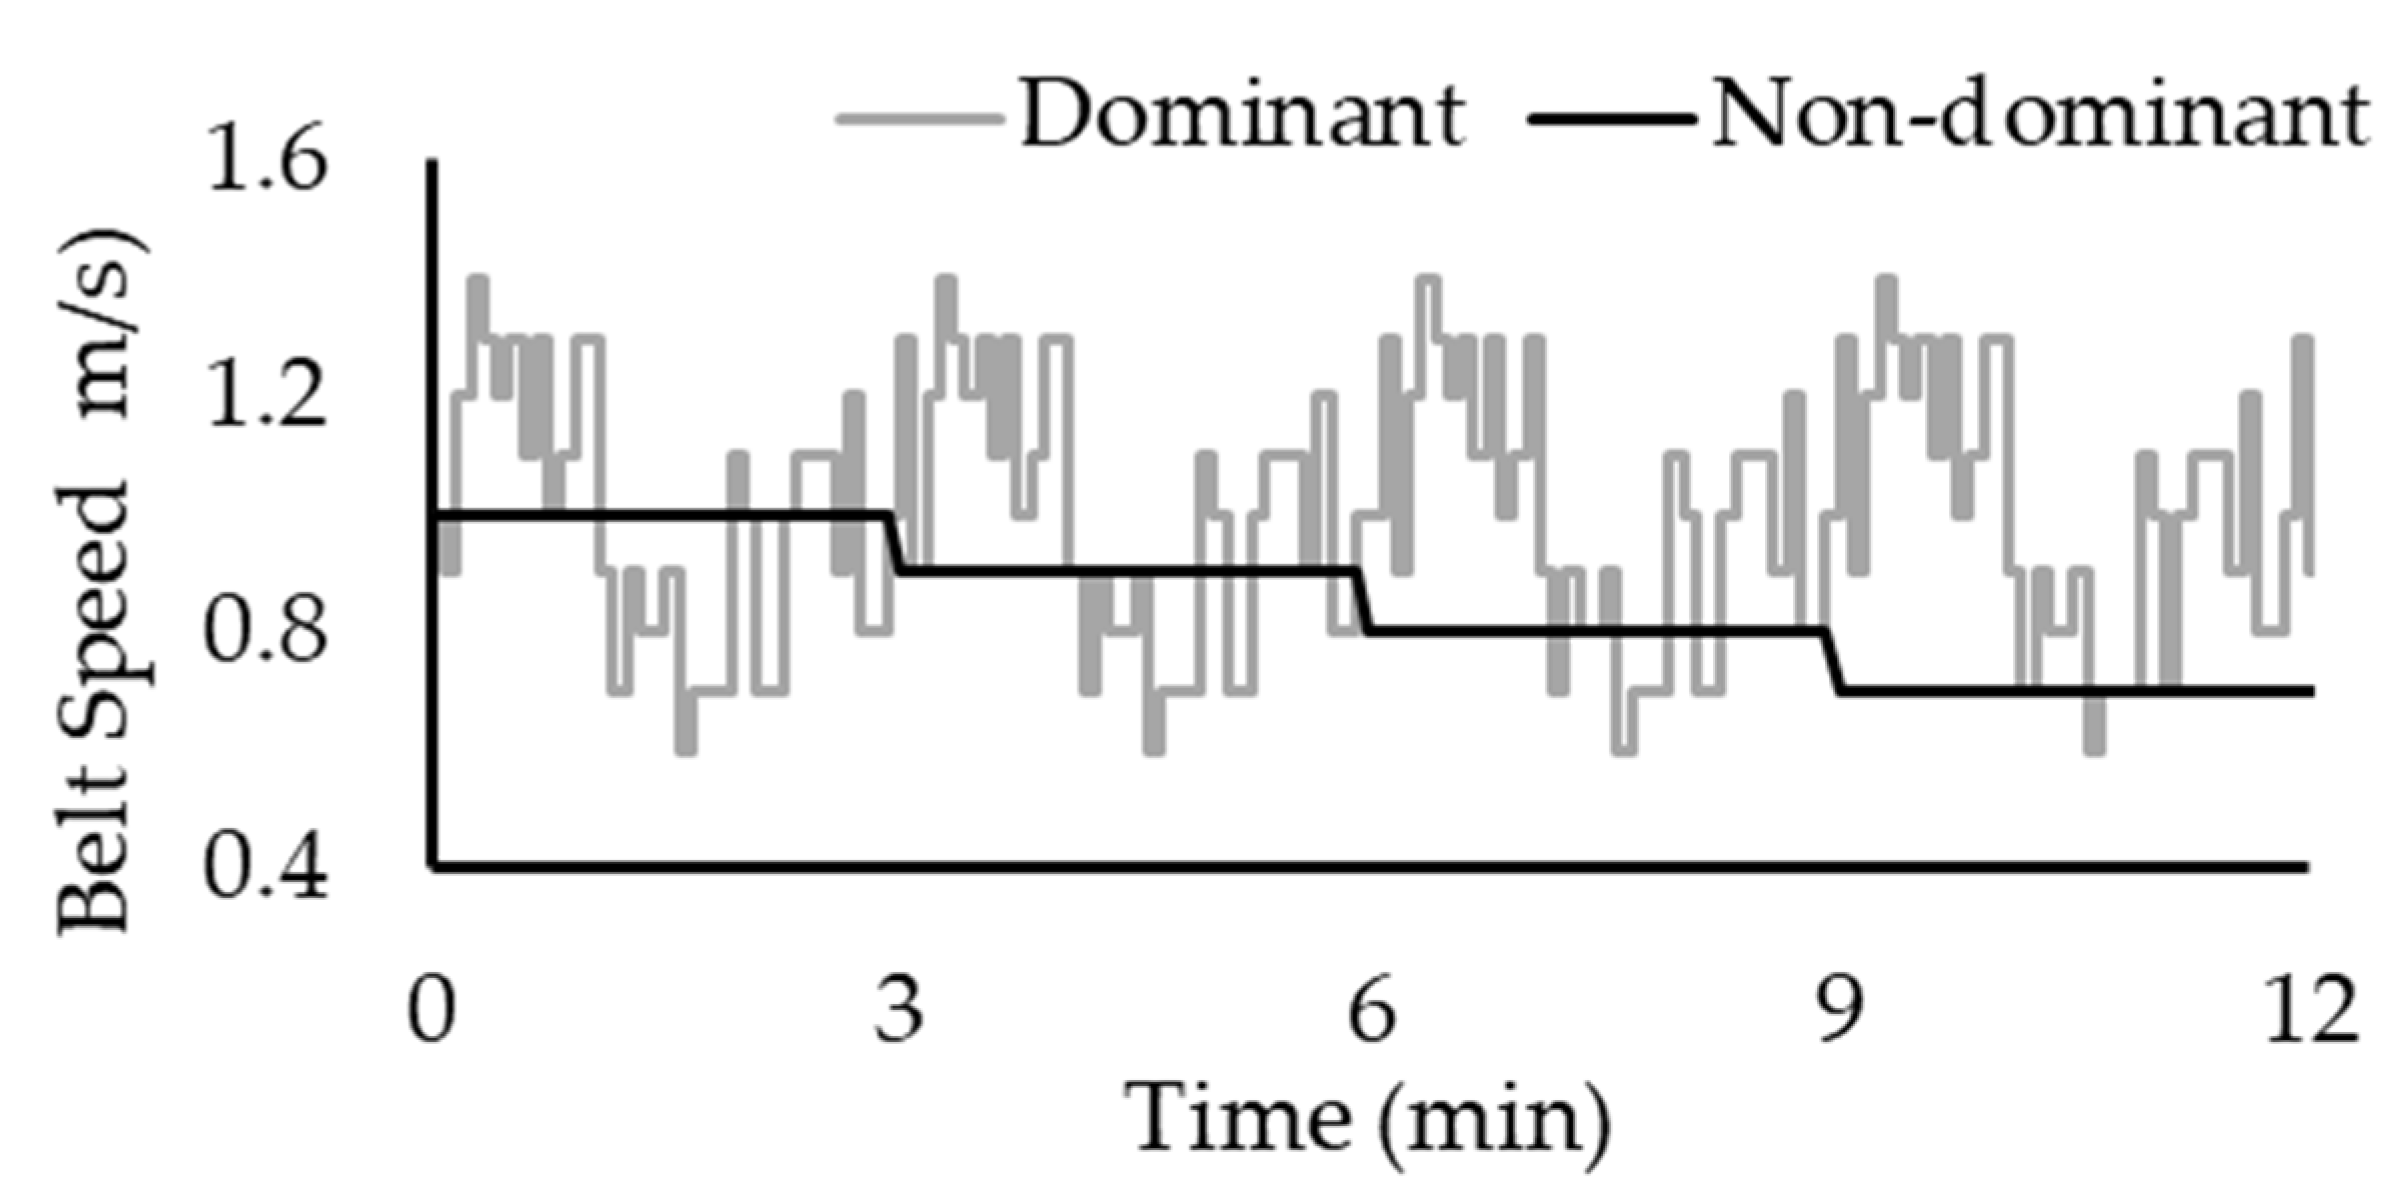
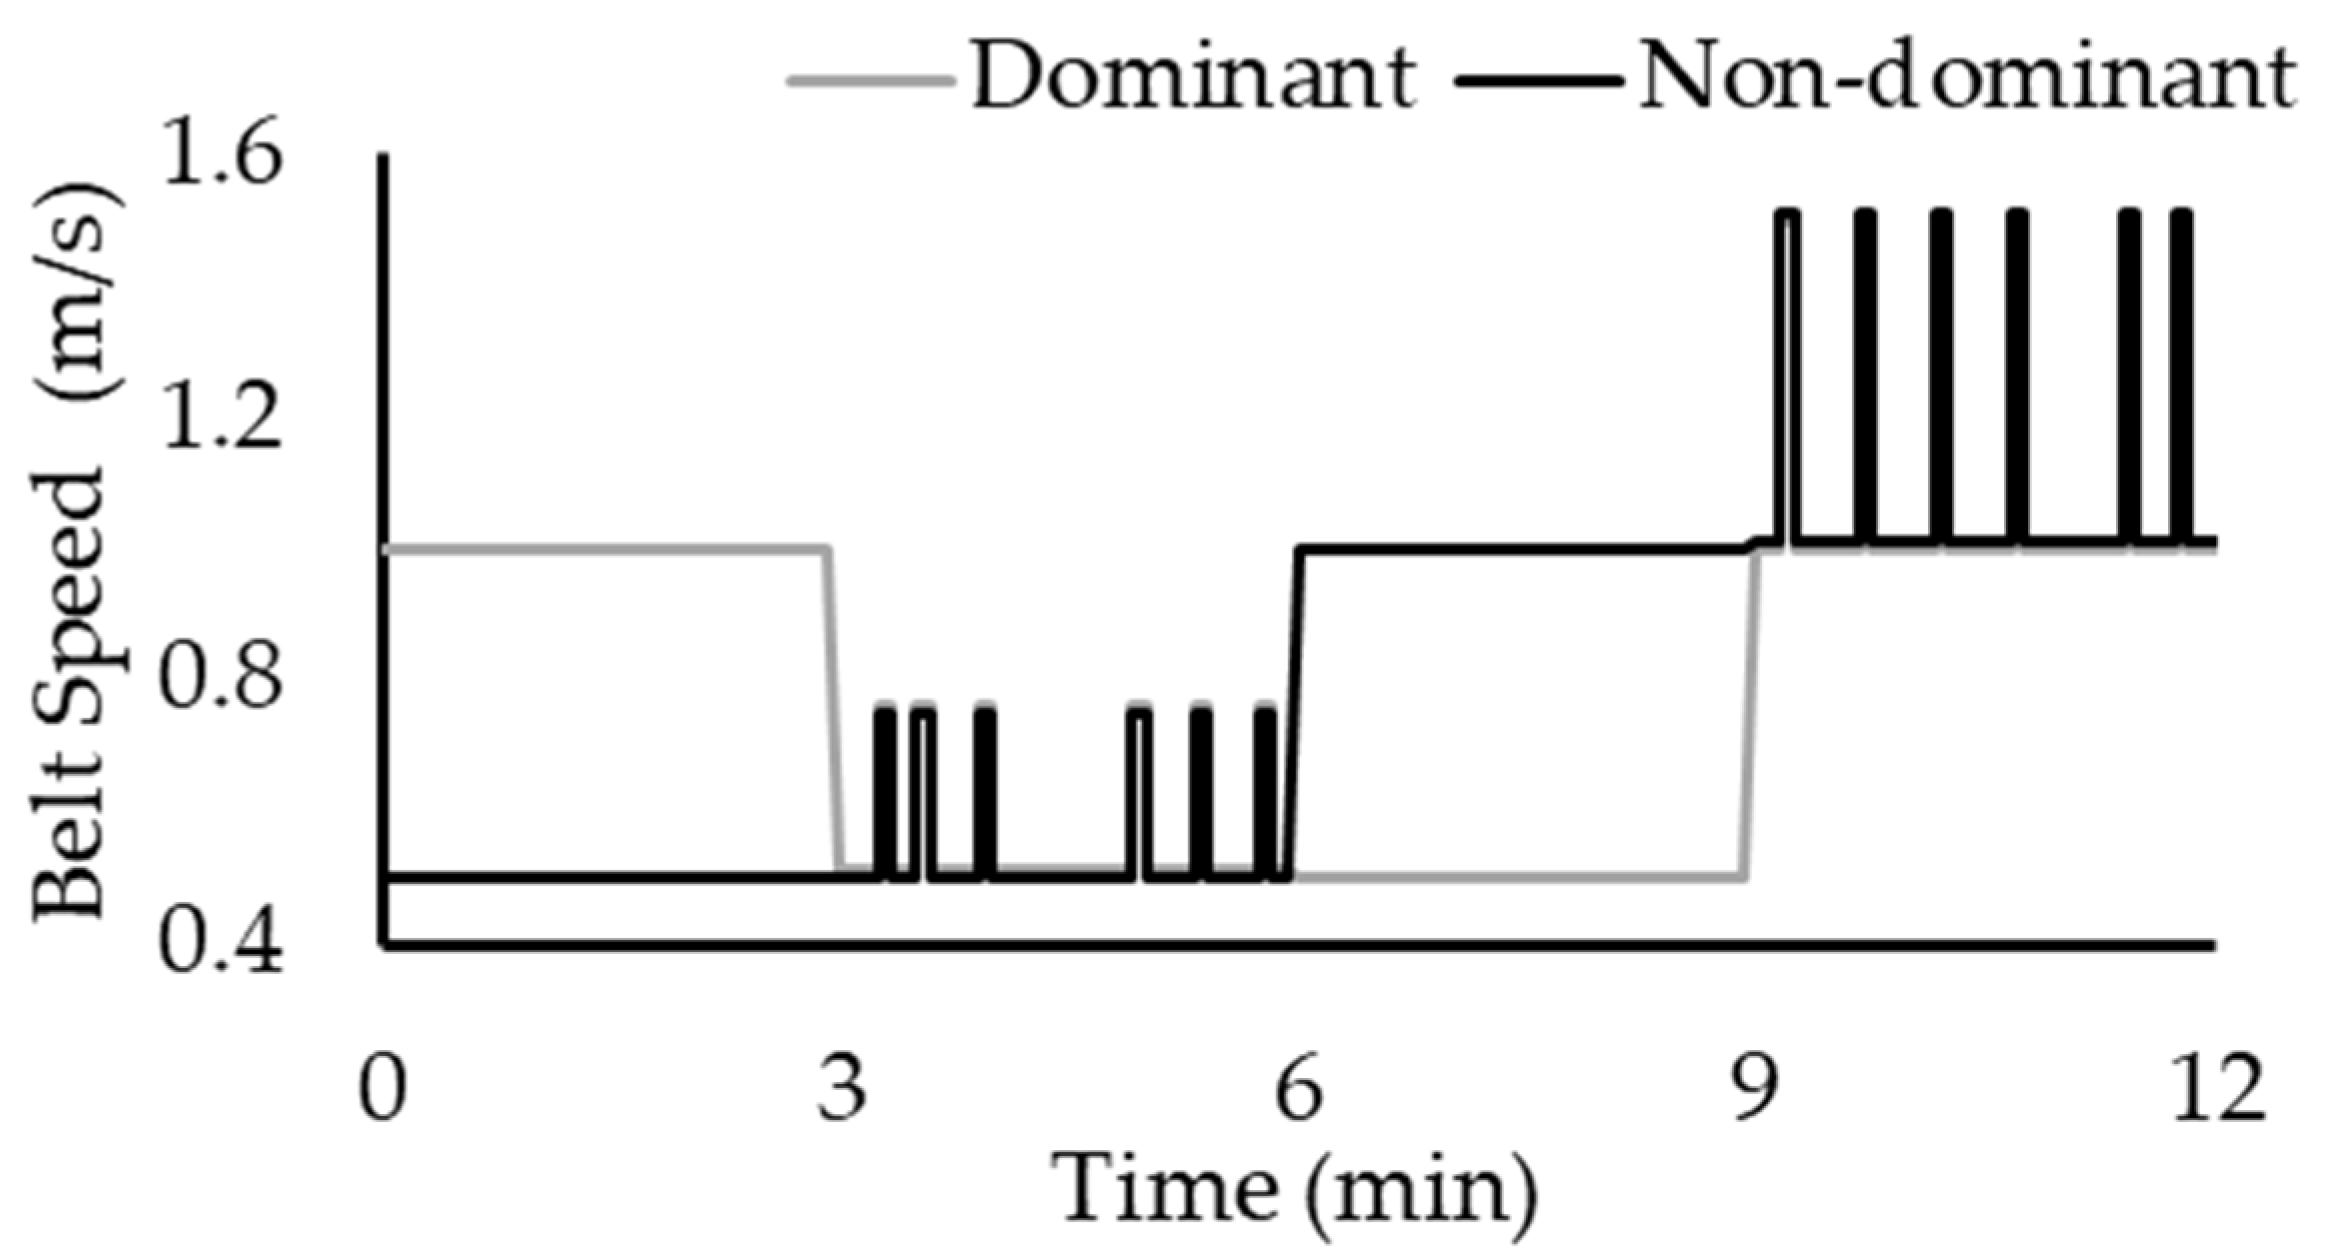
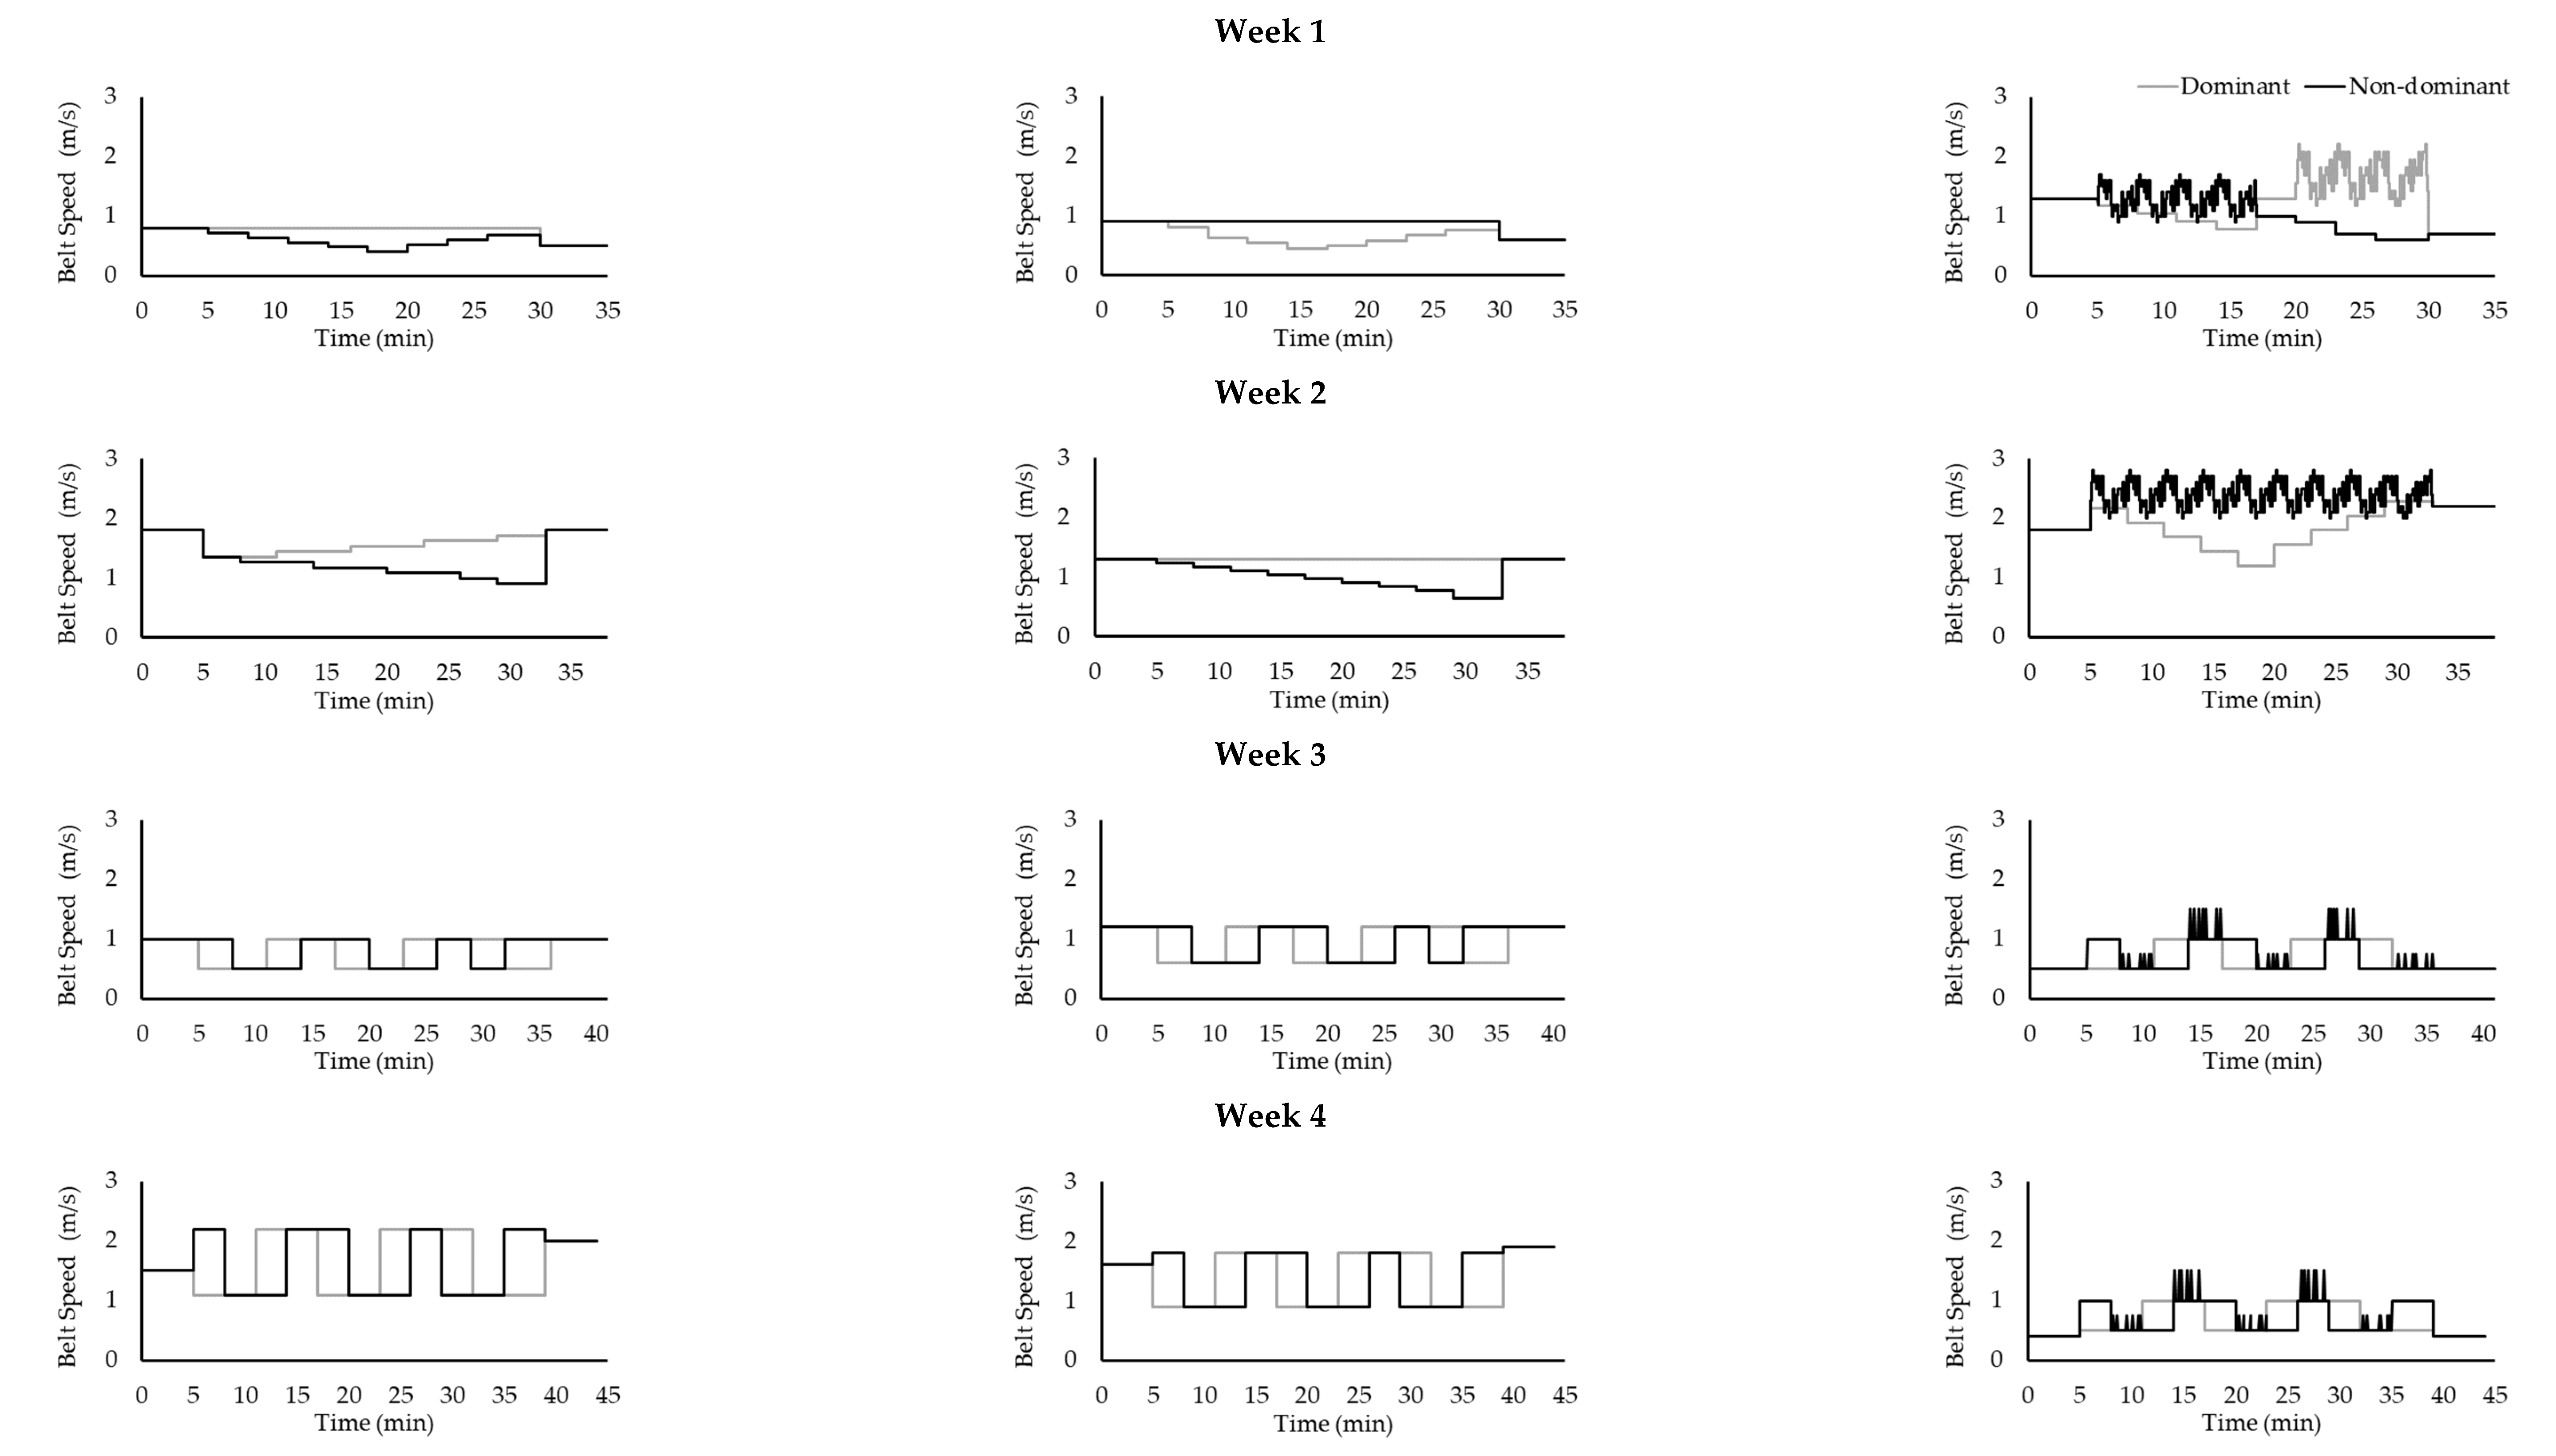
2.5. Intervention
2.6. Statistical Analysis
3. Results
3.1. Participants
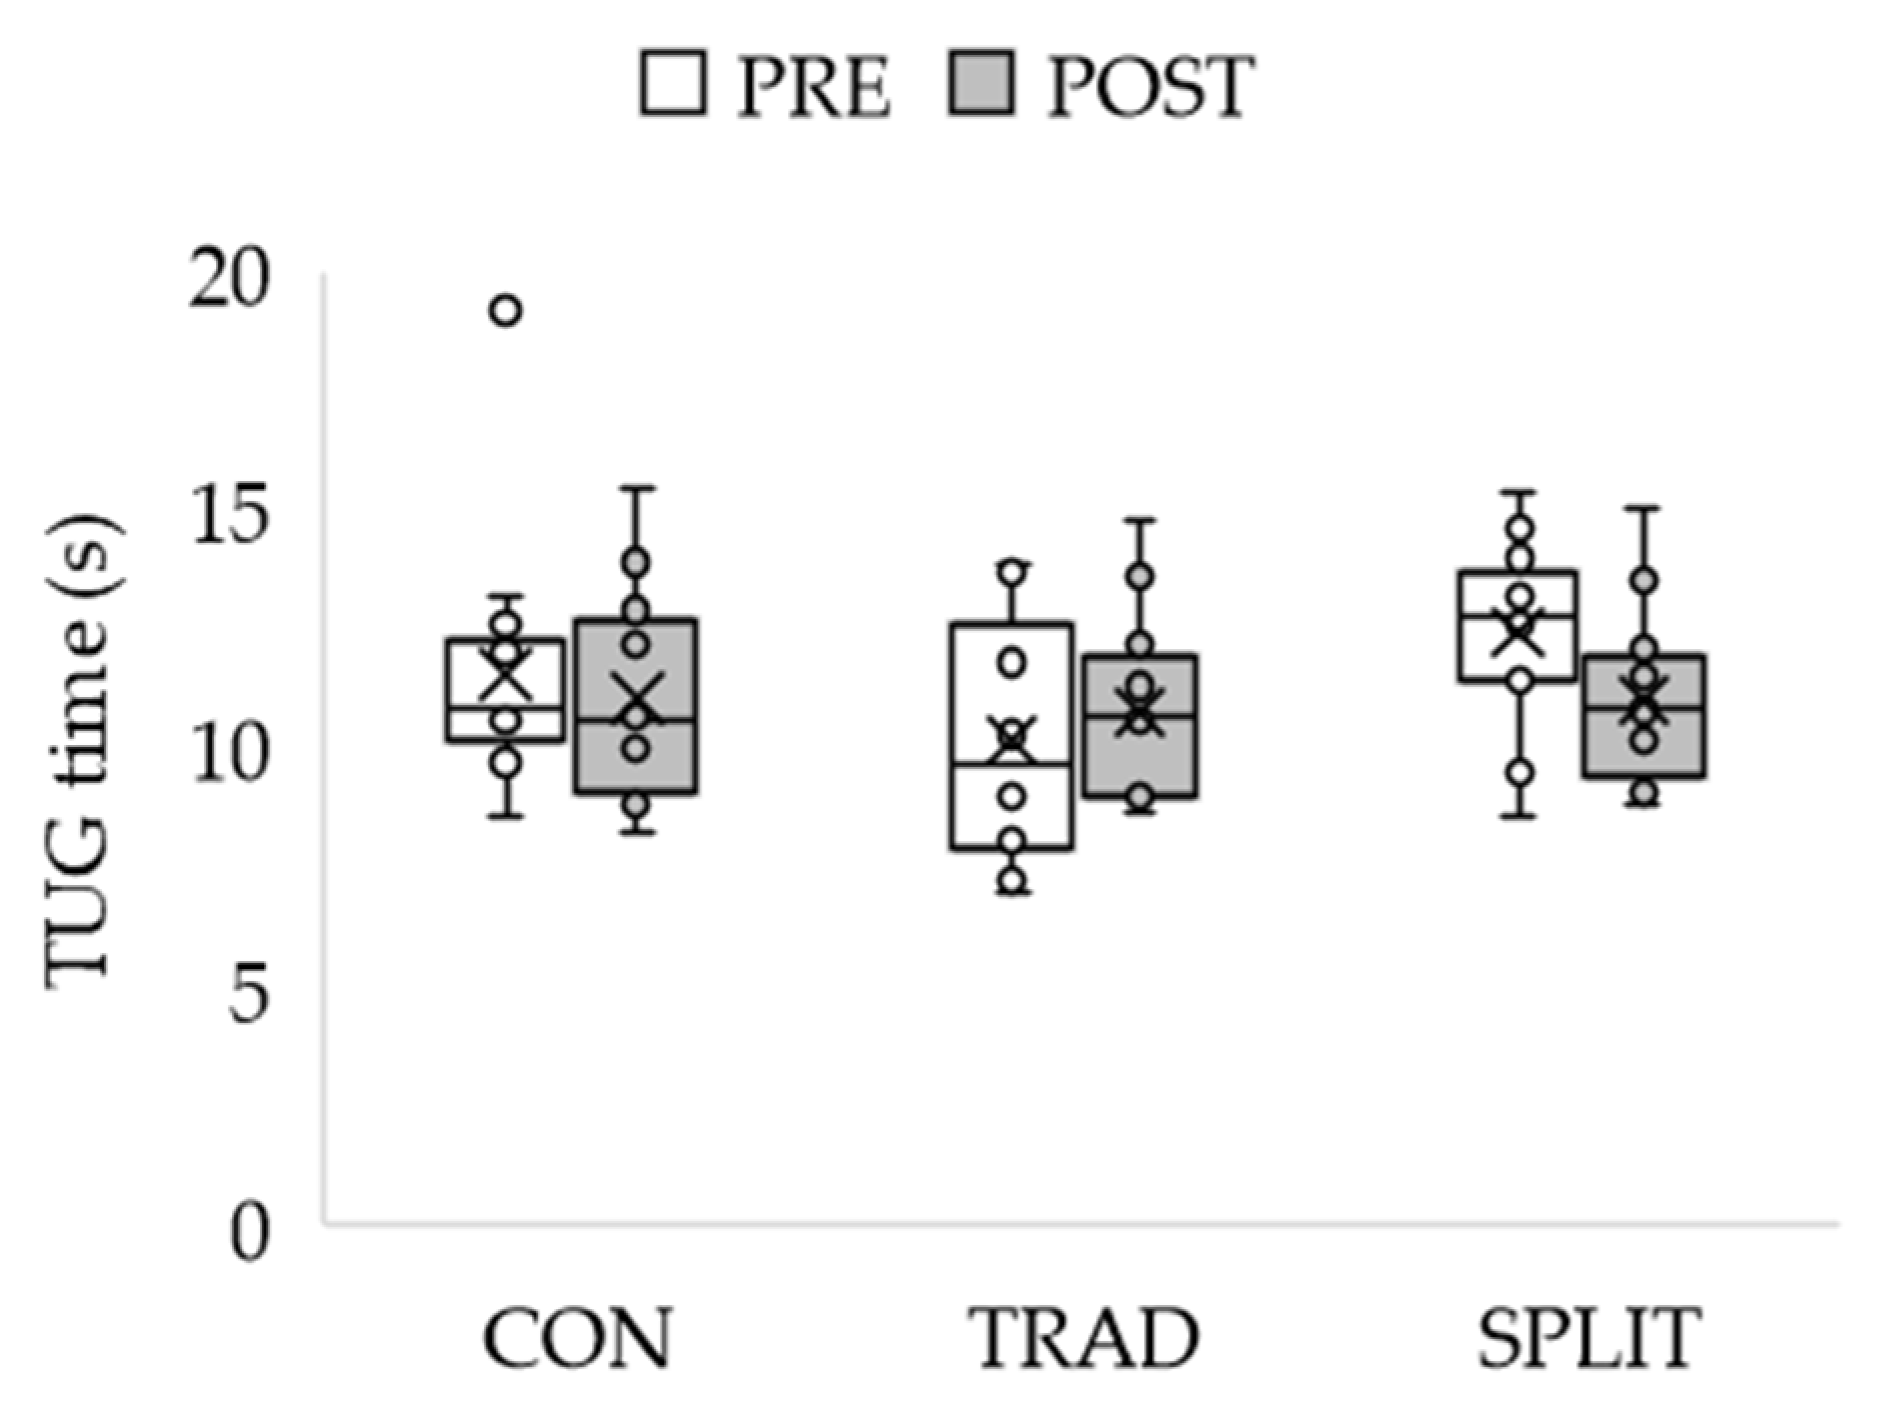
3.2. Dimension 1: Clinical Function
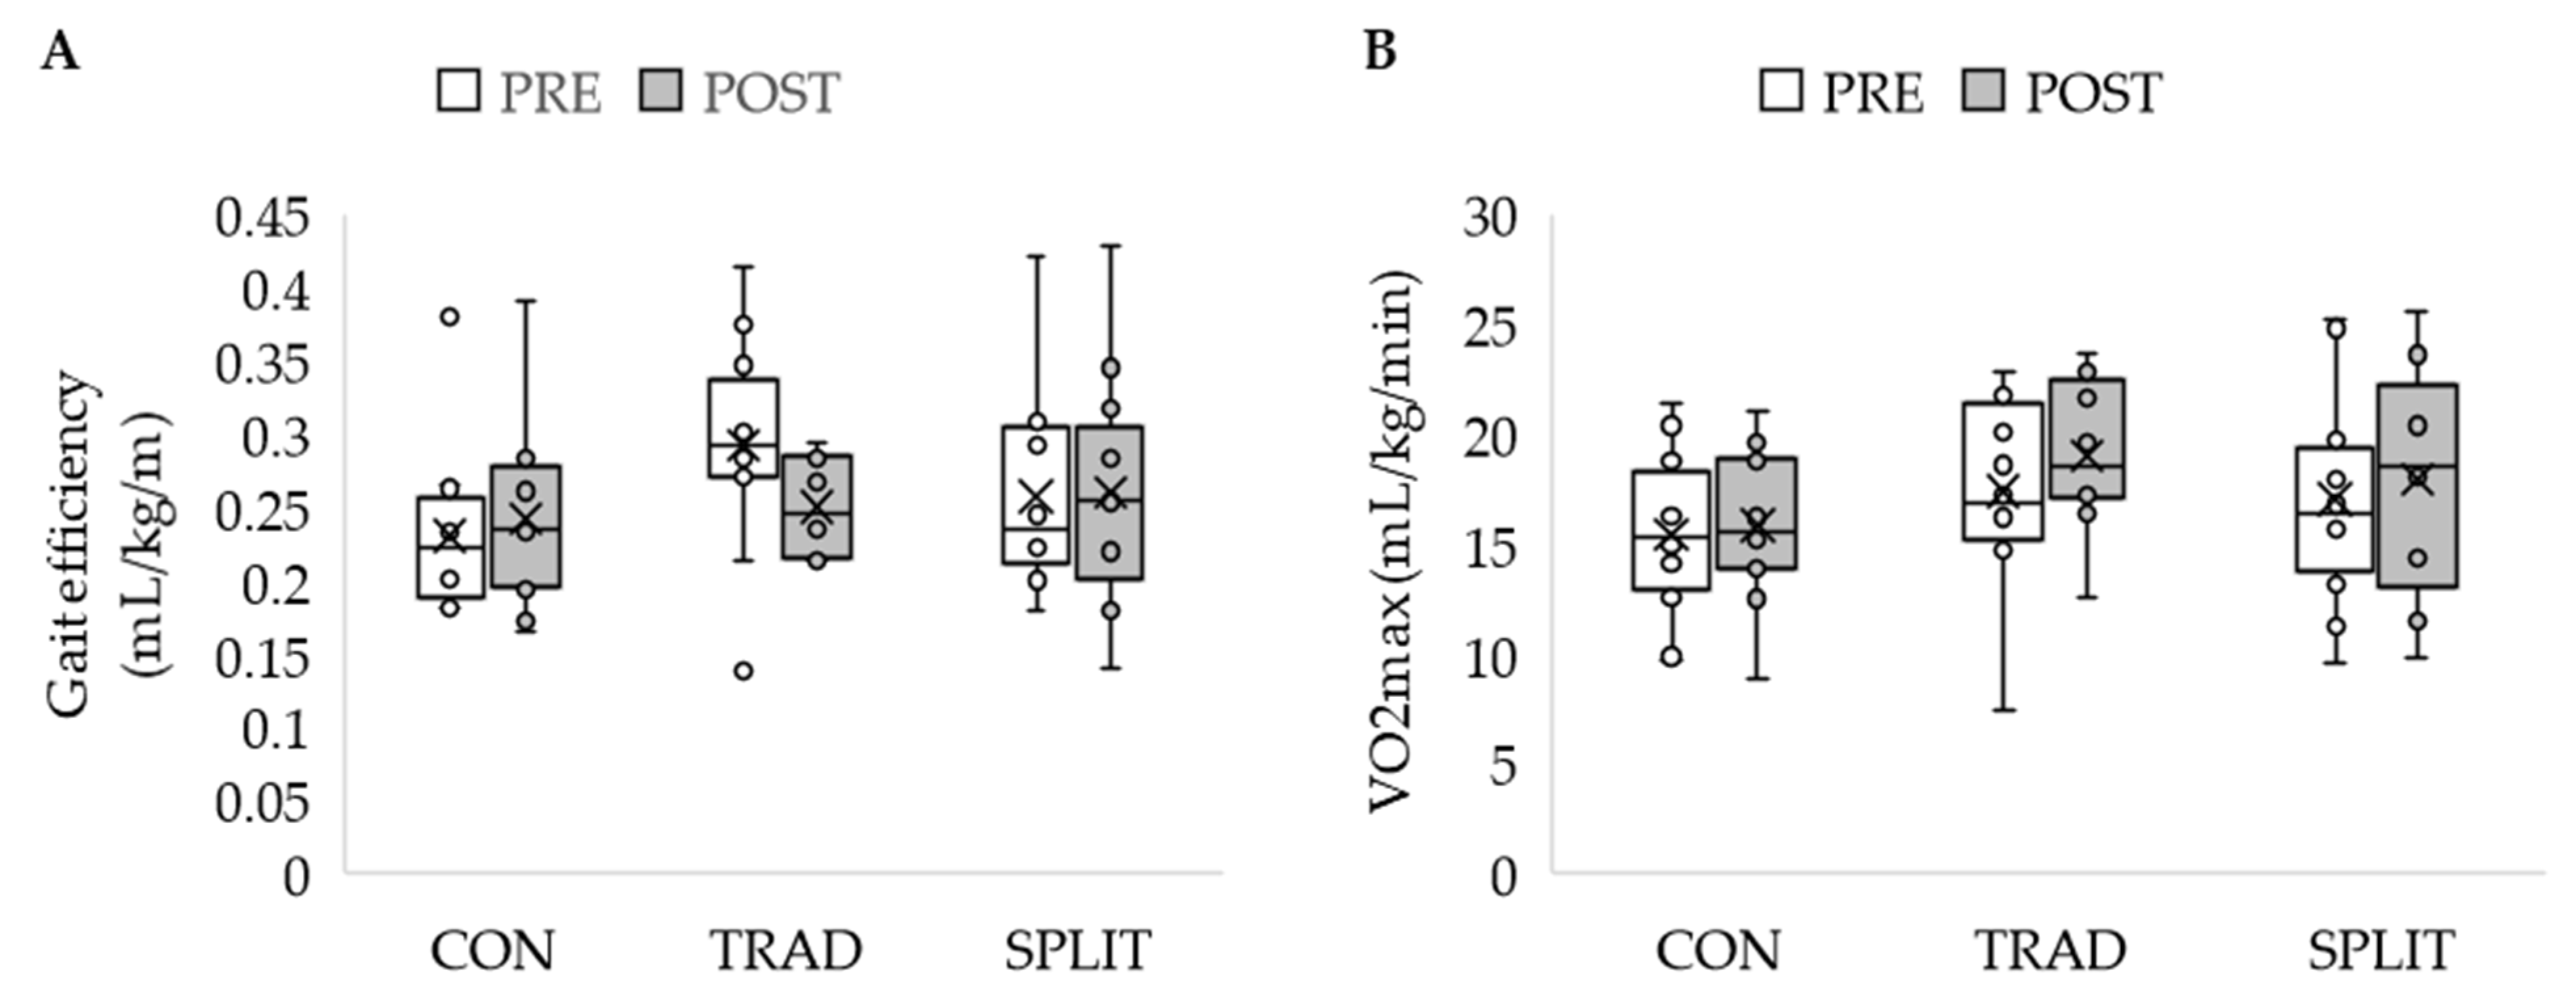
3.3. Dimension 2: Cardiovascular Fitness
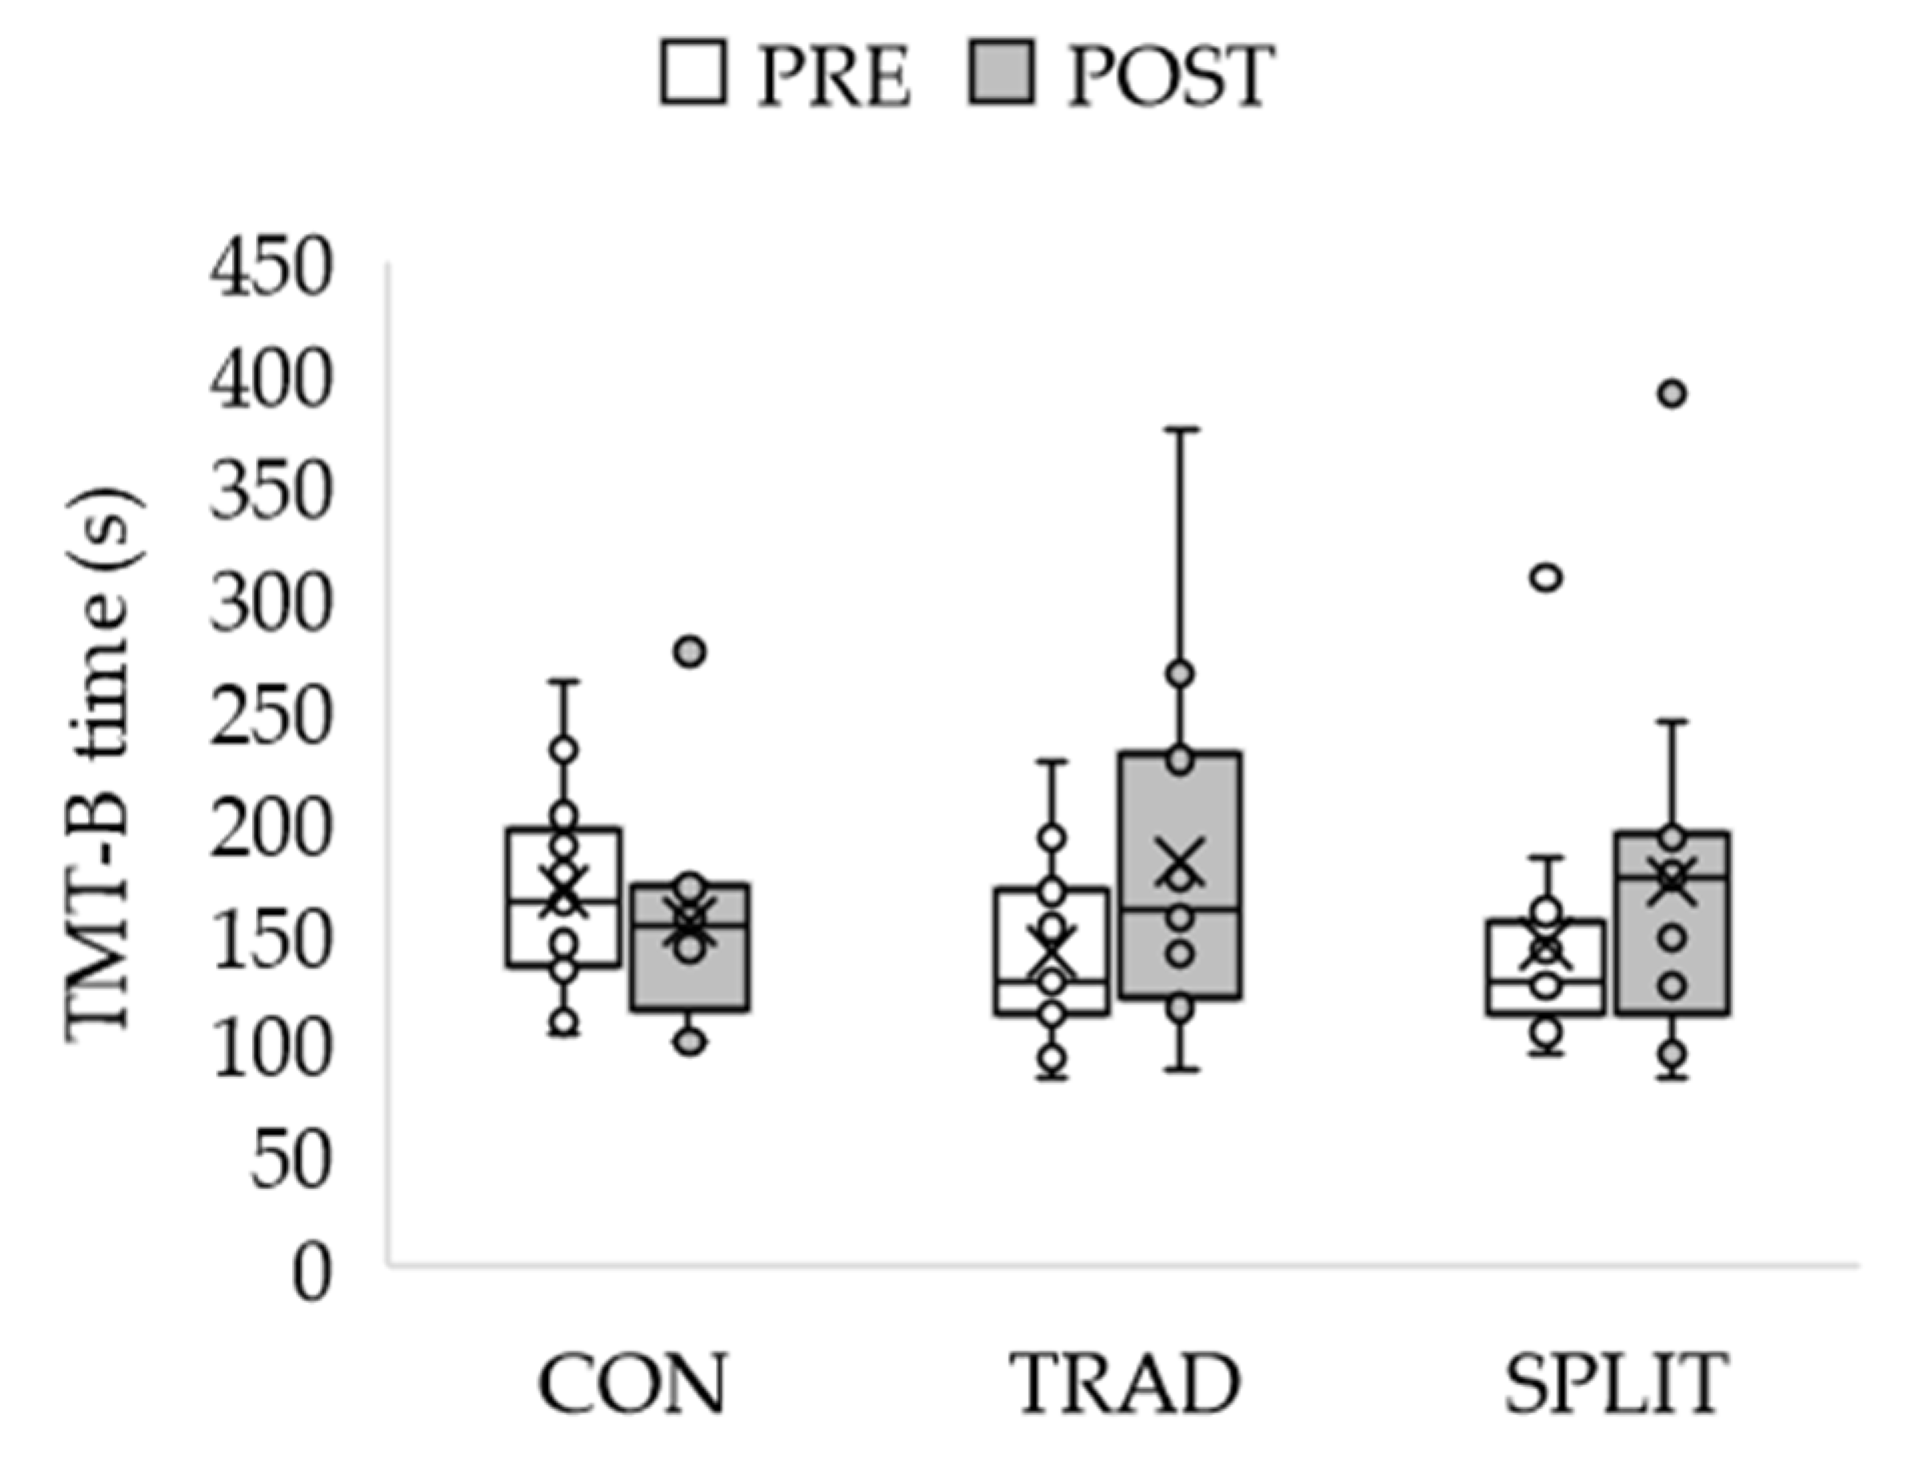
3.4. Dimension 3: Cognitive Function
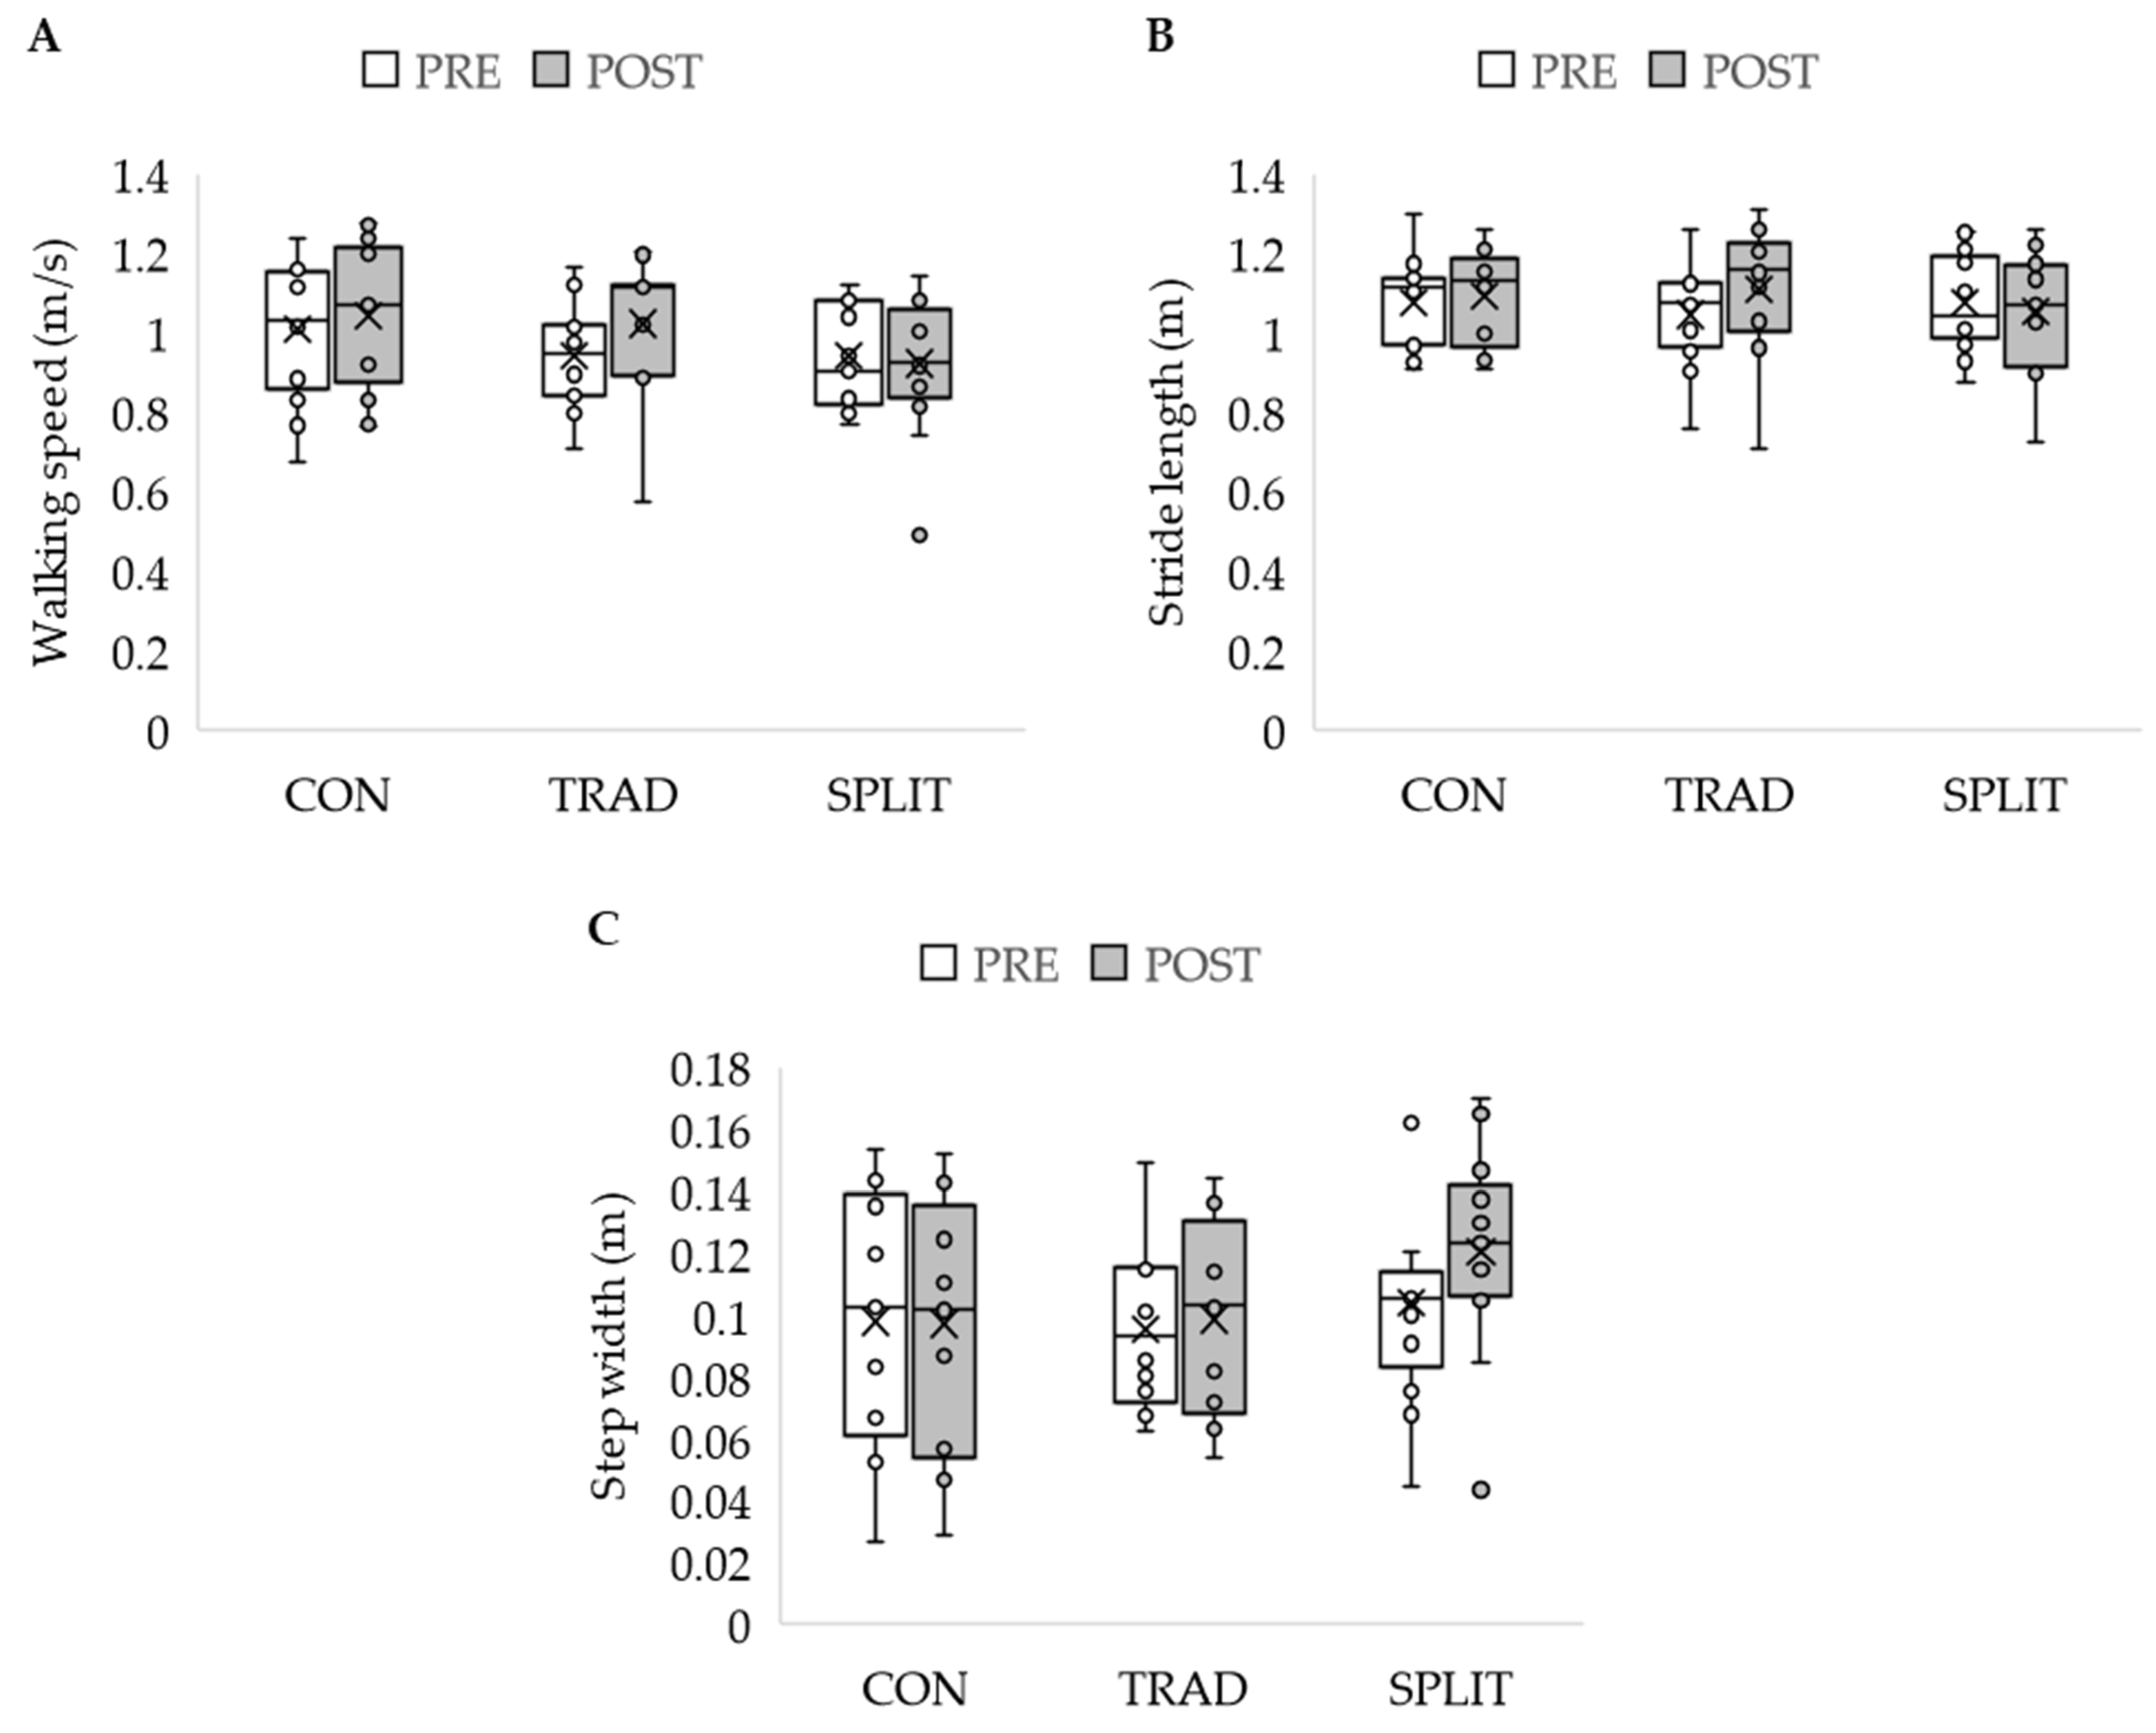
3.5. Dimension 4: Gait Parameters
3.6. Dimension 5: Gait Kinetics
4. Discussion
Author Contributions
Funding
Institutional Review Board Statement
Informed Consent Statement
Data Availability Statement
Acknowledgments
Conflicts of Interest
Appendix A

Appendix B. Participant Drop-Out
- 5 participants reported an unrelated health issue;
- 1 participant had a cardiac event approximately halfway through the study;
- 10 participants reported that the time commitment was too much;
- 2 participants moved away from the area.
- 1 participant reported the time commitment was too much.
- 1 participant was withdrawn due to starting exercising regularly.
- 2 participants dropped out before training began;
- 5 participants dropped out in the first quarter (Weeks 1–4);
- 6 participants dropped out in the second quarter (Weeks 5–8);
- 4 participants drooped out in the third quarter (Weeks 9–12);
- 1 participant dropped out in the fourth quarter (Weeks 13–16).
- 1 participant dropped out at week 5.
- 1 participant was withdrawn at week 12.
Appendix C

| Measure | Group | Time | Mean ± SE |
|---|---|---|---|
| Short Physical Performance Battery Score (SPPB; maximum possible score: 12) | Control | Pre | 8.9 ± 0.4 |
| Post | 8.5 ± 0.6 | ||
| Traditional | Pre | 8.4 ± 0.5 | |
| Post | 9.3 ± 0.6 | ||
| Split-belt | Pre | 9.1 ± 0.4 | |
| Post | 8.8 ± 0.6 | ||
| Dynamic Gait Index (DGI; maximum possible score: 24) | Control | Pre | 20.1 ± 0.6 |
| Post | 21.3 ± 0.6 | ||
| Traditional | Pre | 21.2 ± 0.7 | |
| Post | 21.4 ± 0.7 | ||
| Split-belt | Pre | 20.5 ± 0.6 | |
| Post | 21.6 ± 0.6 | ||
| Timed Up and Go (TUG; s) | Control | Pre | 11.6 ± 0.7 |
| Post | 11.1 ± 0.6 | ||
| Traditional | Pre | 10.5 ± 0.8 | |
| Post | 11.2 ± 0.7 | ||
| Split-belt | Pre | 12.2 ± 1.0 * | |
| Post | 10.9 ± 0.6 * |
Appendix D
| Measure | Group | Time | Mean ± SE |
|---|---|---|---|
| Maximal Oxygen Uptake (mL/kg/min) † | Control | Pre | 15.2 ± 1.3 |
| Post | 15.5 ± 1.2 | ||
| Traditional | Pre | 17.4 ± 1.2 * | |
| Post | 19.0 ± 1.2 * | ||
| Split-belt | Pre | 17.0 ± 1.2 | |
| Post | 18.2 ± 1.2 | ||
| Heart Rate (bpm) | Control | Pre | 128.9 ± 4.4 |
| Post | 126.1 ± 4.7 | ||
| Traditional | Pre | 141.5 ± 4.2 | |
| Post | 143.5 ± 4.5 | ||
| Split-belt | Pre | 132.5 ± 4.2 | |
| Post | 133.6 ± 4.5 | ||
| Rating of Perceived Exertion (maximum possible score: 20) | Control | Pre | 15 ± 1 |
| Post | 15 ± 1 | ||
| Traditional | Pre | 14 ± 1 | |
| Post | 14 ± 1 | ||
| Split-belt | Pre | 15 ± 1 | |
| Post | 15 ± 1 | ||
| Gait Efficiency (mL/kg/m) | Control | Pre | 0.23 ± 0.02 |
| Post | 0.24 ± 0.02 | ||
| Traditional | Pre | 0.29 ± 0.02 * | |
| Post | 0.25 ± 0.02 * | ||
| Split-belt | Pre | 0.26 ± 0.02 | |
| Post | 0.27 ± 0.02 |
Appendix E
| Measure | Group | Time | Mean ± SE |
|---|---|---|---|
| Mini-Mental State Exam (maximum possible score: 30) | Control | Pre | 27.7 ± 0.5 |
| Post | 27.3 ± 0.5 | ||
| Traditional | Pre | 28.1 ± 0.5 | |
| Post | 28.0 ± 0.5 | ||
| Split-belt | Pre | 27.8 ± 0.5 | |
| Post | 27.8 ± 0.5 | ||
| Trail Making Test-A (s) † | Control | Pre | 106.2 ± 7.5 |
| Post | 106.2 ± 7.8 | ||
| Traditional | Pre | 98.9 ± 7.8 | |
| Post | 106.9 ± 8.1 | ||
| Split-belt | Pre | 101.9 ± 7.2 | |
| Post | 104.3 ± 7.5 | ||
| Trail Making Test-B (s) † | Control | Pre | 159.8 ± 13.2 |
| Post | 154.3 ± 20.7 | ||
| Traditional | Pre | 140.9 ± 13.8 | |
| Post | 177.3 ± 21.6 | ||
| Split-belt | Pre | 144.6 ± 12.7 | |
| Post | 172.3 ± 19.9 | ||
| Difference between Trail Making Test-B and Trail Making Test-A (dTMT, B-A) (s) | Control | Pre | 53.6 ± 9.7 |
| Post | 48.0 ± 17.8 | ||
| Traditional | Pre | 42.1 ± 10.1 | |
| Post | 70.3 ± 18.6 | ||
| Split-belt | Pre | 42.6 ± 9.3 | |
| Post | 67.9 ± 17.1 |
Appendix F
| Measure | Group | Time | Mean ± SE |
|---|---|---|---|
| Peak Ankle Plantarflexion Moment (Nm) | Control | Pre | 37.2 ± 13.5 |
| Post | 41.1 ± 9.0 | ||
| Traditional | Pre | 74.8 ± 13.5 | |
| Post | 61.4 ± 9.0 | ||
| Split-belt | Pre | 44.4 ± 11.0 | |
| Post | 43.7 ± 7.3 | ||
| Peak Eccentric Ankle Plantar Flexor Power (W/kg) | Control | Pre | 0.22 ± 0.04 |
| Post | 0.14 ± 0.04 | ||
| Traditional | Pre | 0.15 ± 0.04 | |
| Post | 0.15 ± 0.04 | ||
| Split-belt | Pre | 0.17 ± 0.03 | |
| Post | 0.23 ± 0.04 | ||
| Peak Concentric Hip Flexor Power (W/kg) | Control | Pre | 0.34 ± 0.07 |
| Post | 0.19 ± 0.04 | ||
| Traditional | Pre | 0.21 ± 0.07 | |
| Post | 0.26 ± 0.04 | ||
| Split-belt | Pre | 0.33 ± 0.06 | |
| Post | 0.36 ± 0.03 |
Appendix G. Responders vs. Non-Responders to the Intervention
- Both traditional treadmill and split-belt together (total n = 25, responders n = 8, non-responders n = 17);
- Traditional treadmill only (total n = 12, responders n = 6, non-responders n = 6);
- Split-belt treadmill only (total n = 13, responders n = 11, non-responders n = 2).
| Measure | Combined Groups | Traditional Treadmill | Split-belt Treadmill | ||||||||||
| n | Mean ± SE | U | p-Value | n | Mean ± SE | U | p-Value | n | Mean ± SE | U | p-Value | ||
| Change in Walking Speed (m/s) | NR | 17 | −0.03 ± 0.02 | 136 | <0.001 | 6 | −0.01 ± 0.03 | 36 | 0.002 | 11 | −0.04 ± 0.03 | 22 | 0.026 |
| R | 8 | 0.16 ± 0.03 | 6 | 0.17 ± 0.04 | 2 | 0.12 ± 0.03 | |||||||
| Age (years) | NR | 17 | 71 ± 1 | 78.5 | 0.549 | 6 | 73 ± 2 | 16 | 0.818 | 11 | 70 ± 1 | 12.5 | 0.769 |
| R | 8 | 72 ± 2 | 6 | 72 ± 2 | 2 | 72 ± 6 | |||||||
| Mass (kg) | NR | 17 | 97 ± 6 | 47 | 0.238 | 6 | 94 ± 5 | 12 | 0.394 | 11 | 98 ± 9 | 5 | 0.308 |
| R | 8 | 84 ± 5 | 6 | 87 ± 6 | 2 | 77 ± 9 | |||||||
| Height (m) | NR | 17 | 1.66 ± 0.02 | 60 | 0.669 | 6 | 1.66 ± 0.01 | 18 | 1.000 | 11 | 1.66 ± 0.03 | 8 | 0.641 |
| R | 8 | 1.64 ± 0.03 | 6 | 1.65 ± 0.04 | 2 | 1.62 ± 0.05 | |||||||
| Short Physical Performance Battery | NR | 17 | 9 ± 0 | 52.5 | 0.374 | 6 | 9 ± 1 | 21.5 | 0.589 | 11 | 9 ± 0 | 4.5 | 0.231 |
| R | 8 | 9 ± 0 | 6 | 9 ± 0 | 2 | 8 ± 1 | |||||||
| Dynamic Gait Index | NR | 17 | 21 ± 0 | 85 | 0.344 | 6 | 21 ± 1 | 23 | 0.485 | 11 | 21 ± 0 | 5.5 | 0.308 |
| R | 8 | 21 ± 1 | 6 | 22 ± 1 | 2 | 19 ± 3 | |||||||
| Timed Up and Go (s) | NR | 17 | 11.6 ± 0.6 | 42 | 0.562 | 6 | 10.3 ± 1.1 | 11 | 0.914 | 11 | 12.4 ± 0.6 | 10 | 0.923 |
| R | 6 | 10.9 ± 1.1 | 4 | 10.0 ± 1.4 | 2 | 17.7 ± 0.1 | |||||||
| Maximal Oxygen Uptake (mL/kg/min) | NR | 17 | 17.18 ± 1.29 | 60.5 | 0.834 | 6 | 17.05 ± 2.32 | 17.5 | 0.937 | 10 | 17.26 ± 1.63 | 7 | 0.606 |
| R | 8 | 17.31 ± 0.85 | 6 | 17.78 ± 1.07 | 2 | 15.9 ± 0.20 | |||||||
| Gait Efficiency (mL/kg/m) | NR | 17 | 0.27 ± 0.02 | 67.5 | 0.834 | 6 | 0.29 ± 0.04 | 15.5 | 0.699 | 10 | 0.26 ± 0.02 | 8 | 0.758 |
| R | 8 | 0.28 ± 0.02 | 6 | 0.29 ± 0.02 | 2 | 0.25 ± 0.05 | |||||||
| Mini-Mental State Exam | NR | 17 | 28 ± 0 | 53 | 0.406 | 6 | 29 ± 1 | 8.5 | 0.132 | 11 | 28 ± 0 | 12.5 | 0.769 |
| R | 8 | 28 ± 1 | 6 | 27 ± 1 | 2 | 28 ± 2 | |||||||
| Walking Speed (m/s) | NR | 17 | 0.96 ± 0.03 | 52 | 0.374 | 6 | 0.96 ± 0.07 | 16 | 0.818 | 11 | 0.96 ± 0.04 | 6 | 0.410 |
| R | 8 | 0.91 ± 0.04 | 6 | 0.93 ± 0.04 | 2 | 0.86 ± 0.09 | |||||||
| Stride Length (m) | NR | 17 | 1.06 ± 0.03 | 65 | 0.887 | 6 | 1.04 ± 0.07 | 19 | 1.000 | 11 | 1.08 ± 0.04 | 9 | 0.769 |
| R | 8 | 1.06 ± 0.03 | 6 | 1.06 ± 0.04 | 2 | 1.06 ± 0.05 | |||||||
| Stride Time (s) | NR | 17 | 1.12 ± 0.02 | 85 | 0.344 | 6 | 1.09 ± 0.03 | 23 | 0.485 | 11 | 1.14 ± 0.03 | 19 | 0.154 |
| R | 8 | 1.17 ± 0.03 | 6 | 1.14 ± 0.02 | 2 | 1.24 ± 0.07 | |||||||
| Stride Length Variability (m) | NR | 17 | 0.04 ± 0.01 | 94 | 0.140 | 6 | 0.04 ± 0 | 22 | 0.589 | 11 | 0.05 ± 0.01 | 20 | 0.103 |
| R | 8 | 0.05 ± 0 | 6 | 0.04 ± 0 | 2 | 0.05 ± 0.00 | |||||||
| Stride Time Variability (s) | NR | 17 | 0.04 ± 0.01 | 76 | 0.669 | 6 | 0.03 ± 0 | 17 | 0.937 | 11 | 0.04 ± 0.01 | 16 | 0.410 |
| R | 8 | 0.04 ± 0.01 | 6 | 0.03 ± 0 | 2 | 0.05 ± 0.02 | |||||||
| Bolding indicates significance at p < 0.05. | |||||||||||||
References
- Middleton, A.; Fritz, S.L.; Lusardi, M. Walking Speed: The Functional Vital Sign. J. Aging Phys. Act. 2015, 23, 314–322. [Google Scholar] [CrossRef]
- Cesari, M.; Kritchevsky, S.B.; Penninx, B.W.H.J.; Nicklas, B.J.; Simonsick, E.M.; Newman, A.B.; Tylavsky, F.A.; Brach, J.S.; Satterfield, S.; Bauer, D.C.; et al. Prognostic Value of Usual Gait Speed in Well-Functioning Older People—Results from the Health, Aging and Body Composition Study. J. Am. Geriatr. Soc. 2005, 53, 1675–1680. [Google Scholar] [CrossRef] [Green Version]
- Studenski, S. Gait Speed and Survival in Older Adults. JAMA 2011, 305, 50. [Google Scholar] [CrossRef] [Green Version]
- Potter, J.M.; Evans, A.L.; Duncan, G. Gait Speed and Activities of Daily Living Function in Geriatric Patients. Arch. Phys. Med. Rehabil. 1995, 76, 997–999. [Google Scholar] [CrossRef]
- Makizako, H.; Shimada, H.; Doi, T.; Tsutsumimoto, K.; Lee, S.; Hotta, R.; Nakakubo, S.; Harada, K.; Lee, S.; Bae, S.; et al. Cognitive Functioning and Walking Speed in Older Adults as Predictors of Limitations in Self-Reported Instrumental Activity of Daily Living: Prospective Findings from the Obu Study of Health Promotion for the Elderly. Int. J. Environ. Res. Public. Health 2015, 12, 3002–3013. [Google Scholar] [CrossRef] [PubMed] [Green Version]
- Ekström, H.; Dahlin-Ivanoff, S.; Elmståhl, S. Effects of Walking Speed and Results of Timed Get-Up-and-Go Tests on Quality of Life and Social Participation in Elderly Individuals With a History of Osteoporosis-Related Fractures. J. Aging Health 2011, 23, 1379–1399. [Google Scholar] [CrossRef]
- Kohn, C.G.; Baker, W.L.; Sidovar, M.F.; Coleman, C.I. Walking Speed and Health-Related Quality of Life in Multiple Sclerosis. Patient-Patient-Centered Outcomes Res. 2014, 7, 55–61. [Google Scholar] [CrossRef]
- Soumare, A.; Tavernier, B.; Alperovitch, A.; Tzourio, C.; Elbaz, A. A Cross-Sectional and Longitudinal Study of the Relationship Between Walking Speed and Cognitive Function in Community-Dwelling Elderly People. J. Gerontol. A Biol. Sci. Med. Sci. 2009, 64A, 1058–1065. [Google Scholar] [CrossRef] [Green Version]
- McGough, E.L.; Kelly, V.E.; Logsdon, R.G.; McCurry, S.M.; Cochrane, B.B.; Engel, J.M.; Teri, L. Associations Between Physical Performance and Executive Function in Older Adults With Mild Cognitive Impairment: Gait Speed and the Timed “Up & Go” Test. Phys. Ther. 2011, 91, 1198–1207. [Google Scholar] [CrossRef]
- Watson, N.L.; Rosano, C.; Boudreau, R.M.; Simonsick, E.M.; Ferrucci, L.; Sutton-Tyrrell, K.; Hardy, S.E.; Atkinson, H.H.; Yaffe, K.; Satterfield, S.; et al. Executive Function, Memory, and Gait Speed Decline in Well-Functioning Older Adults. J. Gerontol. A Biol. Sci. Med. Sci. 2010, 65A, 1093–1100. [Google Scholar] [CrossRef] [Green Version]
- Rosano, C.; Newman, A.B.; Katz, R.; Hirsch, C.H.; Kuller, L.H. Association Between Lower Digit Symbol Substitution Test Score and Slower Gait and Greater Risk of Mortality and of Developing Incident Disability in Well-Functioning Older Adults: DSST SCORE, MORTALITY, AND DISABILITY. J. Am. Geriatr. Soc. 2008, 56, 1618–1625. [Google Scholar] [CrossRef] [PubMed]
- Kramer, A.F.; Hahn, S.; Cohen, N.J.; Banich, M.T.; McAuley, E.; Harrison, C.R.; Chason, J.; Vakil, E.; Bardell, L.; Boileau, R.A.; et al. Ageing, Fitness and Neurocognitive Function. Nature 1999, 400, 418–419. [Google Scholar] [CrossRef] [PubMed]
- Pahor, M.; Guralnik, J.M.; Ambrosius, W.T.; Blair, S.; Bonds, D.E.; Church, T.S.; Espeland, M.A.; Fielding, R.A.; Gill, T.M.; Groessl, E.J.; et al. Effect of Structured Physical Activity on Prevention of Major Mobility Disability in Older Adults: The LIFE Study Randomized Clinical Trial. JAMA 2014, 311, 2387. [Google Scholar] [CrossRef] [PubMed]
- Pahor, M.; Blair, S.; Espeland, M.A.; Fielding, R.A.; Gill, T.M.; Guralnik, J.M.; Hadley, E.C.; King, A.C.; Kritchevsky, S.; Maraldi, C.; et al. Effects of a Physical Activity Intervention on Measures of Physical Performance: Results of the Lifestyle Interventions and Independence for Elders Pilot (LIFE-P) Study. J. Gerontol. A Biol. Sci. Med. Sci. 2006, 61, 1157–1165. [Google Scholar] [CrossRef] [Green Version]
- Balasubramanian, C.K.; Clark, D.J.; Fox, E.J. Walking Adaptability after a Stroke and Its Assessment in Clinical Settings. Stroke Res. Treat. 2014, 2014, 591013. [Google Scholar] [CrossRef] [Green Version]
- McFadyen, B.J.; Hegeman, J.; Duysens, J. Dual Task Effects for Asymmetric Stepping on a Split-Belt Treadmill. Gait Posture 2009, 30, 340–344. [Google Scholar] [CrossRef]
- Sawers, A.; Kelly, V.E.; Hahn, M.E. Effects of Gradual Versus Sudden Training on the Cognitive Demand Required While Learning a Novel Locomotor Task. J. Mot. Behav. 2013, 45, 405–414. [Google Scholar] [CrossRef]
- Lee, B.-C.; Martin, B.J.; Thrasher, T.A.; Layne, C.S. A New Fall-Inducing Technology Platform: Development and Assessment of a Programmable Split-Belt Treadmill. In Proceedings of the 2017 39th Annual International Conference of the IEEE Engineering in Medicine and Biology Society (EMBC), Jeju Island, Korea, 11–15 July 2017; IEEE: Seogwipo, Korea, 2017; pp. 3777–3780. [Google Scholar]
- Lee, B.-C.; Kim, C.-S.; Seo, K.-H. The Body’s Compensatory Responses to Unpredictable Trip and Slip Perturbations Induced by a Programmable Split-Belt Treadmill. IEEE Trans. Neural Syst. Rehabil. Eng. 2019, 27, 1389–1396. [Google Scholar] [CrossRef]
- Schmidt, R.A.; Lee, T. Motor Control and Learning: A Behavioral Emphasis; Human Kinetics: Champaign, IL, USA, 1999; ISBN 0-880011-484-3. [Google Scholar]
- Sato, S.; Choi, J.T. Neural Control of Human Locomotor Adaptation: Lessons about Changes with Aging. Neuroscientist 2021, 107385842110137. [Google Scholar] [CrossRef]
- Pham, M.H.; Elshehabi, M.; Haertner, L.; Del Din, S.; Srulijes, K.; Heger, T.; Synofzik, M.; Hobert, M.A.; Faber, G.S.; Hansen, C.; et al. Validation of a Step Detection Algorithm during Straight Walking and Turning in Patients with Parkinson’s Disease and Older Adults Using an Inertial Measurement Unit at the Lower Back. Front. Neurol. 2017, 8, 457. [Google Scholar] [CrossRef] [Green Version]
- Thompson, C.K. Complexity in Language Learning and Treatment. Am. J. Speech Lang. Pathol. 2007, 16, 3–5. [Google Scholar] [CrossRef]
- Kleim, J.A.; Barbay, S.; Cooper, N.R.; Hogg, T.M.; Reidel, C.N.; Remple, M.S.; Nudo, R.J. Motor Learning-Dependent Synaptogenesis Is Localized to Functionally Reorganized Motor Cortex. Neurobiol. Learn. Mem. 2002, 77, 63–77. [Google Scholar] [CrossRef] [PubMed] [Green Version]
- Nudo, R.J.; Wise, B.M.; SiFuentes, F.; Milliken, G.W. Neural Substrates for the Effects of Rehabilitative Training on Motor Recovery After Ischemic Infarct. Science 1996, 272, 1791–1794. [Google Scholar] [CrossRef] [PubMed] [Green Version]
- Segal, M.; Andersen, P. Dendritic Spines Shaped by Synaptic Activity. Curr. Opin. Neurobiol. 2000, 10, 582–586. [Google Scholar] [CrossRef]
- Reisman, D.S.; Bastian, A.J.; Morton, S.M. Neurophysiologic and Rehabilitation Insights From the Split-Belt and Other Locomotor Adaptation Paradigms. Phys. Ther. 2010, 90, 187–195. [Google Scholar] [CrossRef] [PubMed] [Green Version]
- Hinton, D.C.; Thiel, A.; Soucy, J.-P.; Bouyer, L.; Paquette, C. Adjusting Gait Step-by-Step: Brain Activation during Split-Belt Treadmill Walking. NeuroImage 2019, 202, 116095. [Google Scholar] [CrossRef] [PubMed]
- Barthélemy, D.; Grey, M.J.; Nielsen, J.B.; Bouyer, L. Chapter 12—Involvement of the Corticospinal Tract in the Control of Human Gait. In Enhancing Performance for Action and Perception; Green, A., Chapman, C.E., Kalaska, J.F., Lepore, F., Eds.; Progress in Brain Research; Elsevier: Amsterdam, The Netherlands, 2011; Volume 192, pp. 181–197. [Google Scholar]
- Clark, D.J.; Manini, T.M.; Fielding, R.A.; Patten, C. Neuromuscular Determinants of Maximum Walking Speed in Well-Functioning Older Adults. Exp. Gerontol. 2013, 48, 358–363. [Google Scholar] [CrossRef] [PubMed] [Green Version]
- Nielsen, J.B. How We Walk: Central Control of Muscle Activity during Human Walking. Neuroscientist 2003, 9, 195–204. [Google Scholar] [CrossRef]
- Kleim, J.A.; Swain, R.A.; Armstrong, K.A.; Napper, R.M.A.; Jones, T.A.; Greenough, W.T. Selective Synaptic Plasticity within the Cerebellar Cortex Following Complex Motor Skill Learning. Neurobiol. Learn. Mem. 1998, 69, 274–289. [Google Scholar] [CrossRef]
- Kleim, J.A.; Pipitone, M.A.; Czerlanis, C.; Greenough, W.T. Structural Stability within the Lateral Cerebellar Nucleus of the Rat Following Complex Motor Learning. Neurobiol. Learn. Mem. 1998, 69, 290–306. [Google Scholar] [CrossRef]
- Kleim, J.A.; Barbay, S.; Nudo, R.J. Functional Reorganization of the Rat Motor Cortex Following Motor Skill Learning. J. Neurophysiol. 1998, 80, 3321–3325. [Google Scholar] [CrossRef]
- Kleim, J.A. Cortical Synaptogenesis and Motor Map Reorganization Occur during Late, But Not Early, Phase of Motor Skill Learning. J. Neurosci. 2004, 24, 628–633. [Google Scholar] [CrossRef] [Green Version]
- Guo, C.C.; Raymond, J.L. Motor Learning Reduces Eye Movement Variability through Reweighting of Sensory Inputs. J. Neurosci. 2010, 30, 16241–16248. [Google Scholar] [CrossRef] [Green Version]
- Bastian, A.J. Understanding Sensorimotor Adaptation and Learning for Rehabilitation. Curr. Opin. Neurol. 2008, 21, 628–633. [Google Scholar] [CrossRef] [Green Version]
- Jayaram, G.; Galea, J.M.; Bastian, A.J.; Celnik, P. Human Locomotor Adaptive Learning Is Proportional to Depression of Cerebellar Excitability. Cereb. Cortex 2011, 21, 1901–1909. [Google Scholar] [CrossRef] [Green Version]
- Krienen, F.M.; Buckner, R.L. Segregated Fronto-Cerebellar Circuits Revealed by Intrinsic Functional Connectivity. Cereb. Cortex 2009, 19, 2485–2497. [Google Scholar] [CrossRef] [Green Version]
- Adkins, D.L.; Boychuk, J.; Remple, M.S.; Kleim, J.A. Motor Training Induces Experience-Specific Patterns of Plasticity across Motor Cortex and Spinal Cord. J. Appl. Physiol. 2006, 101, 1776–1782. [Google Scholar] [CrossRef] [Green Version]
- Hugenschmidt, C.E.; Burdette, J.H.; Morgan, A.R.; Williamson, J.D.; Kritchevsky, S.B.; Laurienti, P.J. Graph Theory Analysis of Functional Brain Networks and Mobility Disability in Older Adults. J. Gerontol. A Biol. Sci. Med. Sci. 2014, 69, 1399–1406. [Google Scholar] [CrossRef] [Green Version]
- Blumen, H.M.; Brown, L.L.; Habeck, C.; Allali, G.; Ayers, E.; Beauchet, O.; Callisaya, M.; Lipton, R.B.; Mathuranath, P.S.; Phan, T.G.; et al. Gray Matter Volume Covariance Patterns Associated with Gait Speed in Older Adults: A Multi-Cohort MRI Study. Brain Imaging Behav. 2019, 13, 446–460. [Google Scholar] [CrossRef]
- Rosano, C.; Studenski, S.A.; Aizenstein, H.J.; Boudreau, R.M.; Longstreth, W.T.; Newman, A.B. Slower Gait, Slower Information Processing and Smaller Prefrontal Area in Older Adults. Age Ageing 2012, 41, 58–64. [Google Scholar] [CrossRef] [Green Version]
- Dietz, V.; Zijlstra, W.; Duysens, J. Human Neuronal Interlimb Coordination during Split-Belt Locomotion. Exp. Brain Res. 1994, 101, 513–520. [Google Scholar] [CrossRef] [PubMed] [Green Version]
- Roemmich, R.T.; Nocera, J.R.; Vallabhajosula, S.; Amano, S.; Naugle, K.M.; Stegemöller, E.L.; Hass, C.J. Spatiotemporal Variability during Gait Initiation in Parkinson’s Disease. Gait Posture 2012, 36, 340–343. [Google Scholar] [CrossRef] [Green Version]
- Bhatt, T.; Yang, F.; Pai, Y.-C. Learning from Falling: Retention of Fall-Resisting Behavior Derived from One Episode of Laboratory-Induced Slip Training. J. Am. Geriatr. Soc. 2011, 59, 2392–2393. [Google Scholar] [CrossRef] [PubMed]
- Grabiner, M.D.; Bareither, M.L.; Gatts, S.; Marone, J.; Troy, K.L. Task-Specific Training Reduces Trip-Related Fall Risk in Women. Med. Sci. Sports Exerc. 2012, 44, 2410–2414. [Google Scholar] [CrossRef] [PubMed] [Green Version]
- Rosenblatt, N.J.; Marone, J.; Grabiner, M.D. Preventing Trip-Related Falls by Community-Dwelling Adults: A Prospective Study. J. Am. Geriatr. Soc. 2013, 61, 1629–1631. [Google Scholar] [CrossRef]
- Yang, F.; Bhatt, T.; Pai, Y.-C. Generalization of Treadmill-Slip Training to Prevent a Fall Following a Sudden (Novel) Slip in over-Ground Walking. J. Biomech. 2013, 46, 63–69. [Google Scholar] [CrossRef] [Green Version]
- Bhatt, T.; Pai, Y.-C. Prevention of Slip-Related Backward Balance Loss: The Effect of Session Intensity and Frequency on Long-Term Retention. Arch. Phys. Med. Rehabil. 2009, 90, 34–42. [Google Scholar] [CrossRef] [Green Version]
- Ogawa, T.; Kawashima, N.; Ogata, T.; Nakazawa, K. Predictive Control of Ankle Stiffness at Heel Contact Is a Key Element of Locomotor Adaptation during Split-Belt Treadmill Walking in Humans. J. Neurophysiol. 2014, 111, 722–732. [Google Scholar] [CrossRef] [Green Version]
- Rhea, C.K.; Wutzke, C.J.; Lewek, M.D. Gait Dynamics Following Variable and Constant Speed Gait Training in Individuals with Chronic Stroke. Gait Posture 2012, 36, 332–334. [Google Scholar] [CrossRef] [Green Version]
- Stewart, A.L.; Mills, K.M.; King, A.C.; Haskell, W.L.; Gillis, D.; Ritter, P.L. CHAMPS Physical Activity Questionnaire for Older Adults: Outcomes for Interventions. Med. Sci. Sports Exerc. 2001, 37, 1126–1141. [Google Scholar] [CrossRef]
- Crum, R.M.; Anthony, J.C.; Bassett, S.S.; Folstein, M.F. Population-Based Norms for the Mini-Mental State Examination by Age and Educational Level. JAMA 1993, 269, 2386–2391. [Google Scholar] [CrossRef]
- Paul, S.S.; Canning, C.G.; Sherrington, C.; Lord, S.R.; Close, J.C.T.; Fung, V.S.C. Three Simple Clinical Tests to Accurately Predict Falls in People with Parkinson’s Disease: Fall Predictors in PD. Mov. Disord. 2013, 28, 655–662. [Google Scholar] [CrossRef] [PubMed]
- Abellan Van Kan, G.; Rolland, Y.; Andrieu, S.; Bauer, J.; Beauchet, O.; Bonnefoy, M.; Cesari, M.; Donini, L.M.; Gillette-Guyonnet, S.; Inzitari, M.; et al. Gait Speed at Usual Pace as a Predictor of Adverse Outcomes in Community-Dwelling Older People an International Academy on Nutrition and Aging (IANA) Task Force. J. Nutr. Health Aging 2009, 13, 881–889. [Google Scholar] [CrossRef] [PubMed]
- Perera, S.; Mody, S.H.; Woodman, R.C.; Studenski, S.A. Meaningful Change and Responsiveness in Common Physical Performance Measures in Older Adults: MEANINGFUL CHANGE AND PERFORMANCE. J. Am. Geriatr. Soc. 2006, 54, 743–749. [Google Scholar] [CrossRef] [PubMed]
- Halaweh, H.; Willen, C.; Grimby-Ekman, A.; Svantesson, U. Physical Functioning and Fall-Related Efficacy among Community-Dwelling Elderly People. Eur. J. Physiother. 2016, 18, 11–17. [Google Scholar] [CrossRef] [Green Version]
- Shumway-Cook, A.; Taylor, C.S.; Matsuda, P.N.; Studer, M.T.; Whetten, B.K. Expanding the Scoring System for the Dynamic Gait Index. Phys. Ther. 2013, 93, 1493–1506. [Google Scholar] [CrossRef] [PubMed] [Green Version]
- Podsiadlo, D.; Richardson, S. The Timed “Up & Go”: A Test of Basic Functional Mobility for Frail Elderly Persons. J. Am. Geriatr. Soc. 1991, 39, 142–148. [Google Scholar] [CrossRef]
- Huppert, F.A.; Cabelli, S.T.; Matthews, F.E. Brief Cognitive Assessment in a UK Population Sample—Distributional Properties and the Relationship between the MMSE and an Extended Mental State Examination. BMC Geriatr. 2005, 5, 7. [Google Scholar] [CrossRef] [Green Version]
- Folstein, M.F.; Folstein, S.E.; McHugh, P.R. “Mini-Mental State”: A Practical Method for Grading the Cognitive State of Patients for the Clinician. J. Psychiatr. Res. 1975, 12, 189–198. [Google Scholar] [CrossRef]
- Salthouse, T.A. What Cognitive Abilities Are Involved in Trail-Making Performance? Intelligence 2011, 39, 222–232. [Google Scholar] [CrossRef] [Green Version]
- Llinàs-Reglà, J.; Vilalta-Franch, J.; López-Pousa, S.; Calvó-Perxas, L.; Torrents Rodas, D.; Garre-Olmo, J. The Trail Making Test: Association With Other Neuropsychological Measures and Normative Values for Adults Aged 55 Years and Older From a Spanish-Speaking Population-Based Sample. Assessment 2017, 24, 183–196. [Google Scholar] [CrossRef] [PubMed]
- Sánchez-Cubillo, I.; Periáñez, J.A.; Adrover-Roig, D.; Rodríguez-Sánchez, J.M.; Ríos-Lago, M.; Tirapu, J.; Barceló, F. Construct Validity of the Trail Making Test: Role of Task-Switching, Working Memory, Inhibition/Interference Control, and Visuomotor Abilities. J. Int. Neuropsychol. Soc. 2009, 15, 438–450. [Google Scholar] [CrossRef] [PubMed] [Green Version]
- Bowie, C.R.; Harvey, P.D. Administration and Interpretation of the Trail Making Test. Nat. Protoc. 2006, 1, 2277–2281. [Google Scholar] [CrossRef] [PubMed]
- Winter, D.A. Biomechanics and Motor Control of Human Movement, 4th ed.; John Wily & Sons: Hoboken, NJ, USA, 2009; ISBN 978-0-470-39818-0. [Google Scholar]
- Winter, D.A.; Patla, A.E.; Frank, J.S.; Walt, S.E. Biomechanical Walking Pattern Changes in the Fit and Healthy Elderly. Phys. Ther. 1990, 70, 340–347. [Google Scholar] [CrossRef]
- Godin, G.; Jobin, J.; Bouillon, J. Assessment of Leisure Time Exercise Behavior by Self-Report: A Concurrent Validity Study. Can. J. Public Health. 1986, 77, 18–22. [Google Scholar] [CrossRef]
- Mazzeo, R.S.; Cavanagh, P.; Evans, W.J.; Fiatarone, M.; Hagberg, J.; McAuley, E.; Startzell, J. Exercise and Physical Activity for Older Adults. Med. Sci. Sports Exerc. 1998, 30, 992–1008. [Google Scholar]
- Borg, G. Borg’s Perceived Exertion and Pain Scales; Human Kinetics: Champaign, IL, USA, 1998; ISBN 0-88011-623-4. Available online: https://psycnet.apa.org/record/1998-07179-000 (accessed on 31 July 2022).
- Yokoyama, H.; Sato, K.; Ogawa, T.; Yamamoto, S.-I.; Nakazawa, K.; Kawashima, N. Characteristics of the Gait Adaptation Process Due to Split-Belt Treadmill Walking under a Wide Range of Right-Left Speed Ratios in Humans. PLoS ONE 2018, 13, e0194875. [Google Scholar] [CrossRef]
- Roemmich, R.T.; Fregly, B.J.; Hass, C.J. Neuromuscular Complexity during Gait Is Not Responsive to Medication in Persons with Parkinson’s Disease. Ann. Biomed. Eng. 2014, 42, 1901–1912. [Google Scholar] [CrossRef]
- Bruijn, S.M.; Van Impe, A.; Duysens, J.; Swinnen, S.P. Split-Belt Walking: Adaptation Differences between Young and Older Adults. J. Neurophysiol. 2012, 108, 1149–1157. [Google Scholar] [CrossRef] [Green Version]
- Roemmich, R.T.; Bastian, A.J. Two Ways to Save a Newly Learned Motor Pattern. J. Neurophysiol. 2015, 113, 3519–3530. [Google Scholar] [CrossRef] [Green Version]
- Hinkel-Lipsker, J.W.; Hahn, M.E. The Effects of Variable Practice on Locomotor Adaptation to a Novel Asymmetric Gait. Exp. Brain Res. 2017, 235, 2829–2841. [Google Scholar] [CrossRef] [PubMed]
- Lee, A.; Bhatt, T.; Liu, X.; Wang, Y.; Pai, Y.-C. Can Higher Training Practice Dosage with Treadmill Slip-Perturbation Necessarily Reduce Risk of Falls Following Overground Slip? Gait Posture 2018, 61, 387–392. [Google Scholar] [CrossRef] [PubMed]
- Peters, M. Footedness: Asymmetries in Foot Preference and Skill and Neuropsychological Assessment of Foot Movement. Psychol. Bull. 1988, 103, 179–192. [Google Scholar] [CrossRef] [PubMed]
- Cohen, J. Statistical Power Analysis for the Behavioral Sciences; Routledge Academic: New York, NY, USA, 1988. [Google Scholar]
- Corrà, U.; Mezzani, A.; Bosimini, E.; Giannuzzi, P. Prognostic Value of Time-Related Changes of Cardiopulmonary Exercise Testing Indices in Stable Chronic Heart Failure: A Pragmatic and Operative Scheme. Eur. J. Cardiovasc. Prev. Rehabil. 2006, 13, 186–192. [Google Scholar] [CrossRef] [PubMed]
- Alexander, N.B.; Dengel, D.R.; Olson, R.J.; Krajewski, K.M. Oxygen-Uptake (VO2) Kinetics and Functional Mobility Performance in Impaired Older Adults. J. Gerontol. A Biol. Sci. Med. Sci. 2003, 58, M734–M739. [Google Scholar] [CrossRef] [PubMed] [Green Version]
- VanSwearingen, J.M.; Perera, S.; Brach, J.S.; Wert, D.; Studenski, S.A. Impact of Exercise to Improve Gait Efficiency on Activity and Participation in Older Adults With Mobility Limitations: A Randomized Controlled Trial. Phys. Ther. 2011, 91, 1740–1751. [Google Scholar] [CrossRef] [PubMed] [Green Version]
- Bishnoi, A.; Lee, R.; Hu, Y.; Mahoney, J.R.; Hernandez, M.E. Effect of Treadmill Training Interventions on Spatiotemporal Gait Parameters in Older Adults with Neurological Disorders: Systematic Review and Meta-Analysis of Randomized Controlled Trials. Int. J. Environ. Res. Public. Health 2022, 19, 2824. [Google Scholar] [CrossRef] [PubMed]
- Bohannon, R.W.; Glenney, S.S. Minimal Clinically Important Difference for Change in Comfortable Gait Speed of Adults with Pathology: A Systematic Review: Review: Gait Speed Responsiveness. J. Eval. Clin. Pract. 2014, 20, 295–300. [Google Scholar] [CrossRef]
- Jerome, G.J.; Ko, S.; Kauffman, D.; Studenski, S.A.; Ferrucci, L.; Simonsick, E.M. Gait Characteristics Associated with Walking Speed Decline in Older Adults: Results from the Baltimore Longitudinal Study of Aging. Arch. Gerontol. Geriatr. 2015, 60, 239–243. [Google Scholar] [CrossRef] [Green Version]
- Oh-Park, M.; Holtzer, R.; Mahoney, J.; Wang, C.; Verghese, J. Effect of Treadmill Training on Specific Gait Parameters in Older Adults With Frailty: Case Series. J. Geriatr. Phys. Ther. 2011, 34, 184–188. [Google Scholar] [CrossRef] [Green Version]
- Pereira, N.M.; Araya, M.J.P.M.; Scheicher, M.E. Effectiveness of a Treadmill Training Programme in Improving the Postural Balance on Institutionalized Older Adults. J. Aging Res. 2020, 2020, 1–7. [Google Scholar] [CrossRef] [PubMed]
- Mirelman, A.; Rochester, L.; Maidan, I.; Del Din, S.; Alcock, L.; Nieuwhof, F.; Rikkert, M.O.; Bloem, B.R.; Pelosin, E.; Avanzino, L.; et al. Addition of a Non-Immersive Virtual Reality Component to Treadmill Training to Reduce Fall Risk in Older Adults (V-TIME): A Randomised Controlled Trial. Lancet 2016, 388, 1170–1182. [Google Scholar] [CrossRef] [Green Version]
- Klamroth, S.; Gaßner, H.; Winkler, J.; Eskofier, B.; Klucken, J.; Pfeifer, K.; Steib, S. Interindividual Balance Adaptations in Response to Perturbation Treadmill Training in Persons With Parkinson Disease. J. Neurol. Phys. Ther. 2019, 43, 224–232. [Google Scholar] [CrossRef]
- Fairhall, N.; Sherrington, C.; Kurrle, S.E.; Lord, S.R.; Lockwood, K.; Cameron, I.D. Effect of a Multifactorial Interdisciplinary Intervention on Mobility-Related Disability in Frail Older People: Randomised Controlled Trial. BMC Med. 2012, 10, 120. [Google Scholar] [CrossRef] [PubMed] [Green Version]
- Fukuchi, C.A.; Fukuchi, R.K.; Duarte, M. Effects of Walking Speed on Gait Biomechanics in Healthy Participants: A Systematic Review and Meta-Analysis. Syst. Rev. 2019, 8, 153. [Google Scholar] [CrossRef] [PubMed] [Green Version]
- Hebenstreit, F.; Leibold, A.; Krinner, S.; Welsch, G.; Lochmann, M.; Eskofier, B.M. Effect of Walking Speed on Gait Sub Phase Durations. Hum. Mov. Sci. 2015, 43, 118–124. [Google Scholar] [CrossRef] [PubMed]
- van Iersel, M.B.; Munneke, M.; Esselink, R.A.J.; Benraad, C.E.M.; Olde Rikkert, M.G.M. Gait Velocity and the Timed-Up-and-Go Test Were Sensitive to Changes in Mobility in Frail Elderly Patients. J. Clin. Epidemiol. 2008, 61, 186–191. [Google Scholar] [CrossRef]
- Chui, K.; Hood, E.; Klima, D. Meaningful Change in Walking Speed. Top. Geriatr. Rehabil. 2012, 28, 97–103. [Google Scholar] [CrossRef]
- Steffen, T.M.; Hacker, T.A.; Mollinger, L. Age- and Gender-Related Test Performance in Community-Dwelling Elderly People: Six-Minute Walk Test, Berg Balance Scale, Timed Up & Go Test, and Gait Speeds. Phys. Ther. 2002, 82, 128–137. [Google Scholar] [CrossRef] [Green Version]
- Balasubramanian, C.K. The Community Balance and Mobility Scale Alleviates the Ceiling Effects Observed in the Currently Used Gait and Balance Assessments for the Community-Dwelling Older Adults. J. Geriatr. Phys. Ther. 2015, 38, 78–89. [Google Scholar] [CrossRef]
- Baudendistel, S.T.; Schmitt, A.C.; Stone, A.E.; Raffegeau, T.E.; Roper, J.A.; Hass, C.J. Faster or Longer Steps: Maintaining Fast Walking in Older Adults at Risk for Mobility Disability. Gait Posture 2021, 89, 86–91. [Google Scholar] [CrossRef] [PubMed]
- Courtine, G.; Schieppati, M. Human Walking along a Curved Path. I. Body Trajectory, Segment Orientation and the Effect of Vision. Eur. J. Neurosci. 2003, 18, 177–190. [Google Scholar] [CrossRef]
- Courtine, G.; Schieppati, M. Human Walking along a Curved Path. II. Gait Features and EMG Patterns. Eur. J. Neurosci. 2003, 18, 191–205. [Google Scholar] [CrossRef]
- Orendurff, M.S.; Segal, A.D.; Berge, J.S.; Flick, K.C.; Spanier, D.; Klute, G.K. The Kinematics and Kinetics of Turning: Limb Asymmetries Associated with Walking a Circular Path. Gait Posture 2006, 23, 106–111. [Google Scholar] [CrossRef]
- Stuart, S.; Morris, R.; Giritharan, A.; Quinn, J.; Nutt, J.G.; Mancini, M. Prefrontal Cortex Activity and Gait in Parkinson’s Disease With Cholinergic and Dopaminergic Therapy. Mov. Disord. 2020, 35, 2019–2027. [Google Scholar] [CrossRef]
- Lin, M.-R.; Hwang, H.-F.; Hu, M.-H.; Wu, H.-D.I.; Wang, Y.-W.; Huang, F.-C. Psychometric Comparisons of the Timed Up and Go, One-Leg Stand, Functional Reach, and Tinetti Balance Measures in Community-Dwelling Older People. J. Am. Geriatr. Soc. 2004, 52, 1343–1348. [Google Scholar] [CrossRef] [PubMed]
- Weinstein, A.M.; Voss, M.W.; Prakash, R.S.; Chaddock, L.; Szabo, A.; White, S.M.; Wojcicki, T.R.; Mailey, E.; McAuley, E.; Kramer, A.F.; et al. The Association between Aerobic Fitness and Executive Function Is Mediated by Prefrontal Cortex Volume. Brain. Behav. Immun. 2012, 26, 811–819. [Google Scholar] [CrossRef] [Green Version]
- van Sloten, T.T.; Protogerou, A.D.; Henry, R.M.A.; Schram, M.T.; Launer, L.J.; Stehouwer, C.D.A. Association between Arterial Stiffness, Cerebral Small Vessel Disease and Cognitive Impairment: A Systematic Review and Meta-Analysis. Neurosci. Biobehav. Rev. 2015, 53, 121–130. [Google Scholar] [CrossRef] [Green Version]
- Roper, J.A.; Stone, A.E.; Raffegeau, T.E.; Terza, M.J.; Altmann, L.J.; Hass, C.J. Higher Relative Effort of the Knee Relates to Faster Adaptation in Older Adults at Risk for Mobility Disability. Exp. Gerontol. 2021, 144, 111192. [Google Scholar] [CrossRef]
- Hinton, D.C.; Conradsson, D.M.; Paquette, C. Understanding Human Neural Control of Short-Term Gait Adaptation to the Split-Belt Treadmill. Neuroscience 2020, 451, 36–50. [Google Scholar] [CrossRef]
- Funahashi, S.; Andreau, J.M. Prefrontal Cortex and Neural Mechanisms of Executive Function. J. Physiol.-Paris 2013, 107, 471–482. [Google Scholar] [CrossRef] [PubMed] [Green Version]
- Vasudevan, E.V.L.; Hamzey, R.J.; Kirk, E.M. Using a Split-Belt Treadmill to Evaluate Generalization of Human Locomotor Adaptation. J. Vis. Exp. 2017, 126, 55424. [Google Scholar] [CrossRef] [PubMed]
- Mancini, M.; El-Gohary, M.; Pearson, S.; McNames, J.; Schlueter, H.; Nutt, J.G.; King, L.A.; Horak, F.B. Continuous Monitoring of Turning in Parkinson’s Disease: Rehabilitation Potential. NeuroRehabilitation 2015, 37, 3–10. [Google Scholar] [CrossRef] [PubMed] [Green Version]
- Berg, W.P.; Alessio, H.M.; Mills, E.M.; Tong, C. Circumstances and Consequences of Falls in Independent Community-Dwelling Older Adults. Age Ageing 1997, 26, 261–268. [Google Scholar] [CrossRef] [PubMed] [Green Version]
- Li, W.; Keegan, T.H.M.; Sternfeld, B.; Sidney, S.; Quesenberry, C.P.; Kelsey, J.L. Outdoor Falls Among Middle-Aged and Older Adults: A Neglected Public Health Problem. Am. J. Public Health 2006, 96, 1192–1200. [Google Scholar] [CrossRef]
- Forner Cordero, A.; Koopman, H.F.J.M.; van der Helm, F.C.T. Multiple-Step Strategies to Recover from Stumbling Perturbations. Gait Posture 2003, 18, 47–59. [Google Scholar] [CrossRef]
- McCrum, C.; Karamanidis, K.; Grevendonk, L.; Zijlstra, W.; Meijer, K. Older Adults Demonstrate Interlimb Transfer of Reactive Gait Adaptations to Repeated Unpredictable Gait Perturbations. GeroScience 2020, 42, 39–49. [Google Scholar] [CrossRef] [Green Version]
- Reisman, D.S.; McLean, H.; Keller, J.; Danks, K.A.; Bastian, A.J. Repeated Split-Belt Treadmill Training Improves Poststroke Step Length Asymmetry. Neurorehabil. Neural Repair 2013, 27, 460–468. [Google Scholar] [CrossRef] [Green Version]
- Seuthe, J.; D’Cruz, N.; Ginis, P.; Becktepe, J.S.; Weisser, B.; Nieuwboer, A.; Schlenstedt, C. The Effect of One Session Split-Belt Treadmill Training on Gait Adaptation in People With Parkinson’s Disease and Freezing of Gait. Neurorehabil. Neural Repair 2020, 34, 954–963. [Google Scholar] [CrossRef]
- Nanhoe-Mahabier, W.; Snijders, A.H.; Delval, A.; Weerdesteyn, V.; Duysens, J.; Overeem, S.; Bloem, B.R. Split-Belt Locomotion in Parkinson’s Disease with and without Freezing of Gait. Neuroscience 2013, 236, 110–116. [Google Scholar] [CrossRef]
- Betschart, M.; McFadyen, B.J.; Nadeau, S. Repeated Split-Belt Treadmill Walking Improved Gait Ability in Individuals with Chronic Stroke: A Pilot Study. Physiother. Theory Pract. 2018, 34, 81–90. [Google Scholar] [CrossRef] [PubMed]
- Lewek, M.D.; Braun, C.H.; Wutzke, C.; Giuliani, C. The Role of Movement Errors in Modifying Spatiotemporal Gait Asymmetry Post Stroke: A Randomized Controlled Trial. Clin. Rehabil. 2018, 32, 161–172. [Google Scholar] [CrossRef] [PubMed]
- Reisman, D.S.; Wityk, R.; Silver, K.; Bastian, A.J. Split-Belt Treadmill Adaptation Transfers to Overground Walking in Persons Poststroke. Neurorehabil. Neural Repair 2009, 23, 735–744. [Google Scholar] [CrossRef] [PubMed] [Green Version]
- Latash, E.M.; Lecomte, C.G.; Danner, S.M.; Frigon, A.; Rybak, I.A.; Molkov, Y.I. On the Organization of the Locomotor CPG: Insights From Split-Belt Locomotion and Mathematical Modeling. Front. Neurosci. 2020, 14, 598888. [Google Scholar] [CrossRef]
- Holtzer, R.; Epstein, N.; Mahoney, J.R.; Izzetoglu, M.; Blumen, H.M. Neuroimaging of Mobility in Aging: A Targeted Review. J. Gerontol. A Biol. Sci. Med. Sci. 2014, 69, 1375–1388. [Google Scholar] [CrossRef]
- Bolton, D.A.E.; Williams, L.; Staines, W.R.; McIlroy, W.E. Contribution of Primary Motor Cortex to Compensatory Balance Reactions. BMC Neurosci. 2012, 13, 102. [Google Scholar] [CrossRef] [PubMed] [Green Version]
- Gothe, N.P.; Fanning, J.; Awick, E.; Chung, D.; Wójcicki, T.R.; Olson, E.A.; Mullen, S.P.; Voss, M.; Erickson, K.I.; Kramer, A.F.; et al. Executive Function Processes Predict Mobility Outcomes in Older Adults. J. Am. Geriatr. Soc. 2014, 62, 285–290. [Google Scholar] [CrossRef] [PubMed] [Green Version]
- Liu-Ambrose, T.; Pang, M.Y.C.; Eng, J.J. Executive Function Is Independently Associated with Performances of Balance and Mobility in Community-Dwelling Older Adults after Mild Stroke: Implications for Falls Prevention. Cerebrovasc. Dis. 2007, 23, 203–210. [Google Scholar] [CrossRef] [Green Version]


| Group | n | Age (y) | Mass (kg) | Height (m) | MMSE (Max Score: 30) | SPPB (Max Score: 12) | Walking Speed (m/s) | VO2max (mL/kg/min) |
|---|---|---|---|---|---|---|---|---|
| Control | 2 M 11 F | 73 ± 1 | 77.68 ± 4.91 | 1.66 ± 0.03 | 27.67 ± 0.50 | 8.92 ± 0.41 | 1.01 ± 0.04 | 15.15 ± 1.28 |
| Traditional | 4 M 8 F | 73 ± 1 | 90.49 ± 4.01 | 1.65 ± 0.02 | 28.33 ± 0.52 | 8.44 ± 0.47 | 0.94 ± 0.04 | 17.42 ± 1.23 |
| Split-belt | 4 M 9 F | 71 ± 1 | 94.60 ± 8.04 | 1.65 ± 0.03 | 27.85 ± 0.48 | 9.08 ± 0.41 | 0.94 ± 0.04 | 17.03 ± 1.23 |
| Week | Group | Treadmill Speed (m/s) | Individual Treadmill Belt Speed (m/s) | Target HR (bpm) | Average HR (bpm) | Percentage from Target (%) | RPE |
|---|---|---|---|---|---|---|---|
| Week 4 | Traditional | 0.7 ± 0.0 [0.5, 0.9] | 96 ± 1 [91, 101] | 98 ± 2 [88, 113] | 2 ± 1 [−3, 12] | 2 ± 0 [1, 3] | |
| Split-belt | 0.7 ± 0.1 [0.4, 1.2] | D: 0.7 ± 0.1 [0.4, 1.3] ND: 0.7 ± 0.1 [0.4, 1.1] | 97 ± 1 [92, 101] | 93 ± 2 [81, 111] | −4 ± 2 [−18, 12] | 2 ± 0 [1, 5] | |
| Week 8 | Traditional | 1.0 ± 0.1 [0.6, 1.3] | 110 ± 1 [105, 116] | 109 ± 1 [103, 114] | −1 ± 1 [−4, 7] | 3 ± 0 [2, 5] | |
| Split-belt | 0.9 ± 0.1 [0.4, 1.1] | D: 0.8 ± 0.1 [0.4, 1.1] ND: 0.9 ± 0.1 [0.4, 1.2] | 111 ± 1 [102, 116] | 99 ± 2 [82, 111] | −11 ± 2 [−28, −3] | 3 ± 0 [1, 6] | |
| Week 12 | Traditional | 1.1 ± 0.1 [0.7, 1.3] | 110 ± 1 [105, 116] | 109 ± 1 [102, 116] | −2 ± 1 [−5, 2] | 3 ± 0 [2, 5] | |
| Split-belt | 0.8 ± 0.1 [0.4, 1.1] | D: 0.8 ± 0.1 [0.4, 1.1] ND: 0.9 ± 0.1 [0.4, 1.2] | 111 ± 1 [102, 116] | 98 ± 3 [82, 114] | −12 ± 2 [−28, 1] | 3 ± 0 [1, 7] | |
| Week 16 | Traditional | 1.1 ± 0.1 [0.6, 1.3] | 110 ± 1 [105, 116] | 109 ± 1 [104, 115] | −1 ± 1 [−7, 1] | 3 ± 0 [2, 5] | |
| Split-belt | 0.8 ± 0.1 [0.4, 1.1] | D: 0.8 ± 0.1 [0.4, 1.1] ND:0.9 ± 0.1 [0.4, 1.2] | 112 ± 1 [106, 116] | 97 ± 3 [83, 110] | −13 ± 2 [−28, −3] | 3 ± 0 [1, 7] |
| Measure | Group | Time | Mean ± SE | Variability Mean ± SE |
|---|---|---|---|---|
| Speed (m/s) | Control | Pre | 1.01 ± 0.04 | 0.046 ± 0.004 |
| Post | 1.04 ± 0.05 | 0.052 ± 0.003 | ||
| Traditional | Pre | 0.94 ± 0.04 * | 0.049 ± 0.004 | |
| Post | 1.02 ± 0.05 * | 0.044 ± 0.004 | ||
| Split-Belt | Pre | 0.94 ± 0.04 | 0.047 ± 0.004 | |
| Post | 0.92 ± 0.06 | 0.042 ± 0.003 | ||
| Cadence (steps/min) | Control | Pre | 112 ± 3 | 3.1 ± 0.2 |
| Post | 114 ± 3 | 3.5 ± 0.2 | ||
| Traditional | Pre | 108 ± 3 | 3.1 ± 0.3 | |
| Post | 110 ± 3 | 2.9 ± 0.3 | ||
| Split-Belt | Pre | 105 ± 3 | 3.4 ± 0.3 | |
| Post | 105 ± 3 | 3.2 ± 0.3 | ||
| Stride Length (m) | Control | Pre | 1.08 ± 0.03 | 0.035 ± 0.003 |
| Post | 1.09 ± 0.04 | 0.041 ± 0.004 | ||
| Traditional | Pre | 1.05 ± 0.04 * | 0.042 ± 0.003 | |
| Post | 1.11 ± 0.04 * | 0.034 ± 0.004 | ||
| Split-Belt | Pre | 1.08 ± 0.03 | 0.039 ± 0.003 | |
| Post | 1.06 ± 0.04 | 0.033 ± 0.004 | ||
| Stride Time (s) | Control | Pre | 1.08 ± 0.03 | 0.031 ± 0.004 |
| Post | 1.07 ± 0.03 | 0.034 ± 0.004 | ||
| Traditional | Pre | 1.11 ± 0.03 | 0.032 ± 0.004 | |
| Post | 1.10 ± 0.03 | 0.029 ± 0.004 | ||
| Split-Belt | Pre | 1.15 ± 0.03 | 0.038 ± 0.004 | |
| Post | 1.16 ± 0.03 | 0.034 ± 0.004 | ||
| Step Width (m) | Control | Pre | 0.098 ± 0.010 | 0.026 ± 0.002 |
| Post | 0.097 ± 0.010 | 0.029 ± 0.002 | ||
| Traditional | Pre | 0.095 ± 0.010 | 0.029 ± 0.002 | |
| Post | 0.099 ± 0.010 | 0.027 ± 0.002 | ||
| Split-Belt | Pre | 0.104 ± 0.010 * | 0.028 ± 0.002 | |
| Post | 0.121 ± 0.010 * | 0.029 ± 0.002 | ||
| Stance Time (% gait cycle) | Control | Pre | 63.4 ± 0.5 | 1.46 ± 0.11 |
| Post | 63.1 ± 0.6 | 1.36 ± 0.10 | ||
| Traditional | Pre | 64.6 ± 0.5 | 1.66 ± 0.12 | |
| Post | 64.1 ± 0.7 | 1.42 ± 0.11 | ||
| Split-Belt | Pre | 64.9 ± 0.5 | 1.49 ± 0.11 | |
| Post | 64.8 ± 0.6 | 1.39 ± 0.11 |
Publisher’s Note: MDPI stays neutral with regard to jurisdictional claims in published maps and institutional affiliations. |
© 2022 by the authors. Licensee MDPI, Basel, Switzerland. This article is an open access article distributed under the terms and conditions of the Creative Commons Attribution (CC BY) license (https://creativecommons.org/licenses/by/4.0/).
Share and Cite
Wade, F.; Baudendistel, S.; Stone, A.; Roper, J.; Raffegeau, T.; Terza, M.; Hass, C. Locomotor Adaptation Training to Prevent Mobility Disability. Biomechanics 2022, 2, 395-420. https://doi.org/10.3390/biomechanics2030031
Wade F, Baudendistel S, Stone A, Roper J, Raffegeau T, Terza M, Hass C. Locomotor Adaptation Training to Prevent Mobility Disability. Biomechanics. 2022; 2(3):395-420. https://doi.org/10.3390/biomechanics2030031
Chicago/Turabian StyleWade, Francesca, Sidney Baudendistel, Amanda Stone, Jaimie Roper, Tiphanie Raffegeau, Matthew Terza, and Chris Hass. 2022. "Locomotor Adaptation Training to Prevent Mobility Disability" Biomechanics 2, no. 3: 395-420. https://doi.org/10.3390/biomechanics2030031