Article

New Polymers In Silico Generation and Properties Prediction

by
Andrey A. Knizhnik
1,2,
Pavel V. Komarov
3,4,*,
Boris V. Potapkin
1,2,
Denis B. Shirabaykin
1,
Alexander S. Sinitsa
1,2 and
Sergey V. Trepalin
1,5
1
Kintech Lab Ltd., 3rd Khoroshevskaya Str. 12, 123298 Moscow, Russia
2
National Research Center “Kurchatov Institute”, Akademika Kurchatova Sq., 1, 123182 Moscow, Russia
3
Institute of Organoelement Compounds RAS, Vavilova St. 28, 119991 Moscow, Russia
4
General Physics Department, Tver State University, Sadovy Str. 35, 170002 Tver, Russia
5
All Russian Institute for Scientific and Technical Information RAS, Usievicha Str. 20, 125215 Moscow, Russia
*
Author to whom correspondence should be addressed.
Nanomanufacturing 2024, 4(1), 1-26; https://doi.org/10.3390/nanomanufacturing4010001
Submission received: 15 September 2023 / Revised: 26 November 2023 / Accepted: 11 December 2023 / Published: 19 December 2023
(This article belongs to the Special Issue Nanomanufacturing Empowered with Artificial Intelligence)

Abstract

:
We present a theoretical approach for the in silico generation of new polymer structures for the systematic search for new materials with advanced properties. It is based on Bicerano’s Regression Model (RM), which uses the structure of the smallest repeating unit (SRU) for fast and adequate prediction of polymer properties. We have developed the programs (a) GenStruc, for generating the new polymer SRUs using the enumeration and Monte Carlo algorithms, and (b) PolyPred, for predicting properties for a given input polymer as well as for multiple structures stored in the database files. The structure database from the original Bicerano publication is used to create databases of backbones and pendant groups. A database of 5,142,153 unique SRUs is generated using the scaffold-based combinatorial method. We show that using only known backbones of the polymer SRU and varying the pendant groups can significantly improve the predicted extreme values of polymer properties. Analysis of the obtained results for the dielectric constant and refractive index shows that the values of the dielectric constant are higher for polyhydrazides than for polyhydroxylamines. The high value predicted for the refractive index of polythiophene and its derivatives is in agreement with the experimental data.

Graphical Abstract

1. Introduction

The creation of new materials based on polymers is one of the priority areas of modern chemical engineering [1,2]. Polymers are technologically advanced substances that outperform traditional materials (metal, glass, wood) in certain applications and can sometimes be indispensable due to their unique properties, ease of processing, and low density. At the same time, polymers can be easily modified by changing their chemical structure. Currently, polymers are widely used as structural materials, substrates, functional layers, encapsulates, etc. [3,4].
The classical way to design a new polymer with desired (usually extreme) properties is to propose its structure by chemical intuition and then synthesize and experimentally analyze it [1]. If the properties obtained are not satisfactory, the initial chemical structure can be varied by adjusting both the backbone chain and the pendant groups [2] of the polymer. This approach is commonly called “screening” [5].
Screening is a very time-consuming and expensive process that requires a large amount of laboratory and measurement equipment. Currently, a promising alternative to laboratory screening is computer simulation studies, where new polymers are designed in silico. Several computational methods can predict various properties of polymer materials, namely Quantum Chemistry (QC) [6,7], molecular mechanics (MM) [8,9], Finite Elements (FE) [10], Quantitative Structure–Property Relationships (QSPR) [11,12,13], and QSPR neural networks [14,15]. They operate on different space-time scales, which define their limitations on system size and computational resources. To overcome these limitations, a multiscale approach is used [16]. This technique is based on the combination of several separate QC, MM, FE, and QSPR models into a hierarchically organized “multiscale” model. In this approach, data on system properties are transferred between different simulation levels [17,18]. Such closed hybrid computational models can be parameterized using only basic information about the chemical structure of a polymer repeating unit.
Currently, QC and MM methods are widely used for accurate prediction of the physical properties of polymers. Quantum chemical or ab initio (meaning “from the beginning”) methods describe the properties of a material on the scale of single atoms and molecules using the Schrödinger equation [19]. One of the most popular QC approaches today is Density Functional Theory (DFT) [20]. This method is important for the description of interatomic forces and chemical reactions [21]. QC methods are extremely computationally expensive and limited to systems of 100–1000 atoms and to picoseconds-scale phenomena [22,23].
Molecular dynamics (MD), one of the MM methods, is a powerful tool to study structural, mechanical, and transport properties [24,25,26,27,28]. Classical MD is often used to explore the interactions and various phenomena that occur at the molecular scale [29] using Newton’s equations of motion with forces calculated from given interatomic interaction potentials. As in the case of QC methods, the application of MM does not require experimental reference data for the calculation, but it is necessary to set the parameters of the interaction potentials correctly. In these cases, a mesoscale approach known as coarse-grained MD (CG MD) is typically used [30]. While this approach saves computational resources, it sacrifices certain degrees of freedom in the system and neglects subtle molecular interactions. Both MD and CG MD calculations require less computational resources than QC calculations, although they are less accurate and predictive in the case of systems where the precise description of intermolecular interactions is not developed.
The major drawback of QM and MD methods is the enormous amount of computer time required for calculations. This is a critical limitation for computer screening when it is necessary to obtain property values for millions of chemical structures organized as databases. For this case, QSPR methods are a good alternative. They include clustering, linear and nonlinear regression (MLR, MNR), Gaussian Regression (GPR), Support Vector Machine (SVM), and Extreme Gradient Boosting (XGB), as well as various neural networks (NN) [31]. Clustering is used to divide a compound database into small groups with similar structures, and other methods provide the numerical value of the physical properties.
The QSPR methods are based on the assumption that similar chemical structures have similar properties. Structural formulas of chemical compounds are used as input data. Numerical descriptors are usually introduced to describe the similarity between the considered chemical structures. These descriptors can be topological indices [32], flags for the presence of structural fragments and/or the number of such fragments [33], fingerprints associated with specific structural fragments, and physicochemical identifiers [34].
Before using QSPR methods, it is necessary to perform their training. This means adjusting the parameters of the QSPR models in such a way that the calculated values of the properties of polymers belonging to a given class match the reference data (typically, available experimental data are used).
Note that QSPR models can only be used to optimize properties within existing classes of polymer materials and cannot be used for new classes unless they are trained on relevant compounds. However, this is also true for neural networks and other machine learning models. In addition, the use of NN creates portability problems, making it difficult to reuse the developed models to solve new problems. To use previously created neural networks, it is necessary to know the weights of the activation functions, which are usually not published. In addition, there may be problems with different software implementations of NN.
In summary, QSPR models are currently more effective for fast computational screening because QM and MM methods require large computational resources and do not allow the calculation of millions of compounds in a reasonable time. Like neural networks and other machine learning models, QSPR models can be created based on the available analysis of any reference data, either literature data from polymer databases or obtained by other simulation methods. An additional advantage of QSPR models is that, unlike NN, the transfer of ready-made models to other computing platforms is less problematic. Therefore, in the present study, we choose the linear regression method for the computational screening of polymer materials, in particular the Bicerano models [11].
In our study, we use the following concept. Computer screening allows the study of a polymer material as a virtual structure, which cannot be obtained in the laboratory and may not even exist in nature. By constructing a large number of virtual structures of given classes of polymers, it is possible to screen and select a set of polymers with the desired unique properties. The properties of the “discovered” polymers can then be verified by QC and MM methods before proceeding to in situ synthesis. The proposed theoretical approach is based on novel algorithms of extensive in silico generation and filtering of new polymer structures. These algorithms use fragments of already known polymers, so the reliability of the predictions obtained (new polymer structures and their properties) is significantly increased in comparison with those obtained with ML and NN methods. Unlike the ML and NN methods, the implementation allows full control over the model parameterization. Moreover, these advanced algorithms allow us to avoid various numerical problems and to reduce the required computation time.
Therefore, when designing new polymers using QSPR models, it is important to generate large databases of virtual polymer smallest repeating unit (SRU) structures. These can be generated using traditional methods: Variational Autoencoder (VAE), Genetic Algorithm (GA), Particle Swarm Optimization (PSO), Monte Carlo Algorithm (MC), Reinforcement Learning (RL) [28,35,36], and Neural Networks (NNs) [37]. A good overview and description of neural networks and other methods for generating virtual chemical structures is given in [31] for Generative Adversarial Networks (GANs) [38] and Recurrent Neural Networks (RNNs) [39] and their modifications.
The extensive generation of new structures leads to a combinatorial explosion when tens and hundreds of millions of polymer structures are generated by simple enumeration. For this reason, QC or MM calculations, which require significant computational resources, are not applicable, and it is very effective to use QSPR methods as a pre-filter for the selected properties.
Let us now discuss why the Bicerano regression models [11] were chosen to achieve our goal. We were guided by the following considerations:
(1)
Most of the published works using neural networks cannot be reproduced because the detailed configuration of the NN, e.g., the activation function weights, is not provided;
(2)
If a structural fragment is missing from the regression model, then its contribution to the property is assumed to be zero. In this respect, Bicerano’s models differ favorably from Askadskii’s [12] or Van Crevelen’s [13] models, where the absence of an increment for an atom with nearest neighbors [12] or a structural fragment [13] makes property prediction impossible;
(3)
Bicerano’s approach uses the similar models to predict a large number of properties. This simplifies the program code;
(4)
High computational speed, which is especially important when processing large amounts of data. The number of fragments calculated from the 2D structure is simply substituted into the equation with coefficients taken from Ref. [11];
(5)
A very high-quality presentation of sample calculations for the created models. For example, the tables in Ref. [11] contain not only the final results but also the intermediate calculated data: the number of fragments used in the model in the SRU structures and some intermediate parameters. This makes debugging the code much easier.
Thus, our goal is to develop a methodology that enables (a) virtual synthesis (generation) of chemical structures of polymer SRUs, backbone SRUs, and pendant groups (which are stored in a separate database for further processing) and (b) fast search for polymers with extreme properties through the obtained database. For synthesis, we used fragments of new polymer SRUs obtained as a result of splitting polymer SRUs from the list of existing structures used to train the Bicerano models. Then, we used the same Bicerano models for property screening. This guarantees that the virtually generated polymer SRUs do not go beyond the existing classes used to train the Bicerano model. This makes the screening results reliable and ensures that the predicted property values are appropriate. We believe that since the Bicerano method has been trained on real polymer SRUs [11], the probability of synthesizing polymers that are real or can be synthesized is also high.
There are several databases available for the chemical structures of polymers and polymer SRUs: PolyInfo [40], Polymer Genome [14], CHEMnetBASE [41], Crystallographic Data [42], PI1M [35]. However, all of them, except PI1M and Crystallographic Data, are provided on a commercial basis, and the chemical structures are available only as single records or even as images. As will be shown in the following, the PI1M database needs a lot of adaptation for the synthesis of new unique polymers in silico. Crystallographic data [42] that contain 1073 polymers are also freely available in the form of atomic coordinates, but not as 2D SRUs required by QSPR models. Therefore, one of the goals of this study is to create a database of chemical structures of polymer SRUs that can be used in various calculations, including the prediction of physical properties. The second goal is to develop user-friendly software that supports operations with chemical databases, e.g., adding, modifying, and deleting records, searching for duplicate chemical structures, and predicting polymer properties.
The article is organized as follows. The second section discusses the general scheme, algorithms, and a special program for generating databases of polymer SRUs from given fragments of the backbone for their subsequent characterization by the QSPR method to identify new polymers with a set of desired properties. The third section presents the results of generating new polymers and predicting their properties. Two algorithms were used: the enumeration algorithm and the random selection algorithm (Monte Carlo). The extreme values of the properties are compared with the available Bicerano and PI1M data. A critical analysis of the polymer SRUs from the PI1M database is given. In the discussion of the results for compounds with extreme values of refractive index and dielectric constants, the prediction results of these properties are compared with experimental data and results from other programs. The conclusions briefly summarize the results of this work and the prospects for further development.

2. Materials and Methods

Our methodology includes two components: a method for predicting polymer properties and a method for building the database. Since we use a well-described Bicerano regression model [11] for polymer property prediction, next we focus on building databases of virtually synthesized polymer SRUs.
As mentioned above, computational screening, i.e., the search for materials with desired properties, requires a database of new polymer SRUs. When a database is created such as this, it is important to take into account the possibility of synthesis and the stability of new polymers. The easiest way to do this is to use data for existing materials. At present, only the PI1M database [35] has been released into the public domain in a machine-readable format. However, this database contains not only the structures of known polymer SRUs but also the structures of unsynthesized polymer SRUs. The NIMS database [40] also contains structures of polymer SRUs that cannot be synthesized—for example, *-CHCl-*. This leads to the conclusion that manual input of the structures of existing polymers is necessary. Since we have chosen the Bicerano method [11] for the prediction of polymer properties, it is obvious that we use the polymers that have been used in this approach to train the regression models developed.
Figure 1 shows a block diagram of our algorithm for the database generation steps. Point 1 in Figure 1 corresponds to the structures of existing polymer SRUs extracted from the publication [11]. We considered the generation of two types of databases: databases of structure fragments (FDBs) from the literature data (Figure 1, points 6, 7, 8) and a polymer SRU database (SRUDB) (Figure 1, point 17). The FDBs in turn consist of three databases: Pendant Groups (PDB, Figure 1, point 6), SRU Backbones (BDB) (Figure 1, point 7), and Fragments of SRU Backbones (BFDB) (Figure 1, point 8).
To generate new virtual structures of polymer SRUs (Figure 1, point 17), we used the technology of scaffold-based combinatorial library generation [36], where the role of the scaffold is assigned to the backbone. In this approach, some atoms in the backbone are labeled as connection points to which pendant groups can be attached. Typically, a separate list of pendant groups is created for each connection point. Then, all possible combinations of pendant groups can be selected to generate new polymer SRU structures—in the case of the enumeration algorithm—or pendant groups can be randomly selected from the list—in the case of the Monte Carlo algorithm.

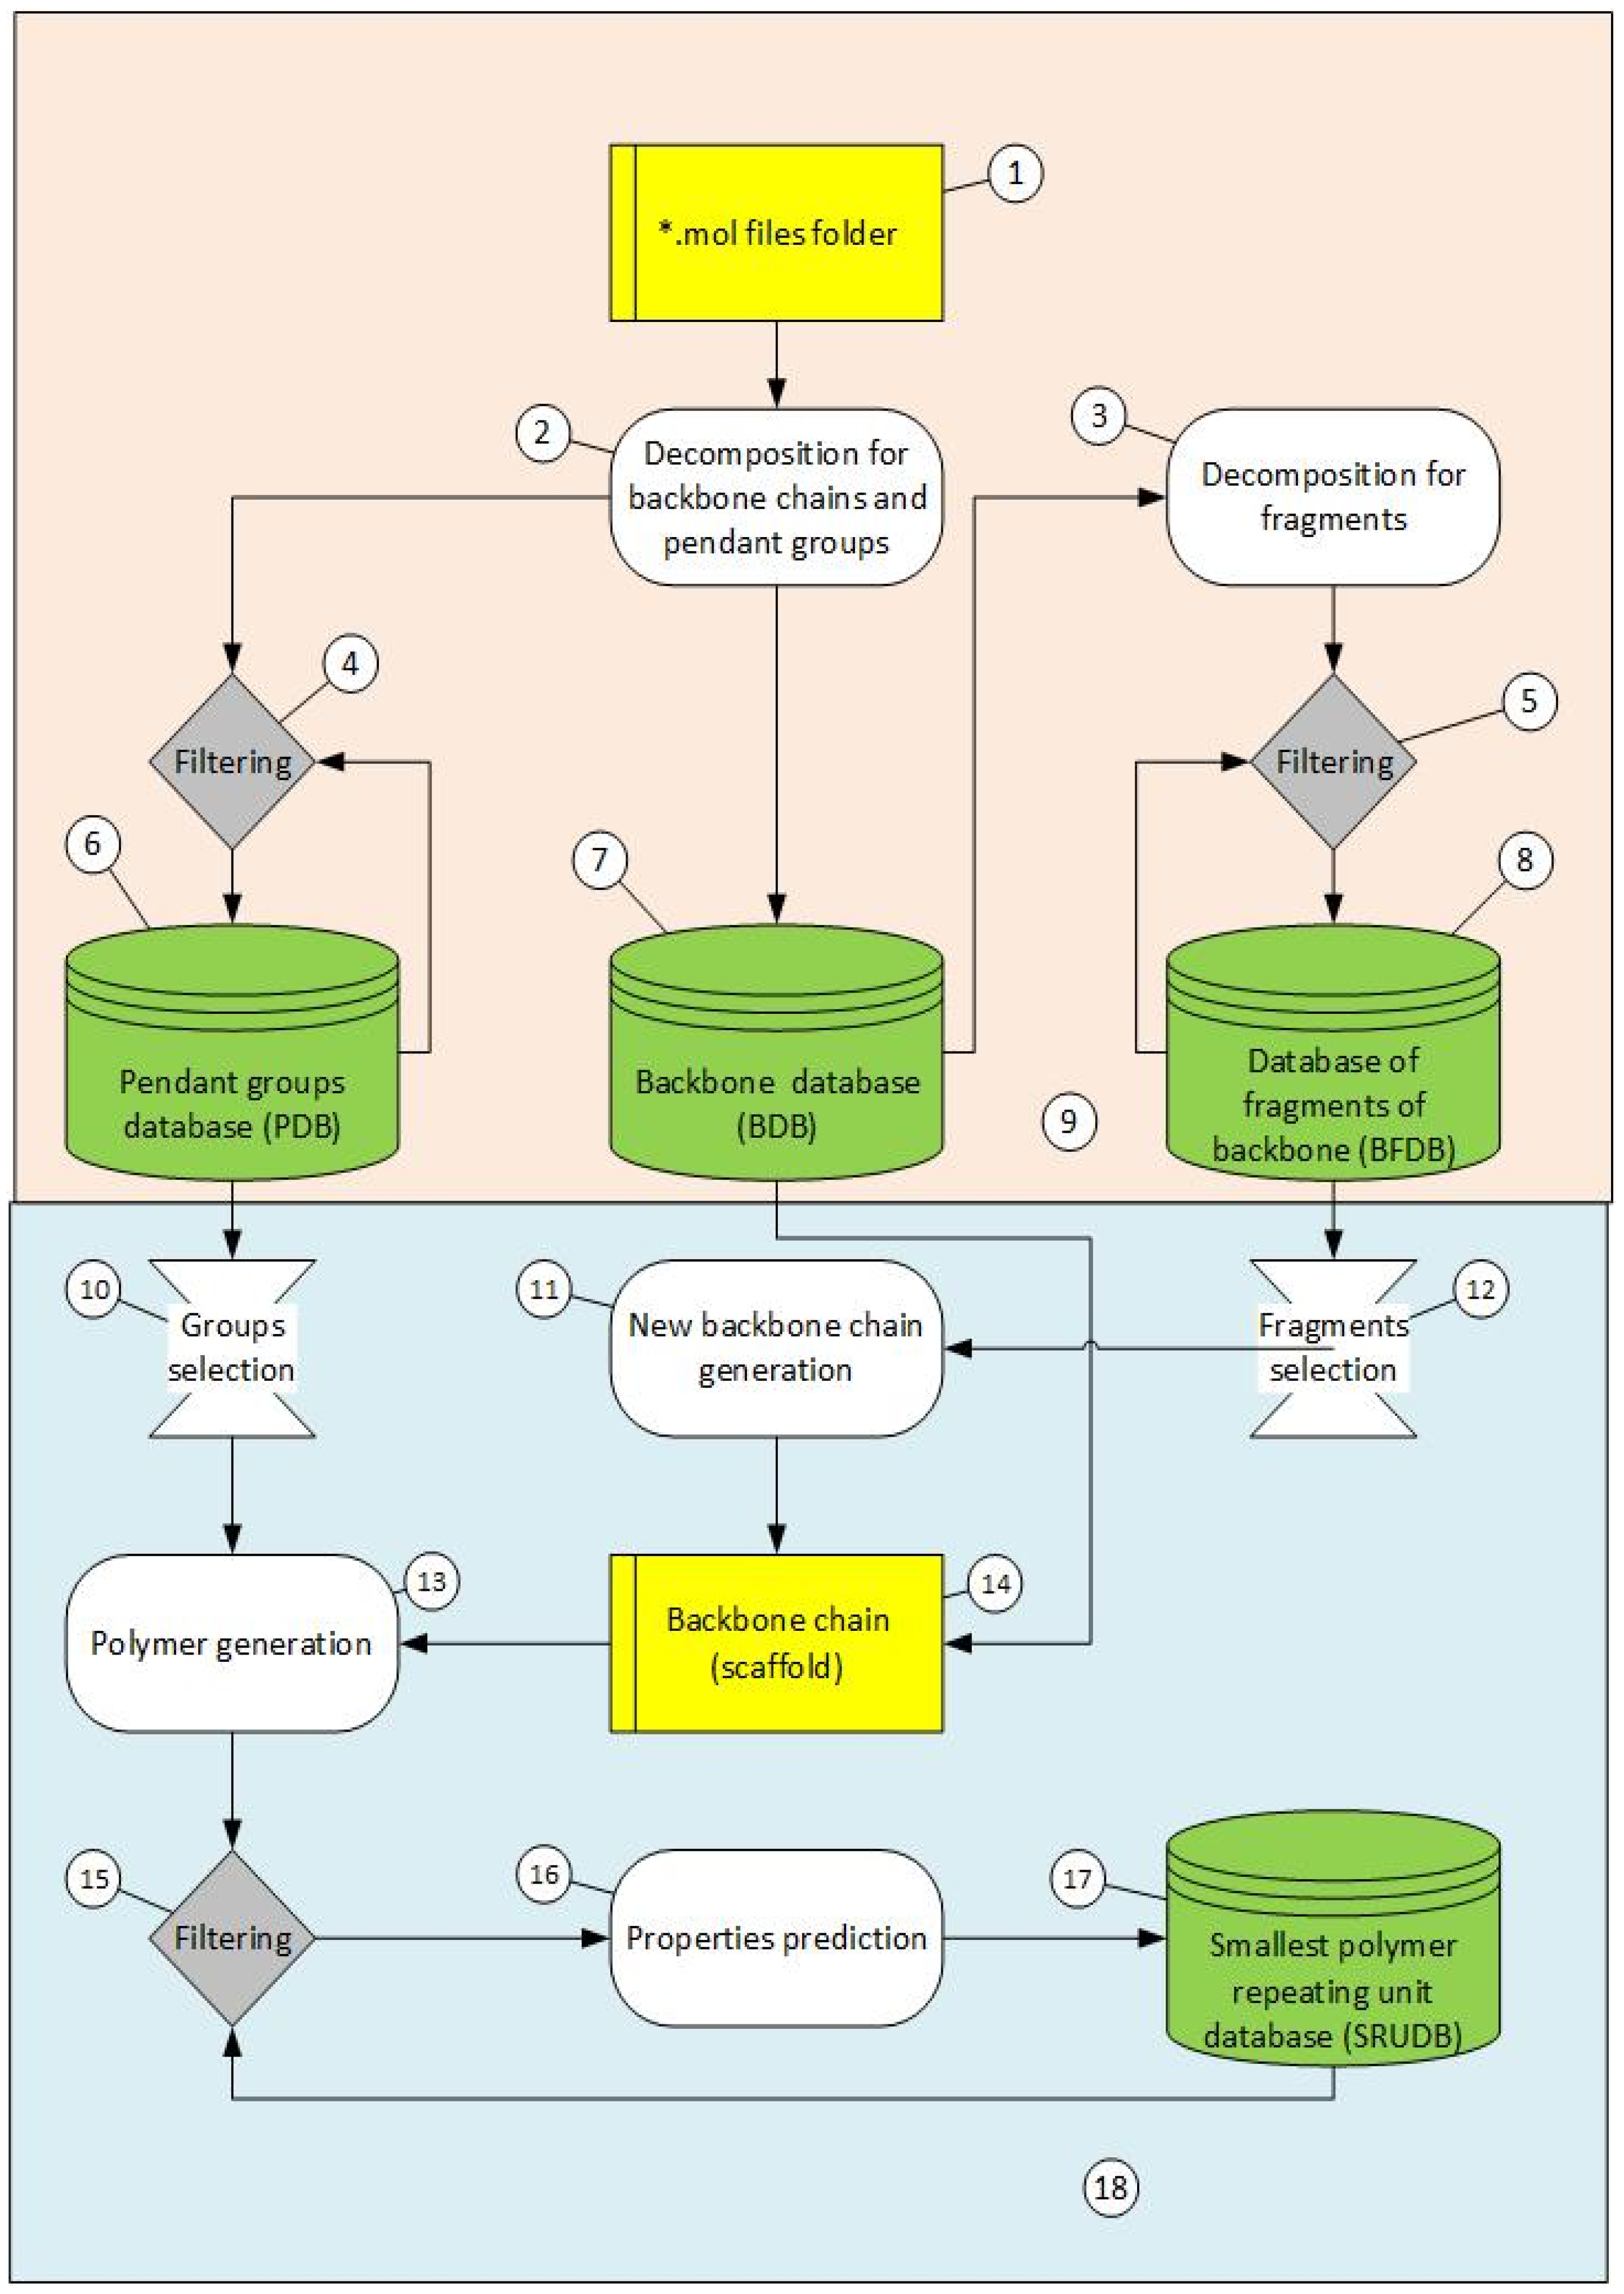
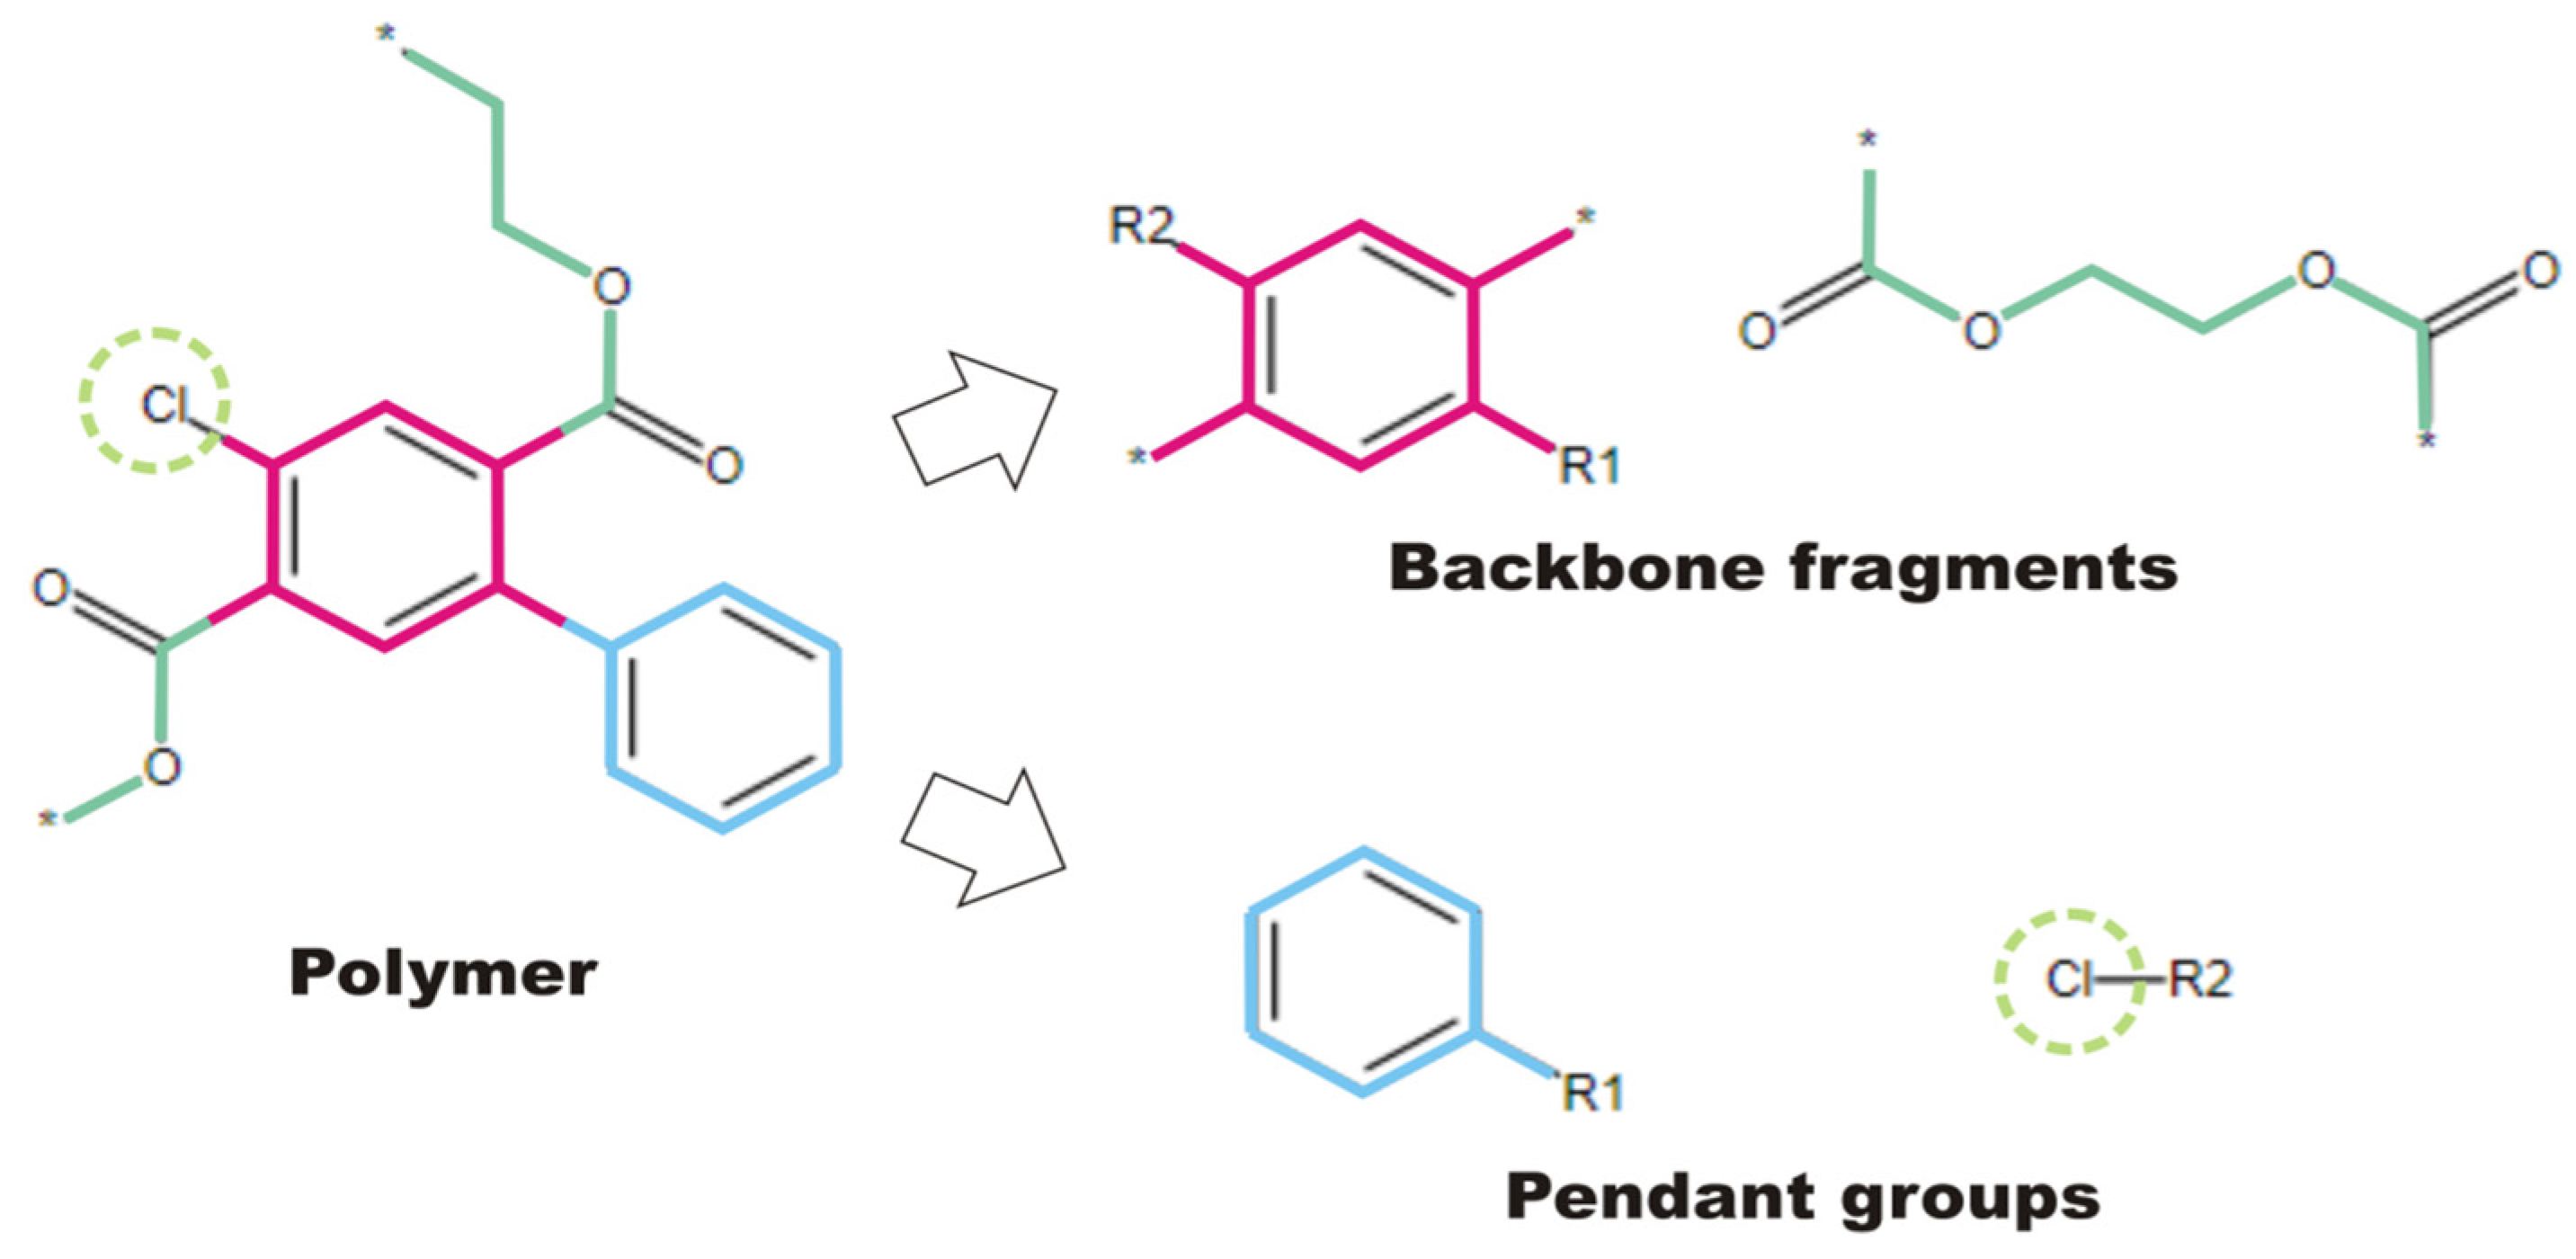
2.1. Creation of FDBs

As mentioned above, the structures of the existing polymer SRU [11] were used as starting data for fragment generation. They were manually extracted from [11] and saved as computer-readable *.mol (MOL) files (MDL format) [43] (see Figure 1, point 1). Next, these structures were decomposed into backbones (Figure 1, point 7) and pendant groups (Figure 1, point 6) and stored in their databases—BDB (Figure 1, point 7) and PDB (Figure 1, point 6). The backbones were further fragmented to form the BFDB (Figure 1, point 8). Using FDBs to create polymer SRUs, it is possible to vary the structure of the backbone and use different pendant groups.
FDBs were obtained by decomposing the chemical structures of real polymer SRUs. The first stage was to remove all of the hydrogen atoms and all of the isotopic labels (if present). Isotopic labels are removed for two reasons: (1) they are not used to predict properties—i.e., property values are the same for different isotopomers, (2) we use isotopic labels to indicate connecting points and to denote SRUs. Then, the taken polymer SRUs were divided into backbone and pendant groups. This assumes that the pendant group must be attached to the backbone by a single bond. Atoms connected by a double bond are included in the backbone. Atoms with connected pendant groups were marked in the backbone. In turn, an atom that would be attached to the backbone was also marked in the pendant group. The obtained pendant groups were saved in the PDB.
The backbone is divided into cyclic and acyclic fragments connected by single bonds before being stored in the BFDB as described in Ref. [44]. Unlike [44], the acyclic backbone is not split into separate atoms and bonds but remains as a single connected fragment. In this case, the continuation points of the backbone marked with (*) are placed on a pair of atoms. The connecting points are also observed in the backbone and pendant groups (R1, R2), and in this form, they are saved in the BFDB and PDB (Figure 2) in the format of the MOL file [43].
If there are no cycles in the backbone of the polymer SRU, then all possible ways to represent the repeating structural unit of the polymer SRU have been stored in the BFDB. An example of polychloroprene decomposition into a backbone is illustrated in Figure 3, which shows all possible ways to define the SRU of polychloroprene using single bonds. This method of backbone decomposition solves the problem of obtaining the same set of fragments in different ways of specifying the polymer SRU.
The results of the decomposition of polymer SRUs into fragments are stored in an SDF file, both fragments of the backbone and pendant groups. Thus, to generate fragments, it is sufficient to specify a folder containing MOL files. The FDBs are stored in an SD file created in the same folder. After all the chemical structures were processed, the hydrogen atom was added to the PDB as a separate entry so that hydrogen can be used as a trivial pendant group in the generation of new polymers. The frequency of occurrence of backbones and pendant groups is also stored in the SD file.

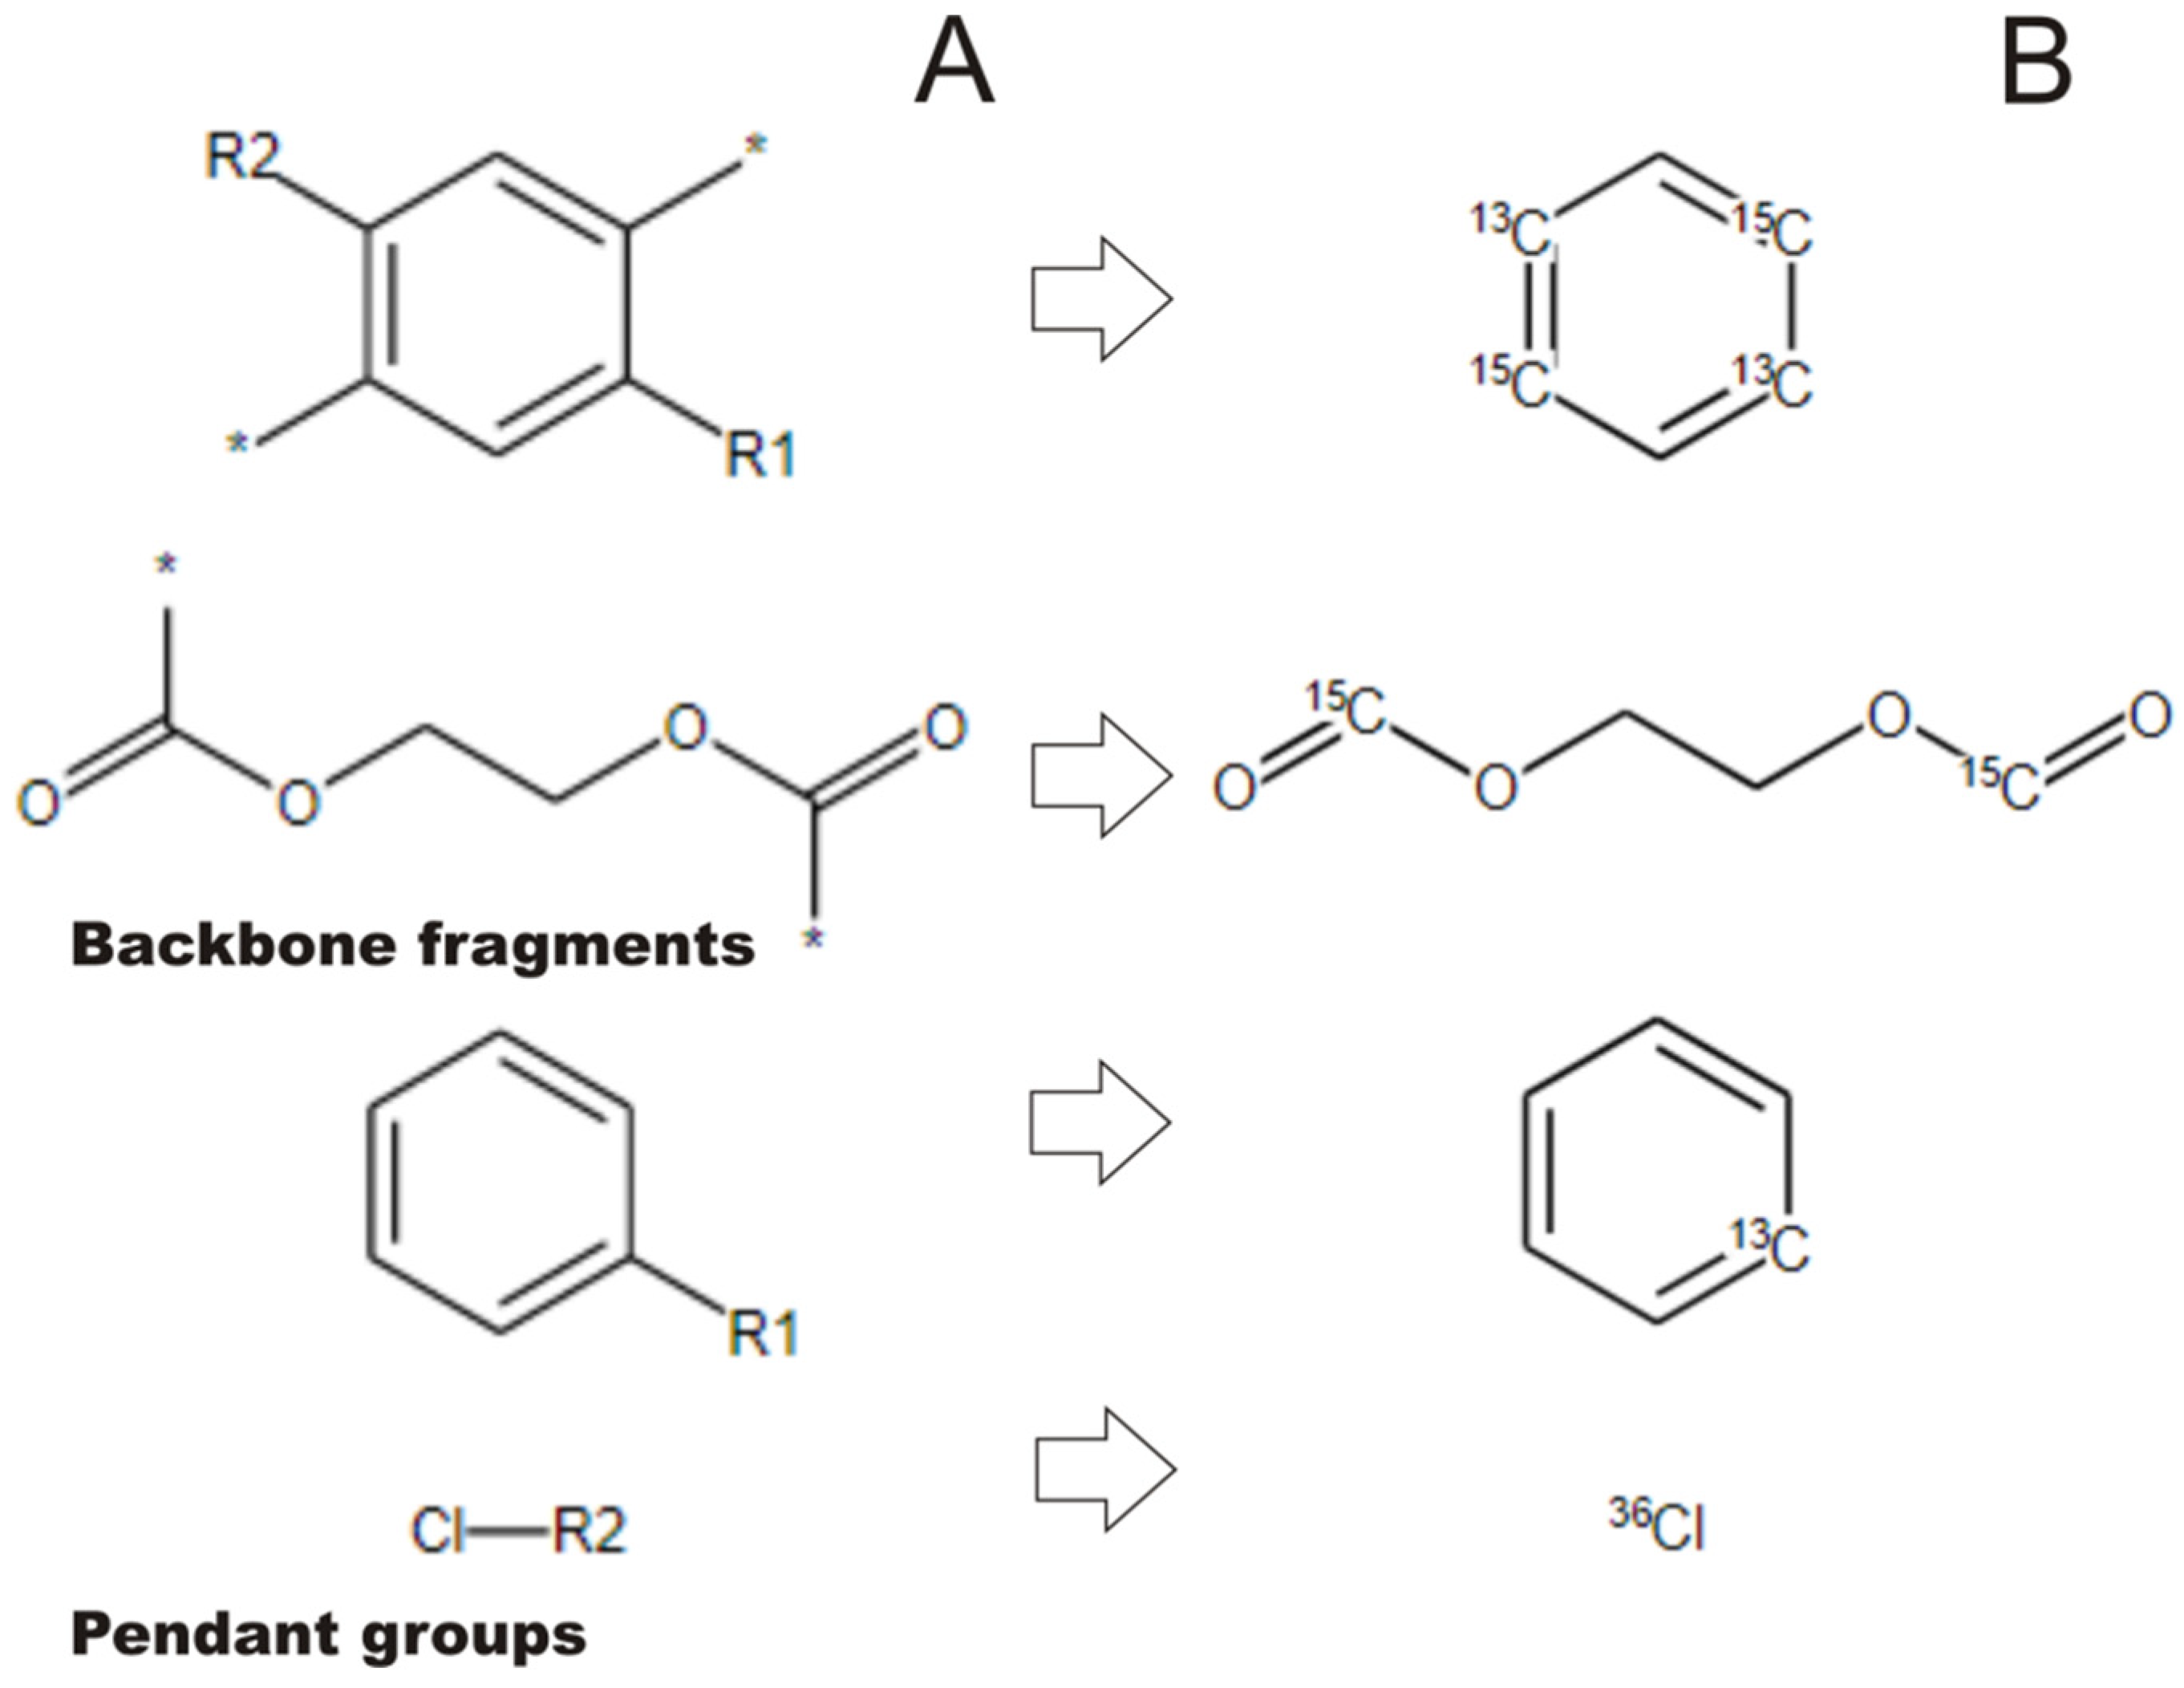
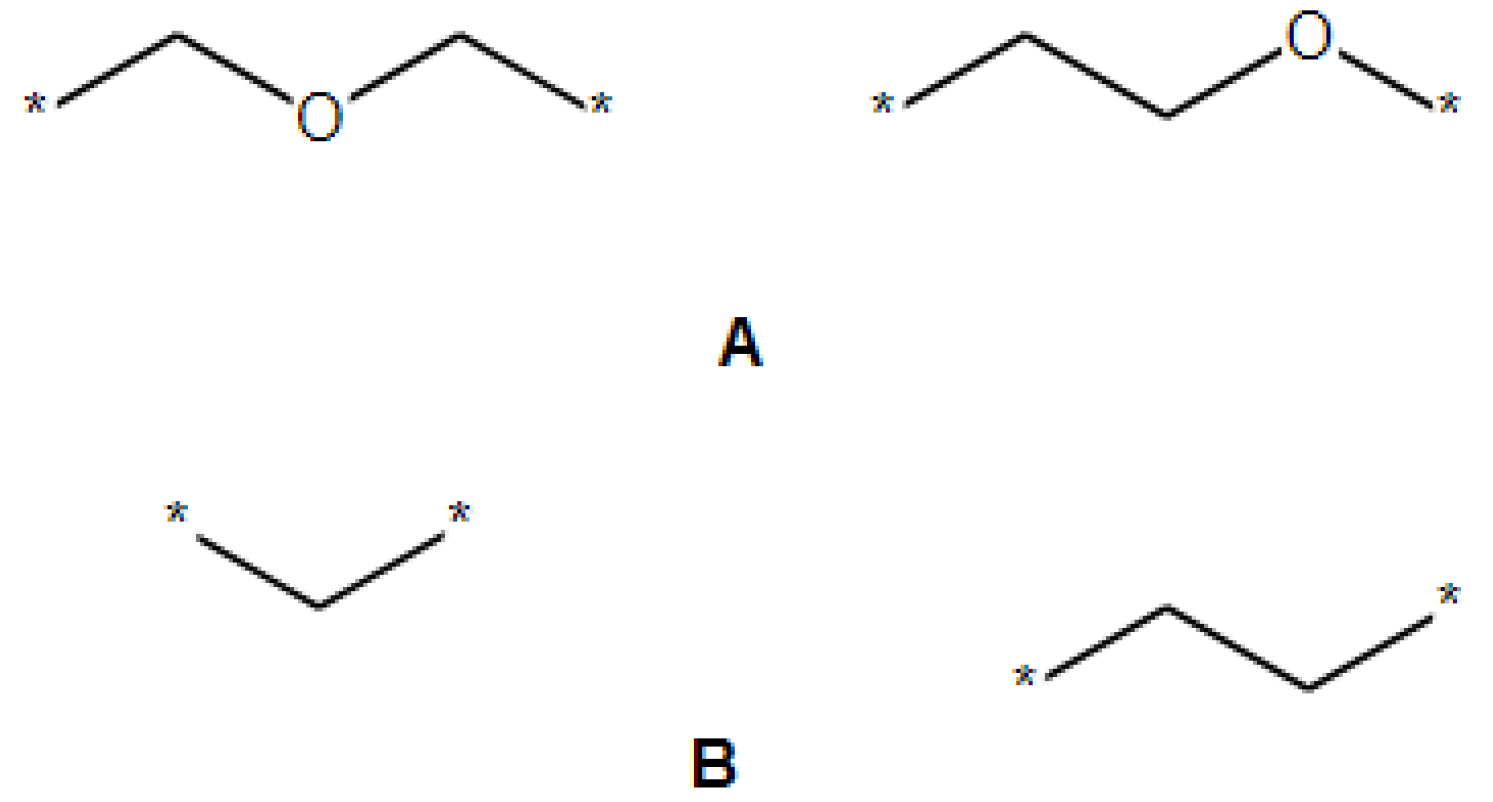
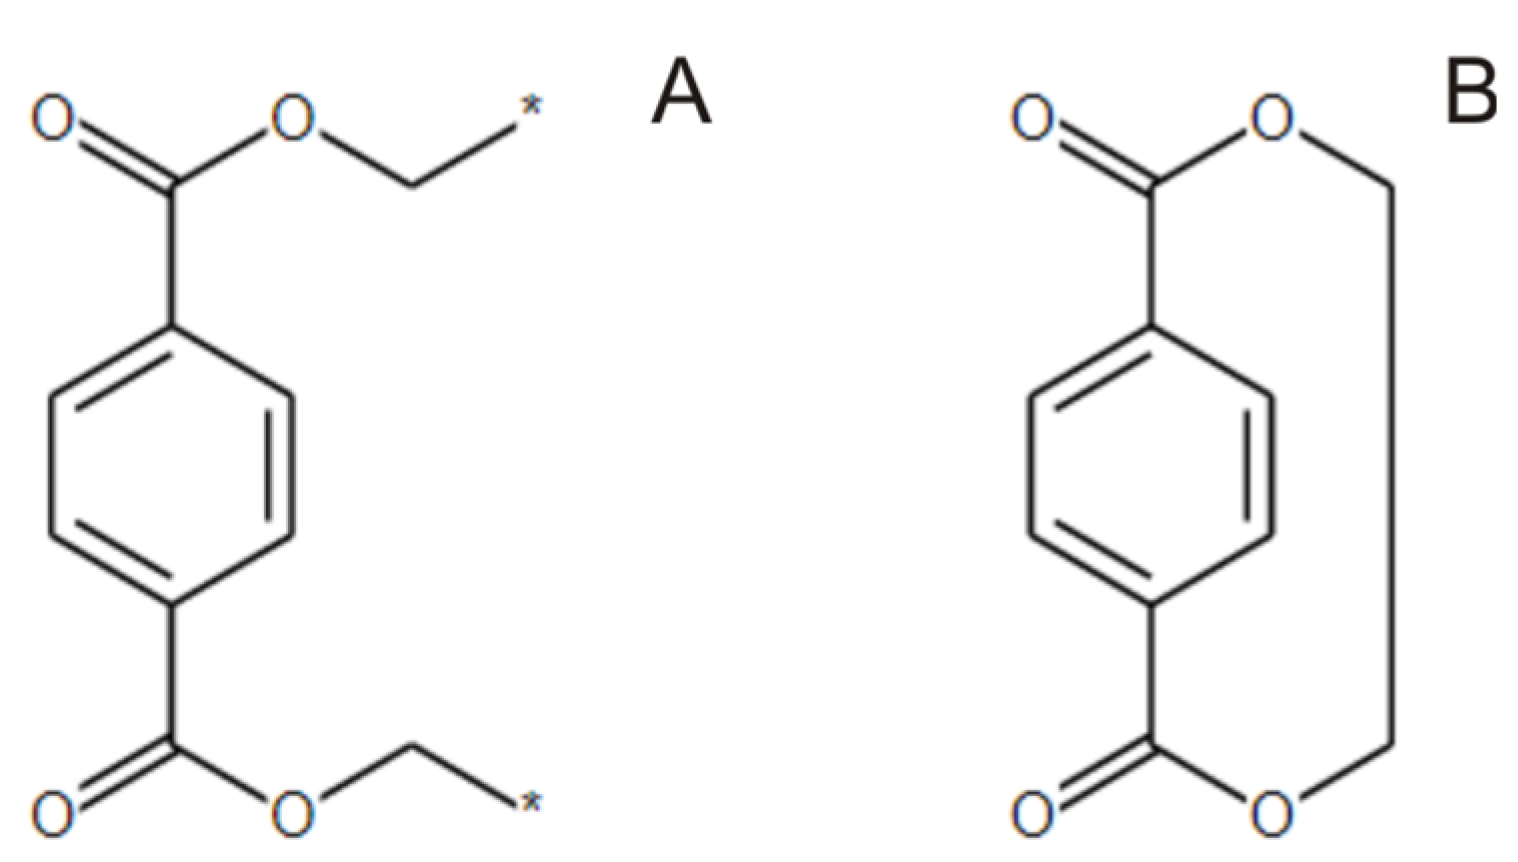
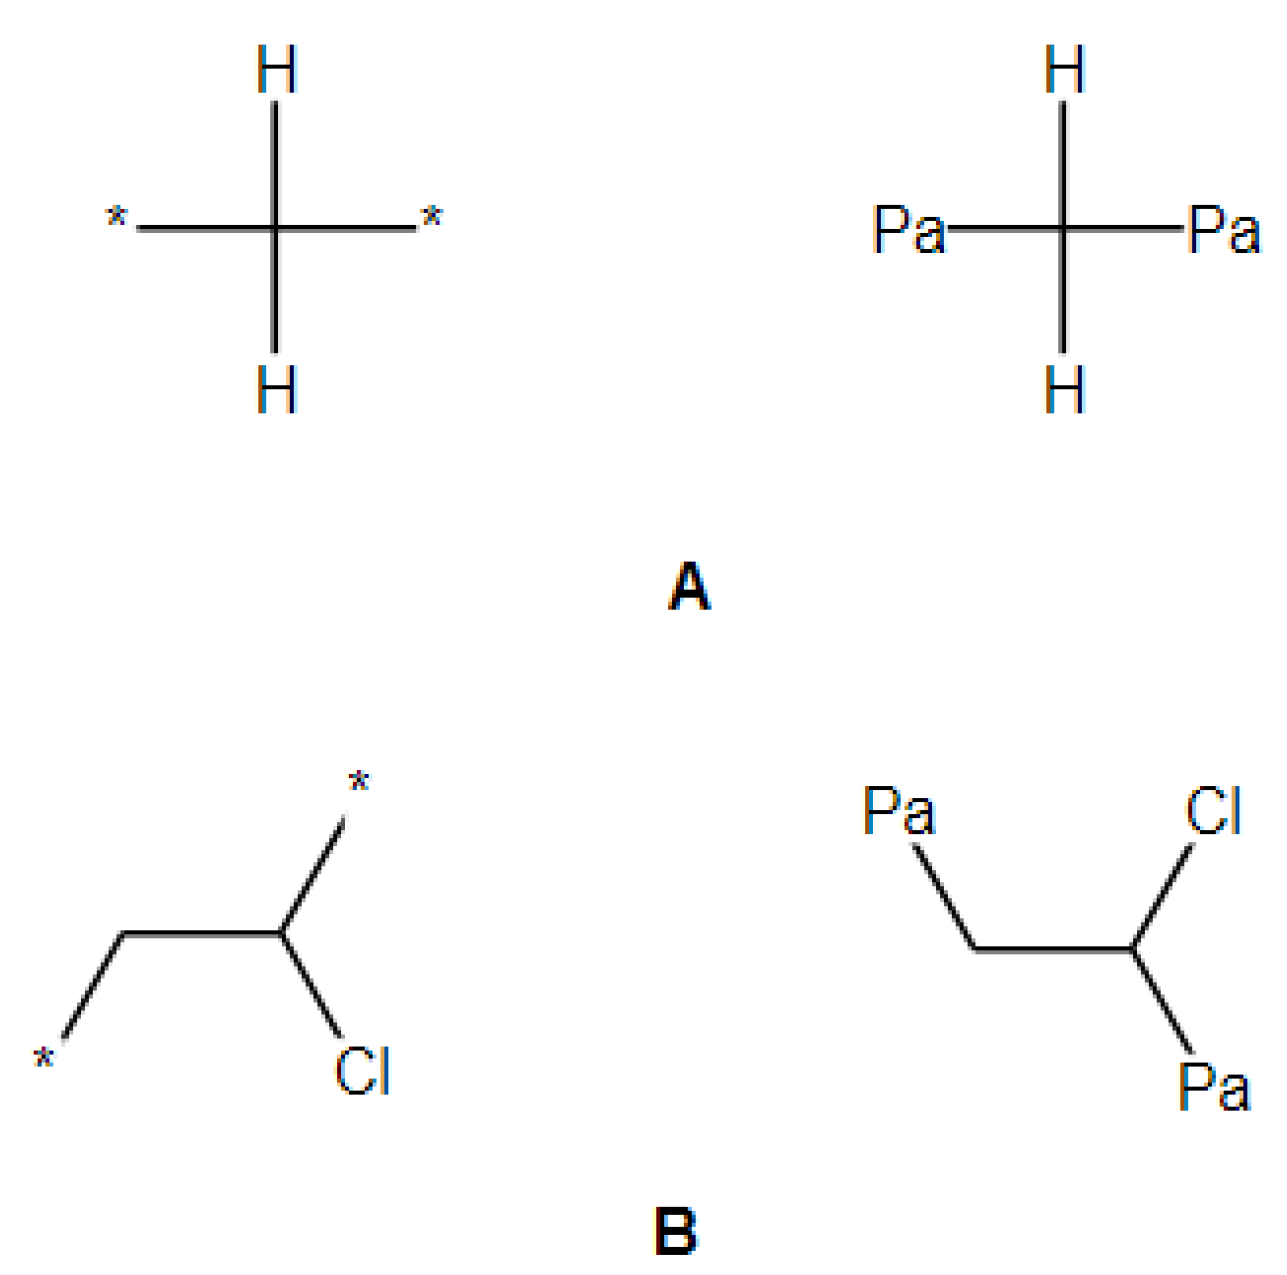
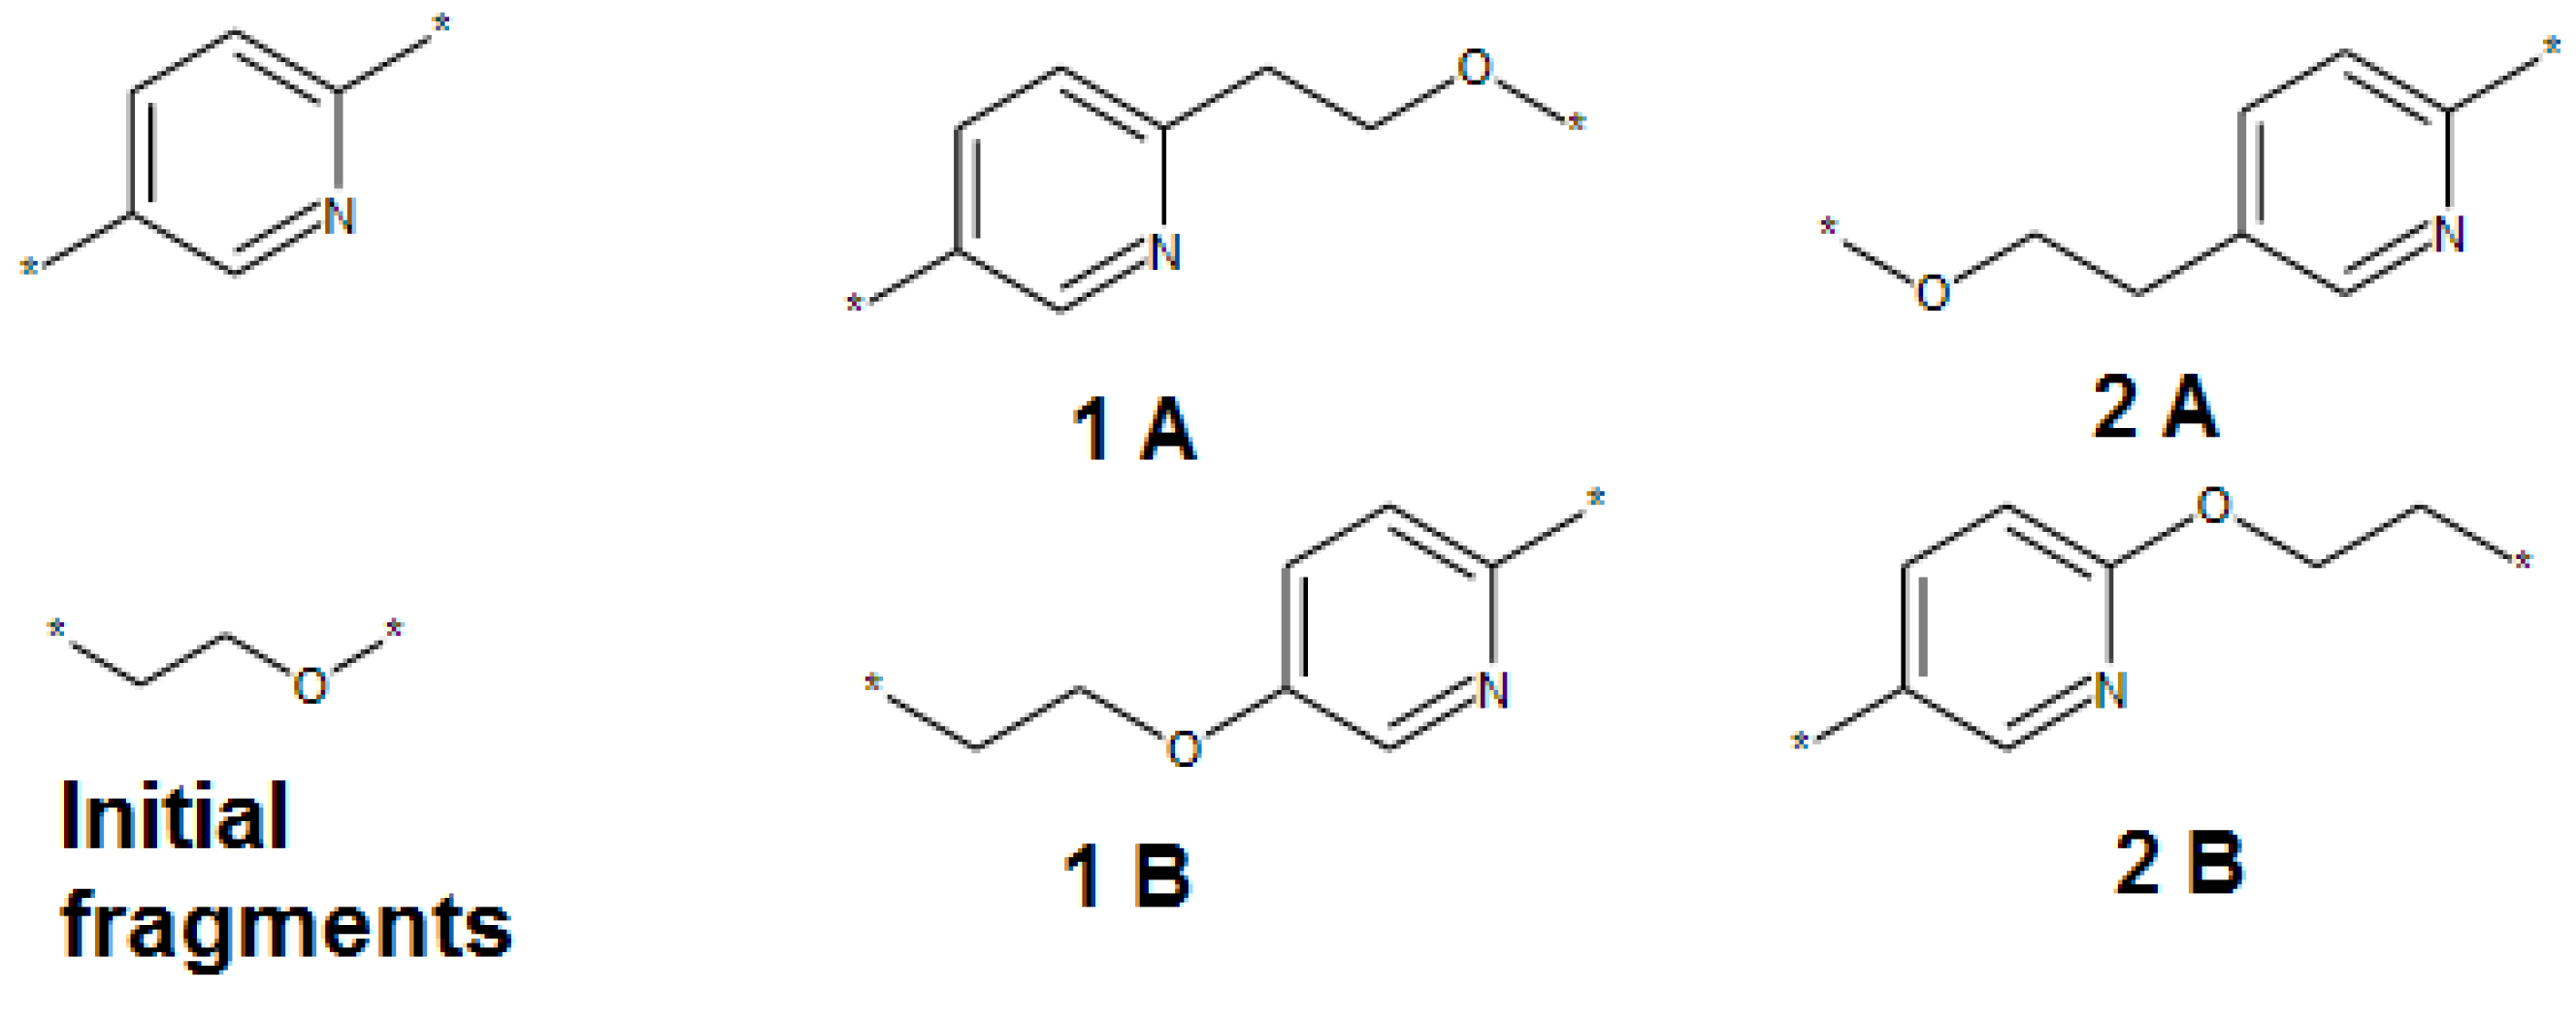
2.2. Transforming Chemical Structures before Searching for Duplicates

This section discusses the filtering procedure used to find unique structures in the PDB and BFDB (Figure 1, points 4, 5). This is important because when new polymer structures are generated, it is necessary to eliminate all duplicate structures obtained at all stages of this process. A modern method for searching for duplicate chemical structures is based on InChIkey comparison [43].
When generating the BFDB, it is assumed that a new backbone is formed from multiple fragments by connecting their backbone continuation points (Figure 1, point 11). With this approach, all different representations of the backbone must be stored in the BFDB to systematically generate the repetitive units of the backbone. Therefore, all structures in Figure 3 are considered unique and stored in the BFDB. In addition, it is necessary to store the connection points of pendant groups to the backbone independently for both pendant groups and backbone fragments. To filter identical structures, the position and number of connecting points must be taken into account. For example, the isopropyl pendant group must be present in the database together with propyl. The simplest solution for filtering structures with connecting points is to use the standard InChIkey for isotopically substituted structures, where atoms with a connecting point of a pendant group (or an atom of a pendant group attached to the backbone) are labeled as isotopic. In this case, the isotopic number of atoms at the backbone and pendant group junctions is increased by one.
This approach also solves another problem. The use of dummy atoms (asterisks as backbone continuation labels) makes it impossible to compute the standard InChIkey to filter out duplicates in the BFDB. Therefore, instead of dummy atoms, we also used an isotopic label.
Excluding exotic polymers with atoms, whose coordination number is greater than four, no more than two pendant groups can be added to a backbone atom. This implies an increase in the atomic isotope by two. Similarly, for the backbone continuation label, the isotope of an atom must be increased by three. A maximum of two backbone continuation labels and two pendant group addition labels can be added for an atom. Thus, the maximum increase in the isotope number of an atom is eight. For any atom, the number of pendant groups is determined as the remainder of the isotope difference divided by three. Accordingly, the flag of continuation of the backbone is determined as integer division isotope differences by three.
Figure 4 shows an example of isotopic labeling of polyethylene terephthalate fragments (Figure 2), where 13C and 36Cl are connecting points of the pendant group, 15C is continuation point of the backbone.
Thus, by using isotopes to identify repeating SRUs and connecting points in backbone and pendant groups to store in FDBs, InChIkey technology selects unique fragments with a unique combination of their alterations. In this case, pairs of structures such as ortho- and para-phenylenes are clearly distinguished. The traditional approach to determining its difference is based on the slow subgraph isomorphism algorithm [45].

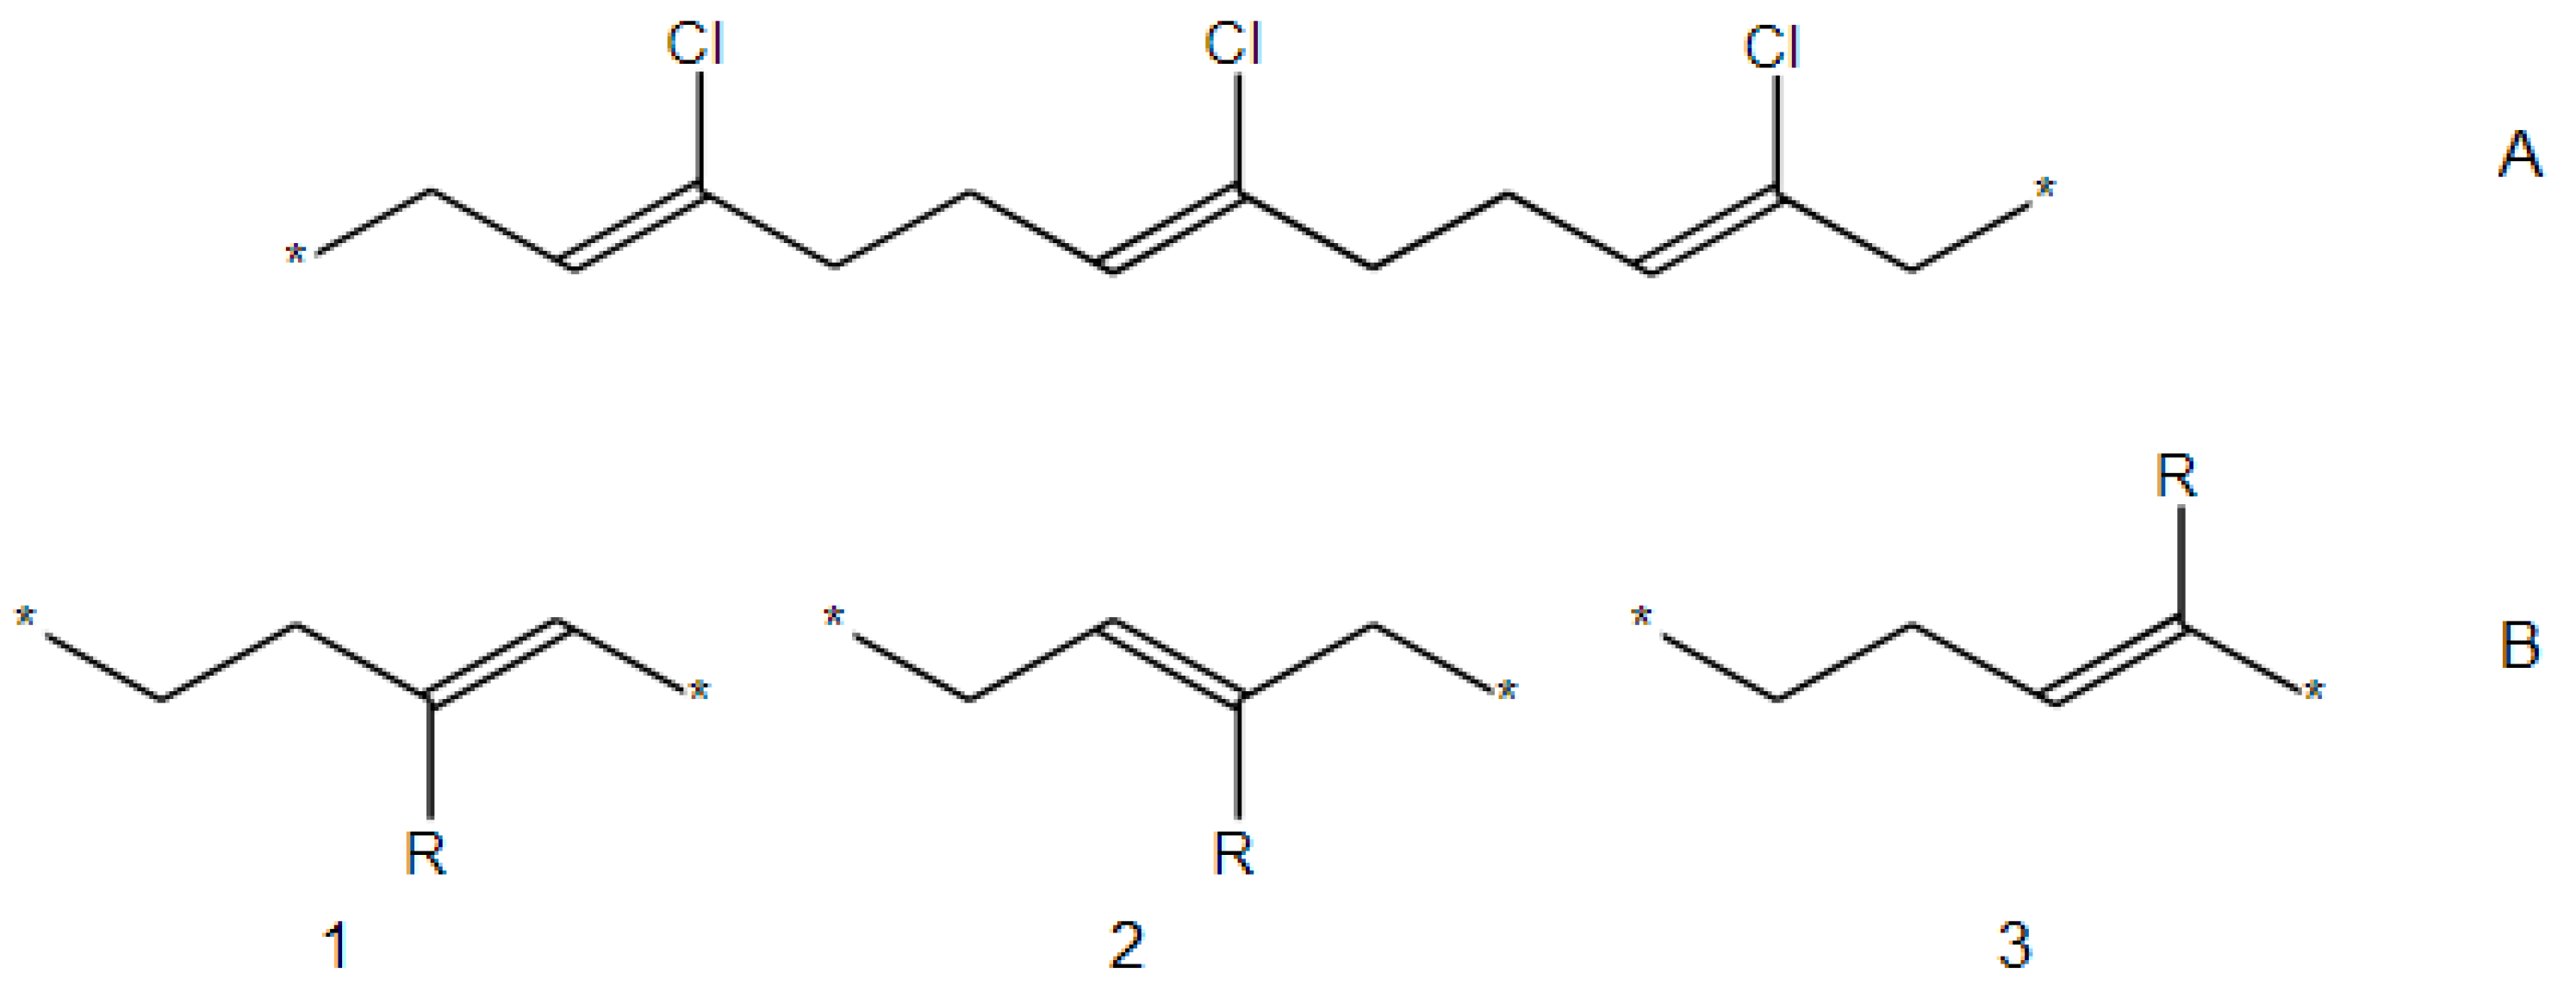
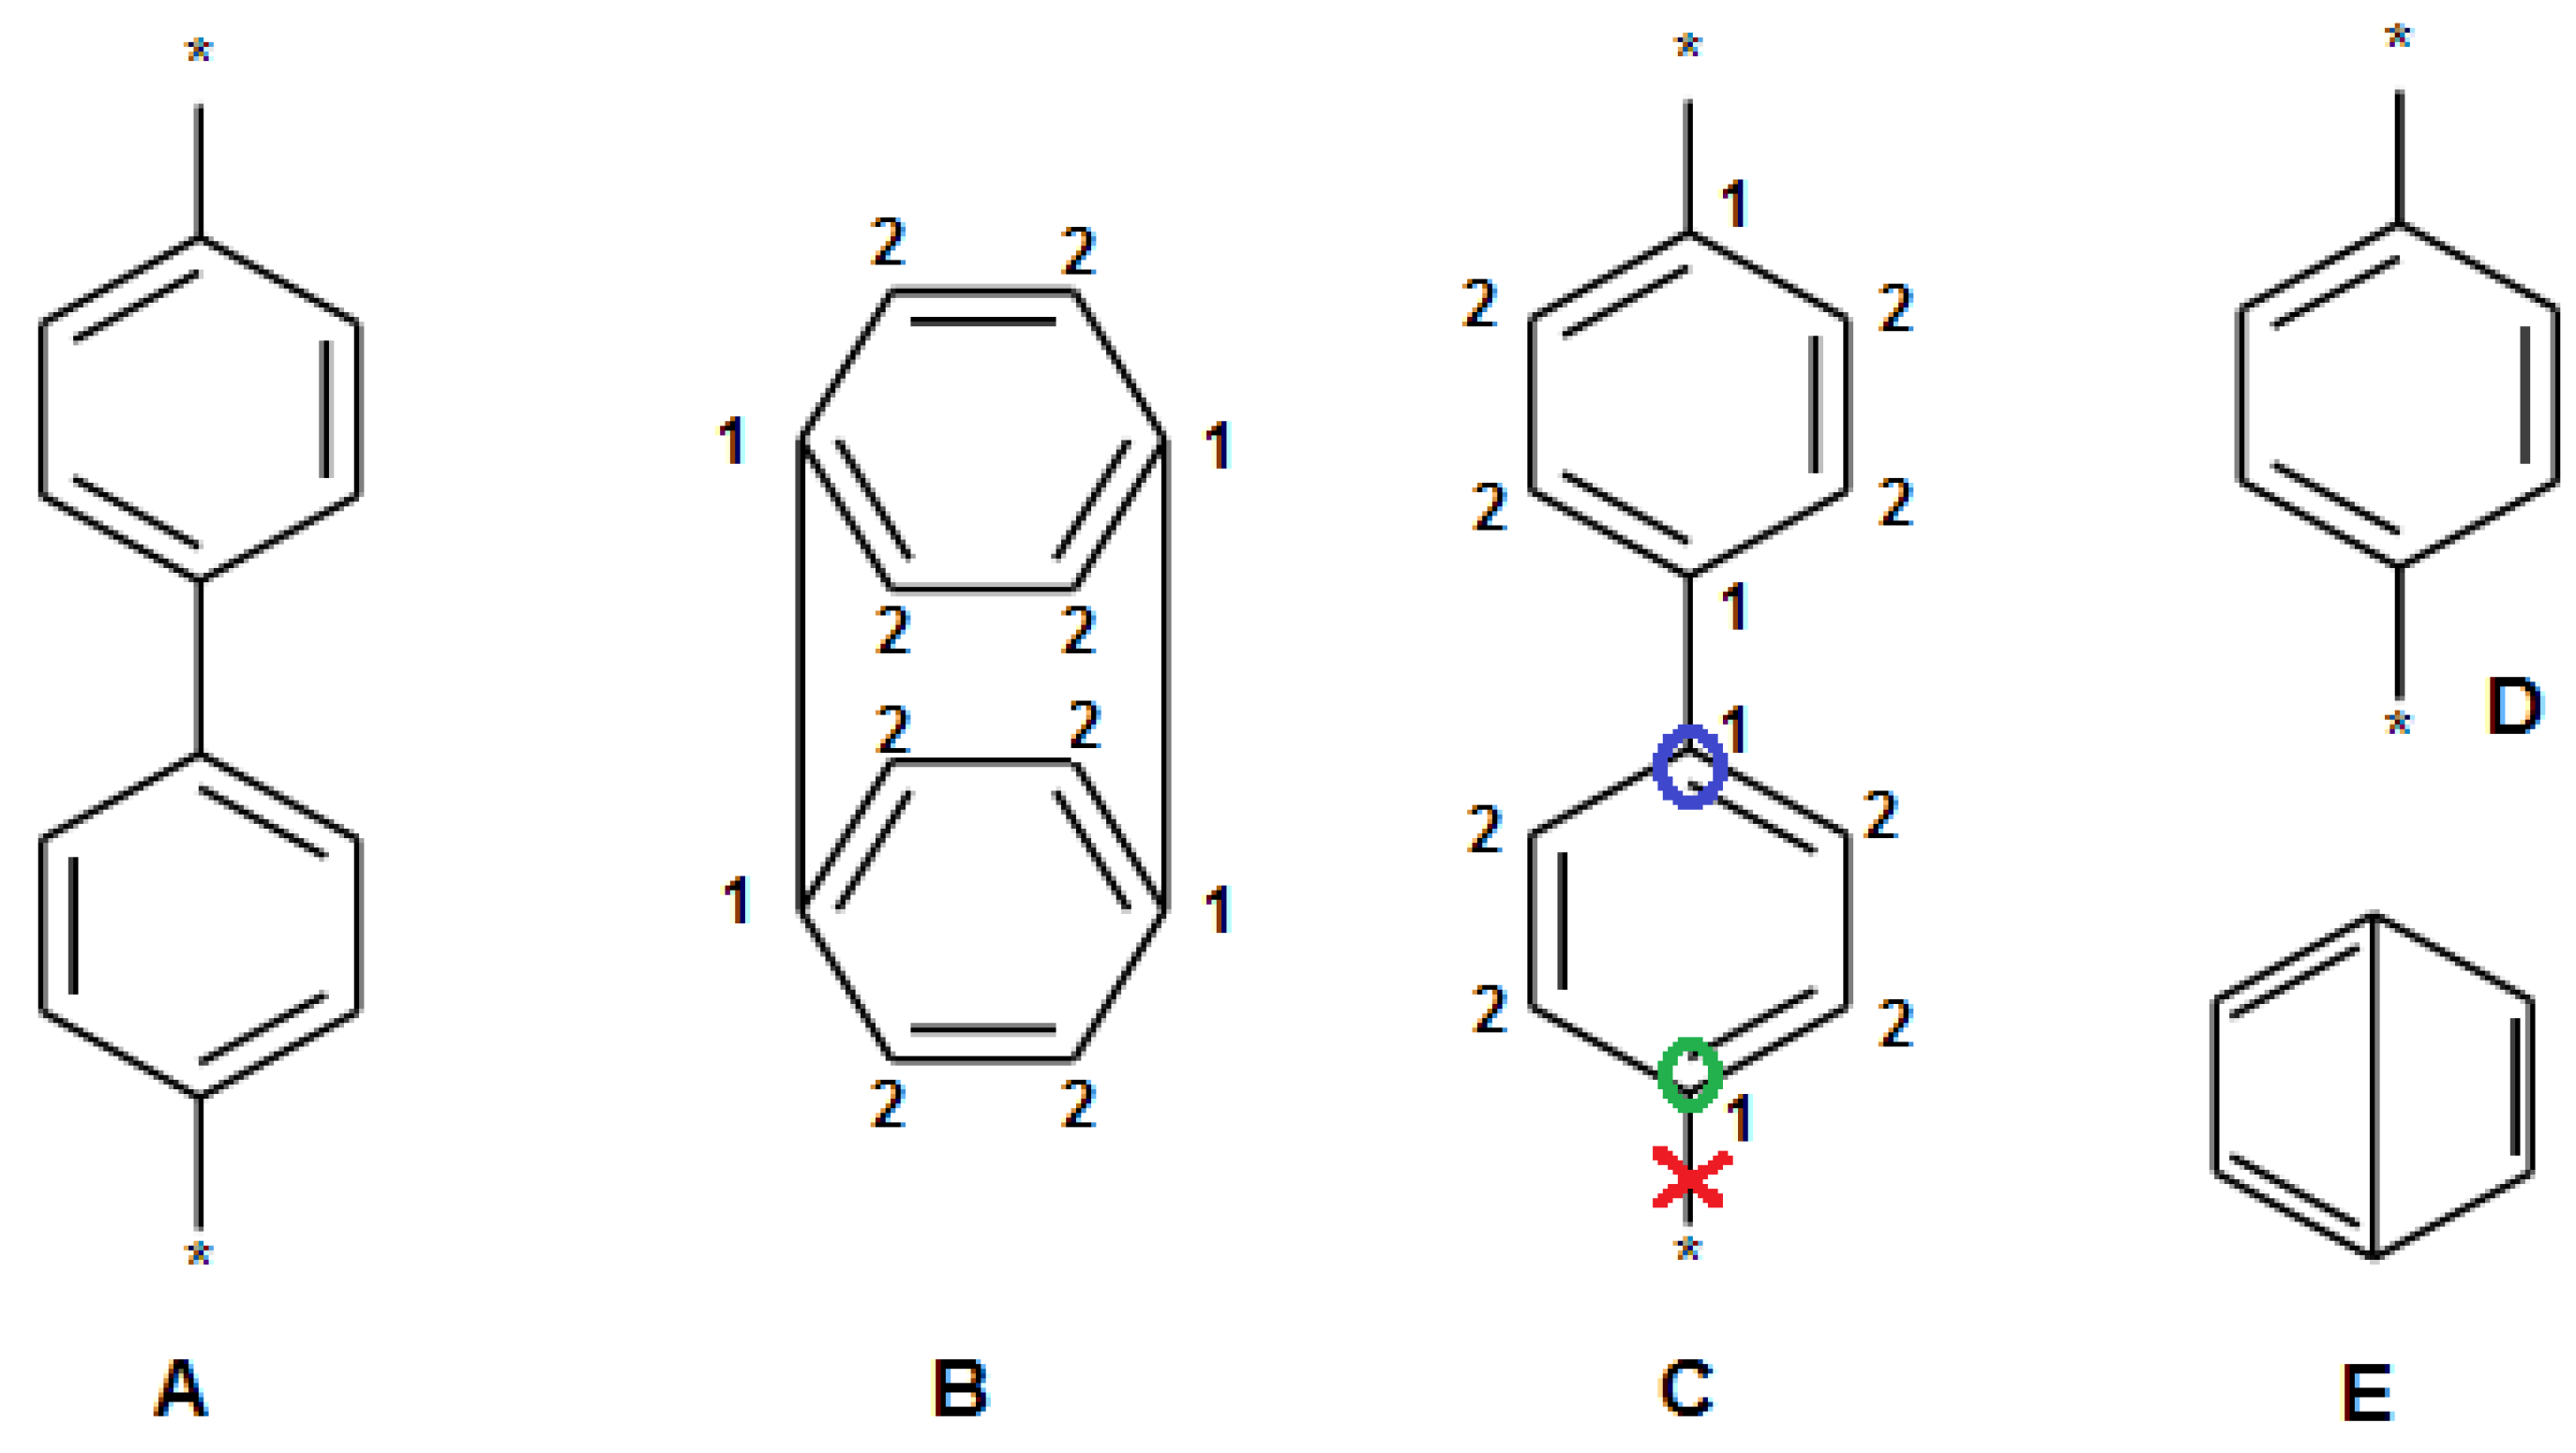
2.3. Filtration of Polymeric SRU Structures

This section discusses chemical structure filtering when creating the SRUDB and its property evaluations (Figure 1, point 15).
Polymer SRUs have three characteristics that make it impossible to use the standard InChIkey to find duplicate chemical structures:
(1)
Dummy atoms with an asterisk (*) to mark the SRU continuation;
(2)
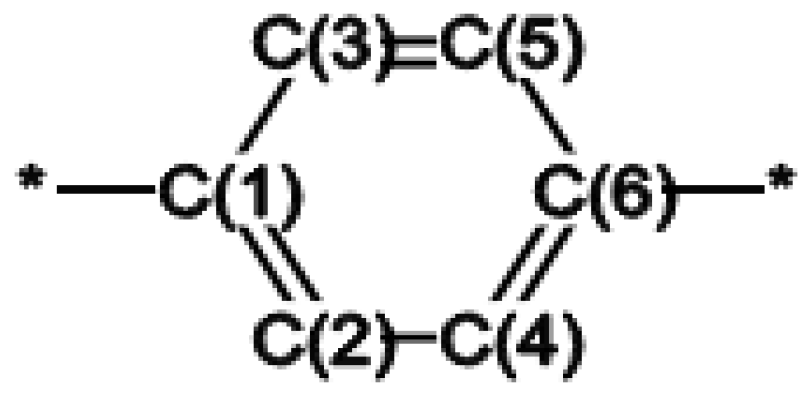
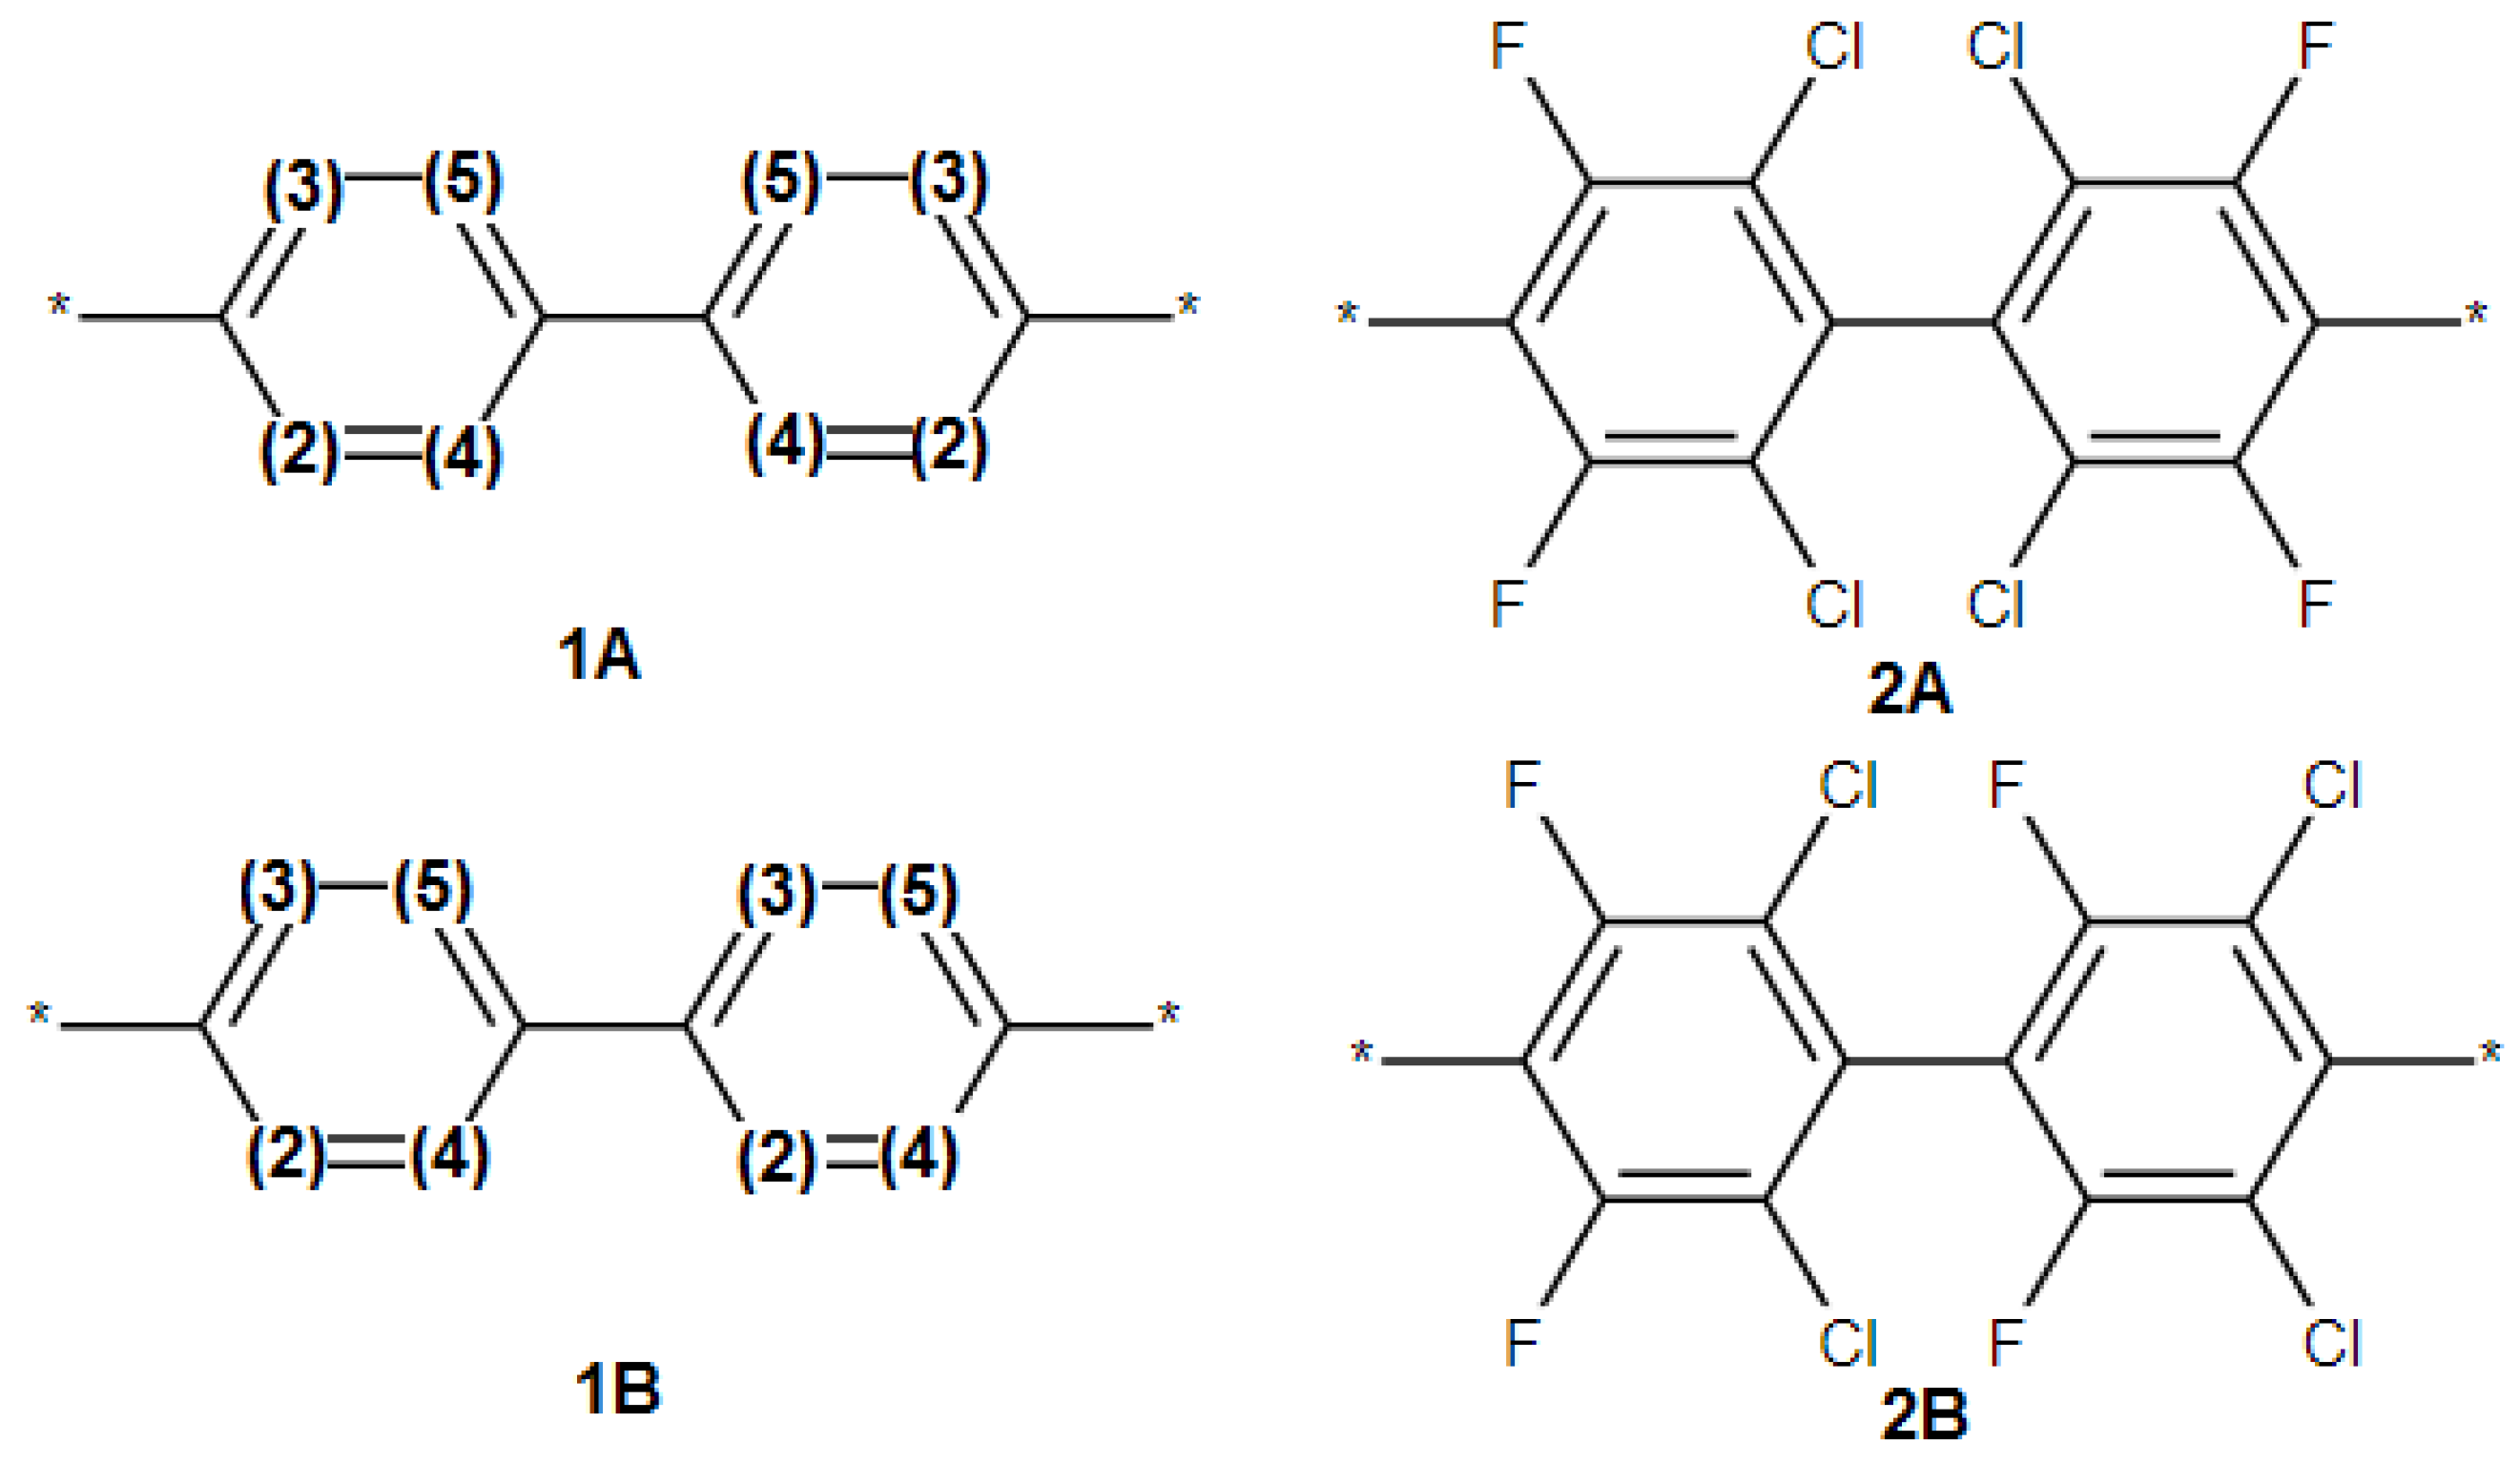
The SRU may be represented by several equivalent chemical structures that are formally different (Figure 5A);
(3)
The polymer repeat unit may contain multiple SRUs, as shown in Figure 5B. For such chemical structures, the corresponding InChIkey must be identical to the InChIkey index generated for the backbone consisting of a single SRU.
Using InChI version 1.06 solves these problems [46]. In this version, the dummy atom symbol (*) is accepted as Zz, so that the structures of Figure 5A are perceived identically and the structures of Figure 5B are also processed correctly. However, in some cases (Figure S1) different InChIkeys are generated for the same structures [47]. This is acceptable for the experimental version, as announced in the InChI 1.06 description [48] for polymers, but makes filtering identical structures unreliable.
When FDBs are created, it is important to filter out duplicate chemical structures that occur during the processing of polymers containing identical fragments. At the same time, it is important to preserve the continuation points of the backbone of the fragments and also to preserve the connection points of pendant groups in the main fragments and groups. Generating new polymers using the determined connection points provides a more realistic database in comparison to adding pendant groups to hydrogen atom positions in the backbone.
Since the calculation of the standard InChIkey for polymers is not provided, and the experimental InChIkey contains errors, it is necessary to transform the structure so that the standard InChIkey can be calculated for it. The idea of chemical structure transformation is that the original structures of the backbone fragments and pendant groups, as well as the generated polymers, are transformed into other structures for which the standard InChIkey can be calculated. Then, duplicates are filtered out, resulting in bases of the backbone fragments, pendant groups, and generated polymers without duplicates. The calculation of the standard InChIkey is well-tested, reliable, and widely used in practice. Of course, the calculated standard InChIkey of transformed structures cannot be used to exchange data and compare structures with other databases, but the InChIkey of transformed structures is ideal as a tool for filtering duplicates.
Unlike FDBs, when creating an SRUDB, it is necessary to filter out different representations of the same polymer SRU, as well as polymers where the repeating polymer unit contains several SRUs. This means that the pairs of structures in Figure 5 must be identical. To solve this problem, polymers with the topological length (the number of bonds between a pair of atoms marked with *) of the repeating unit greater than or equal to two are transformed into a cyclic structure (ring repeating unit) as described in [49]. To do this, the asterisk (*) atoms of the repeating chain are removed and a bond is added between the atoms marked with * (Figure 6).
If the topological length of the backbone was zero or one, the asterisked atoms were replaced by the rare element protactinium (Pa) because it is impossible to compute the standard InChIkey for an asterisk (*) atom (Figure 7). For polymer SRUs with a chain length less than or equal to one, it is impossible to generate a cyclic backbone structure. However, for such polymers, the ambiguity of the backbone representation disappears. For cyclic SRU structures or fragments containing a Pa atom, the standard InChIkey can be calculated and then used to filter and search for duplicates.
The next step in filtering new polymer structures is to deal with the situation where multiple SRUs are contained in the polymer backbone (Figure 5B). To obtain an identical InChIkey, it is necessary to transform the polymer structure so that the polymer contains a single SRU in the backbone. This is done when calculating the experimental InChIkey for polymers [46], but the algorithm is not described.
The number of identical fragments in the repeating unit of the polymer was counted in transformed structures, cyclic (Figure 6) or with Pa atoms (Figure 7). It should be noted that if the topological distance between the atoms marked as the continuation of the backbone is zero (a pair of star atoms is connected to one atom), then such a structure is considered an SRU. Note that no SRU contains less than one atom. If the topological distance is equal to one (a pair of star atoms is connected to a pair of neighboring atoms), then their topological equivalence is checked. To do this, starting from each atom of a pair of neighbors, a tree is created consisting of the paths from the selected atom to the next atoms, from these to the next, and so on, until the structure is traversed. Pendant groups are taken into account when forming a tree whose vertices are the chemical symbol of the atom and the type of bonds (single, double, triple, aromatic) used as paths to that vertex. The tree is sorted to make it canonical and to speed up further comparisons. Then, the trees for each pair of atoms are compared. If they match, a pair of atoms is considered topologically equivalent and they are assigned the same identifier. If the identifiers of a pair of neighbors are the same, then such a structural formula of the polymer contains two SRUs. Therefore, to obtain a structural formula with one SRU, one of the neighboring atoms is replaced by protactinium and all atoms attached to it are removed. Examples of such compounds are polyethylene (*-CH2-CH2-*) and Teflon (*-CF2-CF2-*). These structures are converted to Pa-CH2-Pa and Pa-CF2-Pa, respectively.
As an example of how to calculate the number of SRUs in the backbone for compounds with a topological distance greater than one between atoms marked with asterisks, consider poly(p-p-′)-biphenylene (see Figure 8). It is indicated as poly(p-,p-′)-biphenylene in Figure 8A. First, the equivalence of the atoms in the main chain is determined and a repeating cyclic unit of the polymer is formed (Figure 8B). A substituent tree was then constructed for each backbone atom, including the pendant groups, as described above. After comparing the trees, all atoms with identical environments were assigned the same integer number. For the cyclic structure of poly(para,para’)biphenyl, there are only two types of atomic environment, numbered 1 and 2 (Figure 8B). In total, there are four atoms with a conditional topological identifier of one and eight atoms with an identifier of two. For atoms of the first type, the concept of a minimum number of equivalent atoms NMinEq is introduced. In this example, NMinEq = 4.
If NMinEq is one, the original structure is an SRU and the standard InChIkey is computed for the cyclic structure. A further search for identical fragments in the SRU is performed only if NMinEq is greater than one. The calculation of the path starts from one of the atoms of the cyclic structure that was associated with the chainrepetition mark (*) in the original structure. In Figure 8C, such an atom is marked with a green circle. The connection to the asterisk atom is considered dead, and the remaining connections are used as paths to find neighboring atoms. Next, its neighbors are searched, and so on, until an atom is found that is topologically equivalent to the original atom (Figure 8C, green circle). Then, all the atoms of the main chain that are not on the search path and the groups attached to them are removed, and an asterisk atom is added to the last atom found (Figure 8C, blue circle). This results in the SRU shown in Figure 8D. The last step is to calculate the standard InChIkey for the cyclic SRU (Figure 8E).
The total computation time for this procedure is proportional to N2, where N is the number of atoms in the molecule.

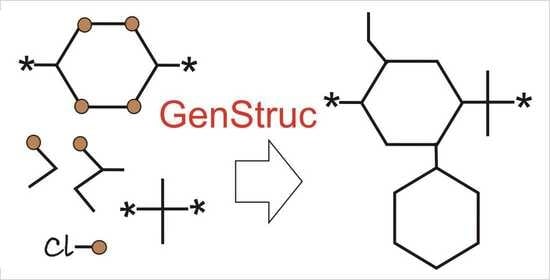
2.4. Generation of New Polymer SRU Structures

The problem of generating new polymer SRU structures arises when searching for polymers whose extreme values of properties are greater (or smaller) than those known (experimentally obtained and studied). For this purpose, we build a separate PDB and BFDB (Figure 1, points 6 and 8). Generation starts with the selection of backbone fragments and pendant groups. The choice of fragments is motivated by the classes of polymers to be studied. Fragments are selected according to the properties that the new polymer should have. For example, if minimum water vapor permeability is required, methylene and phenylene are chosen as backbone fragments and chlorine, fluorine, and hydrogen are chosen as pendant groups. When creating new structures, the backbone is created first, and then the pendant groups are added.

2.4.1. Polymer SRU Backbone Generation (Scaffold)

Two algorithms have been implemented to generate the backbone repeat unit from selected fragments, namely (1) enumeration and (2) Monte Carlo. The number of fragments in the new SRU is defined by the parameter Nfrag. In the enumeration algorithm, all possible combinations are used to build new polymer repeat units with the defined number of Nfrag. In the case of the Monte Carlo algorithm, each combination of fragments used is chosen randomly. The use of MC allows different classes of polymers to be generated in a reasonable time. Either calculation can be stopped after the specified time or after a predefined number of unique polymer SRUs have been generated. This approach avoids the combinatorial explosion that can occur in the enumeration method, where all possible combinations are considered.
To increase the number of variants of chemical structures, our generation procedure provides a special option to vary the number of fragments in the backbone SRU. When this option is enabled, the parameter Nfrag is treated as the maximum number of fragments in the backbone, which varies from 1 to Nfrag. The enumeration algorithm uses all possible combinations of the number of fragments in the backbone, and the Monte Carlo algorithm randomly chooses the number of fragments in the new backbone from 1 to Nfrag. Note that this results in a random backbone.
Consider the ambiguity of the generation process associated with the non-equivalence of the “head” and “tail” of the backbone fragments. This problem is illustrated in Figure 9, which shows all four possible chemical structures for polymers of oxyethylene and 2,5-pyridinediyl. However, due to the possibility of representing the SRU in different ways, using any acyclic single bond to indicate chain continuation marks, two unique structures are generated, denoted by the numbers one and two. It can be seen from Figure 9 that the 1A–1B and 2A–2B structures are equivalent. Therefore, when generating new backbones, it is important to consider and vary the orientation of the fragments (head-to-tail and head-to-head).
To overcome the problem, it is necessary to generate all combinations of backbone fragments using the enumeration algorithm. In the case of the Monte Carlo algorithm, at each step the backbone fragments are randomly selected, as well as the links (head-to-tail, head-to-head, tail-to-tail) and the pendant groups. The latter are attached to all possible connection points. Using the Monte Carlo method, it is possible to significantly increase the diversity of generated polymer SRUs in a reasonable amount of time.
The enumeration algorithm connects all possible pendant groups in any combination with the connection points. This usually requires a large amount of computation. It is also possible to specify a list of pendant groups for each atom of the backbone to which the pendant groups are attached. It is therefore important to avoid repeating the chemical structures of the backbone in cases where it does not lead to the loss of generated chemical structures. Namely, when the enumeration algorithm is used to generate structures that do not contain a list of pendant groups for atoms in the backbone. The duplication of backbones is checked by calculating the InChIkey before starting to add pendant groups and comparing it with the InChIkey list of backbones already used to generate the polymer SRU. If there are lists of pendant groups, then in this case it is necessary to consider all possible combinations of backbone structures, including duplicates.
Consider the generation of polyhalophenylene structures to better understand this problem. Figure 10 shows how the atoms in paraphenylene are numbered. The chlorine atom can be bonded to the 2,3,4,5 positions, and the fluorine atom can be bonded to the 2,3 positions. Assume that the number of para-phenylene fragments in the repeating unit of the polymer is two. It is possible to generate two different SRUs containing two fluorine atoms (Figure 11). When generating, it is important not to lose the unique structures that result from the orientation of the fragments.
That is, in the presence of lists of pendant groups for backbone atoms, it is not useful to check the backbone for the identity of previously used polymers as this will result in the loss of unique structures. This check should also not be performed if there is a list of pendant groups for individual backbone atoms. However, if polymers are generated by substituting hydrogen atoms in the backbone composition, such checks will avoid the formation of identical structures.

2.4.2. Adding Pendant Groups

To add pendant groups to the backbone, our program has the option to use the hydrogen atoms of the backbone for pendant group substitution in addition to the pendant group connecting points.
We use filters during the formation of backbone bonds of pendant groups, as well as during the assembly of the backbone. Barrier filters are used to form bonds between oxygen and nitrogen atoms (O-O, N-N, N-O) and between oxygen, nitrogen, and halogens. This helps to remove unstable peroxides, hydrazides, and oximes.
The Monte Carlo algorithm allows for the setting of group weights when randomly selecting a pendant group. By default, all side groups for a given backbone atom have a weight of one and the same probability of selection. For weights other than one, the probability of selecting a given pendant group is equal to its weight divided by the sum of the weights of all pendant groups for a given atom.
In addition, the ability to specify a list of pendant groups for each atom in the backbone was taken into account. Atoms in all selected groups of the backbone are numbered. When selecting pendant groups, it is possible to specify the number of atoms in the backbone (Atom Numbers control) to which this pendant group is attached. If the list is defined for at least one of the atoms, the use of bond points and the option to “Use Backbone Hydrogens as Connecting Points” will be disabled when using the enumeration algorithm.

2.5. The Program Description

One of the goals of our work is to create a program for generating and predicting the properties of polymers. With this program, a user can generate new polymer SRUs using the enumeration and Monte Carlo algorithms, with various options described above in the text. It is also possible to predict properties for a single polymer, as well as for multiple structures stored in the SD file [43]. When predicting a single structure (*.mol file), the results are stored in the XML format for reading in external applications and HTML format with a user-friendly page (Figure S2 and Table S1 in the Supplementary Materials file). If more than one chemical structure is considered (*.sdf file may contain more than one structure), a new SD file is created that contains fields with predicted properties. Any chemical database program, e.g., ISIS/BASE [50] or CheD [51], can read this file. These records can then be sorted by property values and exported to Excel for further processing (printing, visualization, statistical processing, etc.).
The program is made up of four blocks:
  • Creation of FDBs (Figure 1, upper part, points 1–8);
  • New polymer SRU generator (Figure 1, bottom part, points 10–15, 17);
  • Prediction of polymer properties (Figure 1, point 16);
  • Graphical interface for setting the initial conditions for the generation of structures.
All these program blocks are implemented in the QtC language and were included in the MULTICOMP software package [52]. Blocks 1 and 2 (generation of fragments from SRUs stored in *.mol files and generation of polymer SRUs from the fragments) contain many common modules and are combined into a single GenStruc program.

2.5.1. GenStruc Program

The program is a console application written in C++. Depending on the input parameter, it can split the backbones of the polymers into fragments or leave the backbones unchanged. The result of the program run is FDBs, which are stored in the SD file [43].
It also uses FDBs to generate new polymer SRU structures. The following generation options are available:
(1)
Selection of parts of the databases from the backbone fragments and the pendant groups for the generation process;
(2)
Two generation methods: (a) enumeration of all available combinations of backbone fragments and pendant groups and (b) Monte Carlo algorithm;
(3)
In addition to the connecting points of the pendant groups extracted from the initial polymer set (Figure 1 point 1), hydrogen atoms attached to the backbone can also be used as additional connecting points;
(4)
One can specify the list of pendant groups for each atom of the backbone;
(5)
Setting the number of the fragments to generate the backbone of the polymer SRU. It is possible to use a variable number of fragments to generate the backbone as well as to filter the backbone by molecular weight;
(6)
Setting the weights of pendant groups when using the Monte Carlo algorithm. In this version of the program, the weights are the same for all connection points, but in the future it is planned to implement individual weights for each connection point;
(7)
Stopping the calculations when the specified number of chemical structures or the specified run time is reached;
(8)
The built-in filter blocks the formation of oxygen–oxygen and oxygen–nitrogen bonds in the backbone and halogen–nitrogen bonds when pendant groups are added. If such bonds are present, the structure is discarded and the program moves on to the next compound (the enumeration algorithm) or the new backbone fragments and pendant groups are reselected for SRU generation (the Monte Carlo algorithm).
This program launches the PolyPred program (see next section), which is used for property prediction. The generated polymer SRU structures and property values are saved in an SD file [43].

2.5.2. PolyPred Program

The program is a console application written in C++. It predicts polymer property values using Bicerano regression models [11].
The program has the following limitations:
(1)
Allowed chemical elements in the polymer composition are C, H, N, O, F, Si, S, Cl, and Br;
(2)
Two asterisk atoms are used to denote an SRU. The program does not handle carcass structures, grafted chains and block copolymers, or spatial polymers (where multiple asterisks must be used to denote an SRU);
(3)
Each asterisk must have a single bond to a single atom;
(4)
Polymers with isotopes are not processed; all isotope labels are removed before processing.
The program takes as input parameters *.mol files with the structures of the polymer repeat units and a list of properties to be predicted (Table 1). It is possible to predict properties for several structures; in this case, the input parameter is the SD file [43]. When predicting properties for multiple structures, the prediction results are stored in one SD file. For a single structure, the prediction results are stored in an XML file, which is then used as an input file with data for MULTICOMP [52], and also in a HTML format for visualization (Figure S2, Table S1).

2.5.3. Program Generation Run

A graphical interface (QtC) for creating a file with initial data for the GenStruc program (Figure S3).
The program is used to select the parameters for the generation of a polymer SRU and the list of properties to be predicted in the PolyPred program. More details can be found in the user manual [53] (file DocumentationEng.docx).

3. Results

In the course of our work, two problems were solved: the design of polymers with maximum and minimum values of properties among the studied classes of polymers (searching for “hits”) and the design of new polymers with extreme properties. A “hit” is a polymer that has the maximum or minimum value of any property. The search for “hits” is carried out by varying the pendant groups for the backbone of the polymer SRUs described in Ref. [11] (Figure 1, process path 7→14→13). The pendant group list is also generated from the polymers described in Ref. [11]. The use of filters (prohibiting the formation of chemically reactive bonds such as O-O, N-halogen, O-halogen) allows the realistic generated structure to be obtained for successful synthesis in the laboratory. An additional factor that improves the adequacy of structure generation is that the database contains the backbones and side groups of the already known polymers. The generation of the new polymer begins with the generation of the backbone using fragments of the backbones of polymers described in Ref. [11] (Figure 1, process path 8→12→11→14). Then, the pendant groups in the generated backbones are varied (Figure 1, point 13).
The polymer properties studied in this publication are listed in Table 1.

3.1. The Design of “Hits”

As mentioned above, the term “hit” means a polymer that has the maximum or minimum value of a property. All the properties of interest to us are summarized in Table 1. At the same time, for an intensive property (independent of the mass of the polymer, e.g., refractive index and specific heat capacity), the hit was estimated from both the lower and upper values of the property. “Hits” for an extensive property were registered only for the lower limit when the property value was at its minimum. The maximum value of an extensive property can easily be increased by adding pendant groups or by including several identical repeating units in a backbone. Some trivial extensive properties that depend on the choice of the polymer repeating unit, such as polyethylene–polymethylene (e.g., molecular weight or length of the repeating unit, which depend on the choice of the polymer repeating unit) were not considered when searching for “hits” or new polymers.
To design “hits”, we used the set of 811 polymers described in Ref. [11] (Figure 1, point 1). This set contains the actual polymers used to train Bicerano’s model. To build PDB and BDB (Figure 1, points 6, 7), we selected an SRU with two or fewer pendant groups, including polymers without pendant groups, a total of 301 polymers. A total of 282 backbones were generated (Figure 1, point 7) (some polymers contained identical backbones). Backbones with different connecting points and/or different backbone continuation marks were considered different.
The PDB (Figure 1, point 6) was generated from the polymers dataset (Figure 1, point 1) studied in Ref. [11]. The choice of data [11] is because the properties of polymers are predicted by Bicerano regression models. For all polymers, we found a total of 332 unique pendant groups (identical pendant groups with different connection points were considered different).
Using the enumeration method (scaffold-based generation) [36], all possible structures were generated for 282 backbone SRUs (scaffolds) and 332 pendant groups—more than 15 million combinations, while only 5,473,745 of them are unique [53] (files ZeroTwo.zip and ZeroTwo.z01). Several properties (Table 1) were predicted for 5,142,153 chemical structures. The prediction results (minimum and maximum values of properties and identifiers of extreme structures) are shown in Table S2.
It should be emphasized that only 301 polymers from the Bicerano DB data were used to extract the backbone of the simulated compounds and to form the ZeroTwo database. The remaining 510 polymers should be considered as a test dataset that only contributes to the property values of the Bicerano DB dataset.
Examples of polymer structures with extreme properties are given in Table S3 (ZeroTwo) and Table S4 (Bicerano DB) in the Supplementary Materials file. Because we use the backbone SRU and pendant groups of already known polymers to generate new structures, there is a high probability that they can be synthesized experimentally.
Thus, there is a theoretical possibility for further modification of widely used polymers with known pendant groups to create polymers with improved properties.

3.2. Design of New Polymers

The search for new polymers involves not only the use of already known backbones but also the generation of new ones that have not yet been encountered. In this case, several problems arise, the most important of which are the possibility of synthesis and the stability of the generated new chemical structures. A significant problem is also the insufficient size of the polymer database (knowledge or data on properties of new classes of polymers) used for model training, which makes the results of predicting the properties of such compounds unreliable.
Among recently published data is the PI1M database [35]. A recurrent neural network was used to generate about 1 million polymer SRUs from 12,000 polymers in the NIMS database [40]. The PI1M database [54] contains 999,988 records, among which we found 25,297 duplicates and 328 records with aromatic bonds that cannot be used for alternating single and double bonds. Most of these duplicates consist of multiple SRUs in repeating units such as polymethylene and polyethylene (Figure 5B). There may also be duplicates associated with ambiguity in the definition of a repeating polymer fragment. Such examples are given in Figure S4.
But there are also other duplicates, for example, due to the lack of canonicalization of SMILES strings:
*CC(*)(C)C(=O)OCC([2H])(F)C(F)(F)C(F)(F)C(F)(F)C(F)(F)C(F)(F)C(F)(F)C(F)(F)C(F)(F)F and
*CC(*)(C)C(=O)OCC(F)([2H])C(F)(F)C(F)(F)C(F)(F)C(F)(F)C(F)(F)C(F)(F)C(F)(F)C(F)(F)F
These two strings differ in the order of substituents on the C6 atom, although the publication [35] notes the use of RDKit [55] to generate canonical SMILES.
Figure S5 shows examples of non-alternating aromatic bonds in the PI1M database, represented by a dotted straight line.
In addition, 29,110 structures in the PI1M database contain different bond orders for two asterisk atoms, which denote a repeating fragment of the SRU. In this case, there is an ambiguity in the interpretation of the structure of the polymers (Figure S6) because two different dimers can be generated from one repeating polymer unit.
The PI1M database also contains 11,116 chemically reactive compounds containing O-O bonds (peroxides) and halogen–oxygen bonds, as well as 14,525 oximes and hydroxylamines and 117 C-nitroso compounds. When the number of peroxides and hydroxylamines was counted, in addition to the traditional O-O and N-O bonds, we also considered bonds through dummy atoms, which denote a repeating fragment (*): *-O…O-*, *-N…O-*. Compounds containing such bonds were also excluded from consideration. The presence of these fragments makes the polymer highly reactive. Additionally, we removed 116 polymer SRUs containing the fragments shown in Figure 12.
As a result of the presence of these fragments, such polymers cannot be synthesized because they are linear polymeric allotropic modifications of nitrogen and oxygen that do not exist in nature.
The 924,006 polymer SRUs selected in this way, without duplicates, errors, and chemically reactive compounds, were used to predict properties using Bicerano’s models. Properties were predicted for 787,740 polymers. The remaining polymers did not pass our filters, especially the main filters: the presence of illegal elements in the composition of the polymer (available elements are C, H, N, O, F, Si, S, Cl, Br), non-standard valences (oxidation states), or the bond with the asterisk atom (*, backbone continuation mark) whose order is different from one. These filters are a feature of the construction of Bicerano regression models and the implementation of the program. Chemical structures that do not pass these filters are correct.
During the generation of the PI1M dataset, the initial structures of NIMS Polymer SRUs [40] were significantly transformed. This is due to potential problems describing aromatic bonds. The PI1M database is very diverse, with dissimilarity equal to 0.781, and the number of unique fragments (screens) with a topological radius less than or equal to two is high: 137,737. The division of the structures into screens and the calculation of the dissimilarity coefficient are described in [56]. The dissimilarity of the dataset was calculated as the sum of all pairwise dissimilarities divided by the square of the number of elements. The cosine distance metric [57] was used to calculate the dissimilarity of a pair of molecules. Atom-centered fragments [58] were used to calculate the similarity between chemical structures.
It is expected that a more diverse dataset will result in a wider range of polymer properties. However, the ability to synthesize polymers from the PI1M database remains in question. The authors of the PI1M database [54] evaluated the complexity of polymers synthesizing using the approach from [59] and concluded that the synthesis of PI1M polymers can be easily done or with few problems. However, the algorithm in [59] works only for potentially synthesized structures, since the PubChem [60] database of existing structures was used to estimate the complexity of the synthesis. In addition, [59] does not provide any information about the chemical reactivity and stability of chemical structures. A search in the PI1M database can yield both nonexistent polymers (polyoxygen, polynitrogen, Figure 12) and polymers with reactive groups: peroxides, halogen oxides, C-nitroso compounds, etc. These polymers may be available for synthesis, but their high chemical reactivity makes them ineffective in practical use.
In this regard, the question arises whether it is possible to achieve the required variety of polymer structures and, as a consequence, a wide range of values of extreme properties of polymers by using already known pendant groups and fragments of repeating units of the backbone. This choice significantly increases the probability of successful synthesis and the stability of polymers.
The “hits” for the predicted properties of 787,740 polymers from the PI1M database are shown in Table S5. Before predicting the properties, polysilane derivatives were removed from the PI1M and Monte Carlo databases because they have extreme values of properties but cannot be synthesized.
When comparing the property prediction data from the PI1M database (Table S5) with the polymer property predictions generated for the known backbone repeat units (Table S3), the PI1M database shows a significantly larger range of the extreme value of the property. This is because the ZeroTwo sample (Table S3) has a diversity of 0.7374 (defined as the sum of all pairwise varieties divided by the square of the number of connections [56]) and contains only 18,239 screens despite a significantly larger number of records (5,142,807). Higher diversity requires the generation of new backbone SRUs. In the best case, all possible polymer SRUs should be generated for fragments obtained by the decomposition of known polymer SRUs. However, this leads to a combinatorial explosion as the number of structures becomes so large that it becomes impossible to generate them and predict their properties in a reasonable time.
To avoid this, we used the Monte Carlo algorithm to generate polymer SRUs. First, the polymer SRU backbone was generated from several fragments of the backbone. Up to four fragments were selected and randomly oriented (the head or tail of the attached fragment to the growth point of the backbone) (Figure 1, points 8–12–11–14) to make a new backbone. However, if an O–O bond (chemically reactive peroxide) was formed or the molecular weight of the backbone was greater than 400, such a fragment was not used to add pendant groups and was discarded as unsuccessful. To avoid combinatorial explosion, we reduced the number of polymer SRU structures using the molecular weight constraint. Then, for each connection point in the backbone, pendant groups were randomly selected from the list. To generate the next polymer SRU, this process was repeated, starting with the selection of new backbone fragments and the generation of the backbone SRU.
The generation process was stopped after predicting properties for 787,740 polymer SRUs. These structures are available in our open access database file MonteCarloSmi.zip [53]. The properties in the PI1M dataset were predicted for this number of polymer SRUs, and the extreme values of the properties should be compared for databases with the same number of records. Otherwise, the probability of finding extreme properties increases for a larger database. The Monte Carlo dataset contains 75,149 screens, which is significantly less than the PI1M dataset (137,737). The diversity of this dataset is 0.74692, which is higher than ZeroTwo, but lower than PI1M. Thus, the Monte Carlo chemical space is part of the PI1M chemical space. This can be seen in Figure 13. The blue points (Monte Carlo database) are clusters within the green points (PI1M) [61]. Visualization was performed by projecting a 160-dimensional space of chemical structures (slightly modified MACCS fragments [62]) onto a two-dimensional space using the Stochastic Neighbor Embedding algorithm [63] to reduce the dimension.
Next, the extreme values of the properties were compared for both the PI1M and Monte Carlo databases. Extreme property values are important in the design of new materials. A total of 22 properties were analyzed (Table 1). Minimum values were found for five compounds from the Monte Carlo database and twelvecompounds from the PI1M database, with five properties having identical values (Table S5). Maximum property values were found for fourteencompounds from the Monte Carlo database and two compounds from the PI1M database. The maximum values of six properties wereidentical for both databases (Table S5). For example, for the heat capacity of a polymer in liquid state (CL), the “hit” with the minimum value is found in the Monte Carlo database and the “hit” with the maximum value is found in the PI1M database. For Specific Refraction (RLL), the minimum value “hit” is found in the PI1M database and the maximum value “hit” is found in the Monte Carlo database. Although the PI1M database has much larger diversity, compounds with extreme values of properties occur about equally in both databases, in fact slightly more often in the Monte Carlo database than in the PI1M database. This is because the Monte Carlo database was built from fragments used in Bicerano regression models to predict properties, but PI1M contains many fragments that are not used in Bicerano regression models. The contribution of such fragments to the properties is assumed to be zero. Therefore, the high diversity of the PI1M database does not lead to a significant change in the extreme values of the properties. The structures of polymeric SRUs with extreme properties from the PI1M dataset are shown in Table S6 (Supplementary Materials file), and the Monte Carlo dataset is shown in Table S7 (Supplementary Materials file).
Consider the “hits” found in the examples of specific compounds. The list of extreme property values includes the refractive index of polythiophene and its derivatives. In fact, polythiophene and its derivatives have a very high refractive index [64]. Low-temperature synthesis of polythiophene with an experimentally found refractive index of 3.36 was reported in [65]. This particular property of polythiophene makes it a promising material for the fabrication of photonic crystals.
Table 2 shows the experimental and predicted refractive indices of polythiophene and its analogs. The experimental values of the refractive indices of the analogues were taken from Ref. [66], where the Polymer Genome database was used for property prediction. Comparison with predicted and experimental results demonstrates that the Bicerano model predicts the refractive indices of polythiophene analogues better than polythiophene itself. It should be noted that the data for thiophene in the backbone [11] were not used to create the regression model for the Bicerano refractive index.
As for the dielectric constant, it is interesting to compare the maximum values obtained in this paper with those of Ref. [1], which in turn are based on the results of Ref. [68]. These data are summarized in Table 3.
All compounds of Ref. [1] are derivatives of hydroxylamine, i.e., they contain an aliphatic N-O bond. The predicted values of the dielectric constant according to the Bicerano model [9] are 20–40% higher compared to the data in Ref. [1]. Hydrazides (N-N bond) are less chemically reactive than hydroxylamines. Three hydrazides (Supplementary Materials Table S8) were included in the list of 100 compounds with extreme dielectric constant values. Assume that the predicted value is overestimated by 40% compared to the Ref. [1], we can suggest that hydrazines could have a higher dielectric constant than the compounds proposed in Ref. [1].
The dielectric constant predicted by the Polymer Genome [14] lies between the values predicted by the Bicerano model [11] and the data from Ref. [1]. They are higher for hydrazine derivatives than for hydroxylamine. Therefore, on the basis of the analysis performed, it can be proposed to use polymer hydrazides to create materials with a high dielectric constant.

4. Discussion

Before concluding, we should make some additional remarks about the predictions presented and the advantages of the proposed approach. To characterize the properties of chemical structures, we used previously developed Bicerano regression models [11]. The benefits of these models have been discussed in the Introduction section. However, it should be noted that the proposed approach has specific limitations due to the use of Bicerano regression models. These models have a limited list of chemical elements in the considered polymers (C, H, N, O, F, Cl, Br, Si, and S) and are applicable only to chain polymers and regularly repeating copolymers whose SRUs can be represented as a combination of the SRUs of each of the polymers. Therefore, the generation and prediction of properties of network, framework, graft, and irregular copolymers and end-group polymers go beyond the limits of the presented approach. The major advantage of our approach is its openness and full control over parameterization, which can be easily adjusted by the user and transferred from one computational platform to another. This distinguishes it favorably from neural network models for predicting molecular properties, where all parameterizations are closed. Nevertheless, the developed method for generating polymer materials can be used in conjunction with other methods for predicting polymer properties based on neural networks, such as Polymer Genome. Furthermore, it is possible to achieve synergy between regression methods and neural networks for predicting properties. For example, it is possible to use the data from these methods to train each other [69]. In addition, neural networks can be used as filters in the Monte Carlo method to evaluate on the fly the possibility of synthesizing the generated polymer structure. This would greatly expand the predictable possibilities and reduce the computational resources required.
The predictions obtained with the developed approach can be used for further experimental and theoretical investigations of promising candidates for polymer molecules with extreme properties. Note that not all extreme structures in the Monte Carlo dataset can be synthesized. To select realistic candidates, we first generate a large database of 4,417,553 polymer SRUs using the Monte Carlo algorithm [53] (files Mon-teCarloAll1.zip and MonteCarloAll2.zip available in open access). For each intensive property, 20 structures with minimum and maximum values of that property were retained for further consideration. From this dataset, an expert chemist evaluated the possibility of synthesis. The structures selected according to this criterion are shown in Table S8 together with their property values. Therefore, all structures in Table S8 should be considered promising candidates for further theoretical and experimental investigation of polymers with extreme values of selected properties. We believe that using fragments of known polymers to create predictive models increases the likelihood of their synthesis and makes predictions of their properties more realistic.
Finally, it should be noted that our approach can also be used in combination with computer simulation methods to design new polymer-based nanocomposites. The predicted polymers with extreme properties (“hits”) can be used to develop models of polymer nanocomposites (e.g., polymers filled with nanoparticles) whose properties can be evaluated by computer simulation studies, either with molecular mechanics or quantum chemical simulations. The presented approach can be easily integrated into complex software packages for multiscale modeling of polymer-based nanomaterials, such as MultiComp [52].

5. Conclusions

In this work, we have developed a theoretical approach for the in silico generation of new polymer structures for a systematic search for new materials with advanced properties. The approach is based on the Bicerano regression model, which provides a fast and reasonable prediction of polymer properties based on the structure of the smallest repeating unit. Furthermore, we created a database of possible backbones and pendant groups used to learn the Bicerano regression model and then applied a combinatorial method to vary the pendant groups to generate a database of 5,142,153 unique polymers. The novel filters based on InChIKey allowed effective elimination of duplicates in the database and optimization of the process of generating, characterizing, and organizing the resulting chemical structures.
It was shown that the extreme values for the ZeroTwo database are in most cases higher than those for a set of polymers used to parameterize Bicerano’s regression model. Thus, by using only known backbones of the smallest polymer repeat units and varying the pendant groups, it is possible to significantly improve the extreme values of the predicted properties.
We also developed a method to generate new backbones of polymers using fragments of the backbone of existing polymers and applied the Monte Carlo algorithm to generate several databases with different numbers of polymers, starting from a database of 787,740 polymers available in open access [53]. Compared to the PI1M database, these databases do not have duplicate polymer structures and contain polymers that are likely to be synthesized. We believe that the use of fragments of known polymers increases the probability of their synthesis and makes predictions of their properties more realistic.
The Bicerano models were used to estimate properties for the generated Monte Carlo database. The number of polymers with recorded extreme properties is approximately the same in the Monte Carlo and PI1M databases. The predicted maximum values of the dielectric constant and refractive index are examined in detail. It is found that the predicted dielectric constant values are higher for polyhydrazides than for polyhydroxylamines. The predicted high value of the refractive index of polythiophene and its derivatives is in agreement with the experimental data.
As a further development of this approach, it is planned to add predictions of new polymer properties. To generate real polymers with a higher probability of synthesis, it is planned to store information about not only the connecting points of the polymer but also the type of atom in the backbone to which the pendant group is added. Prediction of the possibility of synthesis and stability of the polymer during the generation of new chemical structures would be a priority direction for the further development of this work. Now, these functions are performed by filters of reactive chemical bonds.

Supplementary Materials

The following supporting information can be downloaded at: https://www.mdpi.com/article/10.3390/nanomanufacturing4010001/s1, Figure S1: Identical structures for which different InChIkeys are generated; Figure S2: An example of the output of property prediction results for polyethylene terephthalate is given in Table S1; Figure S3:The graphical interface for setting initial conditions for the generation of structures; Figure S4:Example of duplicates in the PI1M database with the given SMILES notation; Figure S5: Examples of compounds (taken from PI1M) with aromatic cycles that do not clearly alternate for single and double bonds; Figure S6: A repeating polymer fragment (A) and two possible dimers (B and C) that can be generated from fragment A; Table S1: Property prediction results for polyethylene terephthalate (see Figure S1); Table S2: Extreme values of the predicted physicochemical properties of polymers with various combinations of substituents and BiceranoDB polymers; Table S3: Chemical structures with extreme property values in the ZeroTwo database; Table S4: Chemical structures with extreme values of properties in the Bicerano database; Table S5: Extreme values of the predicted properties of compounds from the PI1M database and the Monte Carlo database; Table S6: Chemical structures with extreme property values from the PI1M database; Table S7: Chemical structures with extreme property values in the MonteCarlo database; Table S8: Chemist-selected chemical structures with extreme property values from the MonteCarloAll database.

Author Contributions

Conceptualization, S.V.T.; methodology, S.V.T.; software, D.B.S. and S.V.T.; validation, S.V.T.; formal analysis, A.A.K., P.V.K., D.B.S. and A.S.S.; investigation, A.A.K., P.V.K., A.S.S. and S.V.T.; writing—original draft preparation, P.V.K. and S.V.T.; writing—review and editing, A.A.K., P.V.K., A.S.S. and S.V.T.; visualization, P.V.K., D.B.S., A.S.S. and S.V.T.; supervision, A.A.K.; project administration, B.V.P. All authors have read and agreed to the published version of the manuscript.

Funding

This research received no external funding.

Data Availability Statement

Data are contained within the article, Supplementary Materials file and GitHuB (https://github.com/trepalin/KintechLab, (accessed on 16 September 2023)).

Acknowledgments

This work has been carried out using computing resources of the federal collective usage center Complex for Simulation and Data Processing for Mega-science Facilities at NRC “Kurchatov Institute”, (http://computing.kiae.ru/, accessed on 1 December 2023). P.V. Komarov’s investigations for this paper are supported by the Ministry of Science and Higher Education of the Russian Federation (Contract No. 075-03-2023-642).

Conflicts of Interest

Authors A.A.K., B.V.P., D.B.S., A.S.S. and S.V.T. were employed by the company Kintech Lab. Ltd. The remaining authors declare that the research was conducted in the absence of any commercial or financial relationships that could be construed as a potential conflict of interest. The Kintech Laboratory Ltd. in affiliation and funding had no role in the design of the study; in the collection, analyses, or interpretation of data; in the writing of the manuscript, or in the decision to publish the results.

Abbreviations

SRUsmallest polymer repeating unit
SRUDBsmallest polymer repeating unit database
PDBpendant groups database
BDBbackbone database
BFDBbackbone fragments database
FDBsfragments databases. Includes PDB, BDB, and BFDB

References

  1. Patra, T.K. Data-Driven Methods for Accelerating Polymer Design. ACS Polym. Au 2022, 2, 8–26. [Google Scholar] [CrossRef] [PubMed]
  2. Hiemenz, P.C.; Lodge, T.P. Polymer Chemistry, 2nd ed.; CRC: New York, NY, USA, 2007; pp. 1–575. [Google Scholar]
  3. Feldman, D. Polymer History. Des. Monomers Polym. 2008, 11, 1–15. [Google Scholar] [CrossRef]
  4. Mariello, M.; Kim, K.; Wu, K.; Lacour, S.P.; Leterrier, Y. Recent Advances in Encapsulation of Flexible Bioelectronic Implants: Materials, Technologies, and Characterization Methods. Adv. Mater. 2022, 34, e2201129. [Google Scholar] [CrossRef] [PubMed]
  5. Heath-Apostolopoulos, I.; Wilbraham, L.; Zwijnenburg, M.A. Computational high-through put screening of polymeric photocatalysts: Exploring the effect of composition, sequence isomerism and conformational degrees of freedom. Faraday Discuss. 2019, 215, 98–110. [Google Scholar] [CrossRef] [PubMed]
  6. Ruipérez, F. High-Performance Quantum Chemical Calculations for Polymers. Int. Rev. Phys. Chem. 2019, 38, 343–403. [Google Scholar] [CrossRef]
  7. Shah, M.R.; Yadav, G.D. Prediction of sorption in polymers using quantum chemical calculations: Application to polymer membrane. J. Membr. Sci. 2013, 427, 108–117. [Google Scholar] [CrossRef]
  8. Gartner, T.E.; Jayaraman, A. Modeling and Simulations of Polymers: A Roadmap. Macromolecules 2019, 52, 755–786. [Google Scholar] [CrossRef]
  9. Khalatur, P.G. Molecular Dynamics Simulations in Polymer Science: Methods and Main Results. In Polymer Science: A Comprehensive Reference; Matyjaszewski, K., Möller, M., Eds.; Elsevier: Dutch, The Netherlands, 2012; pp. 417–460. [Google Scholar] [CrossRef]
  10. Bhandari, S.; Lopez-Anido, R. Finite element analysis of thermoplastic polymer extrusion 3D printed material for mechanical property prediction. Addit. Manuf. 2018, 22, 187–196. [Google Scholar] [CrossRef]
  11. Bicerano, J. Prediction of Polymer Properties, 3rd ed.; Marcel Dekker Inc.: New York, NY, USA, 2002; pp. 1–746. [Google Scholar]
  12. Askadskii, A. Computational Materials Science of Polymers; Cambridge International Science Publishing: Cambridge, UK, 2003; pp. 1–650. [Google Scholar]
  13. Van Krevelen, D.W.; Te Nijenhuis, K. Properties of Polymers, 4th ed.; Elsevier: Amsterdam, The Netherlands, 2009; pp. 1–1004. [Google Scholar]
  14. Polymer Genome. Available online: https://www.polymergenome.org/ (accessed on 23 November 2023).
  15. Park, J.; Shim, Y.; Lee, F.; Rammohan, A.; Goyal, S.; Shim, M.; Jeong, C.; Sin Kim, D. Prediction and Interpretation of Polymer Properties Using the Graph Convolutional Network. ACS Polym. Au 2022, 2, 213–222. [Google Scholar] [CrossRef]
  16. Guo, Z.X. Multiscale Materials Modelling Fundamentals and Applications. In Civil and Structural Engineering; Woodhead Publishing Series; Elsevier: Amsterdam, The Netherlands, 2007; pp. 1–293. [Google Scholar] [CrossRef]
  17. Zeng, Q.H.; Yu, A.B.; Lu, G.Q. Multiscale Modeling and Simulation of Polymer Nanocomposites. Prog. Polym. Sci. 2008, 33, 191–269. [Google Scholar] [CrossRef]
  18. Heiranian, M.; Du Chanois, R.M.; Ritt, C.L.; Violet, C.; Elimelech, M. Molecular simulations to elucidate transport phenomena in polymeric membranes. Environ. Sci. Technol. 2022, 56, 3313–3323. [Google Scholar] [CrossRef] [PubMed]
  19. Szabo, A.; Ostlund, N.S. Introduction to Advanced Electronic Structure Theory. In Modern Quantum Chemistry, Reprinted; Courier Corporation: Honolulu, HI, USA, 1996; pp. 1–480. [Google Scholar]
  20. Kohn, W.; Sham, L.J. Self-Consistent Equations Including Exchange and Correlation Effects. Phys. Rev. 1965, 140, A1133. [Google Scholar] [CrossRef]
  21. Stocker, S.; Csanyi, G.; Reuter, K.; Margraf, J.T. Machine Learning Chemical Reaction Space. Nat. Commun. 2020, 11, 5505. [Google Scholar] [CrossRef] [PubMed]
  22. National Research Council. Beyond the Molecular Frontier: Challenges for Chemistry and Chemical Engineering; The National Academies Press: Washington, DC, USA, 2003. [Google Scholar] [CrossRef]
  23. The Australian National University. Available online: https://www.anu.edu.au/news/all-news/researcher-sets-record-for-quantum-chemistry-calculation (accessed on 23 November 2023).
  24. Song, Y.; Xu, F.; Wei, M.J.; Wang, Y. Water Flow inside Polyamide Reverse Osmosis Membranes: A Non Equilibrium Molecular Dynamics Study. J. Phys. Chem. B 2017, 121, 1715–1722. [Google Scholar] [CrossRef] [PubMed]
  25. Song, Y.; Wei, M.J.; Xu, F.; Wang, Y. Molecular Simulations of Water Transport Resistance in Polyamide RO Membranes: Interfacial and Interior Contributions. Engineering 2020, 6, 577–584. [Google Scholar] [CrossRef]
  26. Zhang, N.; Chen, S.M.; Yang, B.Y.; Huo, J.; Zhang, X.P.; Bao, J.J.; Ruan, X.H.; He, G.H. Effect of Hydrogen-Bonding Interaction on the Arrangement and Dynamics of Water Confined in a Polyamide Membrane: A Molecular Dynamics Simulation. J. Phys. Chem. B 2018, 122, 4719–4728. [Google Scholar] [CrossRef] [PubMed]
  27. Li, K.; Li, S.L.; Huang, W.; Yu, C.Y.; Zhou, Y.F. MembrFactory: A Force Field and Composition Double Independent Universal Tool for Constructing Polyamide Reverse Osmosis Membranes. J. Comput. Chem. 2019, 40, 2432–2438. [Google Scholar] [CrossRef] [PubMed]
  28. Li, K.; Li, S.L.; Liu, L.F.; Huang, W.; Wang, Y.L.; Yu, C.Y.; Zhou, Y.F. Molecular Dynamics Simulation Studies of the Structure and Antifouling Performance of a Gradient Polyamide Membrane. Phys. Chem. 2019, 21, 19995–20002. [Google Scholar] [CrossRef]
  29. Field, M.J. A Practical Introduction to the Simulation of Molecular Systems, 2nd ed.; Cambridge University Press: Cambridge, UK, 1999; pp. 1–325. [Google Scholar]
  30. Kmiecik, S.; Gront, D.; Kolinski, M.; Wieteska, L.; Dawid, A.E.; Kolinski, A. Coarse-Grained Protein Models and Their Applications. Chem. Rev. 2016, 116, 7898–7936. [Google Scholar] [CrossRef]
  31. Cheng, Y.; Guoqiang, L. The Rise of Machine Learning in Polymer Discovery. Adv. Intell. Syst. 2023, 5, 2200243. [Google Scholar] [CrossRef]
  32. Karelson, M. The Use of Topological Indices in QSAR and QSPR Modeling. In Advances in QSAR Modeling; Roy, K., Ed.; Springer: Berlin/Heidelberg, Germany, 2017; pp. 57–88. [Google Scholar]
  33. Myint, K.-Z.; Wang, L.; Tong, Q.; Xie, X.-Q. Molecular Fingerprint-based Artificial Neural Networks QSAR for Ligand Biological Activity Predictions. Mol. Pharm. 2012, 9, 2912–2923. [Google Scholar] [CrossRef] [PubMed]
  34. Hansch, C. The physicochemical approach to drug design and discovery (QSAR). Drug Dev. Res. 1981, 1, 267–309. [Google Scholar] [CrossRef]
  35. Ruimin, M.; Tengfei, L. PI1M: A Benchmark Database for Polymer Informatics. J. Chem. Inf. Model. 2020, 60, 4684–4690. [Google Scholar] [CrossRef]
  36. Suay-García, B.; Bueso-Bordils, J.I.; Falcó, A.; Antón-Fos, G.M.; Alemán-López, P.A. Virtual Combinatorial Chemistry and Pharmacological Screening: A Short Guide to Drug Design. Int. J. Mol. Sci. 2022, 23, 1620. [Google Scholar] [CrossRef] [PubMed]
  37. Li, D.; Ru, Y.; Chen, Z.; Dong, C.; Dong, Y.; Liu, J. Accelerating the design and development of polymeric materials via deep learning: Current status and future challenges. APL Mach. Learn. 2023, 1, 021501. [Google Scholar] [CrossRef]
  38. Goodfellow, I.J.; Pouget-Abadie, J.; Mirza, M.; Bing, X.; Warde-Farley, D.; Ozair, S.; Courville, A.; Bengio, J. Generative Adversarial Networks. arXiv 2014, arXiv:1406.2661. [Google Scholar] [CrossRef]
  39. Sherstinsky, A. Fundamentals of recurrent neural network (RNNs) and longs hort-term memory (LSTM). arXiv 2018, arXiv:1808.03314. [Google Scholar] [CrossRef]
  40. Otsuka, S.; Kuwajima, I.; Hosoya, J.; Xu, Y.; Yamazaki, M. PoLyInfo: Polymer database for polymeric materials design. In Proceedings of the 2011 International Conference on Emerging Intelligent Data and Web Technologies, Tirana, Albania, 7–9 September 2011; pp. 22–29. [Google Scholar]
  41. Polymers: A Property Database. Available online: https://poly.chemnetbase.com/polymers/PolymerSearch.xhtml (accessed on 23 November 2023).
  42. Huan, T.; Mannodi-Kanakkithodi, A.; Kim, C.; Sharma, V.; Pilania, G.; Ramprasad, R. A polymer dataset for accelerated property prediction and design. Sci. Data 2016, 3, 160012. [Google Scholar] [CrossRef]
  43. Dalby, A.; Hourse, J.G.; Hounshell, W.D.; Gurchurst, A.K.I.; Grier, D.L.; Leland, B.A.; Laufer, J. Description of several chemical structure file formats used by computer programs developed at Molecular Design Limited. J. Chem. Inf. Comput. Sci. 1992, 32, 244–255. [Google Scholar] [CrossRef]
  44. Jin, W.; Barzilay, R.; Jaakkola, T.; Hierarchical Generation of Molecular Graphs Using Structural Motifs. arXiv 2020. Available online: https://arxiv.org/pdf/2002.03230 (accessed on 23 November 2023).
  45. Bonnici, V.; Giugno, R.; Pulvirenti, A.; Shasha, D.; Ferro, A. A subgraph isomorphism algorithm and its application to biochemical data. BMC Bioinform. 2013, 14, S13. [Google Scholar] [CrossRef]
  46. Yerin, A. InChI Encoding of Polymers Current Results and Further Tasks; InChITRUST: Bethesda, MD, USA, 2017; Available online: https://www.inchi-trust.org/wp/wp-content/uploads/2017/11/23.-InChI-Polymer-Yerin-201708.pdf (accessed on 23 November 2023).
  47. Inchi-Discuss Mailing List for InChI Facilities and Applications. Available online: https://sourceforge.net/p/inchi/mailman/inchi-discuss/?viewmonth=202301 (accessed on 23 November 2023).
  48. InChITRUST, Download Page. Available online: https://www.inchi-trust.org/download-latest-inchi-standard-software/ (accessed on 23 November 2023).
  49. Yu, M.; Shi, Y.; Jia, Q.; Wang, Q.; Luo, Z.-H.; Yan, F.; Zhou, Y.-N. Ring Repeating Unit: An Upgraded Structure Representation of Linear Condensation Polymers for Property Prediction. J. Chem. Inf. Model. 2023, 63, 1177–1187. [Google Scholar] [CrossRef] [PubMed]
  50. ISIS/Base. Available online: https://med.stanford.edu/content/dam/sm/htbc/documents/ISISBASE.pdf (accessed on 23 November 2023).
  51. Trepalin, S.V.; Yarkov, A.V. CheD—Chemical database compilation tool, Internet server and client for SQL servers. J. Chem. Inf. Comput. Sci. 2001, 41, 100–107. [Google Scholar] [CrossRef] [PubMed]
  52. Akhukov, M.A.; Chorkov, V.A.; Gavrilov, A.A.; Guseva, D.V.; Khalatur, P.G.; Khokhlov, A.R.; Kniznik, A.A.; Komarov, P.V.; Okun, M.V.; Potapkin, B.V.; et al. MULTICOMP package for multilevel simulation of polymer nanocomposites. Comput. Mater. Sci. 2023, 216, 111832. [Google Scholar] [CrossRef]
  53. GitHub—Trepalin/KintechLab: Polymer Processing. Available online: https://github.com/trepalin/KintechLab (accessed on 23 November 2023).
  54. RUIMINMA1996. Available online: https://github.com/RUIMINMA1996/PI1M (accessed on 23 November 2023).
  55. Landrum, G. RDKit: Open-Source Cheminformatics Software. 2016. Available online: https://github.com/rdkit/rdkit/releases/tag/Release_2016_09_4 (accessed on 23 November 2023).
  56. Trepalin, S.V.; Gerasimenko, V.A.; Kozyukov, A.V.; Savchuk, N.P.; Ivaschenko, A.A. New Diversity Calculations Algorithms Used for Compound Selection. J. Chem. Inf. Comput. Sci. 2002, 42, 249–258. [Google Scholar] [CrossRef]
  57. Holliday, J.D.; Ranade, S.S.; Willett, P. A Fast Algorithm for Selecting Sets of Dissimilar Molecules from Large Chemical Databases. Quant. Struct.-Act. Relat. 1995, 14, 501–506. [Google Scholar] [CrossRef]
  58. Bremsler, W. HOSE-A Novel Substructure Code. Anal. Chim. Acta 1978, 103, 355–365. [Google Scholar] [CrossRef]
  59. Ertl, P.; Schuffenhauer, A. Estimation of synthetic accessibility score of drug-like molecules based on molecular complexity and fragment contributions. J. Cheminform. 2009, 1, 1–11. [Google Scholar] [CrossRef] [PubMed]
  60. Kim, S.; Chen, J.; Cheng, T.; Gindulyte, A.; He, J.; He, S.; Li, Q.; Shoemaker, B.A.; Thiessen, P.A.; Yu, B.; et al. PubChem 2023 update. Nucleic Acids Res. 2023, 51, D1373–D1380. [Google Scholar] [CrossRef]
  61. Lemonick, S. Exploring chemical space: Can AI take us where no human has gone before? Chem. Eng. News 2020, 98, 13. [Google Scholar]
  62. Durant, J.L.; Leland, B.A.; Henry, D.R.; Nourse, J.G. Reoptimization of MDL keys for use in drug discovery. J. Chem. Inf. Comput. Sci. 2002, 42, 1273–1280. [Google Scholar] [CrossRef]
  63. Van der Maaten, L. Accelerating t-SNE using Tree-Based Algorithms. J. Mach. Learn. Res. 2014, 15, 1–21. [Google Scholar]
  64. Oftadeha, M.; Moshfegha, M.; Hadi Abdallahb, H. Optical Properties of Some Oligothiophene Derivatives: DFT Study. Phys. Chem. Res. 2016, 4, 35–46. [Google Scholar] [CrossRef]
  65. Graham, M.J. Development of High Refractive Index Poly(thiophene) for the Fabrication of All Organic 3-D Photonic Materials with a Complete Photonic Band Gap. Doctor Philosophy Dissertation, University of Akron, USA, December 2006. Available online: http://rave.ohiolink.edu/etdc/view?acc_num=akron1164049666 (accessed on 23 November 2023).
  66. Tran, H.D.; Kim, C.; Chen, L.; Chandrasekaran, A.; Batra, R.; Venkatram, S.; Kamal, D.; Lightstone, J.P.; Gurnani, R.; Shetty, P.; et al. Machine-learning predictions of polymer properties with Polymer Genome. J. Appl. Phys. 2020, 128, 171104. [Google Scholar] [CrossRef]
  67. Hamnett, A.; Hillman, A.R. An Ellipsometric Study of the Nucleation and Growth of Polythiophene Films. J. Electrochem. Soc. 1988, 135, 2517–2524. [Google Scholar] [CrossRef]
  68. Mannodi-Kanakkithodi, A.; Pilania, G.; Huan, T.D.; Lookman, T.; Ramprasad, R. Machine Learning Strategy for Accelerated Design of Polymer Dielectrics. Sci. Rep. 2016, 6, 20952. [Google Scholar] [CrossRef]
  69. Volgin, I.V.; Batyr, P.A.; Matseevich, A.V.; Dobrovskiy, A.Y.; Andreeva, M.V.; Nazarychev, V.M.; Larin, S.V.; Goikhman, M.Y.; Vizilter, Y.V.; Askadskii, A.A.; et al. Machine Learning with Enormous “Synthetic” Data Sets: Predicting Glass Transition Temperature of Polyimides Using Graph Convolutional Neural Networks. ACS Omega 2022, 7, 43678–43691. [Google Scholar] [CrossRef]
Figure 1. Flowchart of the work steps to create structure fragments database (FDBs) (orange background, point 9) and to generate chemical structures for SRUDB, to predict polymer properties (light blue background, point 18), and the data obtained at each step. Detailed explanations can be found in the text of the publication.
Nanomanufacturing 04 00001 g001
Figure 2. Examples of the splitting of a polymer into fragments. Two asterisks (backbone continuation points) indicate a repeating fragment. R1, R2—connecting points. The color indicates the original position of the fragments.
Nanomanufacturing 04 00001 g002
Figure 3. (A) polychloroprene and (B) variants (1–3) of the polychloroprene backbone fragments stored in the BFDB. R denotes the chlorine atom connection point. Here and after the asterisk “*” denotes a continuation point of the backbone.
Nanomanufacturing 04 00001 g003
Figure 4. An example of the use of isotopic labels “13C” and “36Cl” to mark the connection points (+1) of pendant groups and “15C” and for the continuation of backbone fragments (+3), respectively. (A) Chemical structures shown in Figure 2, (B) marked fragments.
Nanomanufacturing 04 00001 g004
Figure 5. Equivalent ways to represent the backbone of polyethylene glycol (A) and polyethylene (B).
Nanomanufacturing 04 00001 g005
Figure 6. (A) PET (unable to calculate standard InChIKey for this structure). (B) Results in transformation of PET to the cyclic structure before standard InChIkey calculation (InChIkey = MMINFSMURORWKH-UHFFFAOYSA-N).
Nanomanufacturing 04 00001 g006
Figure 7. Transformation structures of (A) polymethylene (backbone topological length 0) and (B) PVC (backbone topological length 1).
Nanomanufacturing 04 00001 g007
Figure 8. Definition of the smallest repeating unit of poly-p-phenylene, given as poly(p-p-′)-biphenylene. (A)—original structure, (B)—transformed structure (ring repeat unit), topologically equivalent atoms are indicated by the same numbers. Structure (C) is obtained from structure A, where the topological equivalence of the atoms is determined. Green circle-starting point of neighbor extraction, blue circle-endpoint (same topological number as starting point). Red cross-forbidden path. (D) is the smallest repeating unit of the polymer, and the (E)-transformed structure of the smallest repeating unit is used to calculate the standard InChIkey.
Nanomanufacturing 04 00001 g008
Figure 9. Initial fragments of SRU and two possible SRU backbones 1 and 2. The pairs of structures (1A,1B), and (2A,2B) are equivalent, but 1 and 2 are different.
Nanomanufacturing 04 00001 g009
Figure 10. Numbering of atoms in para-phenylene, used for pendant groups addition.
Nanomanufacturing 04 00001 g010
Figure 11. Two different SRUs (2A,2B). They are generated from formally identical polymer backbones (1A,1B) but with different atomic numeration.
Nanomanufacturing 04 00001 g011
Figure 12. Fragments of polymer structures that were removed from the PI1M database. (A,B) Linear allotropic modification of monosubstituted nitrogen; (C) Linear allotropic modification of oxygen; (D) Polydiazene.
Nanomanufacturing 04 00001 g012
Figure 13. Visualization of chemical compound spaces [61] for PI1M (green points) and Monte Carlo (blue points). Each point is a relative position of a chemical structure in dimensionality-reduced space.
Nanomanufacturing 04 00001 g013
Table 1. Polymer properties, abbreviations, and units. The use of specific values instead of molar values (e.g., specific refraction vs. molar refraction) makes the property value independent of the choice of polymer repeating unit (e.g., polymethylene vs. polyethylene).
AbbreviationProperty NameUnit of Measure
CLspecific heat capacity, liquidJ/g/K
CSspecific heat capacity, solidJ/g/K
COH1specific cohesion energy, FeudorJ/g
COH2specific cohesion energy, Van KrevelenJ/g
DELTA1delta solubility, Feudor(J/cc)0.5
DELTA2delta solubility, Van Krevelen(J/cc)0.5
RLLspecific refractioncc/g
PLLspecific polarizabilitycc/g
MUdipole momentDebye
MBbulk modulusMPa
STIFFNESSmolar stiffnessg0.25cm1.5/mole0.75
EPSILONdielectric constant
Nrefractive index
VISFUNCmolar viscosity gJ1/3mole−4/3
EAFLOWspecific activation energy of viscous flowkJ/g
O2PERMpermeability of oxygenBarrers
N2PERMpermeability of nitrogenBarrers
CO2PERMpermeability of carbon dioxideBarrers
TDECOMPdecomposition temperatureK
SINFbrittle fracture stress at infinite mol weightMPa
SIGMAFbrittle fracture stress at specified mol weightMPa
SIGMAYyield stressMPa
Table 2. Predicted and experimental refractive indices of some polythiophene analogs.
CompoundExperimental
Value
Bicerano [9]Polymer Genome
polythiophene [*]c1ccc(s1)[*]1.4 [67],
3.36 [65]
1.752.10 [14]
[*]c3ccc(Sc2ccc(Sc1ccc([*])cc1)cc2)cc31.751.681.72 [66]
[*]c3ccc(Sc2ccc(Sc1ccc([*])cc1)s2)cc31.751.711.77 [66]
[*]c3ccc(Sc2nnc(Sc1ccc([*])cc1)s2)cc31.751.711.71 [66]
[*]c5ccc(Sc4c1SCCSc1c(Sc2ccc([*])cc2)c3SCCSc34)cc51.771.761.80 [14]
Table 3. Predicted dielectric constant values for some compounds.
CompoundDielectric Constant
Figure 7g in Ref. [1]Bicerano [11]Polymer Genome [14]
Hydroxylamines
-CO-NH-CO-NH-O-CH2-O-NH-4.696.885.0
-NH-CO-NH-CO-O-NH-CO-O-CO-4.715.775.3
-NH-O-NH-O-CH2-O-NH-CO-NH-CO-4.616.824.9
-CO-O-CO-NH-CO-NH-CO-O-NH-CO-NH-4.786.335.3
-NH-CO-O-CO-NH-O-CO-NH-CO-O-NH-CO-4.655.655.2
Hydrazides
-NH-CO-NH- 7.845.3
-NH-CO-NH-CO-NH- 8.045.4
-NH-CO-NH-CO-NH-NH-CO- 8.125.5
Disclaimer/Publisher’s Note: The statements, opinions and data contained in all publications are solely those of the individual author(s) and contributor(s) and not of MDPI and/or the editor(s). MDPI and/or the editor(s) disclaim responsibility for any injury to people or property resulting from any ideas, methods, instructions or products referred to in the content.

