Article

Advanced Prussian Blue Cathodes for Rechargeable Li-Ion Batteries

1
Department of Physics, National Central University, Taoyuan 32001, Taiwan
2
Department of Physics, Soochow University, Taipei 11141, Taiwan
*
Author to whom correspondence should be addressed.
Solids 2024, 5(2), 208-226; https://doi.org/10.3390/solids5020014
Submission received: 27 February 2024 / Revised: 30 March 2024 / Accepted: 8 April 2024 / Published: 16 April 2024

Abstract

:
Taking advantage of fact that the surface electrons of metallic nanoparticles (NPs) can be effectively released even at a low voltage bias, we demonstrate an improvement in the electrochemical performance of nanosized Prussian Blue (PB)-based secondary batteries through the incorporation of bare Ag or Ni NPs in the vicinity of the working PB NPs. It is found that the capacity for electrochemical energy storage of the 17 nm PB-based battery is significantly higher than the capacity of 10 nm PB-based, 35 nm PB-based or 46 nm PB-based batteries. There is a critical PB size for the highest electrochemical energy storage efficiency. The full specific capacity CF of the 17 nm PB-based battery stabilized to 62 mAh/g after 130 charge–discharge cycles at a working current of IW = 0.03 mA. The addition of 14 mass percent of Ag NPs in the vicinity of the PB NPs gave rise to a 32% increase in the stabilized CF. A 42% increase in the stabilized CF could be obtained with the addition of 14 mass percent of Ag NPs on the working electrode of the 35 nm PB-based battery. An enhancement in CF was also found for electrodes incorporating bare Ni NPs but the effect was smaller.

1. Introduction

Although the Li-ion battery has become the most commonly used power source in portable electronic devices, efforts to enhance the cyclability of secondary batteries toward extending their cycle life and increasing their energy content continue [1,2,3,4]. It is the repeated extraction and restoration of electrochemical energy in the solid electrode that makes a battery reusable [5,6,7,8]. Prussian Blue analogues (PBAs) with the general chemical formula AM[M′(CN)6] (A, alkali metal; M and M′, transition metal; hereafter denoted as A-MM′) [9,10] have been favored as promising active materials for cathodes [11,12,13,14,15]. The three-dimensional open channels in A-MM′s, enclosed by the MN6-M′C6-MN6-M′C6 octahedral chains along the three crystallographic directions, allow for the migration of weakly bonded ions through the channels for energy extraction and restoration [16,17,18,19,20,21,22,23]. The voids for accommodating alkali ions in the open channels of the PBAs are uniformly distributed and spacious enough to receive ions as large as K+. There are two possible redox active sites, Mn+-M(n+1)+ and M′n+-M′(n+1)+, in A-MM′. As a Li+-ion rechargeable battery, the reactions of 2 L i 2 L i + + 2 e at the anode coupled to the reactions of 2 L i + + 2 e + M [ M ( C N ) 6 ] L i 2 M [ M ( C N ) 6 ] at the cathode provide a transport pathway for the Li+-ions for electrical conduction which are stored on the A-MM′ in the discharge process. The reversal reactions of L i 2 M [ M ( C N ) 6 ] M [ M ( C N ) 6 ] + 2 L i + + 2 e at the cathode coupled to the reactions of 2 L i + + 2 e 2 L i at the anode provide a pathway for Li+-ions to return to the anode in the charge process. Theoretically, when fully redox active, each site can provide a specific capacity of 170.8 mAh/g during the charging–recharging cycle [24]. However, most PBAs give a specific capacity that is considerably smaller than 170.8 mAh/g [24], showing that only a portion of the metal ions are redox active. A high specific capacity that can reach 140 mAh/g has been reported in K-CuFe with a Li-ion organic electrolyte, but the capacity decreases significantly with cycling due to the instability of the reduced state [16,17,18,19]. Stabilization of the reduced states through the application of a coating of stable K-NiFe onto high-capacity K-CuFe has been demonstrated to improve cycle stability [25]. It has been shown that the capacity of K-NiFe with organic electrolytes does not fade over 100 cycles [26,27]. Various approaches, such as employing nanosized [27,28,29], core–shell [26,27,28,29,30], Ni-doped [31], polymer-coated [32,33,34] or carbon-coated [35] PBAs, have been taken to improve cycle stability.
The transferring of H2O onto A sites and the replacement of M′(CN)6 by (H2O)6 are unavoidable when the co-precipitation method is employed for synthesis. The intake of H2O onto A sites reduces the number of sites available for A+ restoration, while intake onto the M′ sites weakens the redox capability at the M′-C sites. These naturally occurring structural imperfections limit the redox capability of PBA as a cathode material. One way to provide additional electrons to facilitate redox activity in the PBAs is through the incorporation of metallic nanoparticles, where surface electrons are weakly bonded to the NPs. Recently, we have demonstrated that the addition of bare Ag or Ni NPs into the vicinity of the nanosized K-CoCo or Na-CoFe particles can effectively improve the electrochemical performance of the batteries, leading toward a higher energy storage capacity [36]. In this study, we focus on the influence of particle size of the host Na-FeFe NPs in the cathode compact on the electrochemical performance of the batteries upon the addition of Ag or Ni NPs, and demonstrate that there is a critical Na-FeFe size to achieve the highest electrochemical energy storage efficiency.

2. Materials and Methods

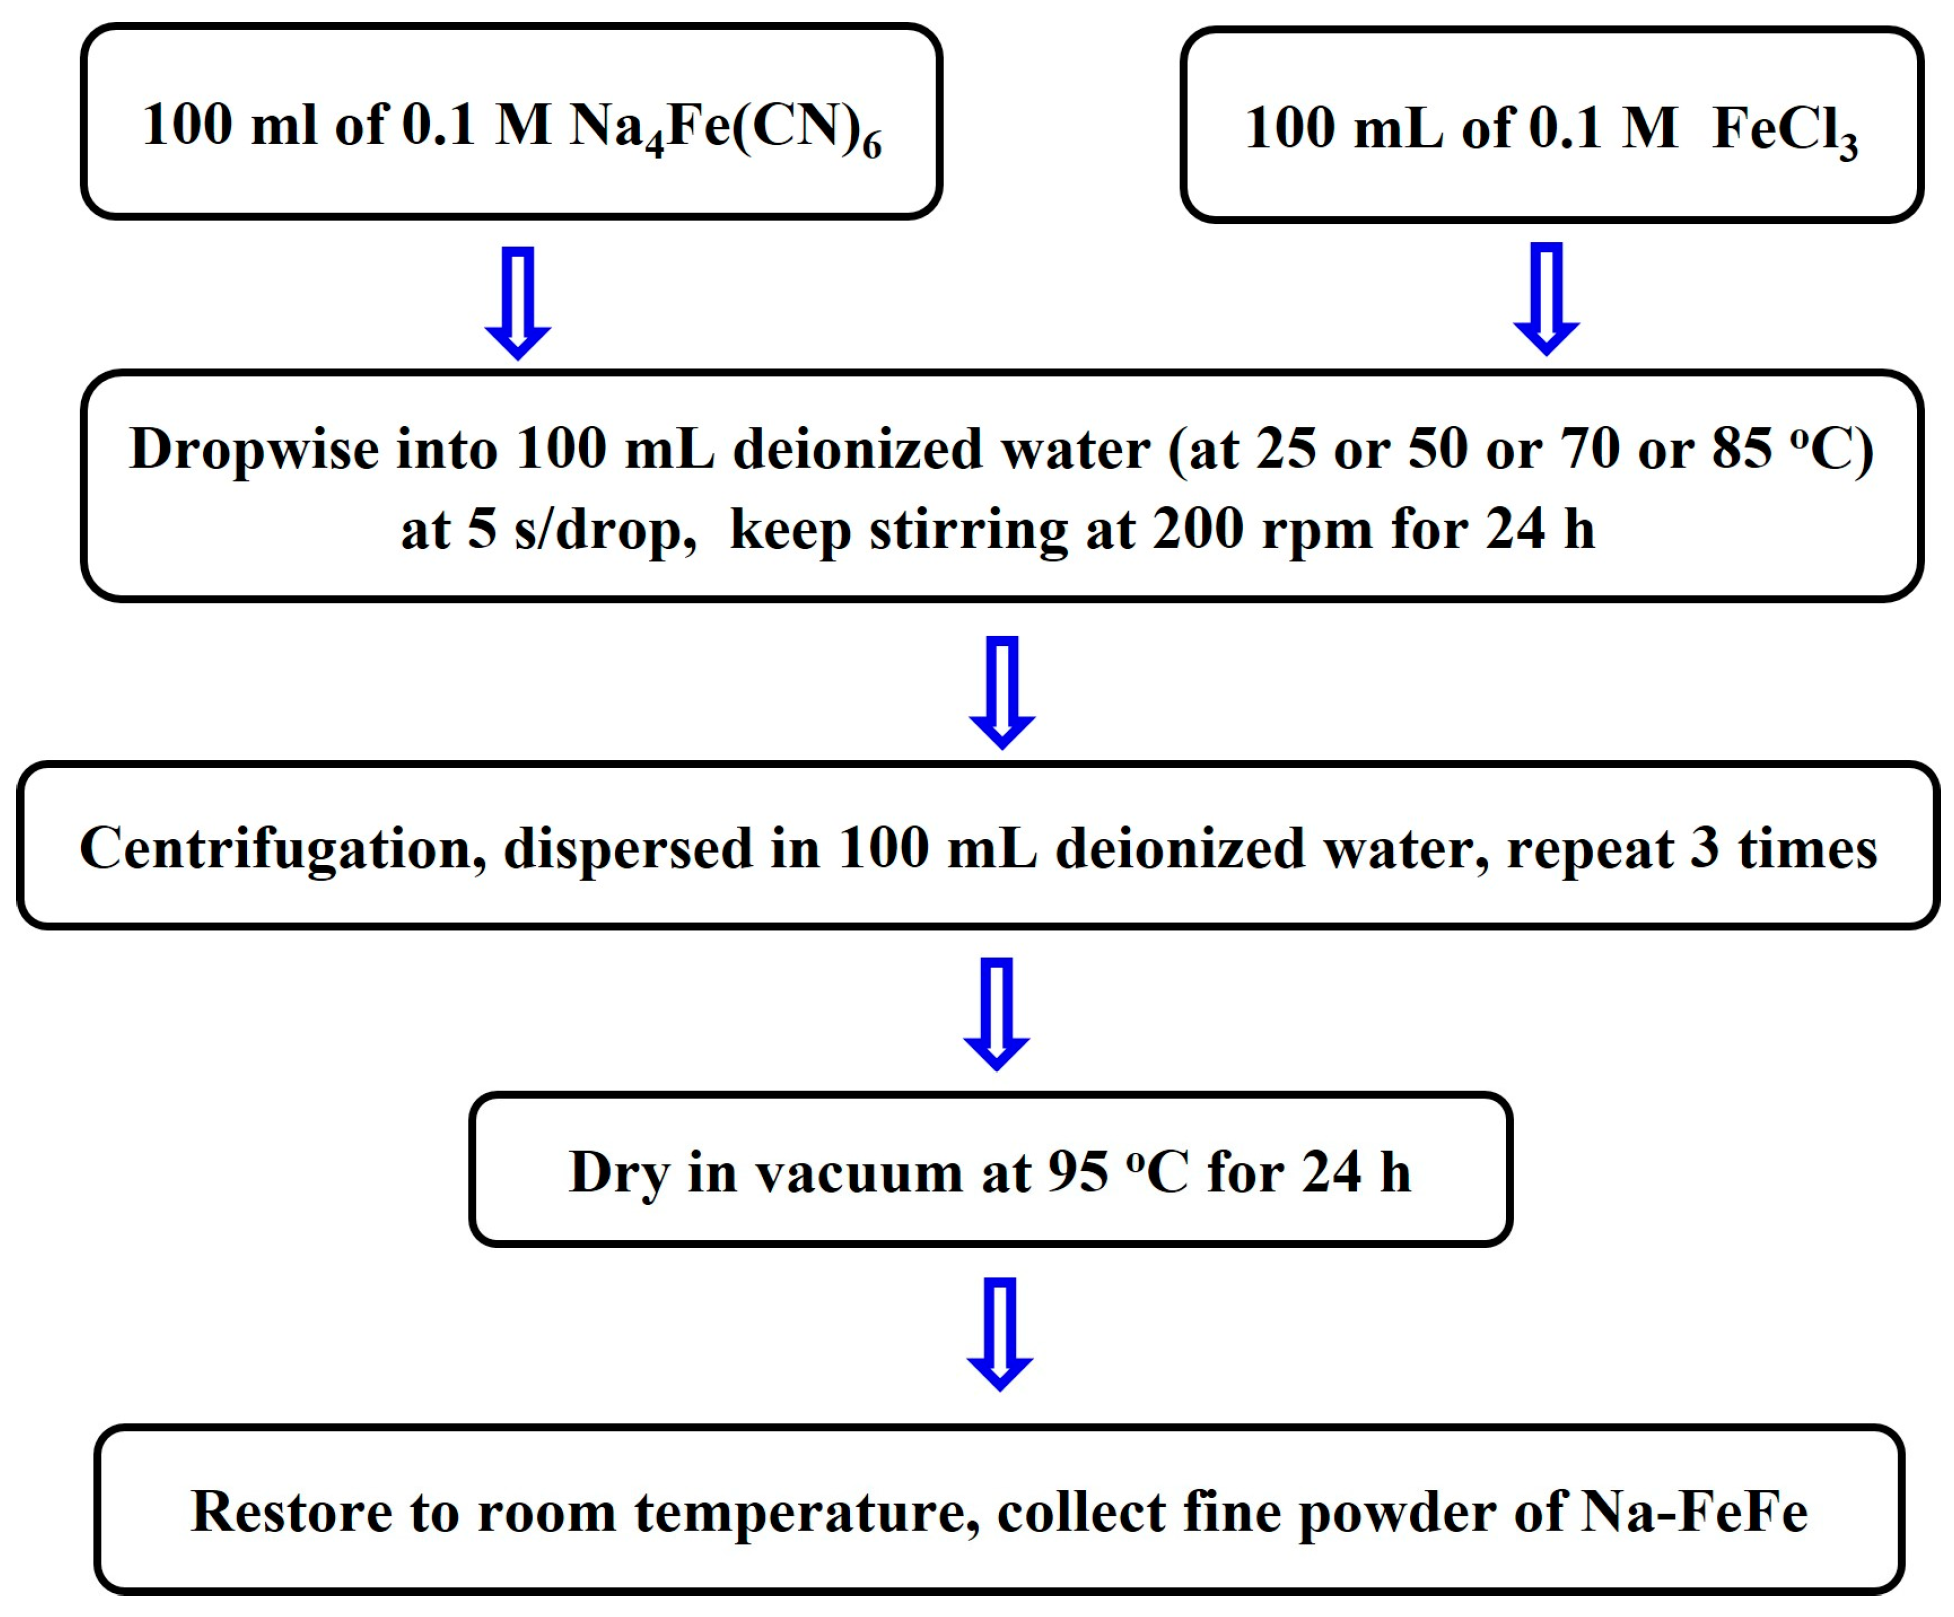
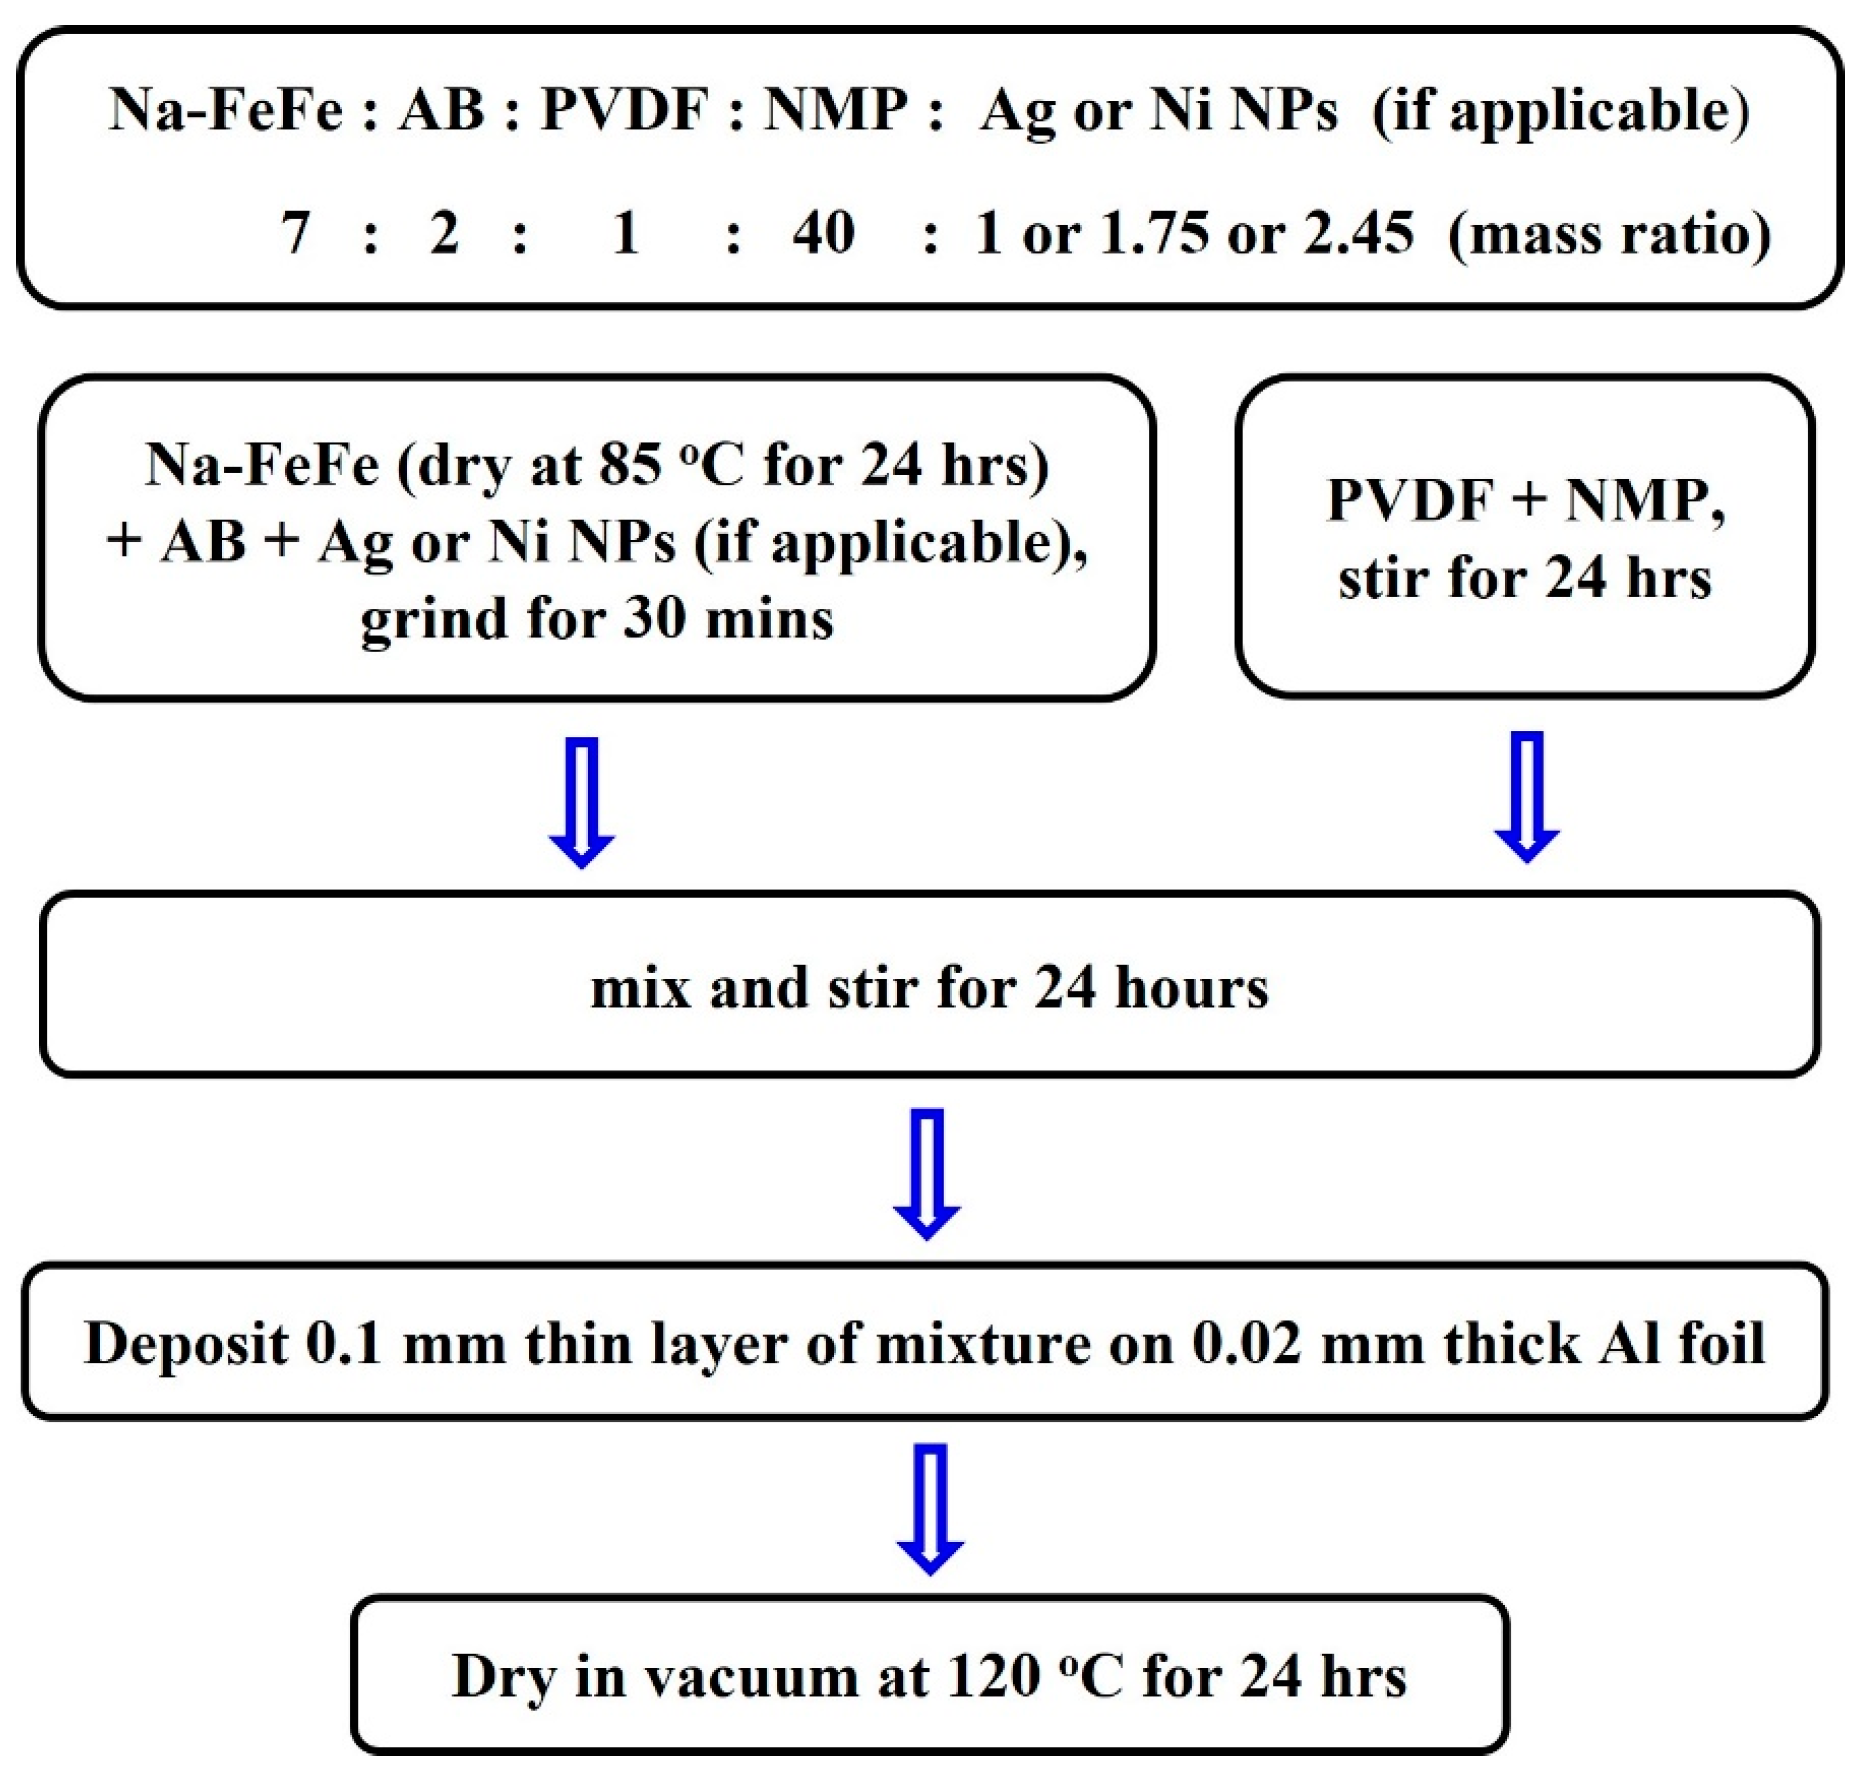
2.1. Synthesis of Prussian Blue Nanoparticles

Four sets of Na-FeFe NPs were synthesized by the co-precipitation method. All reagents were purchased from Alfa-Aesar, Acros-Organics or Nihon-Shiyaku and used without further purification. The deionized water used in the synthetic procedures was obtained from a Milli-Q-Gard purification system. Fast PES Bottle Top Filters with a 0.45 μm pore size obtained from Nalgene were used during the synthesis process. Two separate solutions of 0.1 M Na4Fe(CN)6 and 0.1 M FeCl3 were simultaneously dropped at a rate of 5 s/drop into deionized water maintained at a temperature of 25, 50, 70 or 85 °C, as illustrated in Figure 1. Each solution was slowly stirred at 200 rpm for another 24 h after the addition of the reaction solution was completed. The microcrystalline powder was isolated from the solution through centrifugation before being washed and redispersed in 100 mL of deionized water. This washing process was repeated three times before the wet, muddy powder was dried at 95 °C in a vacuum for 24 h.

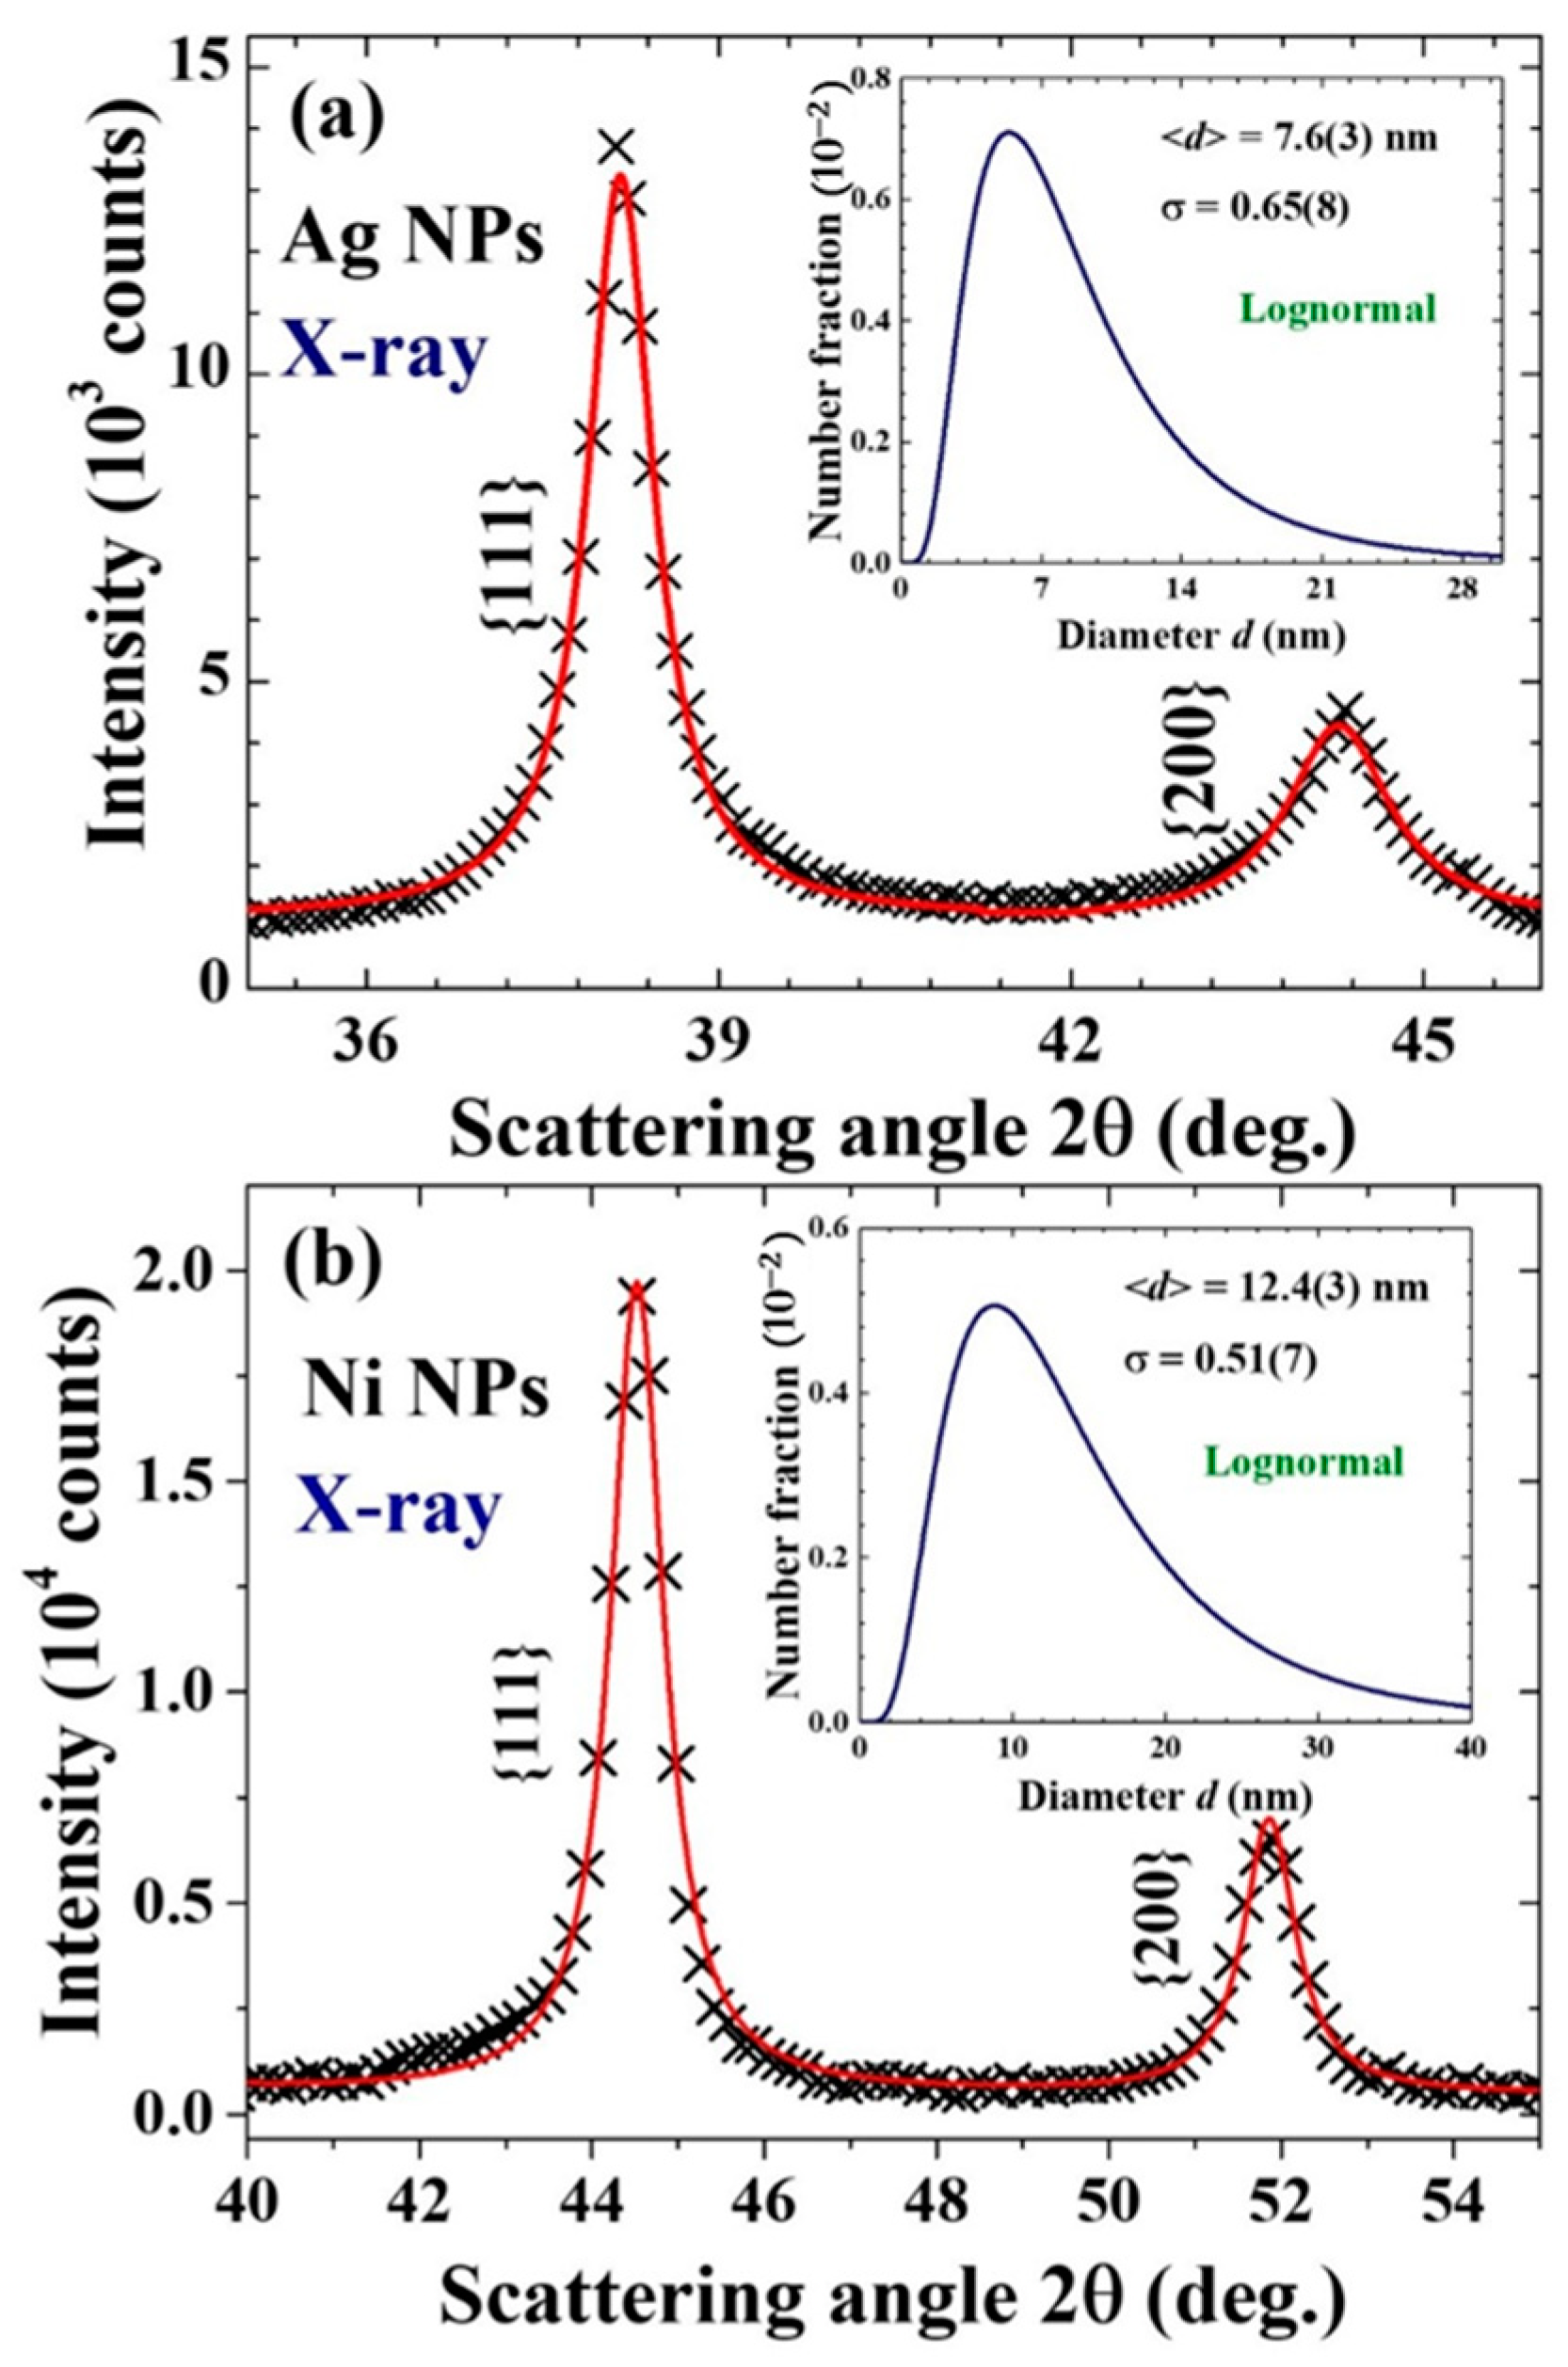
2.2. Synthesis of Ag and Ni Nanoparticles

The Ag/Ni NPs were fabricated by employing the gas condensation method. High-purity Ag/Ni ingots (0.6 g, 99.99% pure, ~2 mm in diameter) were heated by a current source of 65/50 A and were evaporated at a rate of 0.05 Å/s in an Ar atmosphere of 1.5 torr. The evaporated particles were collected on a non-magnetic SS316 stainless steel plate placed 20 cm above the evaporation source, maintained at 77 K. After natural cooling to room temperature, the NPs, which were only loosely attached to the collector, were stripped off in a N2 atmosphere. The samples thus fabricated were in powdered form, consisting of macroscopic amounts of individual Ag/Ni NPs.

2.3. X-ray Diffraction

The X-ray diffraction measurements were performed on a Bruker D8 ADVANCE diffractometer, employing reflection geometry with an incident wavelength of λ = 1.5406 Å from a Cu target and collimation slits of 0.3 mm in width before and after the sample was positioned. For each measurement, ~0.1 g of the sample was shaped into a width of ~1 mm to receive the whole of the X-ray beam at all scattering angles.

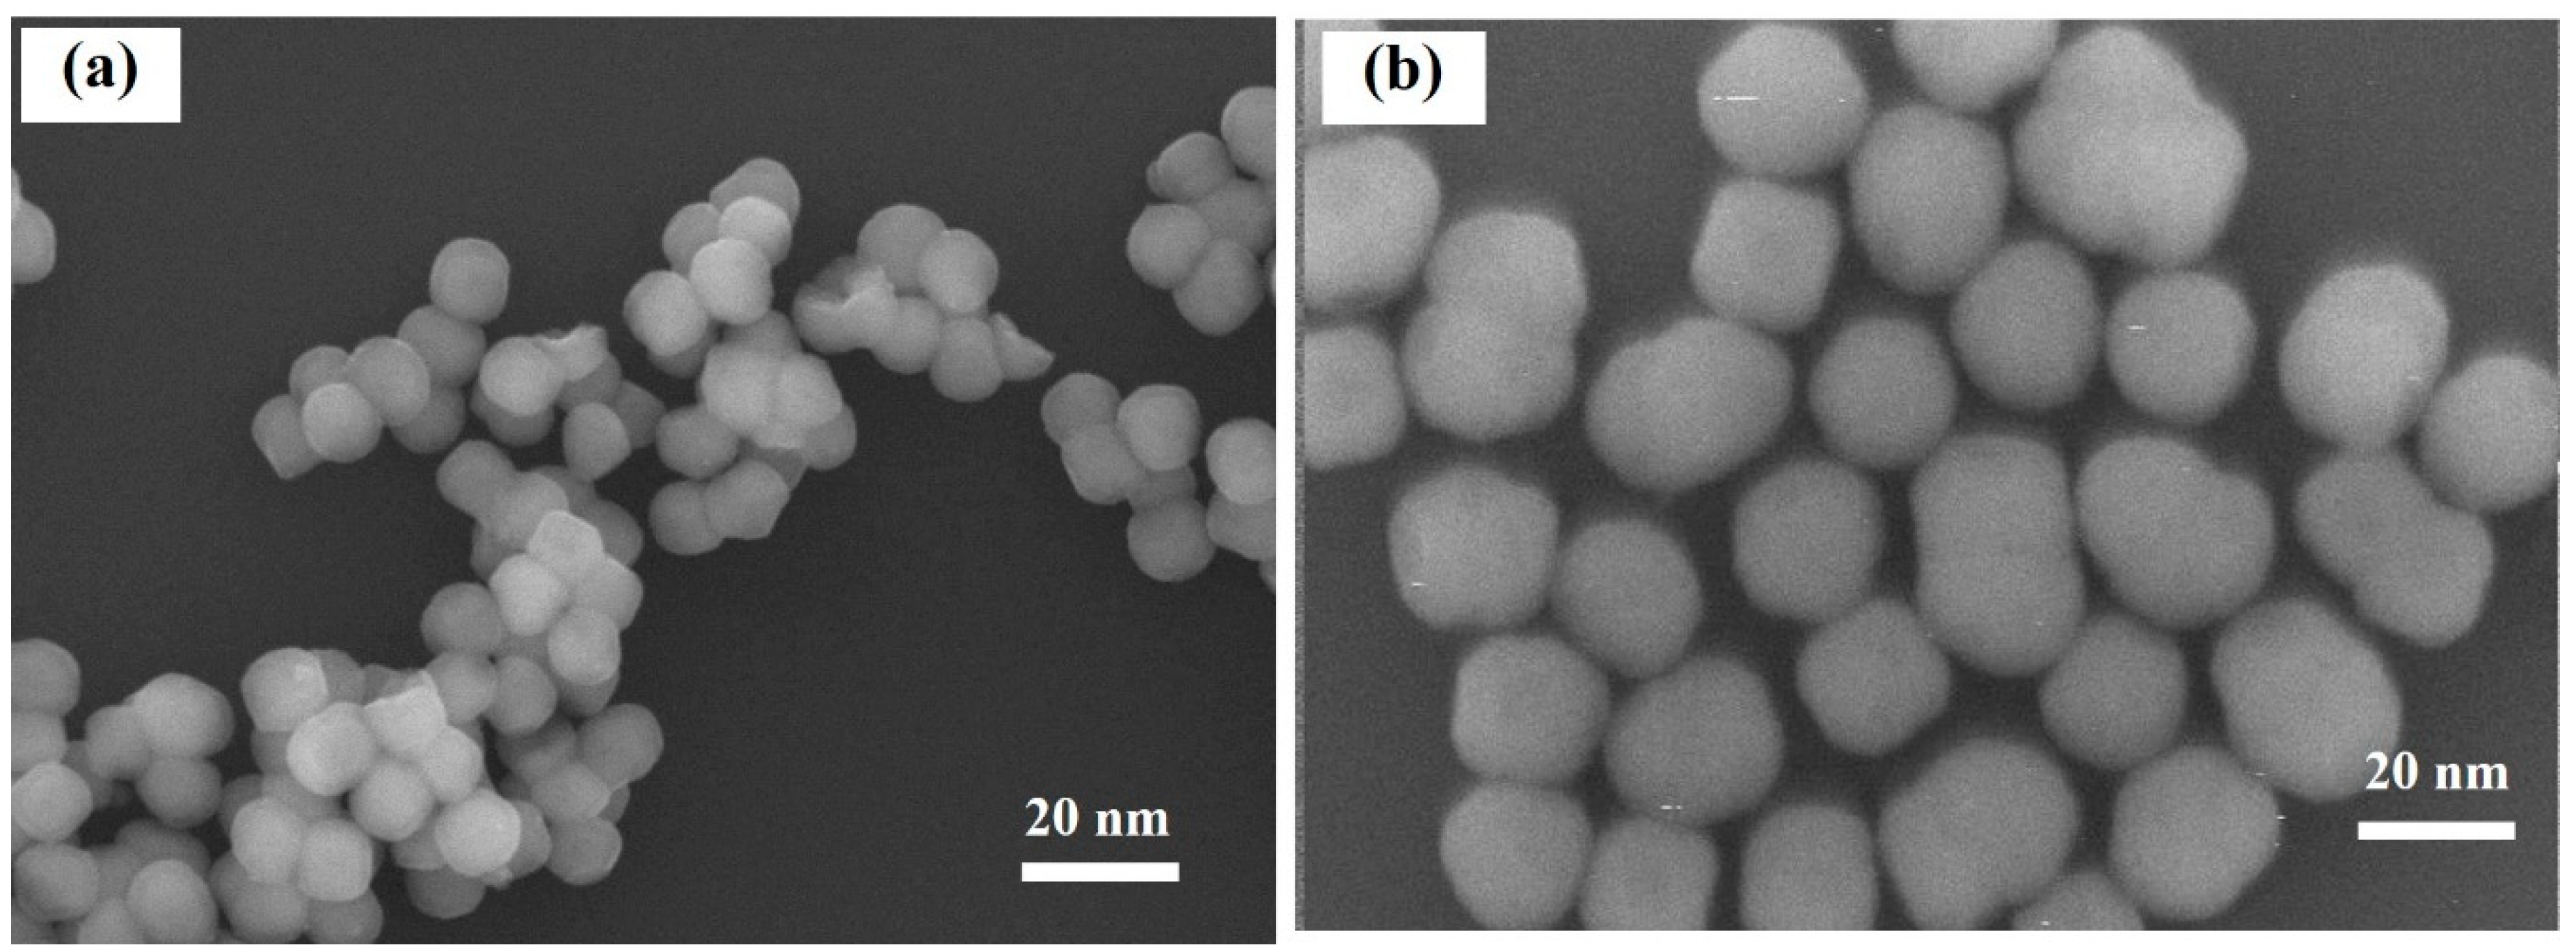
2.4. Transmission Electron Microscopy Images

The transmission electron microscopy (TEM) images were taken on a JOEL 200CX, operated at an acceleration voltage of 160 kV.

2.5. X-ray Photoemission Spectrum

The X-ray photoemission spectra (XPS) were taken on a Thermo Scientific K-Alpha+ XPS system, by Thermo Fisher Scientific, East Grinstead, UK, employing an Al-Kα monochromator with an energy resolution of 0.2 eV.

2.6. Electrochemical Experiments

Electrochemical tests were conducted using a CR2032 coin–cell configuration assembled in a N2 atmosphere with H2O and O2 levels both below 0.01 ppm. The circular working electrode (coated onto thin aluminum foil that was 0.02 mm thick) for Li-ion insertion and extraction contained a uniformly mixed Na-FeFe/Ag/Ni NPs (if applicable)/acetylene-black (AB)/polyvinylidene-fluoride (PVDF)/N-Methyl-pyrrolidone (NMP) slurry (dried in a vacuum at 120 °C for 24 h) with mass ratios of 7:1 (14%), 1.75 (25%) or 2.45 (35%):2:1:40. Details of the electrode fabrication processes are shown in Figure 2. The mass loading for the electrode was 1.9 mg of Na-FeFe over the circular working area, which was 15 mm in diameter and 0.1 mm thick (17.67 mm3 in volume). A piece of porous polypropylene (1.8 mm thick) was used as a separator between the Na-FeFe containing the working electrode and lithium metal electrode, which was filled with 1 M of LiPF6 dissolved in mixed ethylene carbonate (EC) and diethyl carbonate (DEC) solutions (1:1 v/v %) as the electrolyte. The charge–discharge experiments were performed with an HOKUTO HJSD8 in constant current mode, with a cut-off voltage of 1.5 V for Li-ion insertion and 4.0 V for Li-ion extraction. All capacities are expressed per gram of PB.

3. Results and Discussion

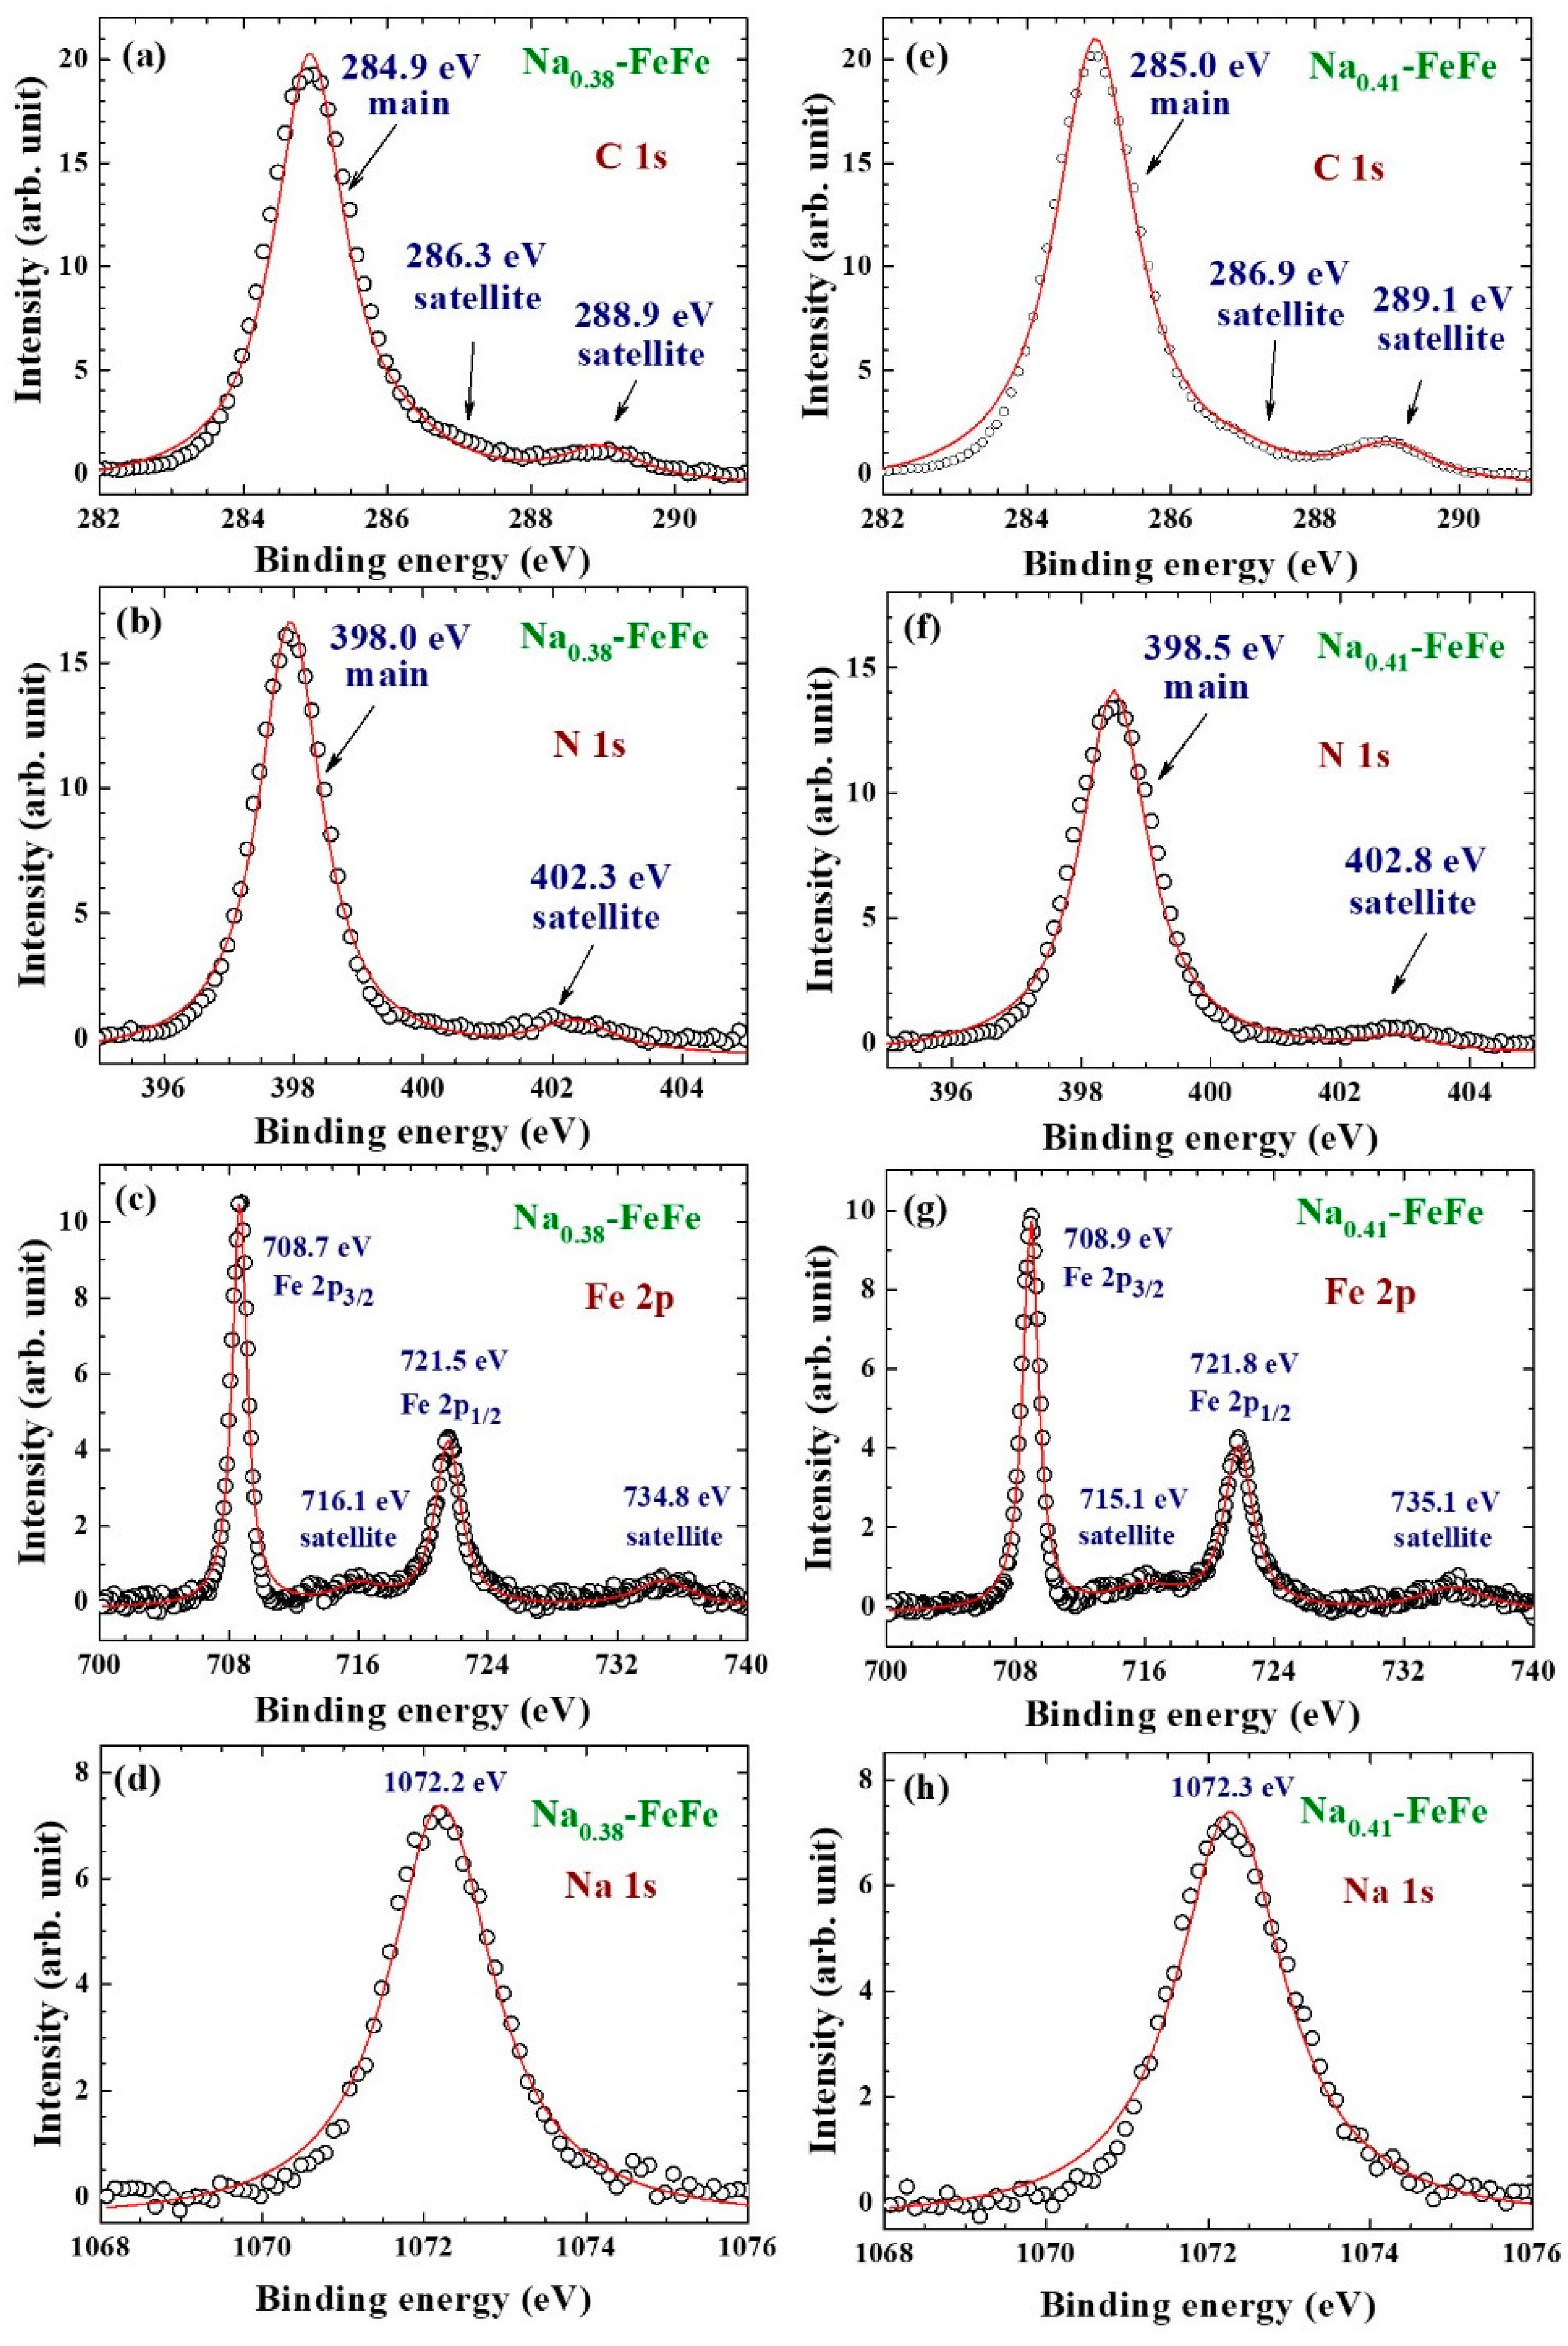
3.1. Chemical Composition
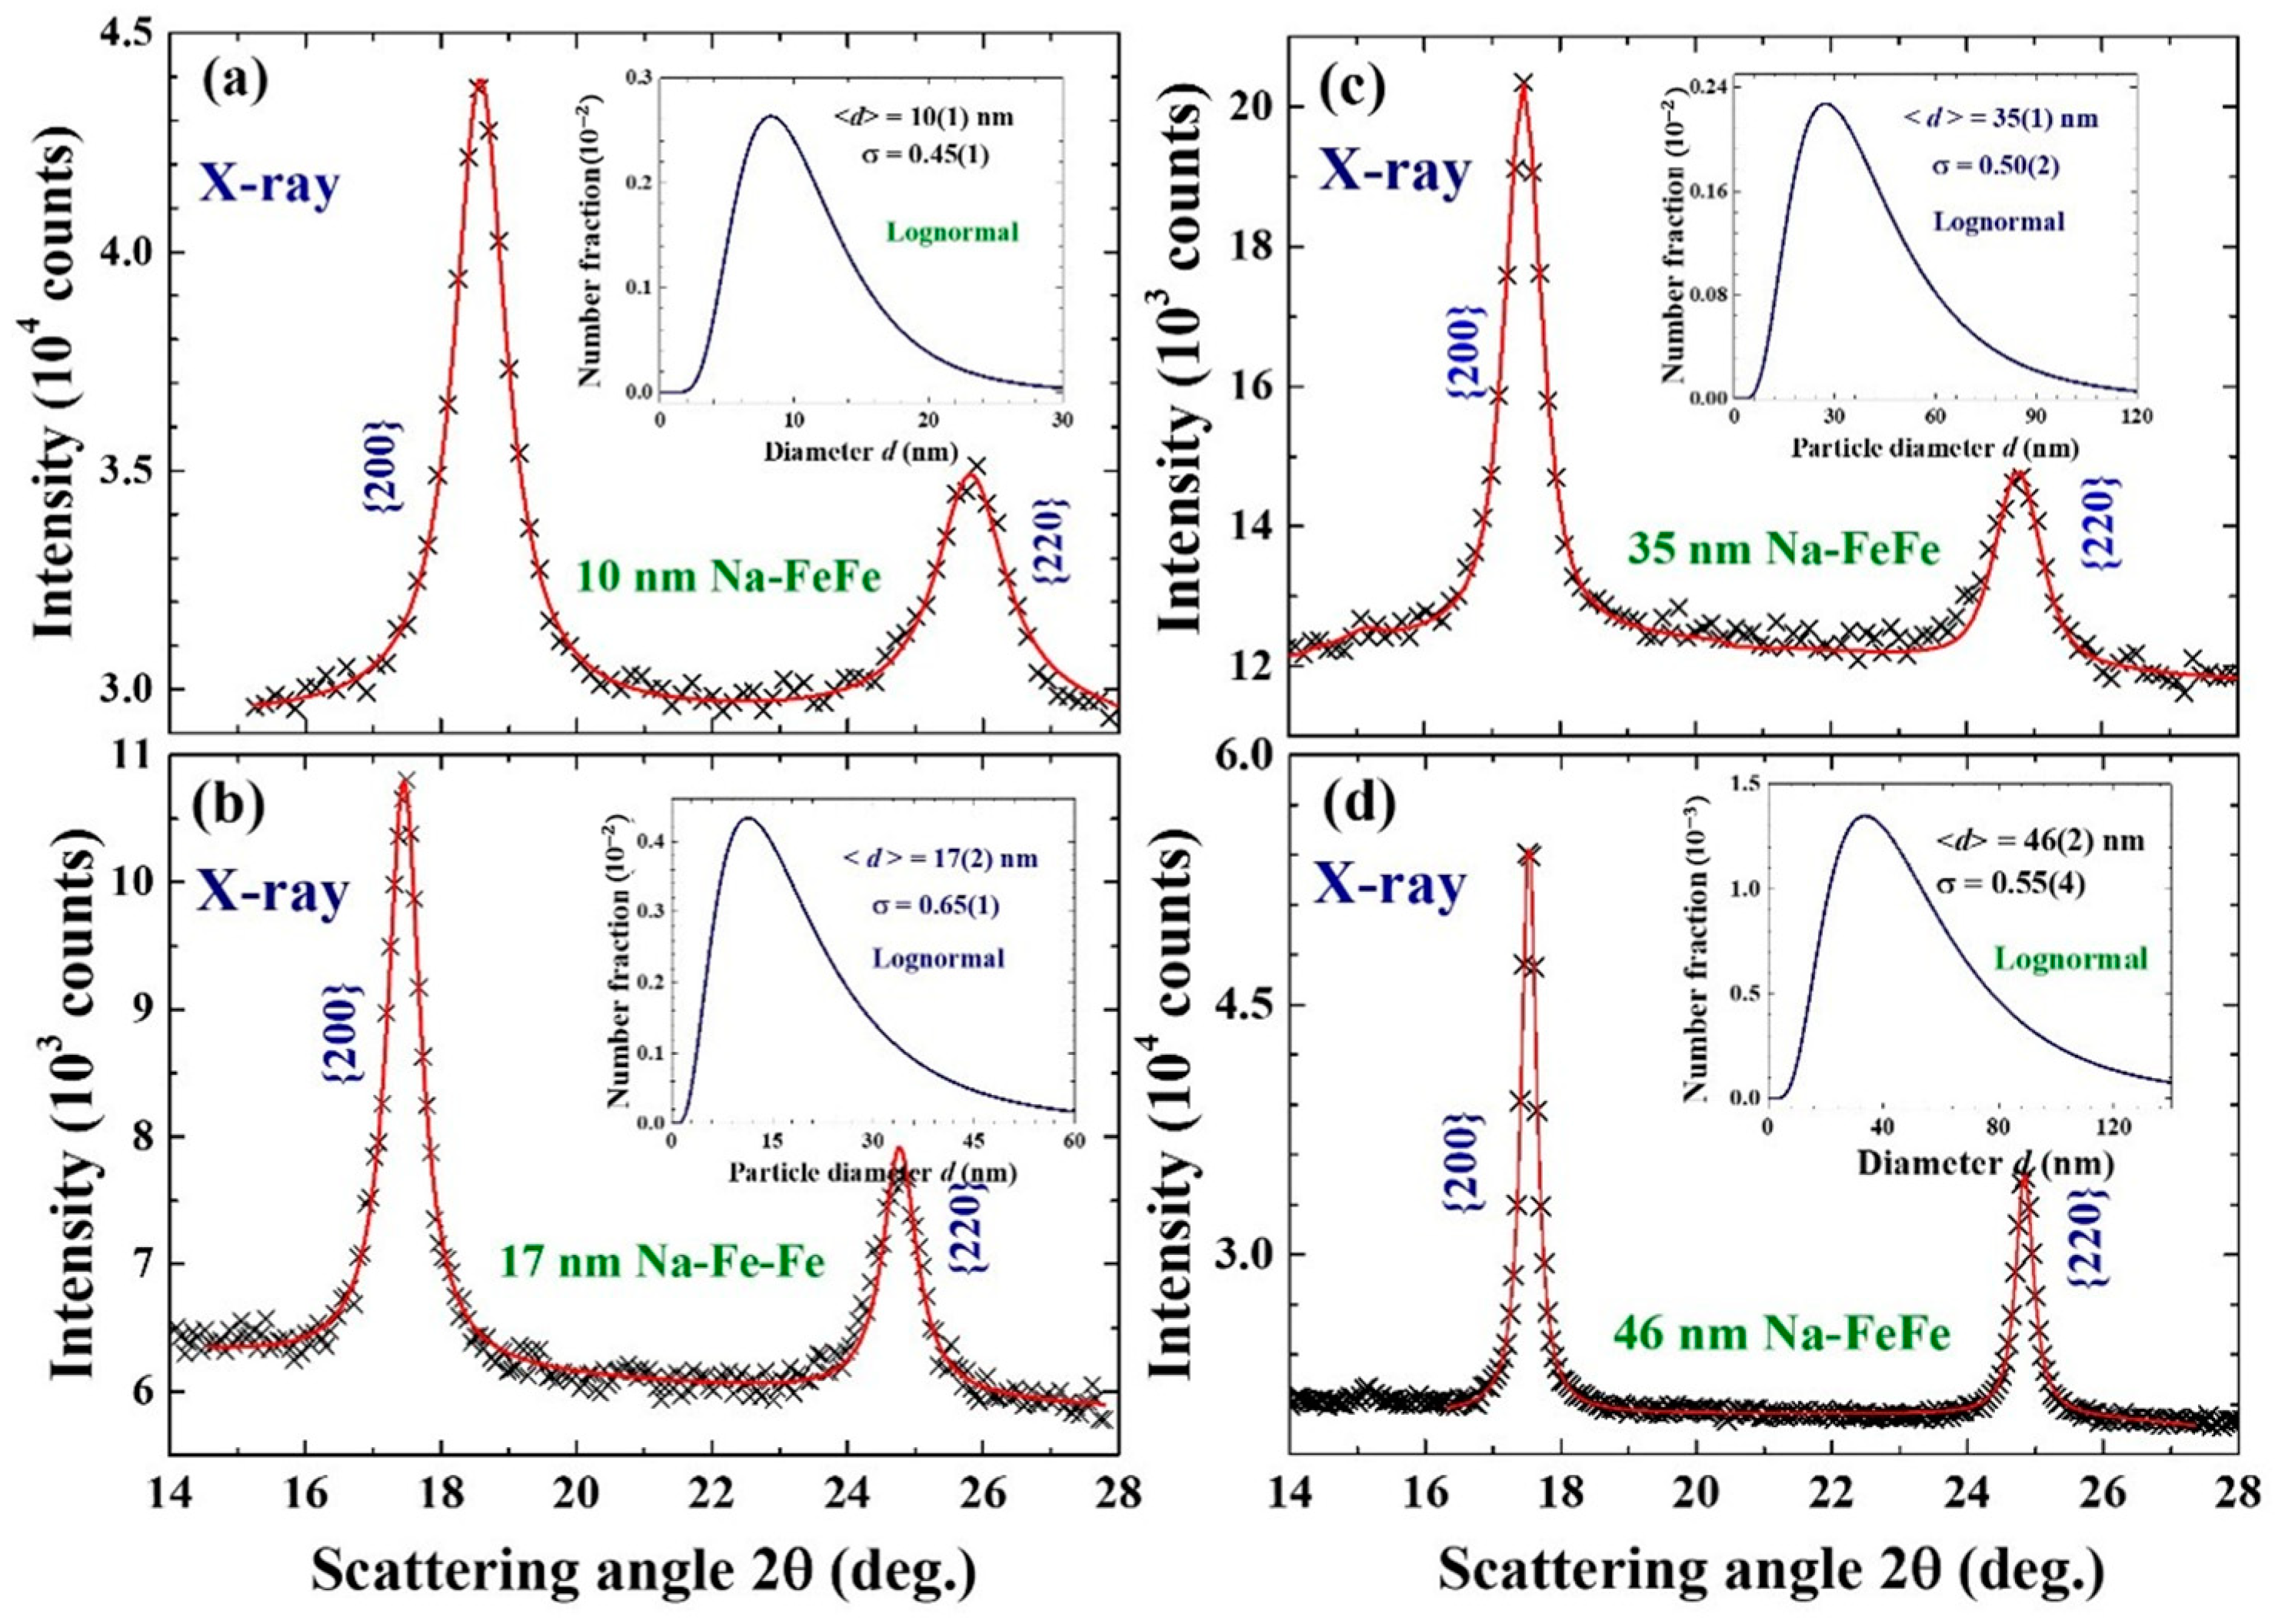
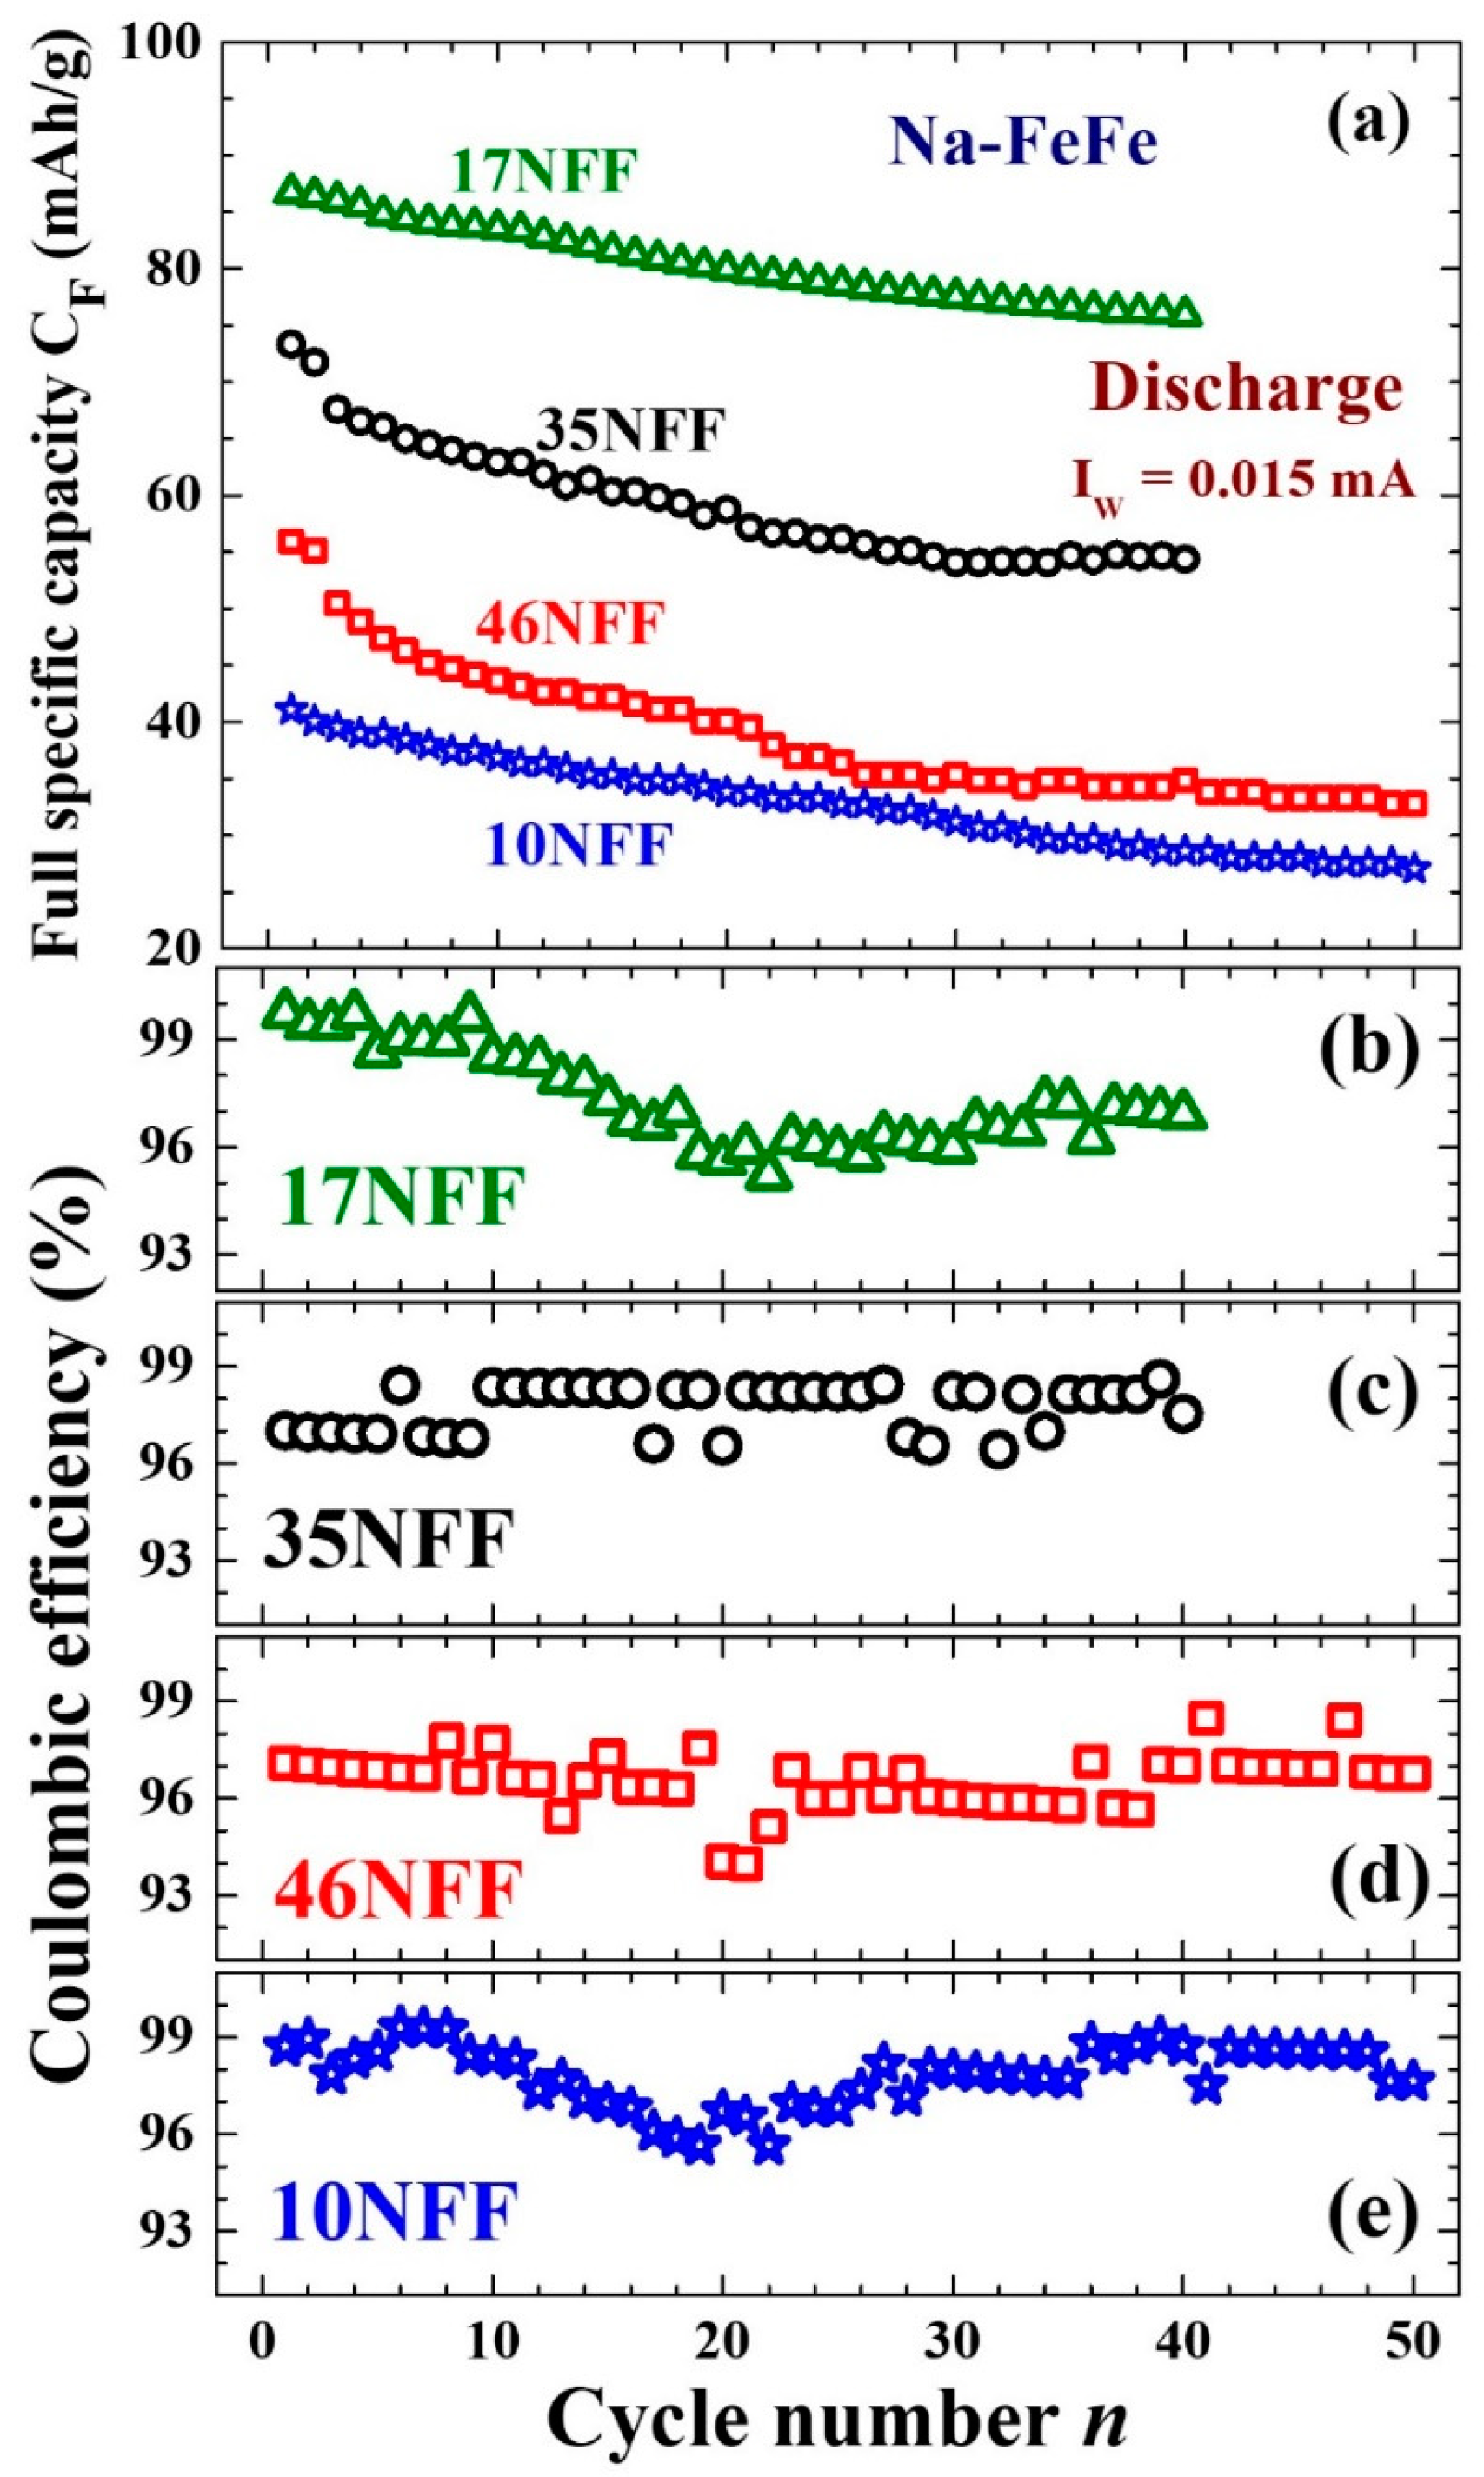
There are two lattice sites in the A-MM′ where H2O can transfer onto them during the co-precipitation reactions [37]. The M ions in A-MM′ form a face-centered cubic sublattice allowing for the accommodation of either M′(CN)6 or (H2O)6 between the two M ions, giving rise to a stoichiometric composition of M[M′(CN)6]1−y[(H2O)6]y. The voids enclosed by the MN6 and M′C6 octahedra can accommodate either A ions or H2O molecules or be left empty, giving a stoichiometric composition of A2x·z(H2O), with 2x + z ≤ 1. Taking A = Na, M = Fe, M′ = Fe and H2O on the O sites in the present PB compounds gives a constrained stoichiometric composition of Na2xFe[Fe′(CN)6]1−y[(H2O)6]y·z(H2O), with a charge balance of 2x + z ≤ 1 and x + 2 − 3(1 − y) = 0 for diffraction pattern refinement. The diffraction patterns were analyzed using the General Structure Analysis System (GSAS) program [38], following the Rietveld profile refining method, assuming a cubic F m 3 ¯ m symmetry. Figure 3a–d illustrate the observed (crosses) and calculated (solid lines) diffraction patterns of the Na-FeFe synthesized with reaction solutions of 25, 50, 70 and 85 °C, respectively, giving a chemical composition of Na0.38Fe[Fe(CN)6]0.82[(H2O)6]0.18·0.34H2O (marked Na0.38-FeFe) for the Na-FeFe synthesized at 25 °C, Na0.41Fe[Fe(CN)6]0.84[(H2O)6]0.16·0.36H2O (marked Na0.41-FeFe) for that synthesized at 50 °C, Na0.34Fe[Fe(CN)6]0.81[(H2O)6]0.19·0.34H2O (marked Na0.34-FeFe) for that synthesized at 70 °C, and Na0.36Fe[Fe(CN)6]0.84[(H2O)6]0.16·0.38H2O (marked Na0.36-FeFe) for that synthesized at 85 °C. Figure 4 illustrates the atomic arrangement of Na-FeFe, with 2/8 of the 8c sites and 1/9 of the 24e sites being occupied by H2O. Occupations of H2O on the 8c or 24e sites will limit the redox capability during the electrochemical processes. Photoemissions from C 1s, N 1s, Fe 2p and Na 1s were all detected in the XPS taken on the Na0.38-FeFe NPs (Figure 5a–d) and on the Na0.41-FeFe NPs (Figure 5e–h), giving a composition ratio of Na/Fe/C/N = 0.20:1:2.76:2.74 (corresponding to Na0.36-Fe[Fe(CN0.99)6]0.85) for the former and 0.23:1:2.78:2.72 (corresponding to Na0.43-Fe[Fe(CN0.97)6]0.86) for the latter. The composition ratio obtained from the XPS and from the X-ray diffraction analysis agree reasonably well. The binding energies of C 1s (Figure 5a,e), N 1s (Figure 5b,f), Fe 2p (Figure 5c,g) and Na 1s (Figure 5d,h) obtained for Na0.38-FeFe are all slightly lower than those for Na0.41-FeFe NPs, suggesting that the particle size of the Na0.38-FeFe is somewhat smaller.

3.2. Particle Size

The X-ray diffraction peaks of Na0.38-FeFe are significantly broader in width than those of Na0.36-FeFe (Figure 3a,b), revealing that the particles in the Na0.38-FeFe NP assembly are much smaller than those in the Na0.36-FeFe assembly. In addition, the X-ray diffraction peaks of the four Na-FeFe, Ag and Ni NP assemblies appear to be much broader than the instrumental resolution, reflecting the broadening of the peak profiles due to the finite-size effect. The size distributions and mean particle diameters of the NP assemblies were determined by fitting the diffraction peaks to the diffraction profiles of finite-sized particles. Taking a Lorentzian diffraction profile of the peak width wi(di) from each nanoparticle of diameter di, the diffraction intensity Ihkl of the (hkl) Bragg reflection at a scattering angle 2θ from a multi-dispersed NP assembly with a log-normal size distribution ni(di) takes the following form [39,40]:
I h k l 2 θ , w i , n i = C d i 2 π w i 4 ( 2 θ 2 θ h k l ) 2 + w i 2 n i d i
w i t h   w i d i = 0.94 λ d i cos θ h k l
a n d   n i d i = 1 d i 2 π σ e x p l n d i l n d m 2 2 σ 2 ,
where C is the instrumental scale factor, 2θhkl is the Bragg position of the (hkl) reflection, λ is the X-ray wavelength, dm is the mean particle diameter and σ is the standard deviation of the size distribution of the NP assembly. Figure 6a–d show the observed (crosses) and calculated (solid lines) {200} and {220} diffraction peak profiles of the Na0.38-FeFe, Na0.41-FeFe, Na0.34-FeFe and Na0.36-FeFe NP assemblies, respectively, obtained from the fits of the diffraction profiles to the expression (1). A mean particle diameter of d = 10(1) nm with a deviation width of σ = 0.45(1) was obtained for the Na0.38-FeFe NP assembly (inset to Figure 6a), that of d = 17(2) nm with σ = 0.65(1) for the Na0.41-FeFe NP assembly (inset to Figure 6b), that of d = 35(2) nm with σ = 0.50(2) for the Na0.34-FeFe NP assembly (inset to Figure 6c) and that of d = 46(2) nm with σ = 0.55(4) for the Na0.36-FeFe NP assembly (inset to Figure 6d). Figure 7 displays the representative TEM images obtained for the Na0.38-FeFe (Figure 7a) and Na0.41-FeFe (Figure 7b) assemblies, giving an average particle diameter of 9.5 nm for the Na0.38-FeFe assembly and 17.5 nm for the Na0.41-FeFe assembly. There is no noticeable asymmetry in the shape of the nanoparticles identified in the TEM images. The average particle diameters of the PB NPs obtained from the X-ray diffraction and from the TEM images agree very well. It appears that larger particles were obtained for the Na-FeFe synthesized at a higher reaction temperature. A profile analysis of the X-ray diffraction peaks of the Ag and Ni NP assemblies gives d = 7.6(3) nm with σ = 0.65(8) for the Ag NP assembly (Figure 8a) and d = 12.4(3) nm with σ = 0.51(7) for the Ni NP assembly (Figure 8b). The reaction temperature, chemical composition, lattice parameters, mean particle diameter and deviation width of the size distribution for each of the four Na-FeFe compounds, the Ag NP assemblies and the Ni NP assemblies are listed in Table 1.

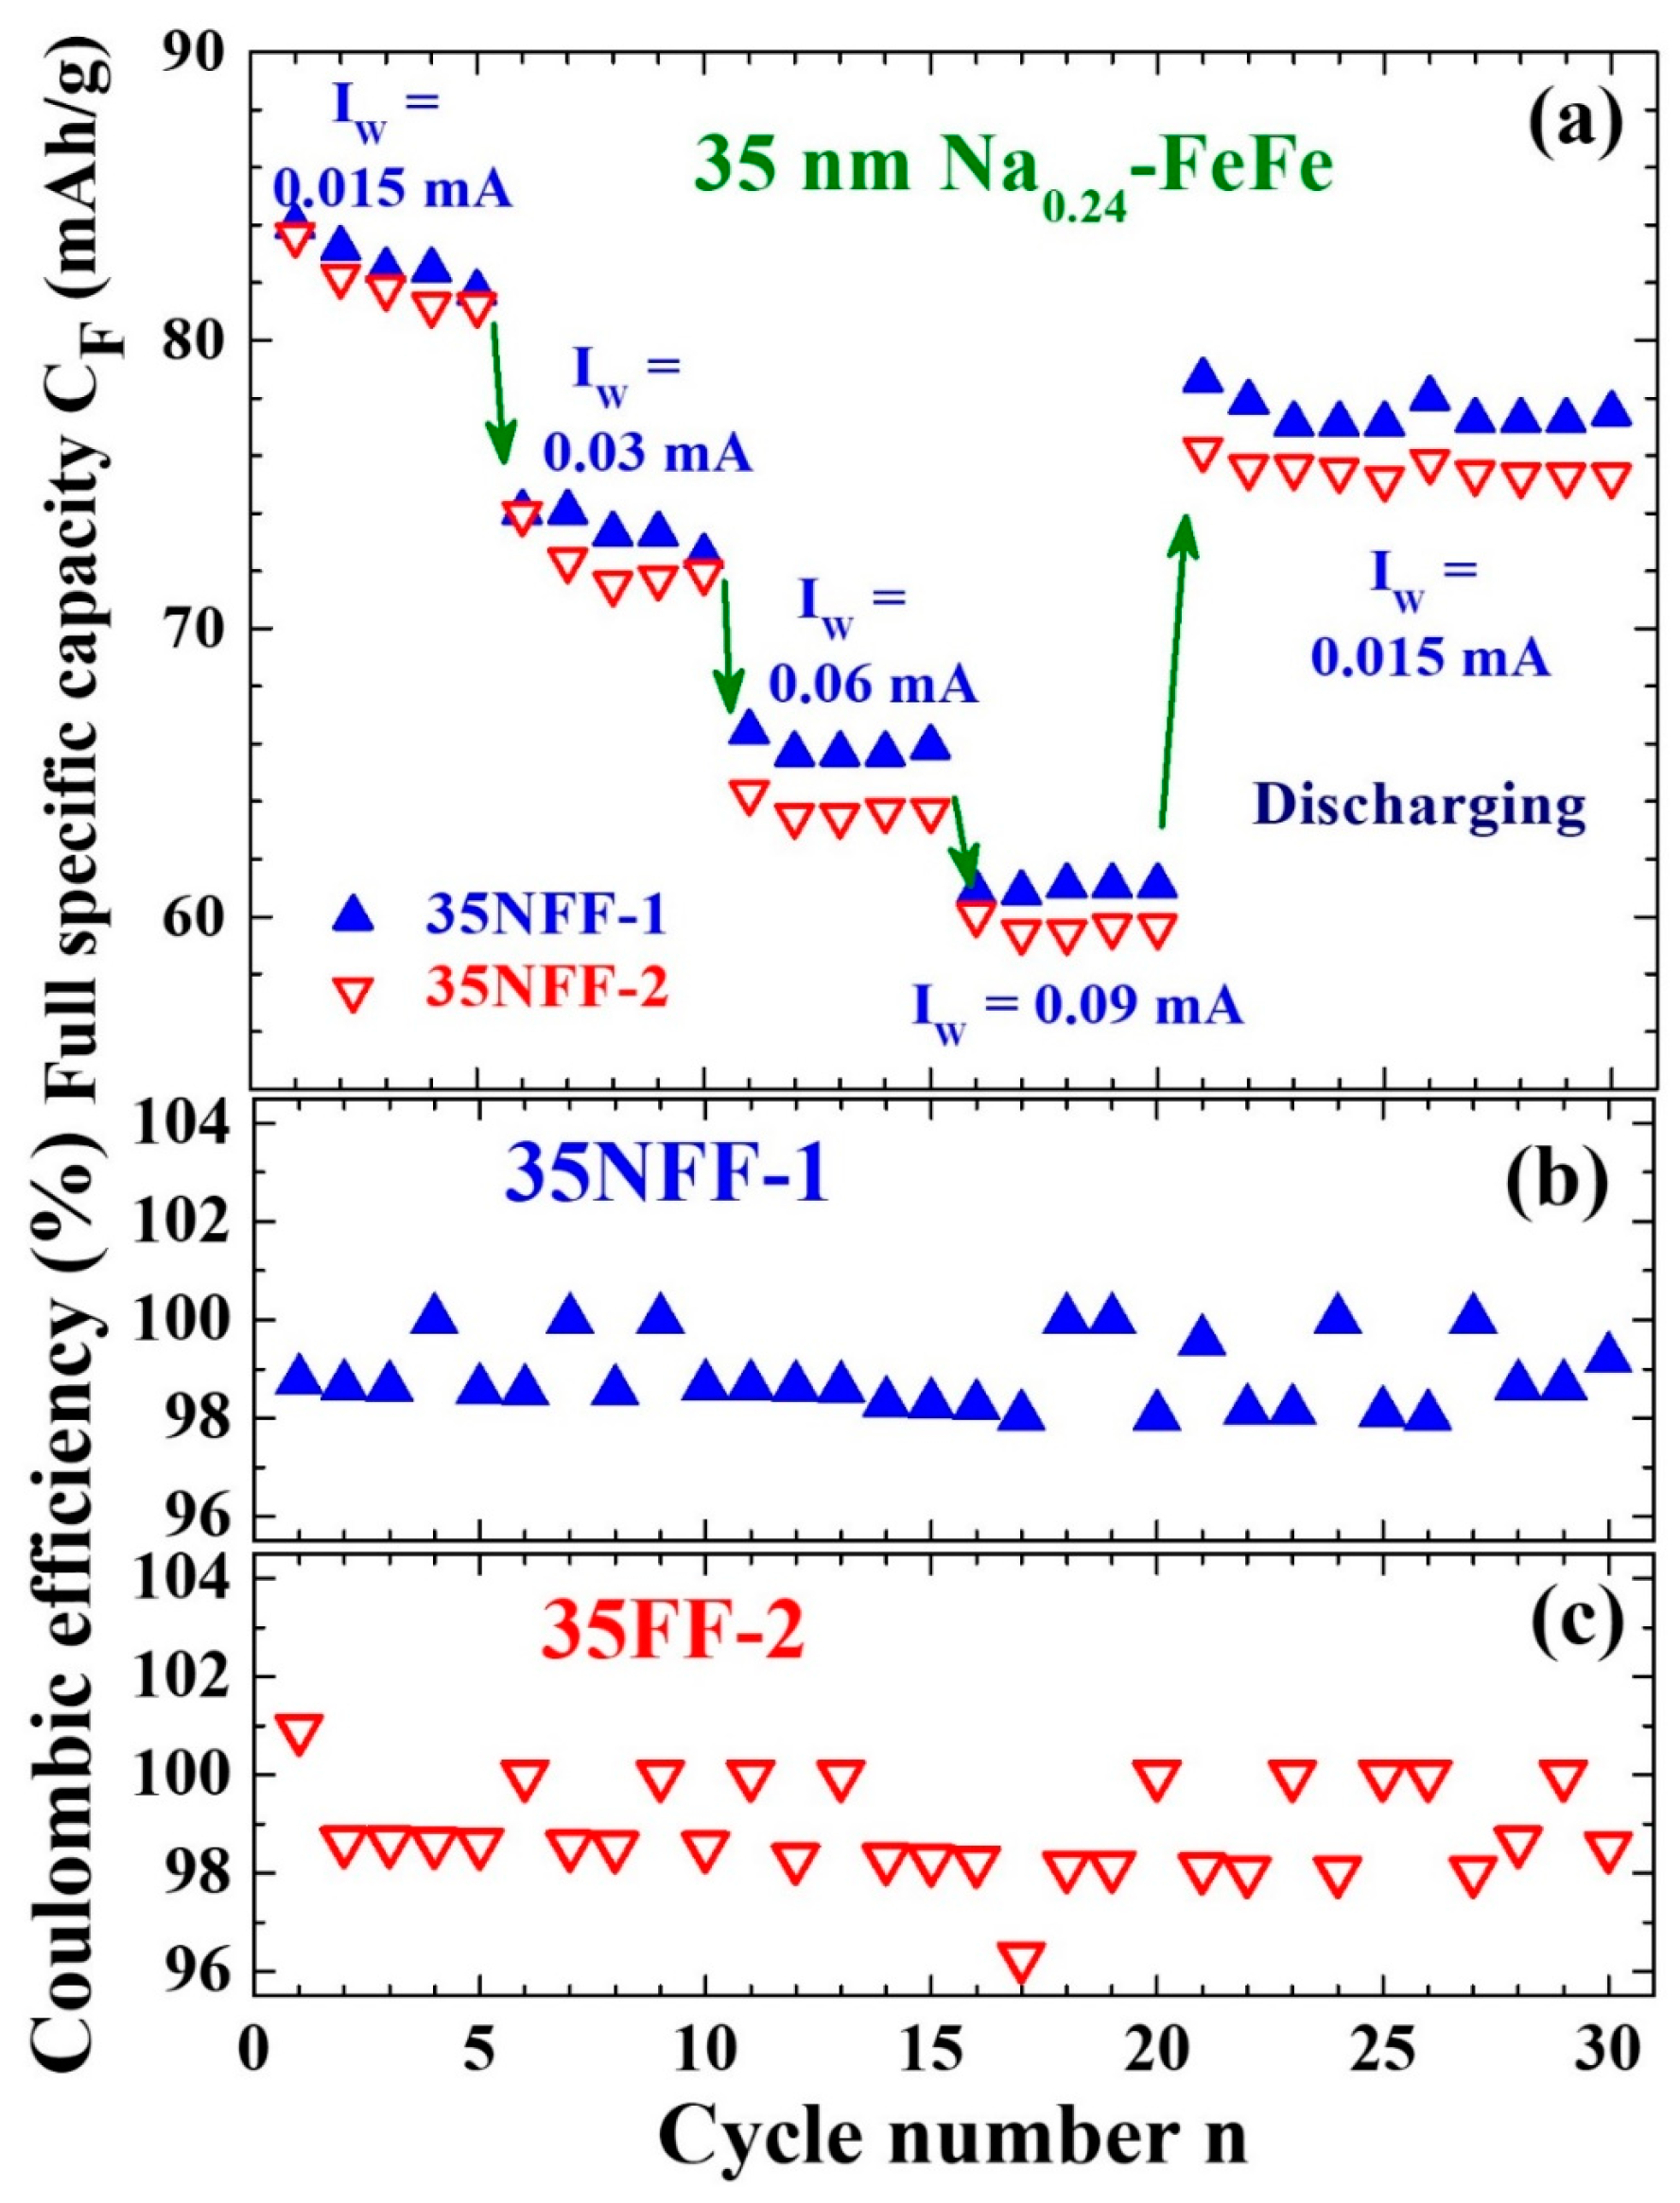
3.3. Ultimate Size for Energy Storage

The galvanostatic charge–discharge (GCD) cycles were performed in constant working current IW mode for each cycle. The working electrodes packed using 10, 17, 35 and 46 nm Na-FeFe are labeled 10NFF, 17NFF, 35NFF and 46NFF, respectively. Obvious differences in the GCD profiles are observed for the batteries using different sizes of Na-FeFe in the working electrode. The GCD profiles of the 17NFF battery took the longest in time to complete a cycle, followed by the 35NFF battery and then the 46NFF battery, but the 10NFF battery took the shortest time (Figure 9). Among the four batteries studied, the 17NFF battery had the highest energy capacity. The full specific capacity (FSC) CF of the 17NFF battery reached 86 mAh/g in the initial cycle at IW = 0.015 mA, but it gradually decayed to 76 mAh/g and then stabilized after 40 GCD cycles (open triangles in Figure 10a). A relatively low CF of 42 mAh/g, which is only 50% of that for 17NFF, was obtained for the 10NFF battery (open stars in Figure 10a). The decay profiles of CF with respect to the number of GCD cycles completed for the four batteries are similar, with Coulombic efficiencies for all of the cycles studied in the four batteries reaching between 95 and 99% (Figure 10b–e). The Na and H2O contents in the four Na-FeFe compounds studied are similar (Table 1). It is mainly the size of Na-FeFe that gives rise to the differences in the GCD behavior. Apparently, there is a size limit to the Na-FeFe NPs to obtain the highest electrochemical energy storage efficiency. The higher energy storage efficiency of the 17NFF battery compared to the 35NFF and 46NFF batteries is a direct result of there being more Na-FeFe particles for dispersal in the working electrode allowing for the receiving and releasing of Li+ ions. On the other hand, the Li+ ions are received and released at the surfaces of the Na-FeFe NPs facing the anode. The reduction in energy storage efficiency of the 10NFF battery is thus a result of the appearance of a large amount of surface atoms that cannot effectively store Li+ ions. It is the competition between the number of NPs that are available for dispersal over the electrode and the loss of storage capability for the atoms on the surfaces of the NPs that result in the ultimate size limitation for electrochemical energy storage by the Na-FeFe NPs.
The full specific capacity CF can be affected by the working current employed in running the GCD cycles. The CF of the two 35NFF batteries, configured using working electrodes with the same set of coatings, was measured by employing a sequence of different IWs for the GCD cycles (Figure 11a). A CF of 84 mAh/g was obtained for the two 35NFF batteries at IW = 0.015 mA. A direct drop in CF appeared whenever the IW was raised. The CF dropped to 60 mAh/g after runs through a series of changes in the IW from 0.015 to 0.03 to 0.06 to 0.09 mA. Remarkably, the CF jumped back to 78 mAh/g when the IW was subsequently reduced to 0.015 mA. The behavior of the CF with respect to the IW shows that the loss of the CF at a high IW is linked to the reduced efficiency in receiving Li+ onto the Na-FeFe. Coulombic efficiencies for all of the cycles studied in the two batteries reached ~99% (Figure 11b,c). Discharging at a high IW drives the accumulation of more Li+ ions onto the cathode plate rather than causing them to enter the Na-FeFe NPs for energy storage, which builds the potential between the cathode and the anode, but with fewer Li+ ions stored in the Na-FeFe NPs.

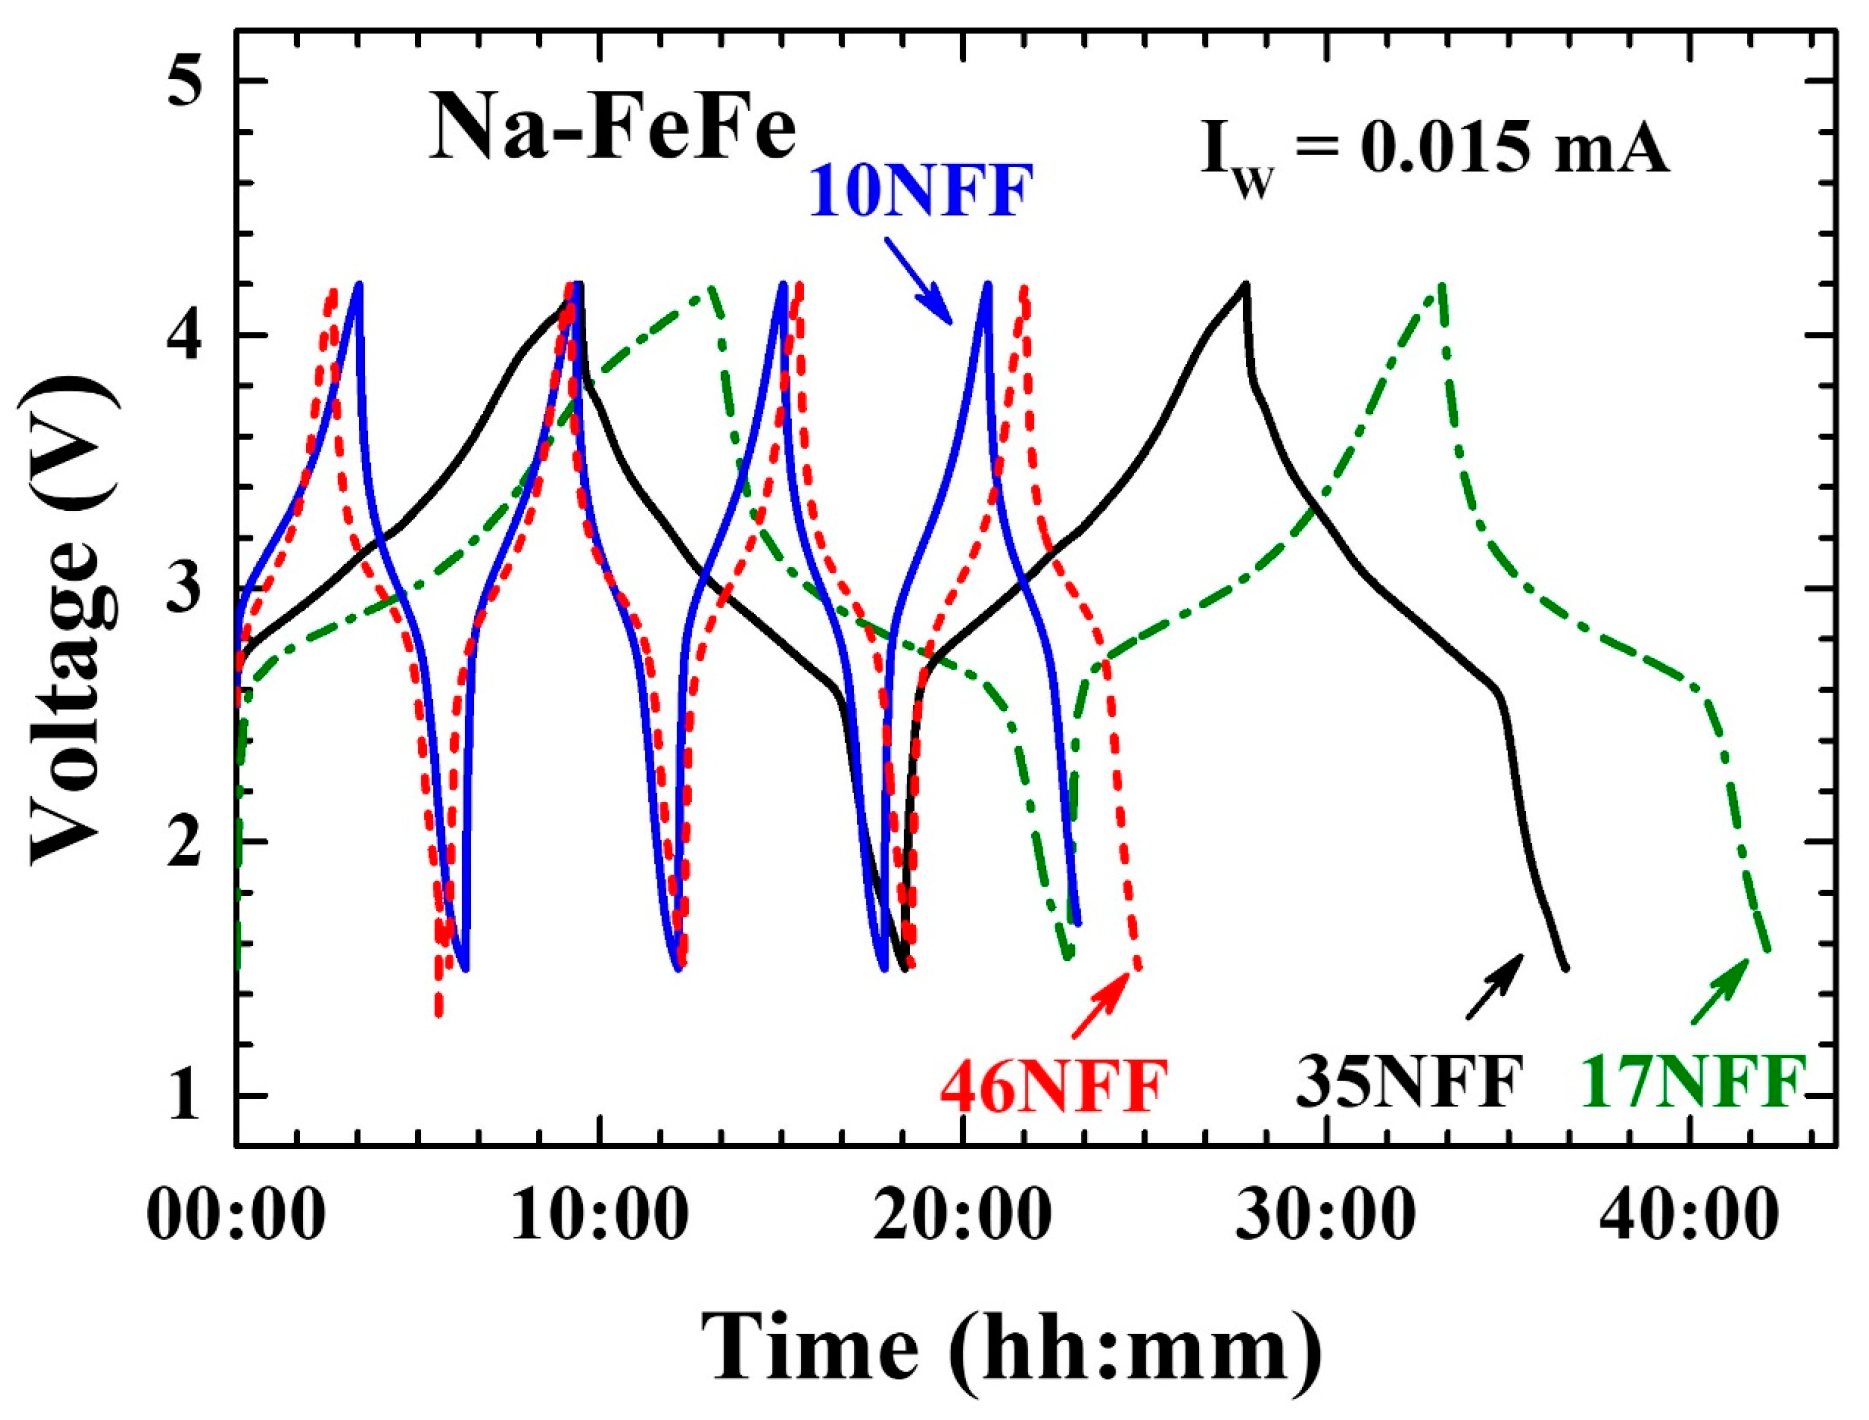
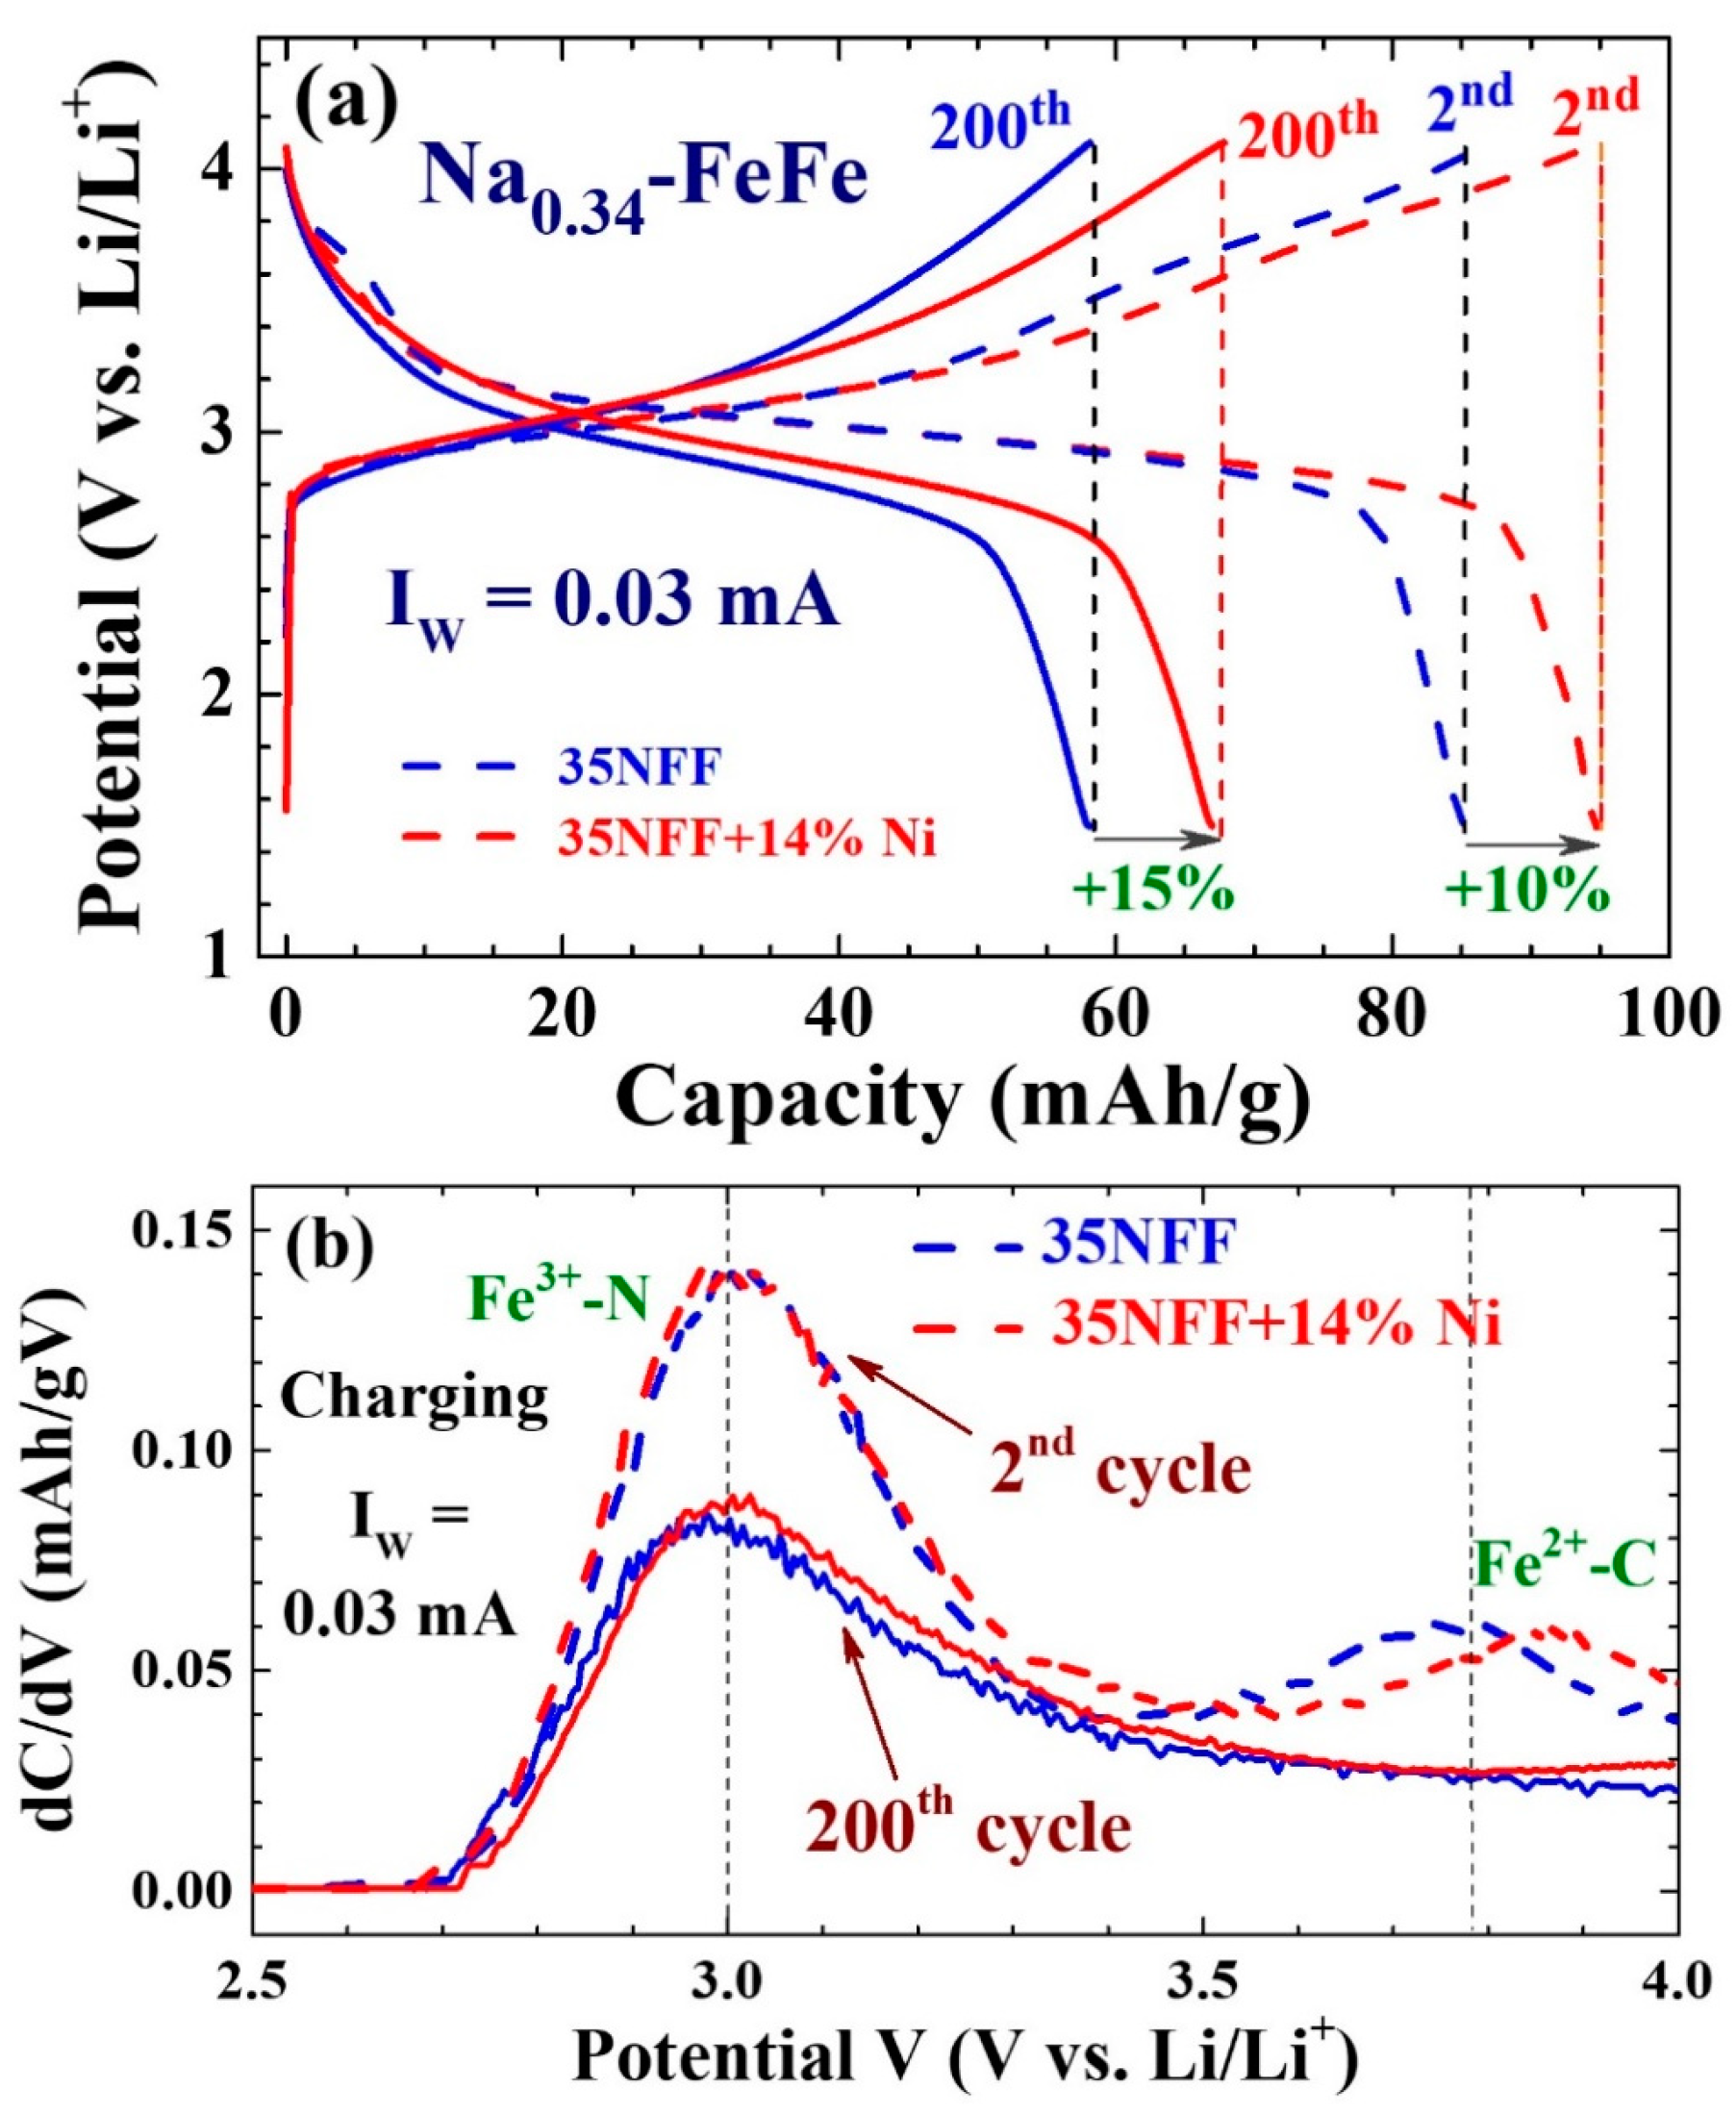
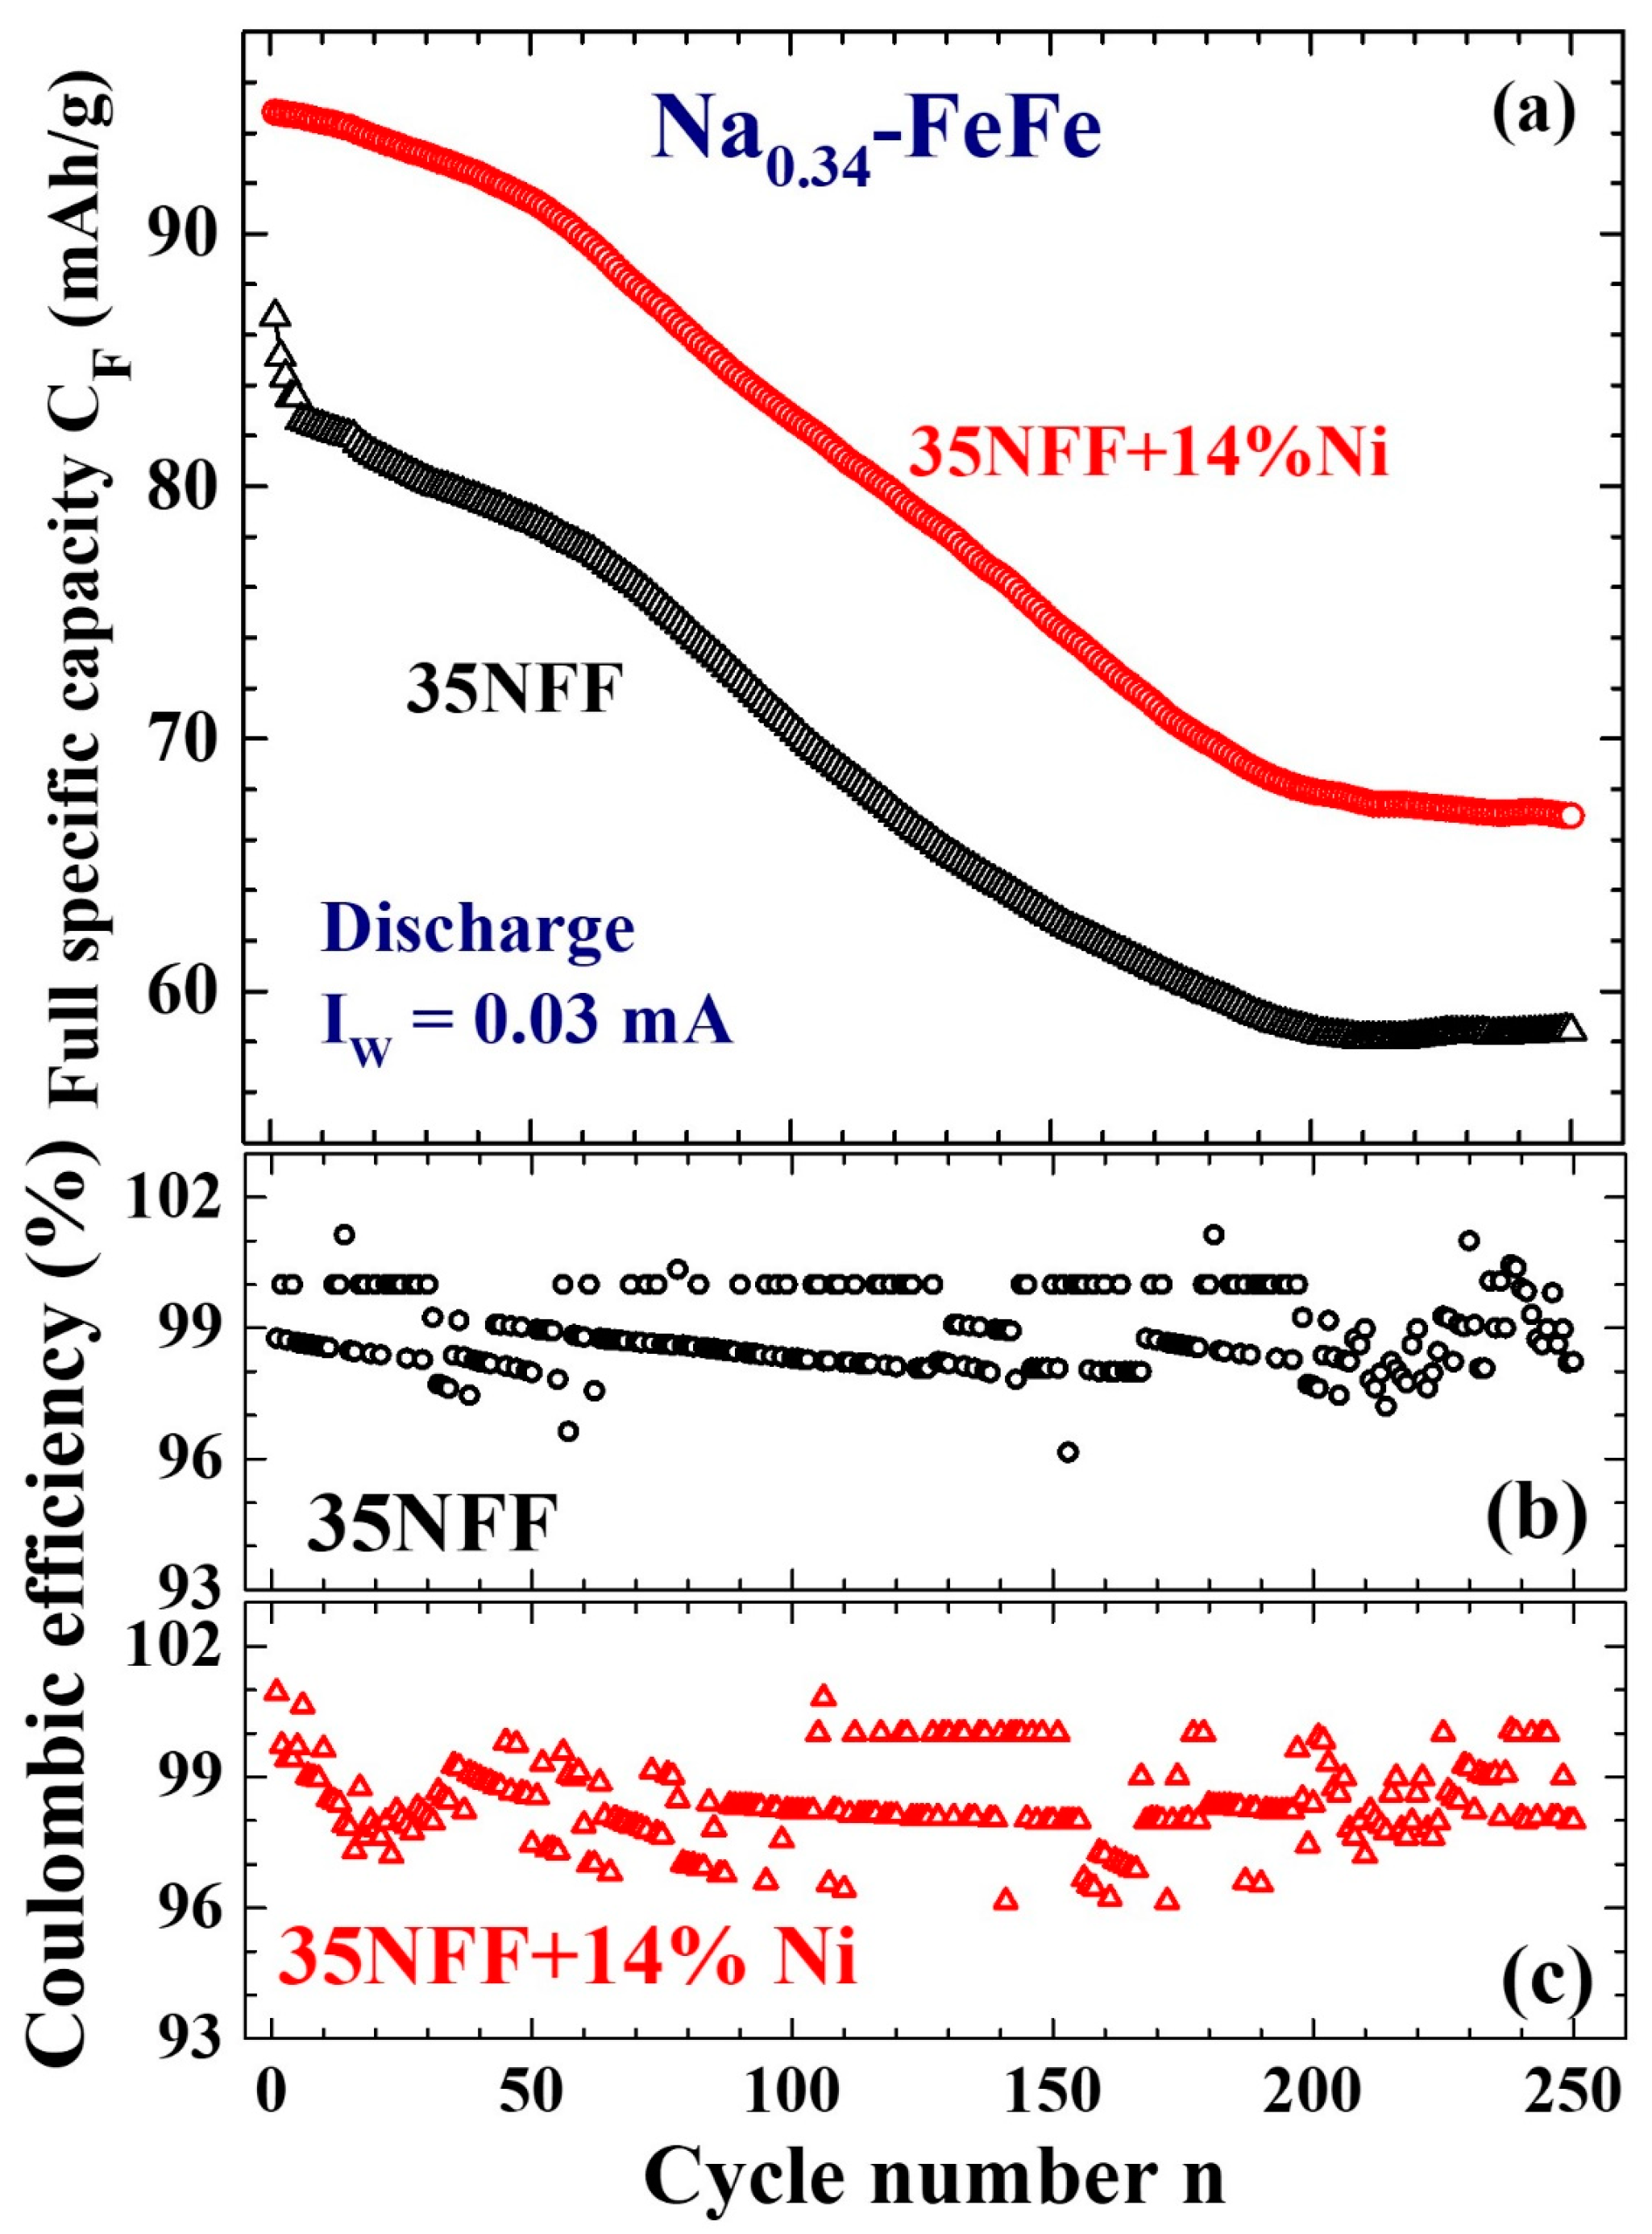
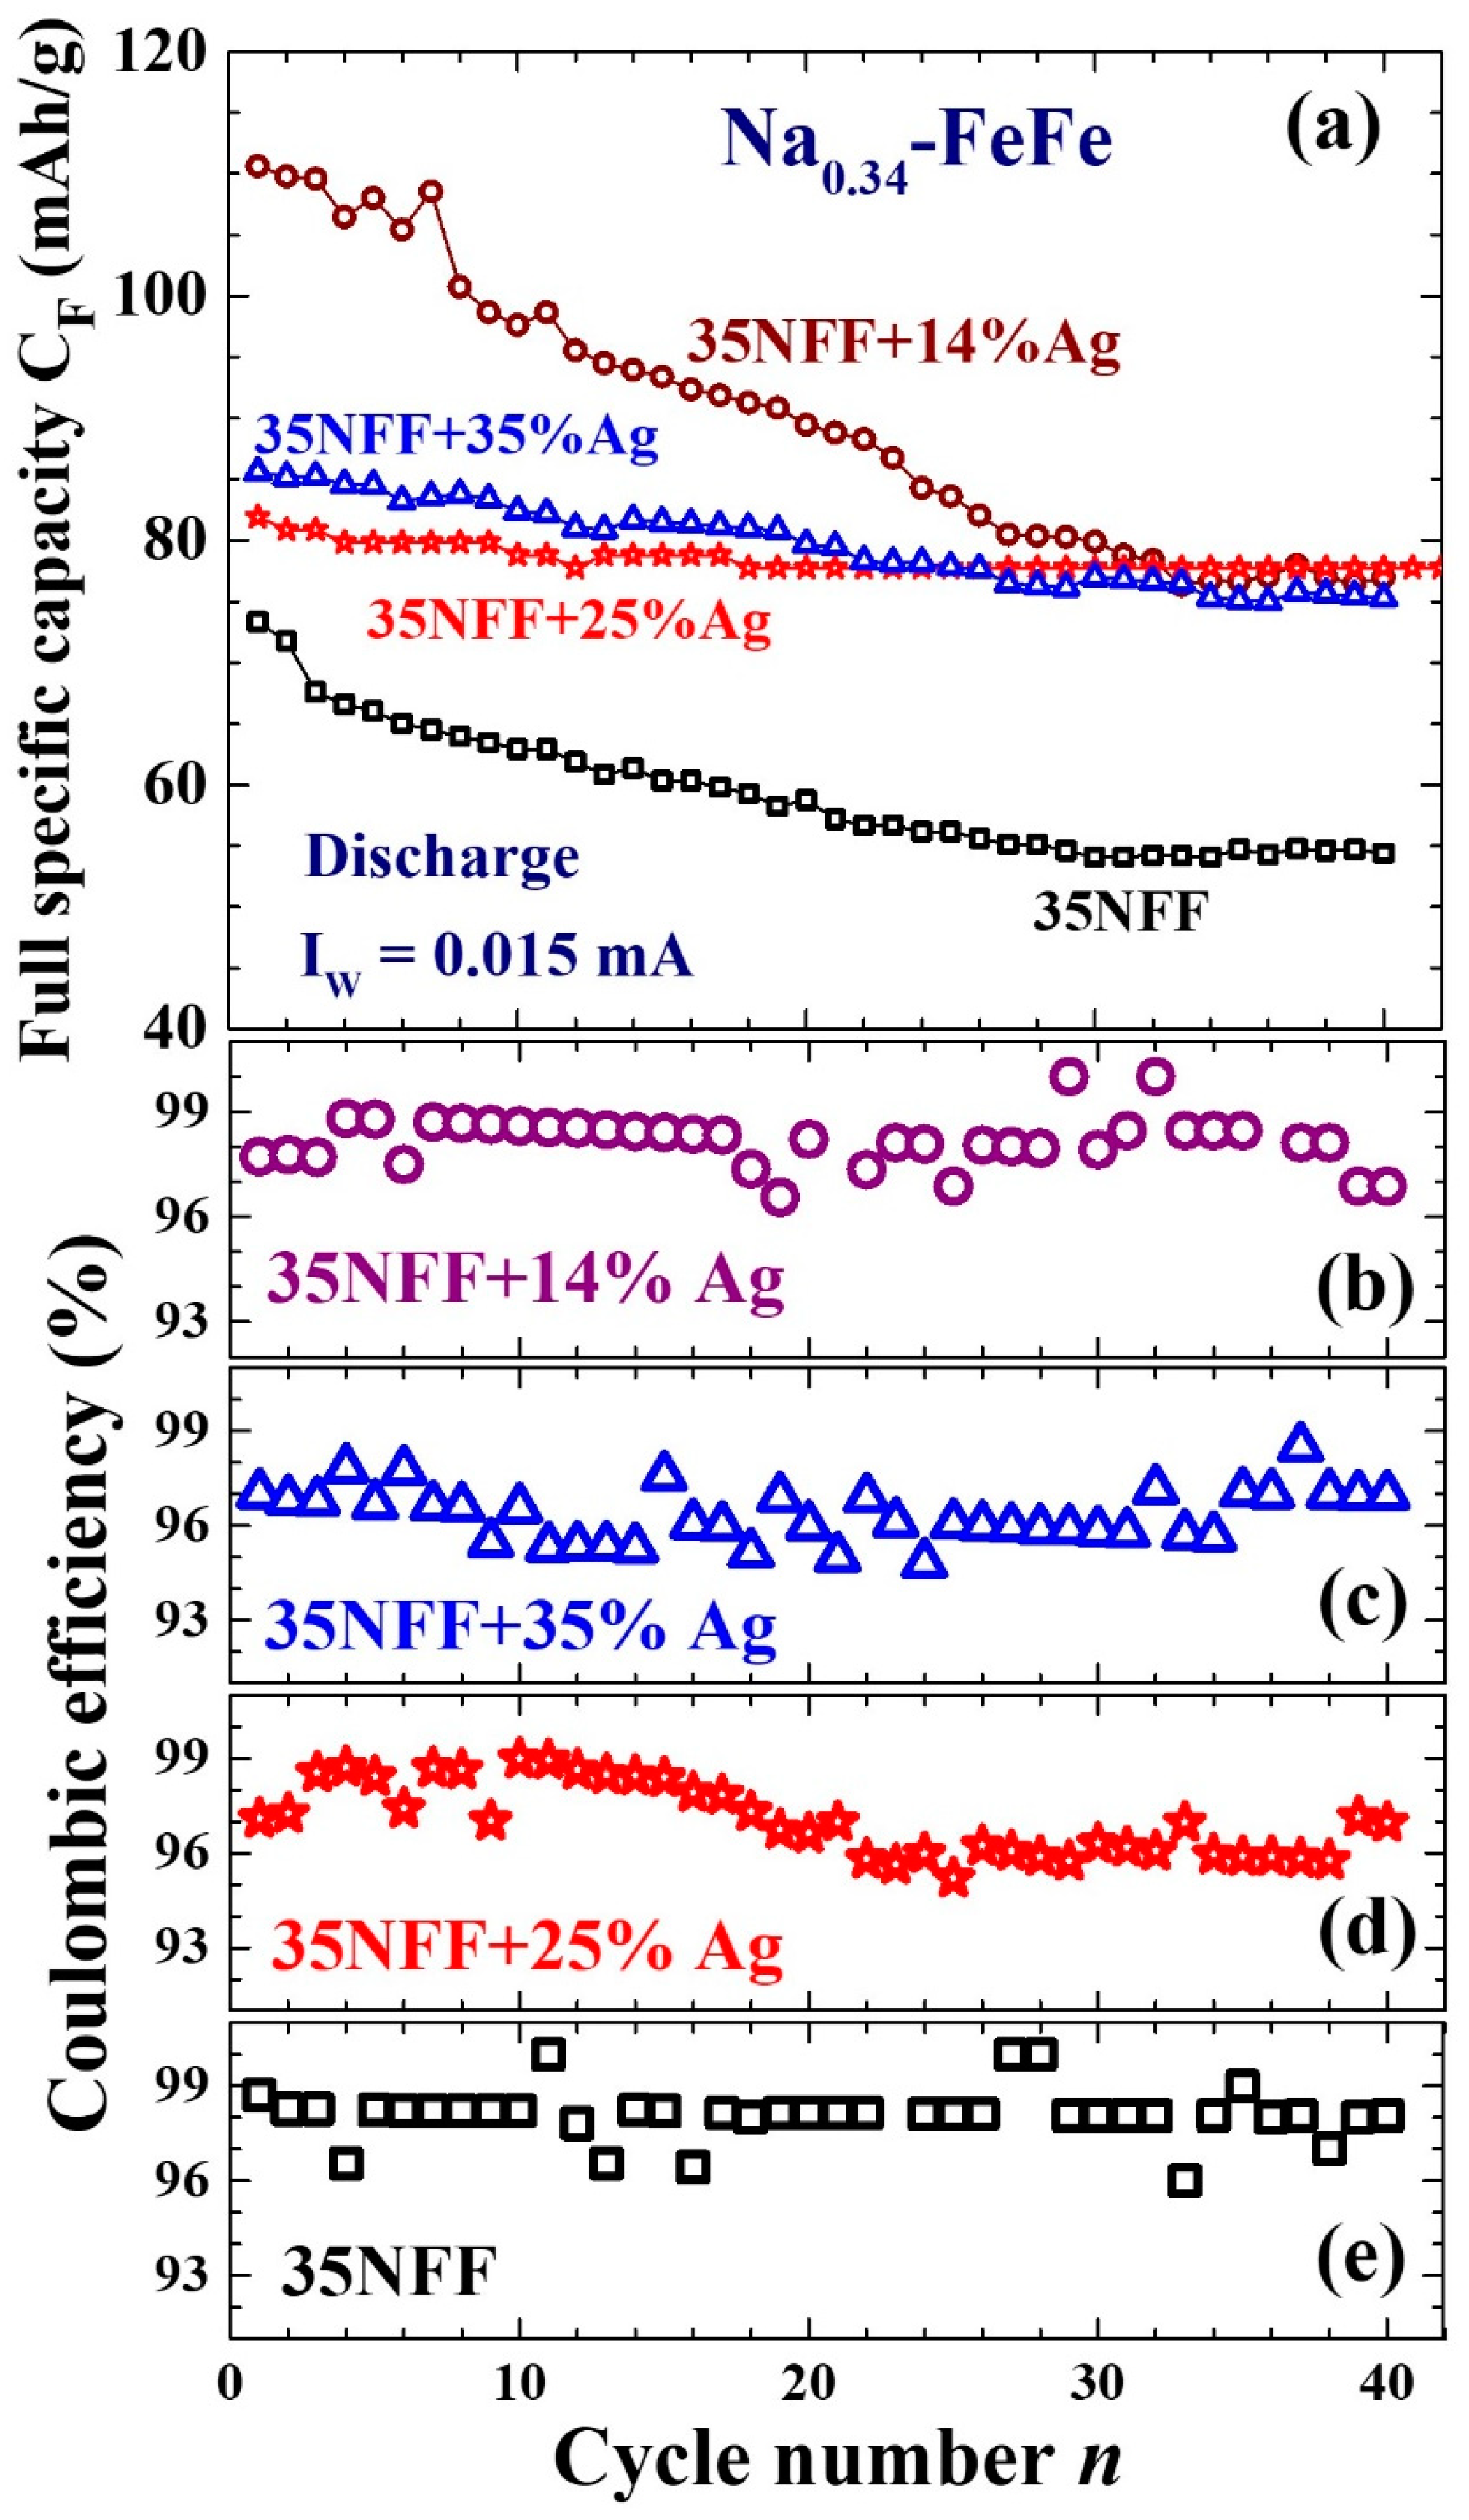
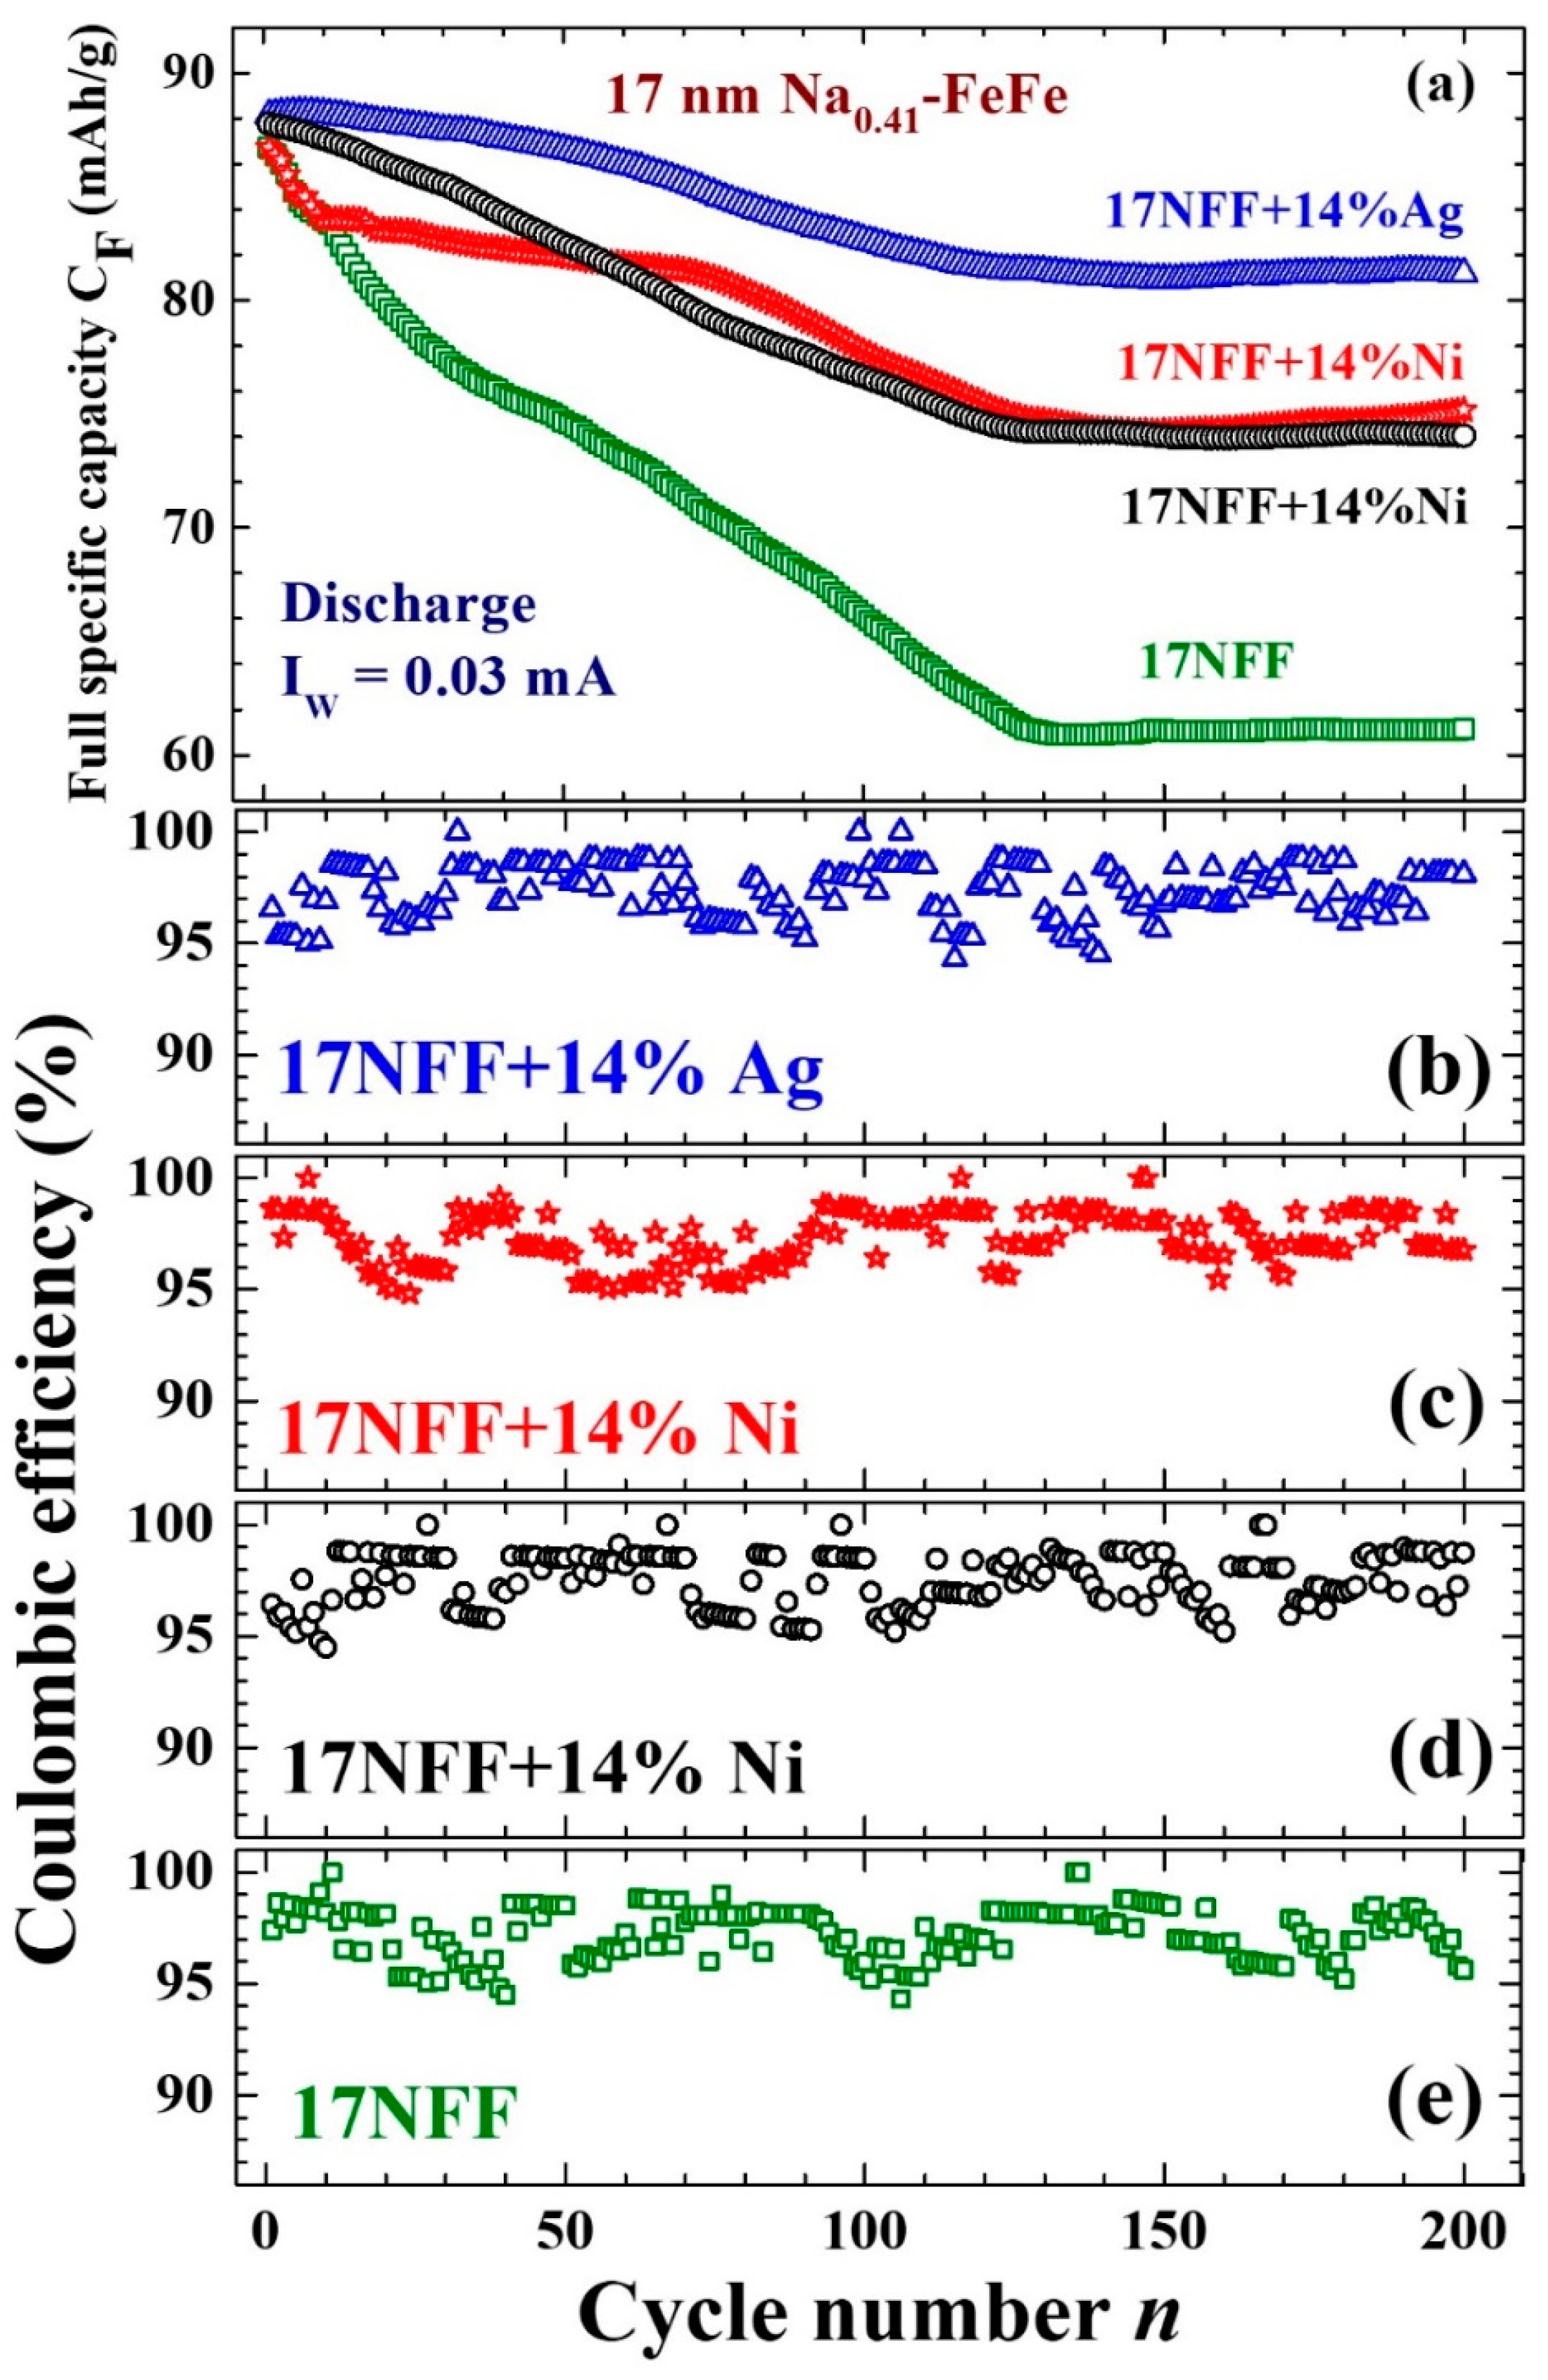
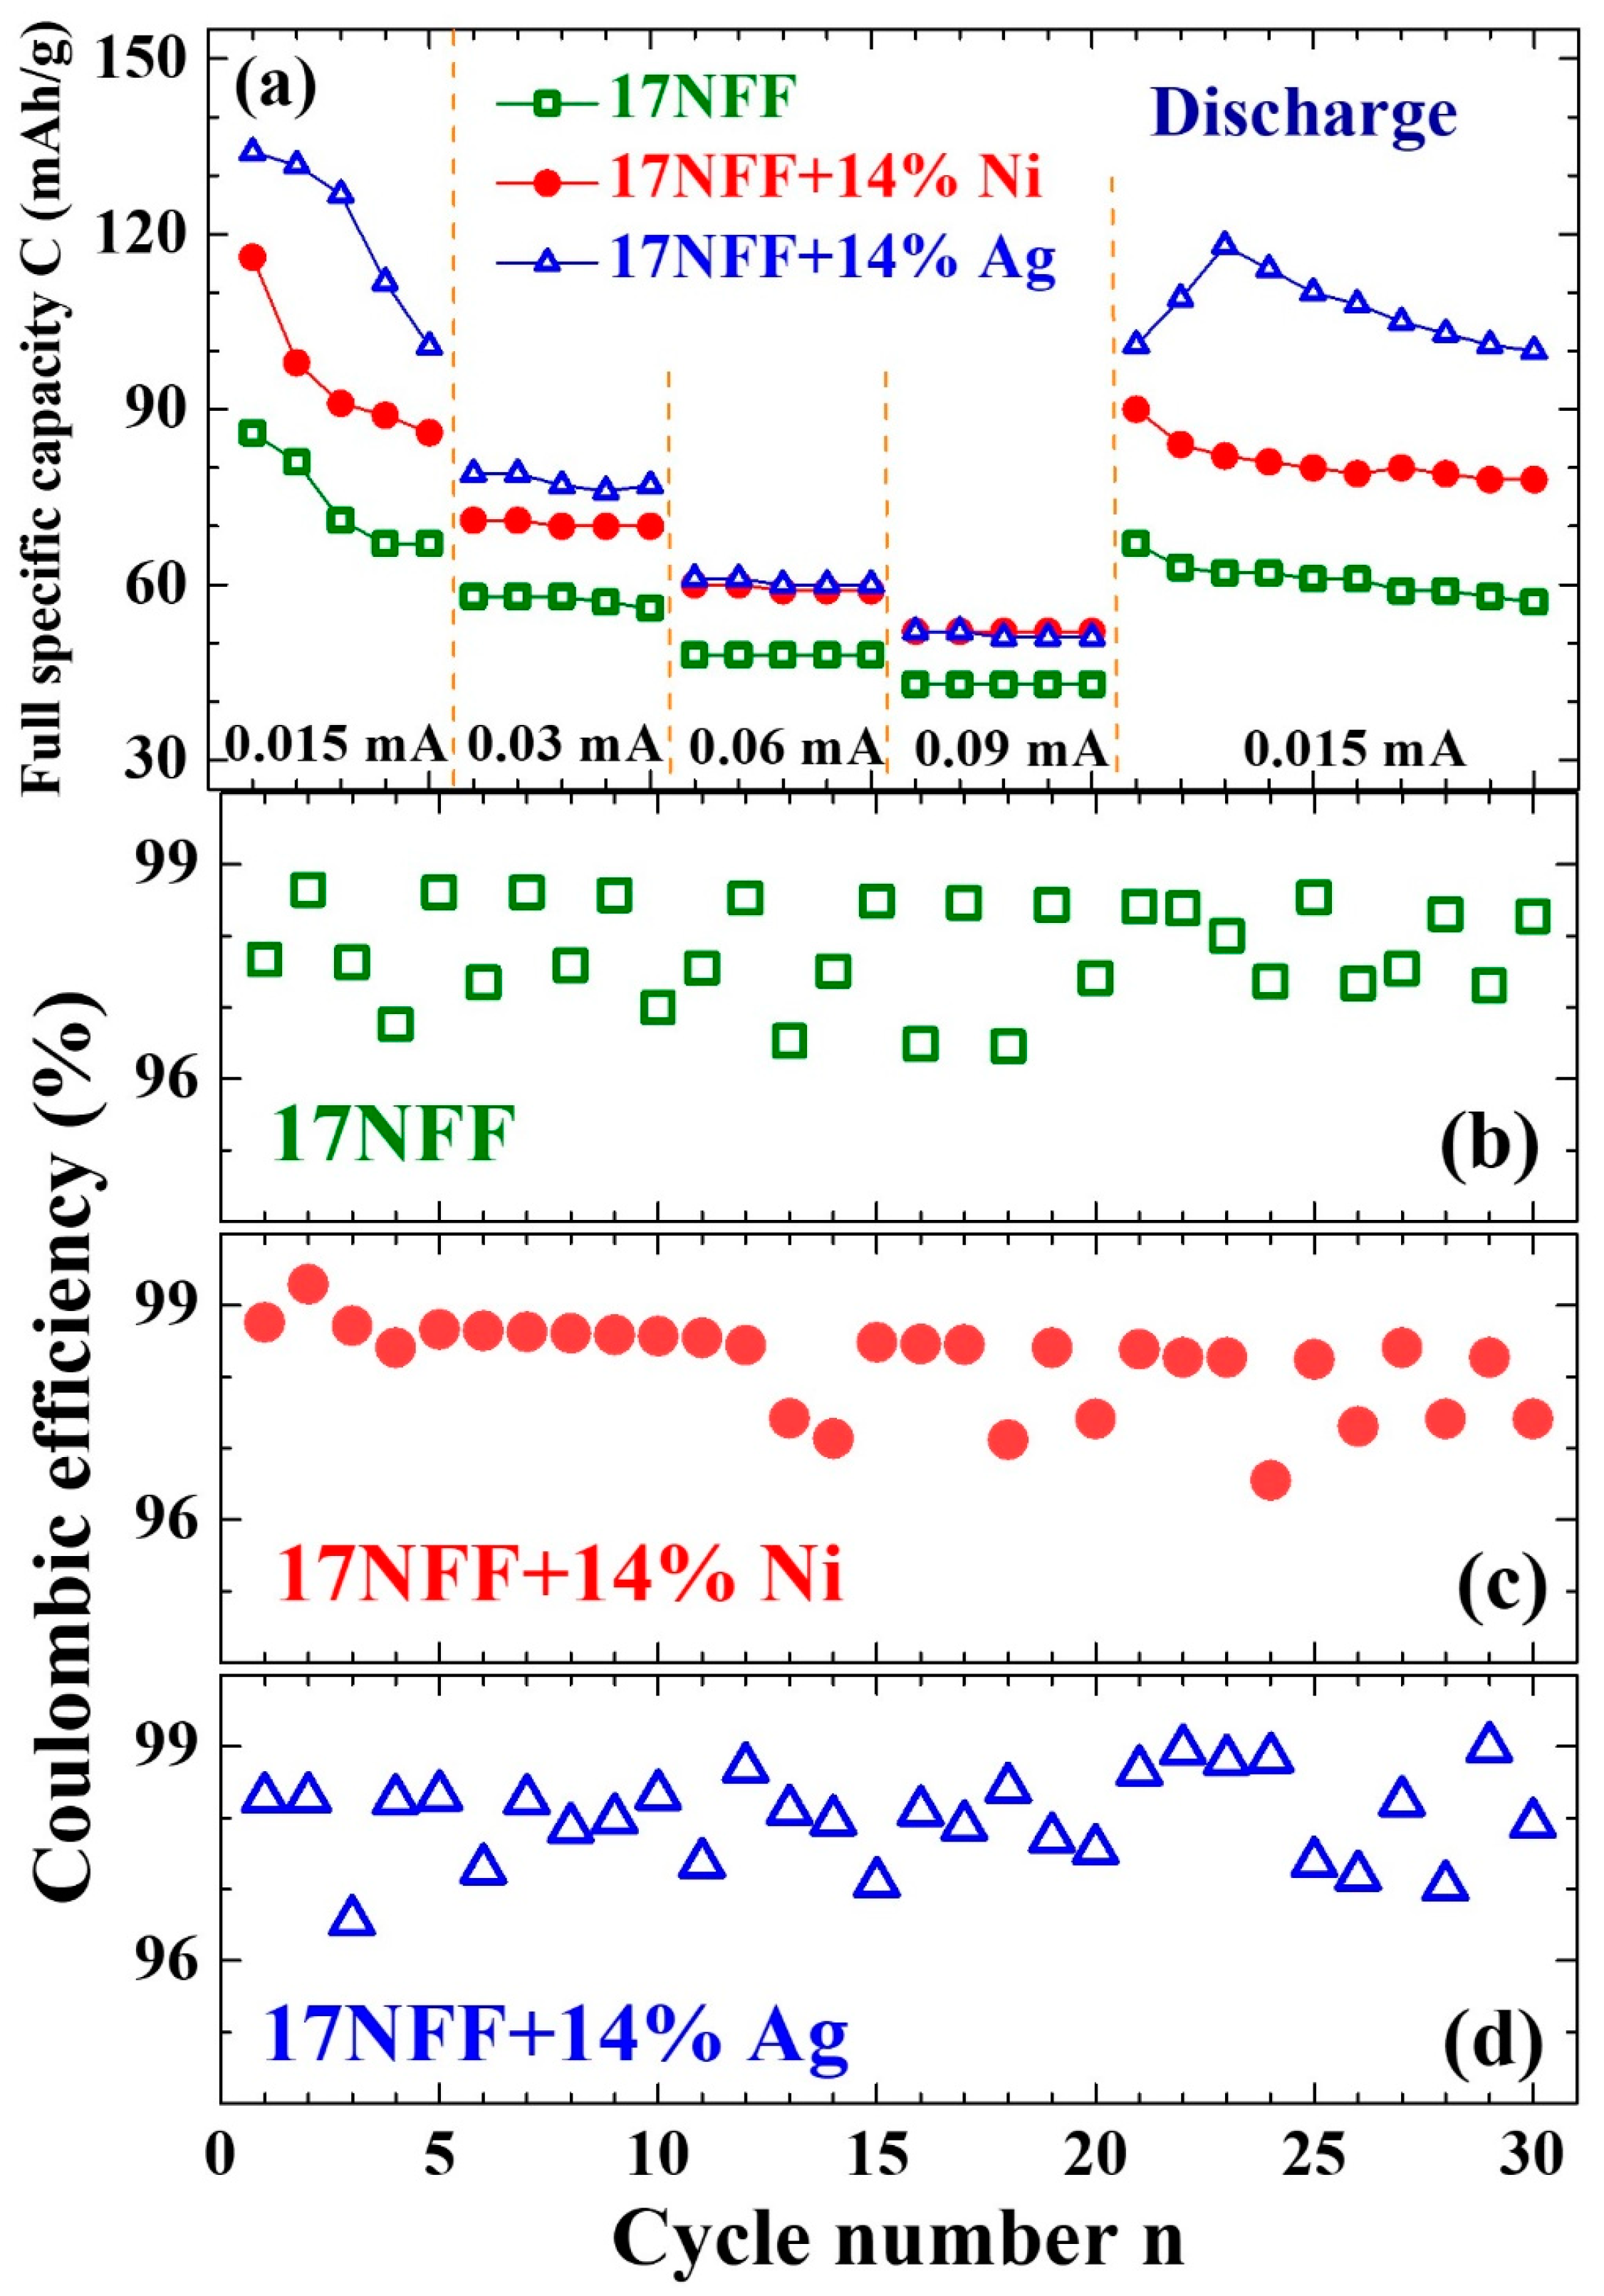
3.4. Enhanced Electrochemical Stability

The amount of Ag/Ni NPs added into the electrode is specified in the label for each battery. For example, the label 17NFF+14%Ag indicates a 17NFF battery with an addition of 14 mass percent of Ag NPs onto the working electrode. In the initial stage, represented by the second GCD cycle, the 35NFF+14%Ni battery took 10% longer to complete a GCD cycle than did its counterpart battery 35NFF (dashed lines in Figure 12a). The difference in the time taken to complete a GCD cycle increased to 15% after the completion of 200 GCD cycles (solid lines in Figure 12a). The Coulomb efficiency of nearly 100% obtained for the second GCD cycle was retained after 200 GCD cycles. It appears that the incorporation of Ni NPs onto the working electrode can enhance as well as stabilize the energy capacity stored in the battery.
The two separated peaks are clearly revealed in the dC/dV curves for the initial GCD cycles (dashed lines in Figure 12b). The one at around 3.0 V is from the redox reaction at the Fe3+-N sites, whereas the one at around 3.8 V is from reaction at the Fe2+-C sites. The lower redox efficiency for the Fe2+-C sites reflects a reduction in the redox activity because of the partial occupation of the sites by H2O. The main difference between the dC/dV curves of the 35NFF and 35NFF+14%Ni batteries in the initial stage (dashed lines in Figure 12b), which appears in the high-voltage regime, shows that the incorporation of Ni NPs facilitates the redox reactions more on the Fe2+-C sites than on the Fe3+-N sites. As expected, there is a reduction in the redox efficiency at both the Fe2+-C and Fe3+-N sites after 200 GCD cycles, but at a noticeably smaller rate for the 35NFF+14%Ni battery than for the 35NFF battery. The incorporation of Ni NPs in the vicinity of Na0.24-FeFe NPs enhances the GCD cycle stability. This behavior may be understood as arising from the participation of loosely bounded surface electrons of the Ni NPs in the redox reactions with Li+ ions during GCD cycles.
In the initial stage, the full specific capacity CF of the 35NFF+14%Ni battery reached 95 mAh/g, which is 10% higher than the 86 mAh/g of the 35NFF battery (open circles in Figure 13a). The CF of both batteries stabilized after 200 GCD cycles. The CF of the 35NFF+14%Ni battery reduced to 67 mAh/g, but this was still 15% higher than the 58 mAh/g of the 35NFF battery. The profiles of the decay of the CF with respect to the number n of GCD cycles completed of the 35NFF+14%Ni and 35NFF batteries are similar, with Coulombic efficiencies for all of the cycles studied in the two batteries reaching ~98% (Figure 13b,c). An enhancement in the capacity is also seen in the batteries with Ag NPs incorporated in the working electrodes. The amount of Ag NPs added to the working electrodes significantly affects the enhancement factor and the decay profile of the CF(n) (Figure 14a). The incorporation of 14% Ag NPs enhances the CF by 30%, with the initial CF reaching 110 mAh/g and stabilizing at 78 mAh/g after 30 GCD cycles (open circles and squares in Figure 14a). On the other hand, the CF(n) remains stable for batteries incorporating 25% or 35% Ag NPs onto the working electrode, with the CF remaining around 78 mAh/g (open stars and triangles in Figure 14a). The CF of the three 35NFF+14%Ag, 35NFF+25%Ag and 35NFF+35%Ag batteries stabilized to 78 mAh/g, 44% higher than the 55 mAh/g of the 35NFF battery. Coulombic efficiencies for all of the cycles studied in the four batteries reached between 95 and 98% (Figure 14b–e).
The decay rate of the CF(n) is largely reduced when Ag or Ni NPs are added into the working electrodes of the 17 nm Na0.41-FeFe batteries. The CF(n) of the 17NFF battery decayed by 30% (from 88 to 62 mAh/g) before stabilizing after 130 GCD cycles (open squares in Figure 15a). The addition of 14% Ni NPs reduced the decay in the CF(n) to 16% (from 88 to 74 mAh/g) (open triangles and stars in Figure 15a), whereas the addition of 14% Ag NPs reduced the decay in the CF(n) to 7% (from 88 to 82 mAh/g) (open circles in Figure 15a). Coulombic efficiencies for all of the cycles studied in the four batteries reached between 95 and 98% (Figure 15b–e). The higher efficiency in stabilization of the CF for the 7.6 nm Ag NPs compared to the 12.4 nm Ni NPs arises from there being more surface electrons available for redox reactions of Li+ ions in the Ag NPs than in the Ni NPs.
A lower working current giving rise to a higher energy storage rate is also seen in the 17 nm Na0.41-FeFe batteries with and without the addition of Ag/Ni NPs onto the working electrodes. A higher CF for the 17NFF+14%Ag compared to the 17NFF+14%Ni and the 17NFF is revealed regardless of the IW employed (Figure 16a). The CF of the 17NFF+14%Ag battery stabilized from 88 to 81 mAh/g after 130 GCD cycles when IW = 0.03 mA was employed from the initial cycle (open circles in Figure 16a). On the other hand, it was reduced from 135 to 101 mAh/g after five GCD cycles with IW = 0.015 mA, but then dropped directly to 79 mAh/g once the IW was raised to 0.03 mA in the sixth GCD cycle, and then further dropped to 61 and 52 mAh/g at IW = 0.06 and 0.09 mA, respectively (open triangles in Figure 16a). The CF jumped back to 101 mAh/g once the IW was again reduced to 0.015 mA. This behavior of a lower IW which gives rise to a higher CF with a larger decay in the CF was also observed in the 17NFF+14%Ni and 17NFF batteries (filled circles and open squares in Figure 16a). Coulombic efficiencies for all of the cycles in the three batteries reached 98% (Figure 16b–d).

4. Conclusions

Prussian Blue with a general chemical formula of NaxFe[Fe′(CN)6]1−y[(H2O)6]y·z(H2O) is demonstrated to be an active cathode material for electrochemical energy storage. Four sets of Prussian Blue NPs, with mean particle diameters of 11, 17, 35 and 46 nm, were fabricated through co-precipitation of Na4Fe(CN)6 and FeCl3 in deionized water each at a selective temperature. Among these, the 17 nm Na-FeFe NPs had the highest efficiency in terms of electrochemical energy storage when used as the working electrode of a rechargeable battery. There are two redox active Fe2+-C and Fe3+-N sites in Na-FeFe. The unavoidable replacement of Fe(CN)6 by (H2O)6 during the co-precipitation in deionized water limits the redox activity of Na-FeFe when used as a working electrode. We demonstrate that the introduction of bare Ag or Ni NPs in the vicinity of the working Na-FeFe NPs can effectively stabilize the GCD cycles. In particular, the addition of 14 mass percent of 7.6 nm Ag NPs to the vicinity of the 17 nm Na-FeFe NPs could enhance the storage capacity by as much as 32%, and the addition of 14 mass percent of 12.4 nm Ni NPs led to an enhancement in storage capacity of 24%. The storage capacity of Na-FeFe NPs was enhanced by the participation in redox reactions of the weakly bonded surface electrons of the Ag/Ni NPs. It is hence essential to use capping free metallic NPs for effective enhancement. Enhancement in storage capacity through the addition of Ag or Ni NPs has also been observed in K-CoCo-based and Na-CoFe-based cathodes [36]. Comparisons of the electrochemical data obtained in Ref. [36] and this work are listed in Table 2.

Author Contributions

W.-H.L., S.-J.W. and E.B. designed the study; E.B., M.-H.M. and S.-J.W. synthesized the sample; E.B., M.-H.M., S.-J.W. and C.-C.Y. performed the measurements; E.B., M.-H.M., S.-J.W., C.-C.Y. and W.-H.L. analyzed all of the data; all of the authors discussed the results; W.-H.L. wrote the manuscript with discussion and input from all of the authors. All authors have read and agreed to the published version of the manuscript.

Funding

This work was supported by the National Science and Technology Council of Taiwan under grant no. NSTC 112-2112-M-008-043.

Data Availability Statement

All relevant data that support the findings of this study are available from the corresponding authors upon request.

Conflicts of Interest

The authors declare no conflicts of interest.

References

  1. Etacheri, V.; Marom, R.; Elazari, R.; Salitra, G.; Aurbach, D. Challenges in the development of advanced Li-ion batteries: A review. Energy Environ. Sci. 2011, 4, 3243–3262. [Google Scholar] [CrossRef]
  2. Goodenough, J.B.; Park, K.S. The Li-ion rechargeable battery: A perspective. J. Am. Chem. Soc. 2013, 135, 1167–1176. [Google Scholar] [CrossRef] [PubMed]
  3. Choi, J.W.; Aurbach, D. Promise and reality of post-lithium-ion batteries with high energy densities. Nat. Rev. Mater. 2016, 1, 16013. [Google Scholar] [CrossRef]
  4. Kim, T.; Song, W.; Son, D.Y.; Ono, L.K.; Qi, Y. Lithium-ion batteries: Outlook on present, future, and hybridized technologies. J. Mater. Chem. A 2019, 7, 2942–2964. [Google Scholar] [CrossRef]
  5. Liu, C.; Neale, Z.G.; Cao, G. Understanding electrochemical potentials of cathode materials in rechargeable batteries. Mater. Today 2016, 19, 109–123. [Google Scholar] [CrossRef]
  6. Dong, C.; Gao, W.; Jin, B.; Jiang, Q. Advances in cathode materials for high-performance lithium-sulfur batteries. iScience 2018, 6, 151–198. [Google Scholar] [CrossRef] [PubMed]
  7. Liu, Z.; Yuan, X.; Zhang, S.; Wang, J.; Huang, Q.; Yu, N.; Zhu, Y.; Fu, L.; Wang, F.; Chen, Y.; et al. Three-dimensional ordered porous electrode materials for electrochemical energy storage. NPG Asia Mater. 2019, 11, 12. [Google Scholar] [CrossRef]
  8. Khan, S.A.; Ali, S.; Saeed, K.; Usman, M.; Khan, I. Advanced cathode materials and efficient electrolytes for rechargeable batteries: Practical challenges and future perspectives. J. Mater. Chem. A 2019, 7, 10159–10173. [Google Scholar] [CrossRef]
  9. Buser, H.J.; Schwarzenbach, D.; Petter, W.; Ludi, A.J.I.C. The crystal structure of Prussian blue: Fe4[Fe(CN)6]3·xH2O. Inorg. Chem. 1977, 16, 2704–2710. [Google Scholar] [CrossRef]
  10. Verdaguer, M.; Girolami, G.S. Magnetic Prussian Blue Analogs. In Magnetism: Molecules to Materials V; John Wiley & Sons, Inc.: Hoboken, NJ, USA, 2004; pp. 283–346. [Google Scholar]
  11. Okubo, M.; Asakura, D.; Mizuno, Y.; Kim, J.D.; Mizokawa, T.; Kudo, T.; Honma, I. Switching redox-active sites by valence tautomerism in Prussian blue analogues AxMny[Fe(CN)6nH2O (A: K, Rb): Robust frameworks for reversible Li storage. J. Phys. Chem. Lett. 2010, 1, 2063–2071. [Google Scholar] [CrossRef]
  12. Lu, Y.; Wang, L.; Cheng, J.; Goodenough, J.B. Prussian blue: A new framework of electrode materials for sodium batteries. Chem. Commun. 2012, 48, 6544. [Google Scholar] [CrossRef] [PubMed]
  13. Pasta, M.; Wessells, C.D.; Huggins, R.A.; Cui, Y. A high-rate and long cycle life aqueous electrolyte battery for grid-scale energy storage. Nat. Commun. 2012, 3, 1149. [Google Scholar] [CrossRef]
  14. Wang, B.; Han, Y.; Wang, X.; Bahlawane, N.; Pan, H.; Yan, M.; Jiang, Y. Prussian blue analogs for rechargeable batteries. iScience 2018, 3, 110–133. [Google Scholar] [CrossRef]
  15. Hurlbutt, K.; Wheeler, S.; Capone, I.; Pasta, M. Prussian blue analogs as battery materials. Joule 2018, 2, 1950–1960. [Google Scholar] [CrossRef]
  16. Imanishi, N.; Morikawa, T.; Kondo, J.; Yamane, R.; Takeda, Y.; Yamamoto, O.; Sakaebe, H.; Tabuchi, M. Lithium intercalation behavior of iron cyanometallates. J. Power Sources 1999, 81, 530–534. [Google Scholar] [CrossRef]
  17. Jayalakshmi, M.; Scholz, F. Performance characteristics of zinc hexacyanoferrate/Prussian blue and copper hexacyanoferrate/Prussian blue solid state secondary cells. J. Power Sources 2000, 91, 217–233. [Google Scholar] [CrossRef]
  18. Eftekhari, A. Potassium secondary cell based on Prussian blue cathode. J. Power Sources 2004, 126, 221–228. [Google Scholar] [CrossRef]
  19. Okubo, M.; Asakura, D.; Mizuno, Y.; Kudo, T.; Zhou, H.; Okazawa, A.; Kojima, N.; Ikedo, K.; Mizokawa, T.; Honma, I. Ion-Induced Transformation of Magnetism in a Bimetallic CuFe Prussian Blue Analogue. Angew. Chem. 2011, 123, 6393–6397. [Google Scholar] [CrossRef]
  20. Wang, R.Y.; Wessells, C.D.; Huggins, R.A.; Cui, Y. Highly reversible open framework nanoscale electrodes for divalent ion batteries. Nano Lett. 2013, 13, 5748–5752. [Google Scholar] [CrossRef]
  21. Wang, L.; Lu, Y.; Liu, J.; Xu, M.; Cheng, J.; Zhang, D.; Goodenough, J.B. A superior low-cost cathode for a Na-ion battery. Angew. Chem. 2013, 52, 2018–2021. [Google Scholar] [CrossRef]
  22. Pasta, M.; Wessells, C.D.; Liu, N.; Nelson, J.; McDowell, M.T.; Huggins, R.A.; Toney, M.F.; Cui, Y. Full open-framework batteries for stationary energy storage. Nat. Commun. 2014, 5, 3007. [Google Scholar] [CrossRef] [PubMed]
  23. Mullaliu, A.; Asenbauer, J.; Aquilanti, G.; Passerini, S.; Giorgetti, M. Highlighting the Reversible Manganese Electroactivity in Na-Rich Manganese Hexacyanoferrate Material for Li-and Na-Ion Storage. Small Methods 2020, 4, 1900529. [Google Scholar] [CrossRef]
  24. Brant, W.R.; Mogensen, R.; Colbin, S.; Ojwang, D.O.; Schmid, S.; Häggström, L.; Ericsson, T.; Jaworski, A.; Pell, A.J.; Younesi, R. Selective control of composition in Prussian white for enhanced material properties. Chem. Mater. 2019, 31, 7203–7211. [Google Scholar] [CrossRef]
  25. Asakura, D.; Li, C.H.; Mizuno, Y.; Okubo, M.; Zhou, H.; Talham, D.R. Bimetallic cyanide-bridged coordination polymers as lithium ion cathode materials: Core@shell nanoparticles with enhanced cyclability. J. Am. Chem. Soc. 2013, 135, 2793–2799. [Google Scholar] [CrossRef] [PubMed]
  26. Mizuno, Y.; Okubo, M.; Kagesawa, K.; Asakura, D.; Kudo, T.; Zhou, H.; Oh-Ishi, K.; Okazawa, A.; Kojima, N. Precise electrochemical control of ferromagnetism in a cyanide-bridged bimetallic coordination polymer. Inorg. Chem. 2012, 51, 10311–10316. [Google Scholar] [CrossRef] [PubMed]
  27. Li, C.H.; Nanba, Y.; Asakura, D.; Okubo, M.; Talham, D.R. Li-ion and Na-ion insertion into size-controlled nickel hexacyanoferrate nanoparticles. RSC Adv. 2014, 4, 24955–24961. [Google Scholar] [CrossRef]
  28. Moo Lee, K.; Tanaka, H.; Ho Kim, K.; Kawamura, M.; Abe, Y.; Kawamoto, T. Improvement of redox reactions by miniaturizing nanoparticles of zinc Prussian blue analog. Appl. Phys. Lett. 2013, 102, 141901. [Google Scholar] [CrossRef]
  29. Fiore, M.; Wheeler, S.; Hurlbutt, K.; Capone, I.; Fawdon, J.; Ruffo, R.; Pasta, M. Paving the way toward highly efficient, high-energy potassium-ion batteries with ionic liquid electrolytes. Chem. Mater. 2020, 32, 7653–7661. [Google Scholar] [CrossRef]
  30. Li, C.H.; Peprah, M.K.; Asakura, D.; Meisel, M.W.; Okubo, M.; Talham, D.R. Stepwise Reduction of Electrochemically Lithiated Core–Shell Heterostructures Based on the Prussian Blue Analogue Coordination Polymers K0.1Cu[Fe(CN)6]0.7·3.5H2O and K0.1Ni[Fe(CN)6]0.7·4.4H2O. Chem. Mater. 2015, 27, 1524–1530. [Google Scholar] [CrossRef]
  31. Fu, H.; Liu, C.; Zhang, C.; Ma, W.; Wang, K.; Li, Z.; Lu, X.; Cao, G. Enhanced storage of sodium ions in Prussian blue cathode material through nickel doping. J. Mater. Chem. A 2017, 5, 9604–9610. [Google Scholar] [CrossRef]
  32. Tang, Y.; Zhang, W.; Xue, L.; Ding, X.; Wang, T.; Liu, X.; Liu, J.; Li, X.; Huang, Y. Polypyrrole-promoted superior cyclability and rate capability of NaxFe[Fe(CN)6] cathodes for sodium-ion batteries. J. Mater. Chem. A 2016, 4, 6036–6041. [Google Scholar] [CrossRef]
  33. Zhang, Q.; Fu, L.; Luan, J.; Huang, X.; Tang, Y.; Xie, H.; Wang, H. Surface engineering induced core-shell Prussian blue@ polyaniline nanocubes as a high-rate and long-life sodium-ion battery cathode. J. Power Sources 2018, 395, 305–313. [Google Scholar] [CrossRef]
  34. Wang, X.; Wang, B.; Tang, Y.; Xu, B.B.; Liang, C.; Yan, M.; Jiang, Y. Manganese hexacyanoferrate reinforced by PEDOT coating towards high-rate and long-life sodium-ion battery cathode. J. Mater. Chem. A 2020, 8, 3222–3227. [Google Scholar] [CrossRef]
  35. Jiang, Y.; Yu, S.; Wang, B.; Li, Y.; Sun, W.; Lu, Y.; Yan, M.; Song, B.; Dou, S. Prussian blue@C composite as an ultrahigh-rate and long-life sodium-ion battery cathode. Adv. Funct. Mater. 2016, 26, 5315–5321. [Google Scholar] [CrossRef]
  36. Batsaikhan, E.; Ma, M.-H.; Yang, C.C.; Wu, C.-M.; Li, W.-H. Boosting the electrochemical performance of Prussian-Blue-analogue based Li-ion rechargeable batteries by the addition of Ag or Ni nanoparticles into the cathode. Inorg. Chem. Commun. 2023, 150, 110509. [Google Scholar] [CrossRef]
  37. Lee, C.H.; Wu, C.M.; Batsaikhan, E.; Li, H.C.; Li, C.H.; Peprah, M.K.; Talham, D.R.; Meisel, M.W.; Li, W.H. Complex Magnetic Phases in Nanosized Core@Shell Prussian Blue Analogue Cubes: Rb0.48Co[Fe(CN)6]0.75[(H2O)6]0.25·0.34H2O @K0.36Ni[Cr(CN)6]0.74[(H2O)6]0.26·0.11H2O. J. Phys. Chem. C 2015, 119, 29138–29147. [Google Scholar] [CrossRef]
  38. Larson, A.C.; Von Dreele, R.B. General Structure Analysis System, Report LAUR 86-748; Los Alamos National Laboratory: Los Alamos, NM, USA, 1994. [Google Scholar]
  39. Warren, B.E. X-ray Diffraction; Dover Publications: Dover, UK, 1990; Volume 251. [Google Scholar]
  40. Li, W.H.; Lee, C.H. Spin polarization and small size effect in bare silver nanoparticles. In Complex Magnetic Nanostructures; Springer: Cham, Switzerland, 2017; pp. 195–224. [Google Scholar]
Figure 1. The process for the fabrication of Na-FeFe nanoparticles, following the co-precipitation method. The four sets of Na-FeFe nanoparticles were synthesized separately with the reaction solution maintained at temperatures of 25, 50, 70 or 85 °C.
Solids 05 00014 g001
Figure 2. The procedure for the preparation of the working electrode containing Na-FeFe NPs, where AB represents acetylene-black, PVDF the polyvinylidene-fluoride and NMP the N-Methyl-pyrrolidone. Mass ratios of 7:1, 7:1.75 or 7:2.45 were used for the Na-FeFe/Ag/Ni NPs amounts to provide a mass ratio of 14%, 25% or 35% of Ag/Ni NPs in the electrode.
Solids 05 00014 g002
Figure 3. The observed (crosses) and calculated (red solid lines) X-ray diffraction patterns of the Na-FeFe synthesized with reaction solutions at (a) 25 °C, (b) 50 °C, (c) 70 °C and (d) 85 °C, assuming a cubic F m 3 ¯ m symmetry for the crystalline structure, giving a chemical composition of Na0.38Fe[Fe(CN)6]0.82[(H2O)6]0.18·0.34H2O for (a), Na0.41Fe[Fe(CN)6]0.84[(H2O)6]0.16·0.36H2O for (b), Na0.34Fe[Fe(CN)6]0.81[(H2O)6]0.19·0.34H2O for (c) and Na0.36Fe[Fe(CN)6]0.84[(H2O)6]0.16·0.38H2O for (d). The green solid lines below the data indicate the background intensities used in calculation. The differences between the calculated and observed patterns are plotted at the bottom. The solid vertical lines mark the calculated positions of the Bragg reflections of the proposed crystalline structure.
Solids 05 00014 g003
Figure 4. A schematic drawing of the crystalline structure of Na-FeFe, with 2/8 of the 8c sites and 1/9 of the 24e sites occupied by H2O. This structure of PB can be viewed, when there is no atomic deficiency, as consisting of Fe-N-C-Fe-C-N-Fe chains along the three crystallographic axis directions.
Solids 05 00014 g004
Figure 5. (a) C 1s, (b) N 1s, (c) Fe 2p and (d) Na 1s XPS spectra of the Na0.38-FeFe NP assembly. (e) C 1s, (f) N 1s, (g) Fe 2p and (h) Na 1s XPS spectra of the Na0.41-FeFe NP assembly. The circles indicate the intensities observed. The solid curves indicate the results of the Lorentzian profile fitting for each spectral peak. The value listed near each peak indicates the peak position for the binding energy obtained from the fits.
Solids 05 00014 g005
Figure 6. The observed (crosses) and calculated (solid lines) {200} and {220} peak profiles of the Na-FeFe synthesized with reaction solutions at (a) 25 °C, (b) 50 °C, (c) 70 °C and (d) 85 °C, assuming a log-normal size distribution, given a mean particle diameter of d = 10(1) nm with a standard deviation width of σ = 0.45(1) for (a), d = 17(2) nm with σ = 0.65(1) for (b), d = 35(1) nm with σ = 0.50(2) for (c) and d = 46(2) nm with σ = 0.55(4) for (d). The insets show the size distributions obtained from the fits.
Solids 05 00014 g006
Figure 7. Representative TEM images of the (a) Na0.38FeFe and (b) Na0.41FeFe NP assemblies, showing an average particle diameter of 9.5 nm for the Na0.38-FeFe assembly and 17.5 nm for the Na0.41-FeFe assembly. There is no noticeable asymmetry in the shape of the NPs identified in the TEM images.
Solids 05 00014 g007
Figure 8. The {111}+{200} peak profiles of the (a) Ag and (b) Ni NP assemblies obtained at room temperature. The crosses indicate the intensities observed. The solid lines indicate the calculated diffraction profiles, assuming a log-normal size distribution, as shown in the insets, revealing mean particle diameters of 7.6(3) nm for the Ag NP assembly and 12.4(3) nm for the Ni NP assembly. The insets show the size distributions obtained from the fits.
Solids 05 00014 g008
Figure 9. A comparison of charge–discharge profiles of the 17NFF (dotted dashed lines), 35NFF (black solid lines), 46NFF (dashed lines) and 10NFF (blue solid lines) batteries. The 17NFF battery takes the longest time to complete a cycle, whereas the 10NFF takes the shortest time.
Solids 05 00014 g009
Figure 10. (a) Direct comparisons between the decay profiles CF(n) of the 17NFF (open triangles), 35NFF (open circles), 46NFF (open squares) and 10NFF (open stars) batteries at IW = 0.015 mA. All four batteries have similar decay profiles CF(n). (b) Coulombic efficiency of the 17NFF battery. (c) Coulombic efficiency of the 35NFF battery. (d) Coulombic efficiency of the 46NFF battery. (e) Coulombic efficiency of the 10NFF battery.
Solids 05 00014 g010
Figure 11. (a) Variations in the full specific capacity CF in relation to the working current IW employed in the charge–discharge cycles. The CF drops from 86 to 60 mAh/g as the IW increases from 0.015 to 0.03 to 0.06 to 0.09 mA, but jumps back to 78 mAh/g once the working current is subsequently reduced to 0.015 mA. (b) Coulombic efficiency of the 35NFF-1 battery. (c) Coulombic efficiency of the 35NFF-2 battery.
Solids 05 00014 g011
Figure 12. (a) A direct comparison between the charge–discharge profiles of the 35NFF and 35NFF+14%Ni batteries in the 2nd (dashed lines) and 200th (solid lines) GCD cycles. Differences in the full specific capacity CF between the two batteries increase from 10% in the 2nd cycle to 15% in the 200th cycle. (b) Variations in differential capacity dC/dV with potential V of the 35NFF and 35NFF+14%Ni batteries in the 2nd (dashed lines) and 200th (solid lines) GCD cycles. The two separated peaks clearly reveal that both the Fe2+-C and the Fe3+-N sites do participate in redox reactions.
Solids 05 00014 g012
Figure 13. (a) A direct comparison between the decay profiles CF(n) of the 35NFF (open triangles) and 35NFF+14%Ni (open circles) batteries. (b) Coulombic efficiency of the 35NFF battery. (c) Coulombic efficiency of the 35NFF+14%Ni battery.
Solids 05 00014 g013
Figure 14. (a) A direct comparison between the decay profiles CF(n) of the 35NFF (open squares), 35NFF+14%Ag (open circles), 35NFF+25%Ag (open stars) and 35NFF+35%Ag (open triangles) batteries. (b) Coulombic efficiency of the 35NFF+14%Ag battery. (c) Coulombic efficiency of the 35NFF+35%Ag battery. (d) Coulombic efficiency of the 35NFF+25%Ag battery. (e) Coulombic efficiency of the 35NFF battery.
Solids 05 00014 g014
Figure 15. (a) A direct comparison between the decay profiles of the CF(n) of the 17NFF (open squares), 17NFF+14%Ni (open circles and stars) and 17NFF+14%Ag (open triangles) batteries. (b) Coulombic efficiency of the 17NFF+14%Ag battery. (c) Coulombic efficiency of the 17NFF+14%Ni battery. (d) Coulombic efficiency of the 17NFF+14%Ni battery. (e) Coulombic efficiency of the 17NFF battery.
Solids 05 00014 g015
Figure 16. (a) Variations in the full specific capacity CF with the number n of GCD cycles completed, revealing a sudden drop in the CF once the working current IW is increased, but a jump back to a higher CF once the IW is subsequently reduced. (b) Coulombic efficiency of the 17NFF battery. (c) Coulombic efficiency of the 17NFF+14%Ni battery. (d) Coulombic efficiency of the 17NFF+14%Ag battery.
Solids 05 00014 g016
Table 1. The labels, reaction solution temperatures, chemical compositions, lattice parameters, mean particle diameters and deviation widths of the size distributions of the four Na-FeFe compounds used in this study.
LabelT (°C)Chemical Compositiona (Å)d (nm)σ
Na0.38-FeFe25Na0.38Fe[Fe(CN)6]0.82[(H2O)6]0.18·0.34H2O10.145(1)10(1)0.45(2)
Na0.41-FeFe50Na0.41Fe[Fe(CN)6]0.84[(H2O)6]0.16·0.36H2O10.248(1)17(2)0.65(1)
Na0.34-FeFe70Na0.34Fe[Fe(CN)6]0.81[(H2O)6]0.19·0.34H2O10.196(1)35(2)0.50(2)
Na0.36-FeFe85Na0.36Fe[Fe(CN)6]0.84[(H2O)6]0.16·0.38H2O10.185(2)46(2)0.55(4)
Ag Ag4.088(1)7.6(3)0.65(8)
Ni Ni3.526(3)12.4(3)0.51(7)
T = temperature of reaction solution; a = lattice constant at room temperature; d = mean particle diameter; σ = deviation width of size distribution of nanoparticle assembly.
Table 2. Direct comparisons of the electrochemical data of the batteries reported in Ref. [36] and this work.
Chemical Compositiond
(nm)
mAg
(%)
mNi
(%)
IW
(mA)
CFi
(mAh/g)
CFs
(mAh/g)
n
Na0.38Fe[Fe(CN)6]0.82
[(H2O)6]0.18·0.34H2O
(this work)
10 0.015422850
Na0.41Fe[Fe(CN)6]0.84
[(H2O)6]0.16·0.36H2O
(this work)
17 0.038661130
14 8681130
148674120
Na0.34Fe[Fe(CN)6]0.81
[(H2O)6]0.19·0.34H2O
(this work)
35 0.015745535
14 1107830
25 827810
35 867820
0.038659200
149567210
Na0.36Fe[Fe(CN)6]0.84
[(H2O)6]0.16·0.38H2O
(this work)
46 0.015563525
K0.58Co[Co(CN)6]0.86
[(H2O)6]0.14·0.24H2O
(Ref. [36])
120 0.033004060
14 340130120
1030540125
14310125120
Na0.46Co[Fe(CN)6]0.84
[(H2O)6]0.16·0.25H2O
(Ref. [36])
80 0.031105690
10 1106095
1011070110
d = mean particle diameter; mAg = mass percentage of Ag NPs; mNi = mass percentage of Ni NPs; Iw = working current; CFi = initial full specific capacity; CFs = stabilized full specific capacity; n = number of charge–discharge cycles prior to stabilization.
Disclaimer/Publisher’s Note: The statements, opinions and data contained in all publications are solely those of the individual author(s) and contributor(s) and not of MDPI and/or the editor(s). MDPI and/or the editor(s) disclaim responsibility for any injury to people or property resulting from any ideas, methods, instructions or products referred to in the content.

