Article

Influence of Unidirectional Cyclic Loading on Bond between Steel Bars Embedded in Lightweight Aggregate Concrete

1
Department of Structural Engineering, Faculty of Civil Enineering, Budapest University of Technology and Economics, Műegyetem rkp. 3, 1111 Budapest, Hungary
2
Department of Construction Materials and Technologies, Faculty of Civil Enineering, Budapest University of Technology and Economics, Műegyetem rkp. 3, 1111 Budapest, Hungary
3
Department of Polymer Engineering, Budapest University of Technology and Economics, Műegyetem rkp. 3, 1111 Budapest, Hungary
*
Author to whom correspondence should be addressed.
Solids 2022, 3(3), 397-415; https://doi.org/10.3390/solids3030028
Submission received: 30 May 2022 / Revised: 23 June 2022 / Accepted: 27 June 2022 / Published: 5 July 2022

Abstract

:
The topic of present research is the experimental investigation of pull-out resistance of B500B-type ribbed reinforcing steel bars embedded in lightweight aggregate concrete (LWAC) under unidirectional cyclic loading. Only a limited amount of standardized data on bond strengths are available in the case of cyclic loading, especially for lightweight aggregate concrete. This paper deals with the experimental comparison of bond behavior of steel bars embedded in LWAC with expanded clay (Liapor) aggregate and normal weight aggregate concrete (NWAC) specimens by means of standard (non-cyclic) and cyclic pull-out tests. The LWAC and NWAC specimen’s mixes were identical except for the type of the coarse aggregate. It was found that the bond strength determined by non-cyclic pull-out tests showed a higher standard deviation compared to that for compression and splitting tensile strength tests. The shape of the characteristic bond strength–the slip curve was similar in the case of LWAC and NWAC and the failure mode was the same for both types of aggregate. Moreover, the maximum value of bond stress was identical for LWAC and NWAC and also no significant difference was found in the low cycle number fatigue. Both mixes were able to resist the maximum pull-out force multiple times in the case of cyclic loading because there was no time for the development of cracks.

1. Introduction

The efficiency of structural concrete can significantly be improved by either reducing the self-weight or using prestressing [1]. The simplest way to decrease the self-weight of concrete is to change the normal weight aggregate to lightweight aggregate (tuff, expanded clay, etc.). Lightweight aggregates are widely used for non-structural purposes due to their advantageous thermal properties [2,3]; however, structural applications of lightweight aggregate concrete come to the front for self-weight dominant structures, in case of which the contribution of self-weight in the total action effect exceeds 50–60%. The combination of high-strength lightweight aggregate concrete (>LWAC50/55) with prestressing is a perspective area in the field of high-capacity prefabricated (bridge) girders that may open the door for structural lightweight aggregate concretes towards their application in industrial scale. Nowadays, the most frequently used lightweight aggregate is the expanded clay produced in the form of round-shaped particles by heating the clay to 1200 °C in a rotary kiln [4].
How to use lightweight aggregate appropriately in structural concrete is one of the hottest topics in the field of concrete technology, especially when trying to avoid early age cracking [5]. However, from a structural point of view, a basic problem arises as follows: if the properties of lightweight aggregate concrete (LWAC) significantly differ from those of normal weight aggregate concrete (NWAC) then the uniformity of the bond behavior around steel embedded in LWAC and NWAC becomes questionable. The bonds ensure strain compatibility, thus, its characteristics and capacity are crucial from the point of view of the composite action between steel and concrete [6]. The bond strength of concrete is measured in a standardized way by pull-out tests, during which the embedded bar is pulled out of a concrete sample meanwhile the pull-out force and the relative displacement of the steel bar is measured [7].
Based on wide research in this field, the main influencing parameters of the bond between steel reinforcing bars and NWAC are as follows:
  • Compressive and tensile strength of concrete [8,9];
  • The position of the embedded reinforcing bar relative to the direction of the casting of concrete [8];
  • The stress state of concrete around the steel bar [10];
  • The amount of transverse reinforcement [11];
  • The loading rate [12];
  • The type and specific weight of lightweight aggregate [13];
  • The characteristics of cyclic loading (amplitude, number of loading cycles, etc.) [14];
  • Furthermore, by the intensity of steel corrosion, maximum aggregate size, material of fibers (steel or plastic), temperature etc. [6,15,16].
The effect of cyclic loading on bonds in normal strength (<C50/60) NWAC was first experimentally investigated by Sinha et al. and others [15,17,18,19]. They pointed out that plain (unreinforced) concrete behaved like a brittle, non-homogeneous material and was very sensitive to fatigue loading [20,21]. The application of fibers efficiently helped decrease the brittleness of concrete [22]. Reinforcement could also significantly decrease brittleness if a sufficient bond between the steel and the concrete developed. Lin and Zhao [23] demonstrated that bond behavior under cyclic loading could be well characterized by the progressive increase in residual slip, especially at increased load levels.
The effect of cyclic loading on bonds in steel fiber-reinforced LWAC was first studied by Caratelli et al. [24]. They concluded that the character of bond behavior under cyclic load between the fibers and LWAC was similar to that experienced earlier between steel reinforcing bars and NWAC.
This paper focuses particularly on the effect of the expanded clay (Liapor) used as 4/8 fraction coarse aggregate in LWAC on bonds between LWAC and embedded reinforcing steel rebars under cyclic load in comparison with that in the case of NWAC manufactured with usual 4/8 fraction quartz gravel (normal weight) coarse aggregate. Owing to the lower compressive strength of lightweight aggregate compared to normal weight aggregate, lightweight aggregate is expected to be the potential origin of structural degradation under cyclic load that may adversely affect the bonds between concrete and steel. To justify this phenomenon, standard NWAC and LWAC specimens were manufactured and subjected to standard (non-cyclic) and cyclic pull-out tests. Section 2.2 introduces the performed test program.

1.1. Effect of Lightweight Aggregate on Bond Strength

One topic that divides the researchers is the effect of lightweight aggregate on bond strength for concretes of identical compressive strengths. Many such as Martin or Bogas et al. [9,25] pointed out that concrete with lightweight aggregate may result in a similar or even a higher bond strength than that for concrete with normal weight aggregate; meanwhile, a significantly lower bond strength was found for LWAC than for NWAC in other research [26]. The experiments by Kovács and Nemes [1] demonstrated that bond strength in NWAC remained higher than that in LWAC, even if the compressive strengths of NWAC and LWAC were identical. In Figure 1, a comparison of compressive strengths resulted from different mixes used in [1] is seen, where Mix E refers to a high-strength NWAC while Mix L7 and L8 refer to different LWAC mixes. The applied mixes used for the NWAC and LWAC differed only in the 4/8 fraction coarse aggregate component. The lightweight aggregates used for Mix L7 and L8 differed in both strength and their site of origin. Liapor HD 7N type 4/8 expanded clay pebble fraction was used to produce (usual) structural LWAC (Mix L7, flcm,cube = 63.4 MPa, 1800 kg/m3) and Liapor 8F type 4/8 expanded clay pebble fraction was used to produce high-strength LWAC (Mix L8, flcm,cube = 86.5 MPa, 1950 kg/m3). Usual quartz gravel was used as an aggregate to the reference high-strength NWAC (Mix E, fcm,cube = 85.2 MPa, 2650 kg/m3).
Similar to Figure 1, in Figure 2 the bond strength determined by a standard pull-out test using identical ribbed reinforcing steel rebars of ∅8 mm diameter is plotted as a function of concrete age. It was well apparent from Figure 2 that the significant difference in compressive strength between the two LWACs shown in Figure 1 could not be observed in bond strength.
Referring to the excessive standard deviation in bond strength experienced for LWAC in many pieces of research, the ACI Committee [27] recommends to reduce the bond strength considered for LWAC to 65% of the bond strength belonging to NWAC of an identical compressive strength class.

1.2. Effect of Cyclic Loading on Bond Strength

Another influencing factor on bond strength is the effect of cyclic loading. This factor comes to light for bridges and offshore structures, for which the number of load cycles of low or moderate amplitude is excessive because of either the frequently changing stress level or the extended design working life (to 100 years); both may lead to potential fatigue-type failure under service load (high-cycle load), and becomes extremely important for earthquakes [28,29] when a typically low number of load cycles with extreme magnitudes occur (low-cycle load). In this study, the applied number of load cycles was determined in such a way that the standard shape of the enveloping curve of the cyclic loading’s bond stress–slip diagram would develop and the maximum point would be observable in each case.
Fatigue problems in civil engineering are generally evaluated by the Palmgren–Miner rule that linearly sums damage caused by each load level according to the following formula:
D   =   i n Si N Ri 1.0
where:
D
Sum of fatigue damage;
nSi
Number of load cycles belonging to the i-th stress (load) level;
NRi
Number of load cycles belonging to the i-th stress (load) level and resulting in failure;
Fatigue failure occurs when D becomes equal to 1 [30].
Fatigue of bonded contact between steel and concrete is a potential failure mode of reinforced concrete that can be well analyzed by pull-out tests using the standardized arrangement and applying a cyclic load instead of the standard monotonic one. The cyclic load history is typically defined by the direction (constant direction or alternating) and the magnitude (constant during limited period or continuously changing according to predefined rule) of the load [31]. The effect of these cyclic load parameters on the bonds were thoroughly studied by Rehm, Eligehausen, and Balázs [31,32,33,34].

2. Materials and Methods

This section introduces the pull-out tests performed to analyze the effect of cyclic load on bonds between LWAC and ribbed steel rebars as indicated in Section 1.

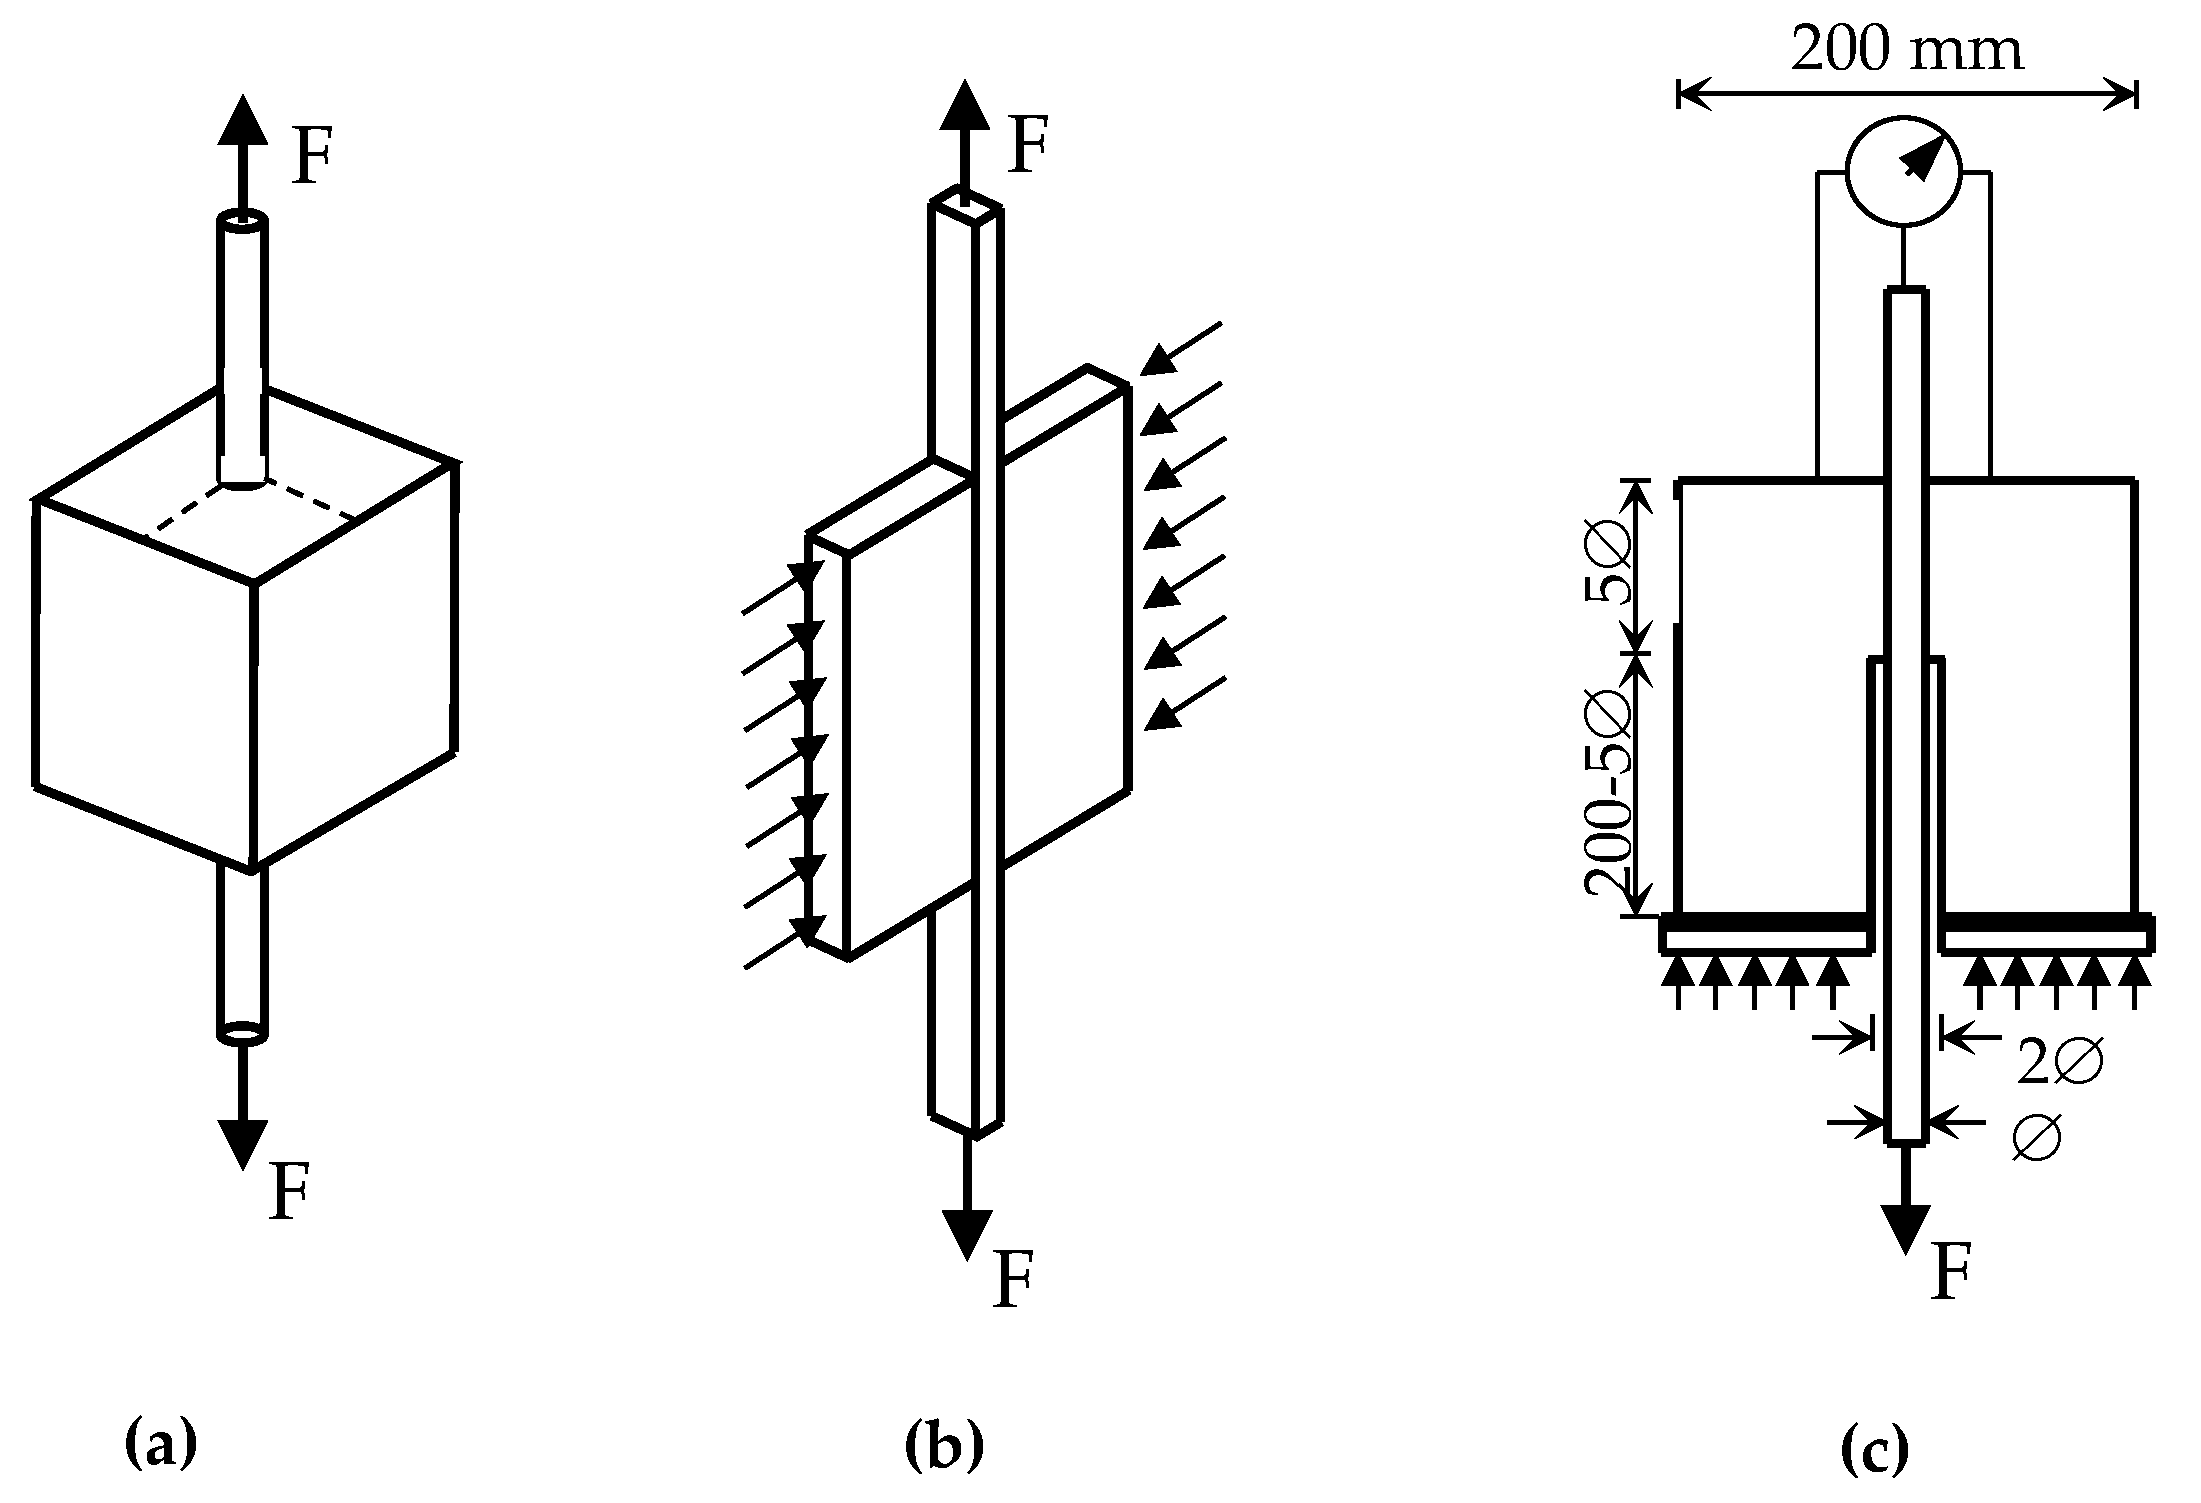
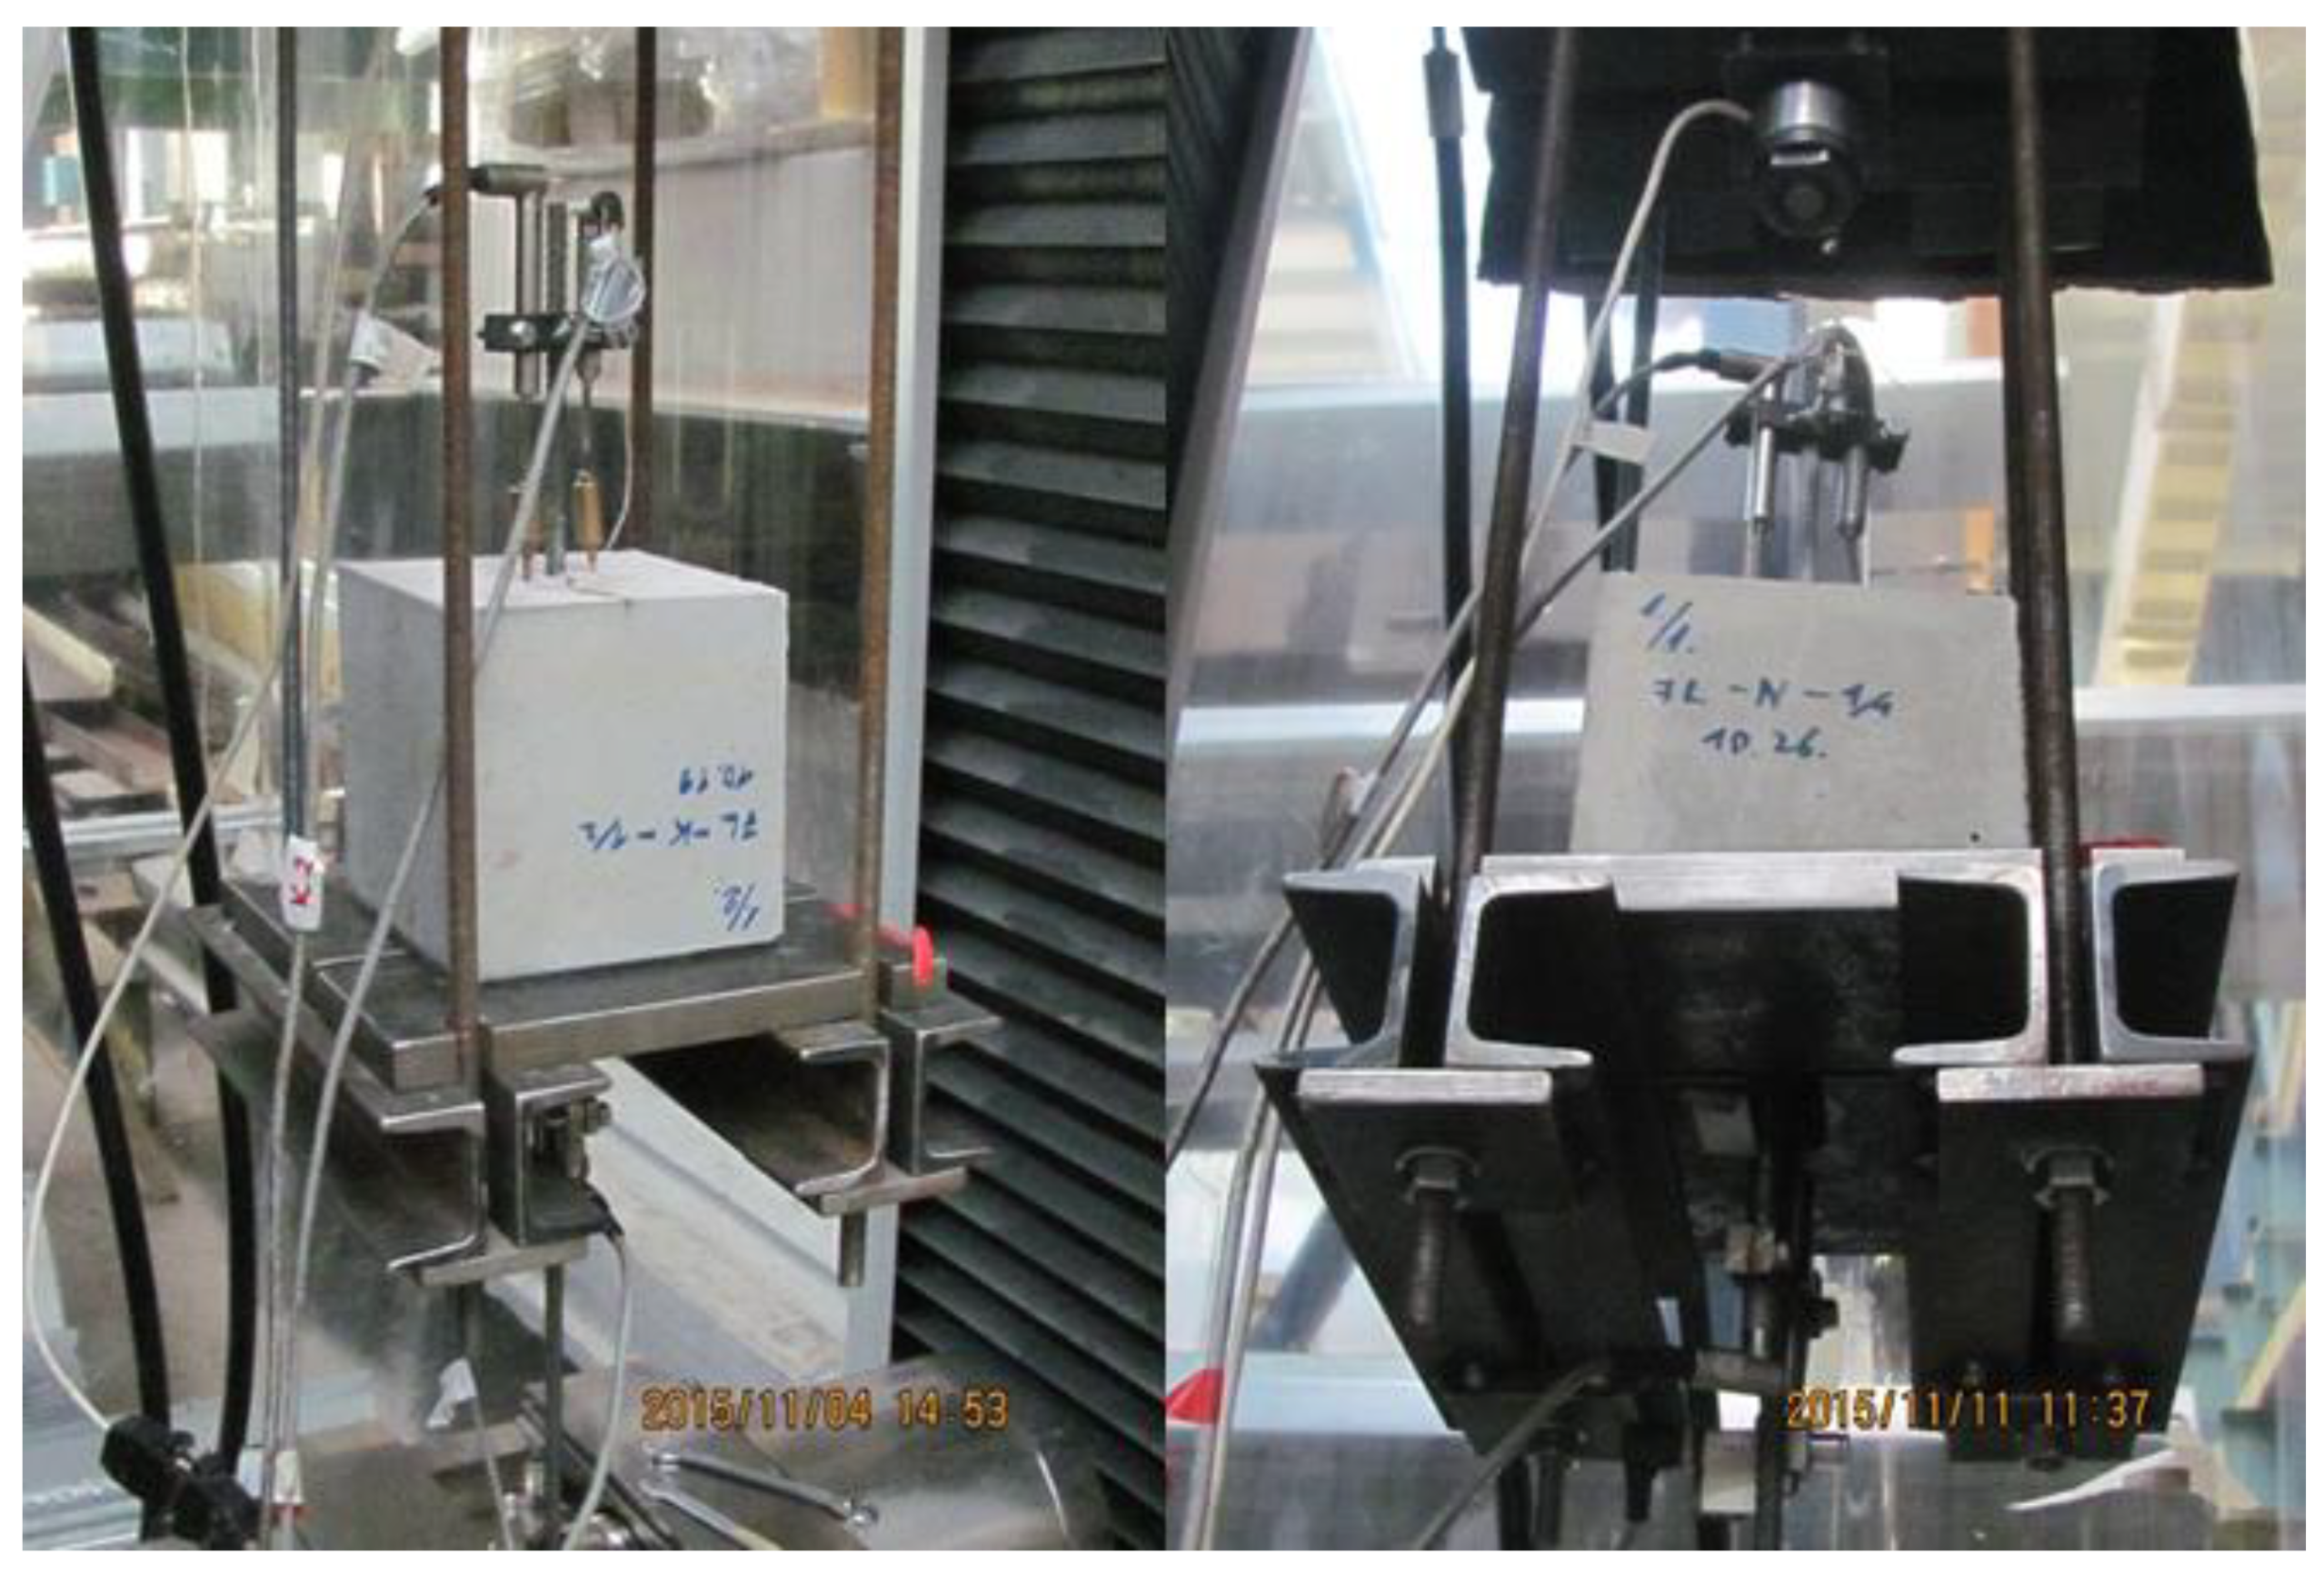
2.1. Pull-Out Test Setup

The behavior of bonded interface between concrete and embedded steel can be well tested by pull-out setups. Recent test methods according to literature and the relevant standards are based on this arrangement. During the pull-out tests, the focus is on the determination of bond stress (τb) as a function of slip (i.e., the bond stress–slip (τb-s) curve). Slip (s) is interpreted as sum of specific strain differences between the steel bar (εsx) and the concrete (εcx) along the length of the considered bonded contact (bonded length, lb) as follows:
s   = 0 l b ( ε sx     ε cx ) dx
Note that both bond stress and the above specific strains (εsx and εcx) contributing in slip are related to particular points of the bonded interface, thus considered as “local” bond parameters. Because they are necessarily varying along the length of the bonded contact over which bond forces are transmitted from steel to concrete, their measurability and assumptions related to the evaluation of test results are deciding factors when distinguishing between the applicability of different test setups.
The evolution of pull-out setups to test bond on ribbed steel rebars are seen in Figure 3. The latter concrete cube specimen shown in Figure 3c is recommended commonly by the RILEM/CEB/FIP [30,35] on the basis of wide research in this field and also included in EN 10,080 [36] for simple bond tests of ribbed reinforcing steel bars. For this arrangement, a relatively short bonded length equal to 5∅ (where ∅ is the bar diameter) is applied and, in accordance with that, a constant bond stress is assumed along it. This bonded length was determined allowing for limiting effects from two directions. For longer bonded lengths, on one hand, the difference in the above local bond parameters along the bonded length increases significantly, thus, the assumption of constant bond stress cannot be kept. On the other hand, splitting of concrete along the steel–concrete interface instead of the expected bond failure would become dominant, especially for low concrete strengths. For shorter bonded lengths, the standard deviation of test results becomes unacceptably high. The remaining part of the embedded bar section remains unbonded by placing plastic or rubber tube around this section before casting the specimen. To avoid local (conical) shear failure of concrete around the bar on the loaded surface, the bonded length is positioned toward the unloaded surface of the specimen. The size of the cube shall be limited as a minimum of 10 to prevent splitting failure of concrete due to excessive lateral tension. The bar is tensioned in one end of the bar (loaded end).
An alternative arrangement in EN 10,080 [36] for testing bonds between embedded steel and concrete is the beam test. In case of this arrangement, the two halves of a simple beam under flexure are connected by a rebar in the tension zone and by an artificial hinge in the compression zone. The advantage of this test against the above pull-out test is that bond conditions on the tested rebar are more similar to reality owing to the position of rebar close to the concrete surface and to the confining effect of the applied reinforcement in the specimen. However, its repeatability is more difficult because of the more complex arrangement compared to the pull-out test.
Considering the test setup according to Figure 3c, the bond stress (τb) assumed to be constant along the full bonded length (lb) as function of the measured tension force (F) is calculated as follows:
τ b ( s )   =   F ( s ) π     l b
The relative displacement between the unloaded end of the bar and the related concrete surface normal to it is directly measured during the test and assumed as equal to the slip (s) value according to Equation (2). Having the τb–s relationship, the bond strength (τbu) is represented as the maximum value of bond stress. The slip belonging to τbu is used to characterize the ductility of the bonded contact and depends primarily on the surface characteristics of the embedded bar. The main advantage of this test (against other bond tests) is its simplicity that is attributed mainly to the assumption of constant bond stress along the bonded length.
The applicability of the assumption of constant bond stress along the full bonded length has been investigated by other researchers. The non-uniform character of the distribution of τb along lb becomes obvious when the relative displacement between the bar and the related concrete surface is measured also on the loaded end of the bar and differs from that measured in parallel way on the unloaded end. It was found by [37] that this effect is significant only for larger diameters (∅ > 25 mm).
For this research, a test setup, similar to that shown in Figure 3c but with 150 mm size cubes and parallel relative displacement measurements on both the loaded and the unloaded side of the bar, was applied.
The cyclic load history was chosen according to Figure 4 that shows μ, the applied force relative to the maximum applicable load (that was associated with bond strength and had been determined previously by standard (non-cyclic) pull-out test) as a function of the number of load cycles. Using this load history:
  • The duration of test decreases compared to standard cyclic tests using monotonic cyclic load with μ = 0.5–0.6;
  • The increment in slip as well as in dissipated energy can be well measured and evaluated at different load levels.
This gradually increasing cyclic load, which was first introduced by Shih-Ho Chao [38], guaranteed the failure of the specimen after a limited number of cycles (low-cycle load) and consumed limited time for the test.

2.2. Test Program

When testing any parameters of LWAC specimens, NWAC specimens with identical sizes and curing process (storage of specimens in laboratory conditions) were prepared and used for comparison purposes. Before performing the bond test for both the LWAC and the NWAC specimens, standard compression and splitting tensile strength tests have been carried out according to [39,40]. Each strength and bond test has been carried out on a minimum of three specimens as shown in Table 1.
In order to test the effect of lightweight aggregate on bond, identical mixes in terms of the type and amount of cement, water, and fine aggregate (0/4 fraction—Quartz sand) except for the type of coarse aggregate (4/16 fraction in case of NWAC, 4/8 fraction in case of LWAC) were used to produce the LWAC and the NWAC specimens (see Section 2.3). Normal quartz gravel for NWAC and expanded clay (Liapor HD 5n) for LWAC was selected as coarse aggregate. A usual ∅ = 8 mm diameter, B500B-type reinforcing steel bar of ribbed surface was concentrically embedded in all bond test cube specimens of 150 × 150 × 150 mm size. Based on the above recommendations, the applied bond length was selected to 5 times the bar diameter (lb = 5∅ = 40 mm).
The pull-out test was performed by a Zwick/Roell Z400 testing machine using a loading rate of 0.005 mm/s. The relative displacements at both the loaded and the unloaded end of the bar were measured by a pair of inductive transducers with a measurement range of 20 mm fixed symmetrically to the bar (as shown in Figure 5 and Figure 6). To eliminate the effect due to incidental rotation of the bar relative to the concrete surface from the displacement measurements during loading, the two relative displacement values measured by the two transducers of one pair were averaged and considered as either loaded-end or unloaded-end slip. Using this arrangement of inductive transducers at the loaded end, the measured slip also included the elastic bar elongation developed along the bar section between the end of the bonded length and the fixation point of the transducers. This elongation has been subtracted from the measured slip.

2.3. Concrete Mixes

Both mixes contained 360 kg/m3 CEM II/A–S 42.5 R-type cement. The water-to-cement (v/c) ratio was chosen to be 0.5. The volume ratio of coarse aggregate to the total amount of aggregate was designed to 45% for both the NWAC and the LWAC mix. The final compositions are found in Table 2.

3. Results and Discussion

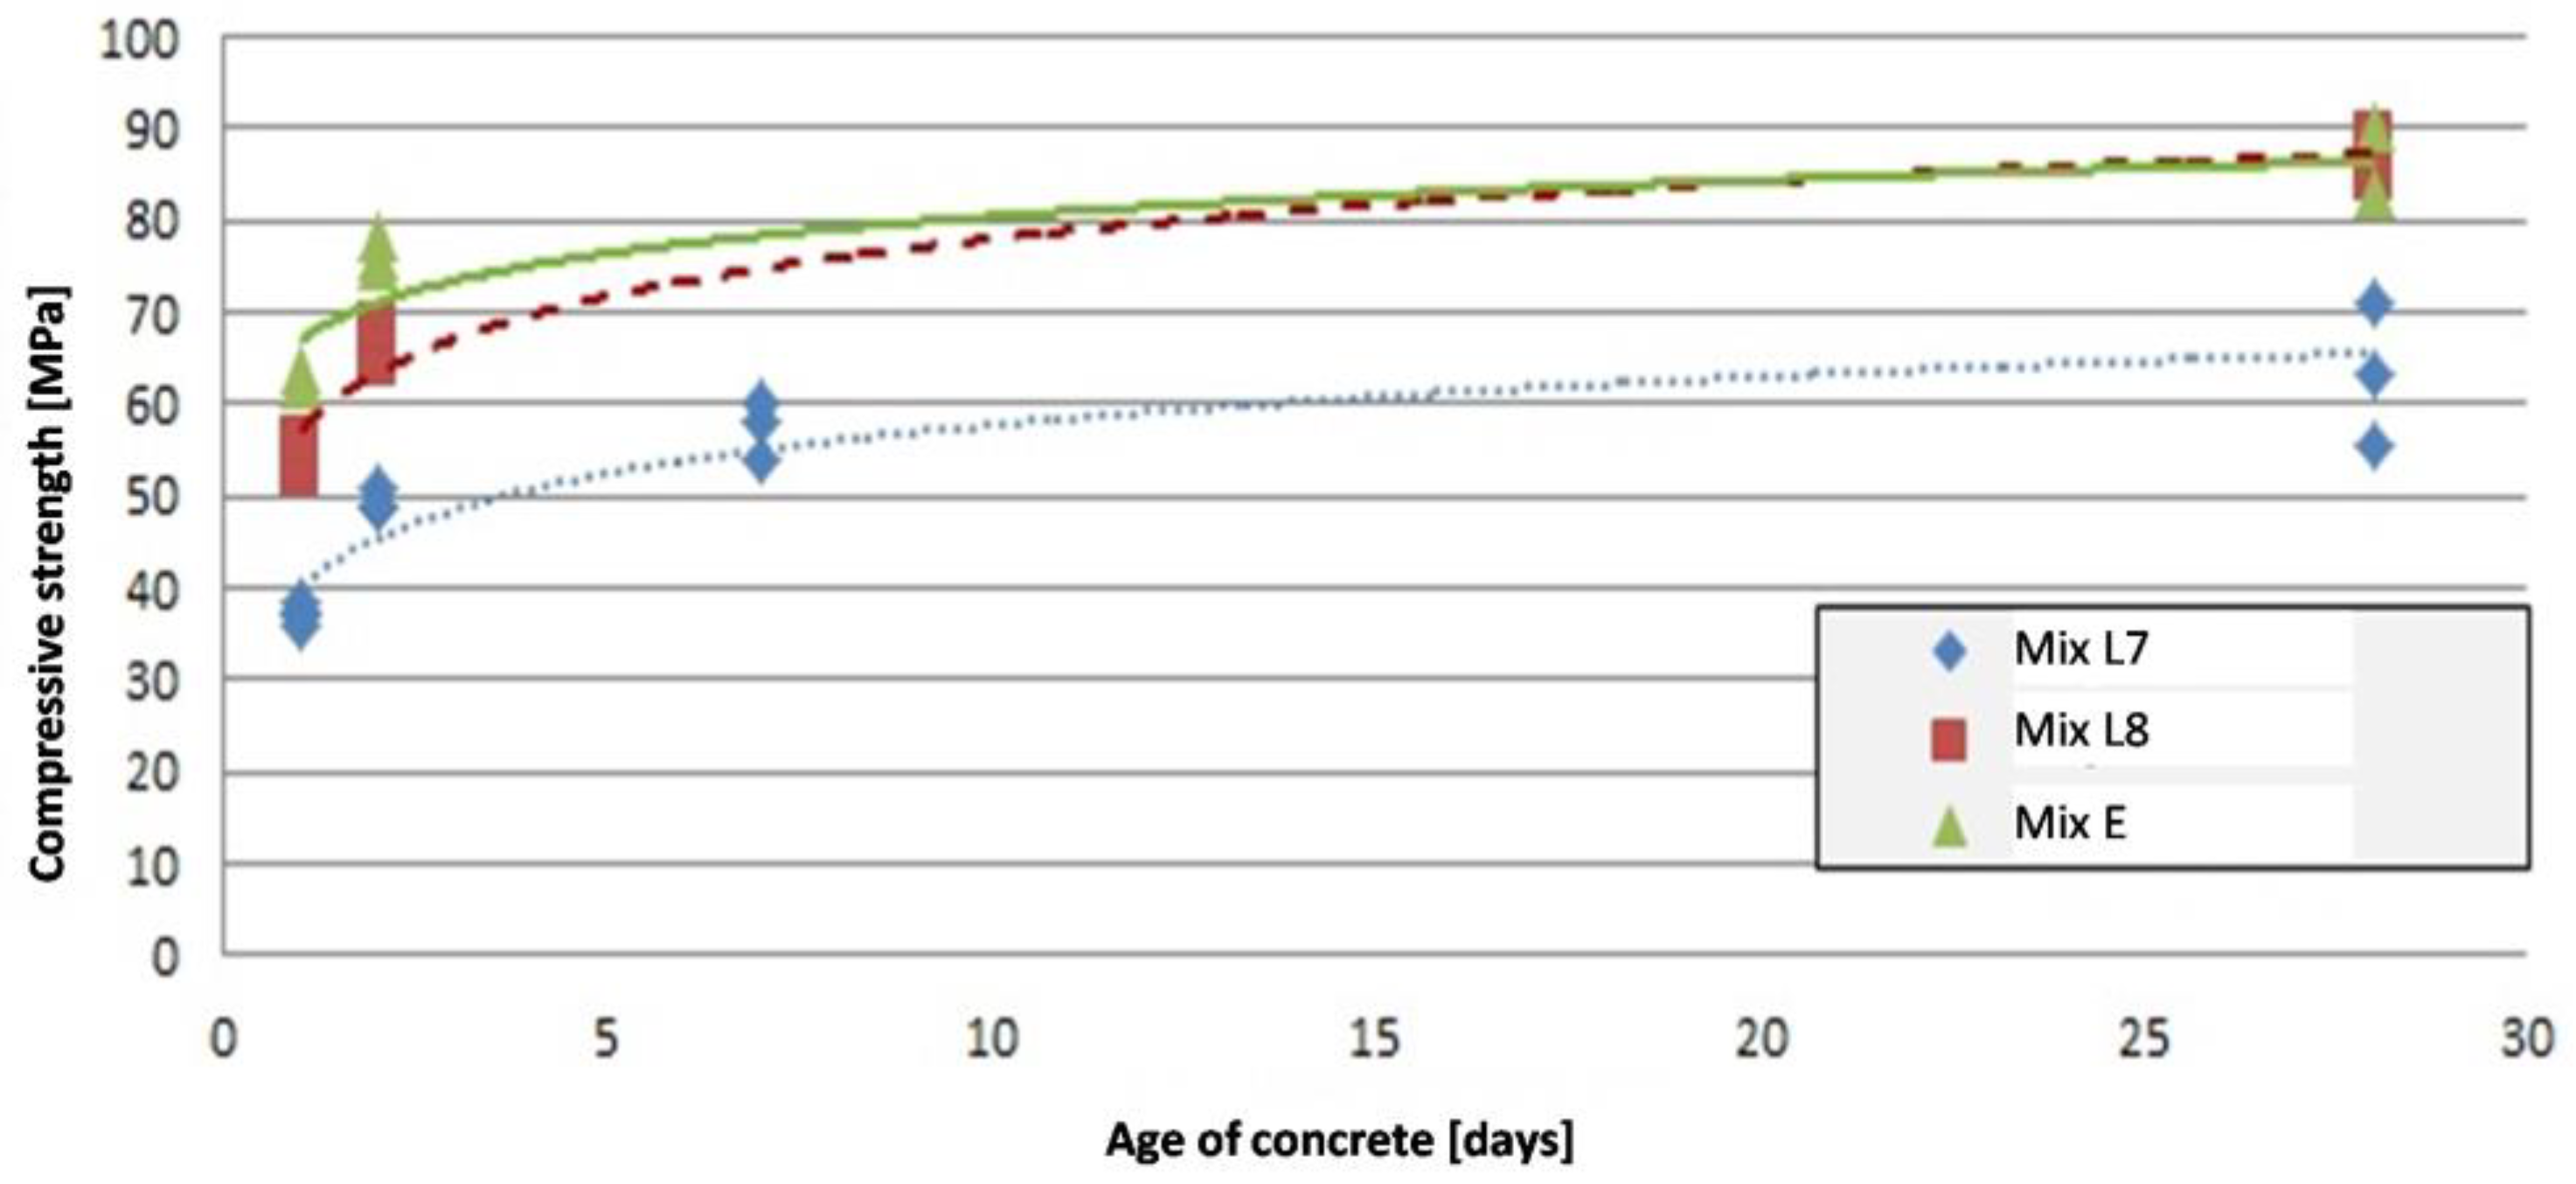
3.1. Compressive and Splitting-Tensile Strength

The compressive strength of the specimens was tested by applying an 11.25 kN/s (quasi-static) loading rate. The results are found in Table 3 and Table 4. The average compressive strength of LWAC was obtained as 41.09 N/mm2, approximately 20% lower than that of the reference mix (51.19 N/mm2). In parallel to that, the splitting tensile strength of LWAC occurred 30% lower than that of NWAC (meanwhile, the mass reduction of LWAC due to the use of lightweight aggregate was about 25%).

3.2. Standard Pull-Out Test

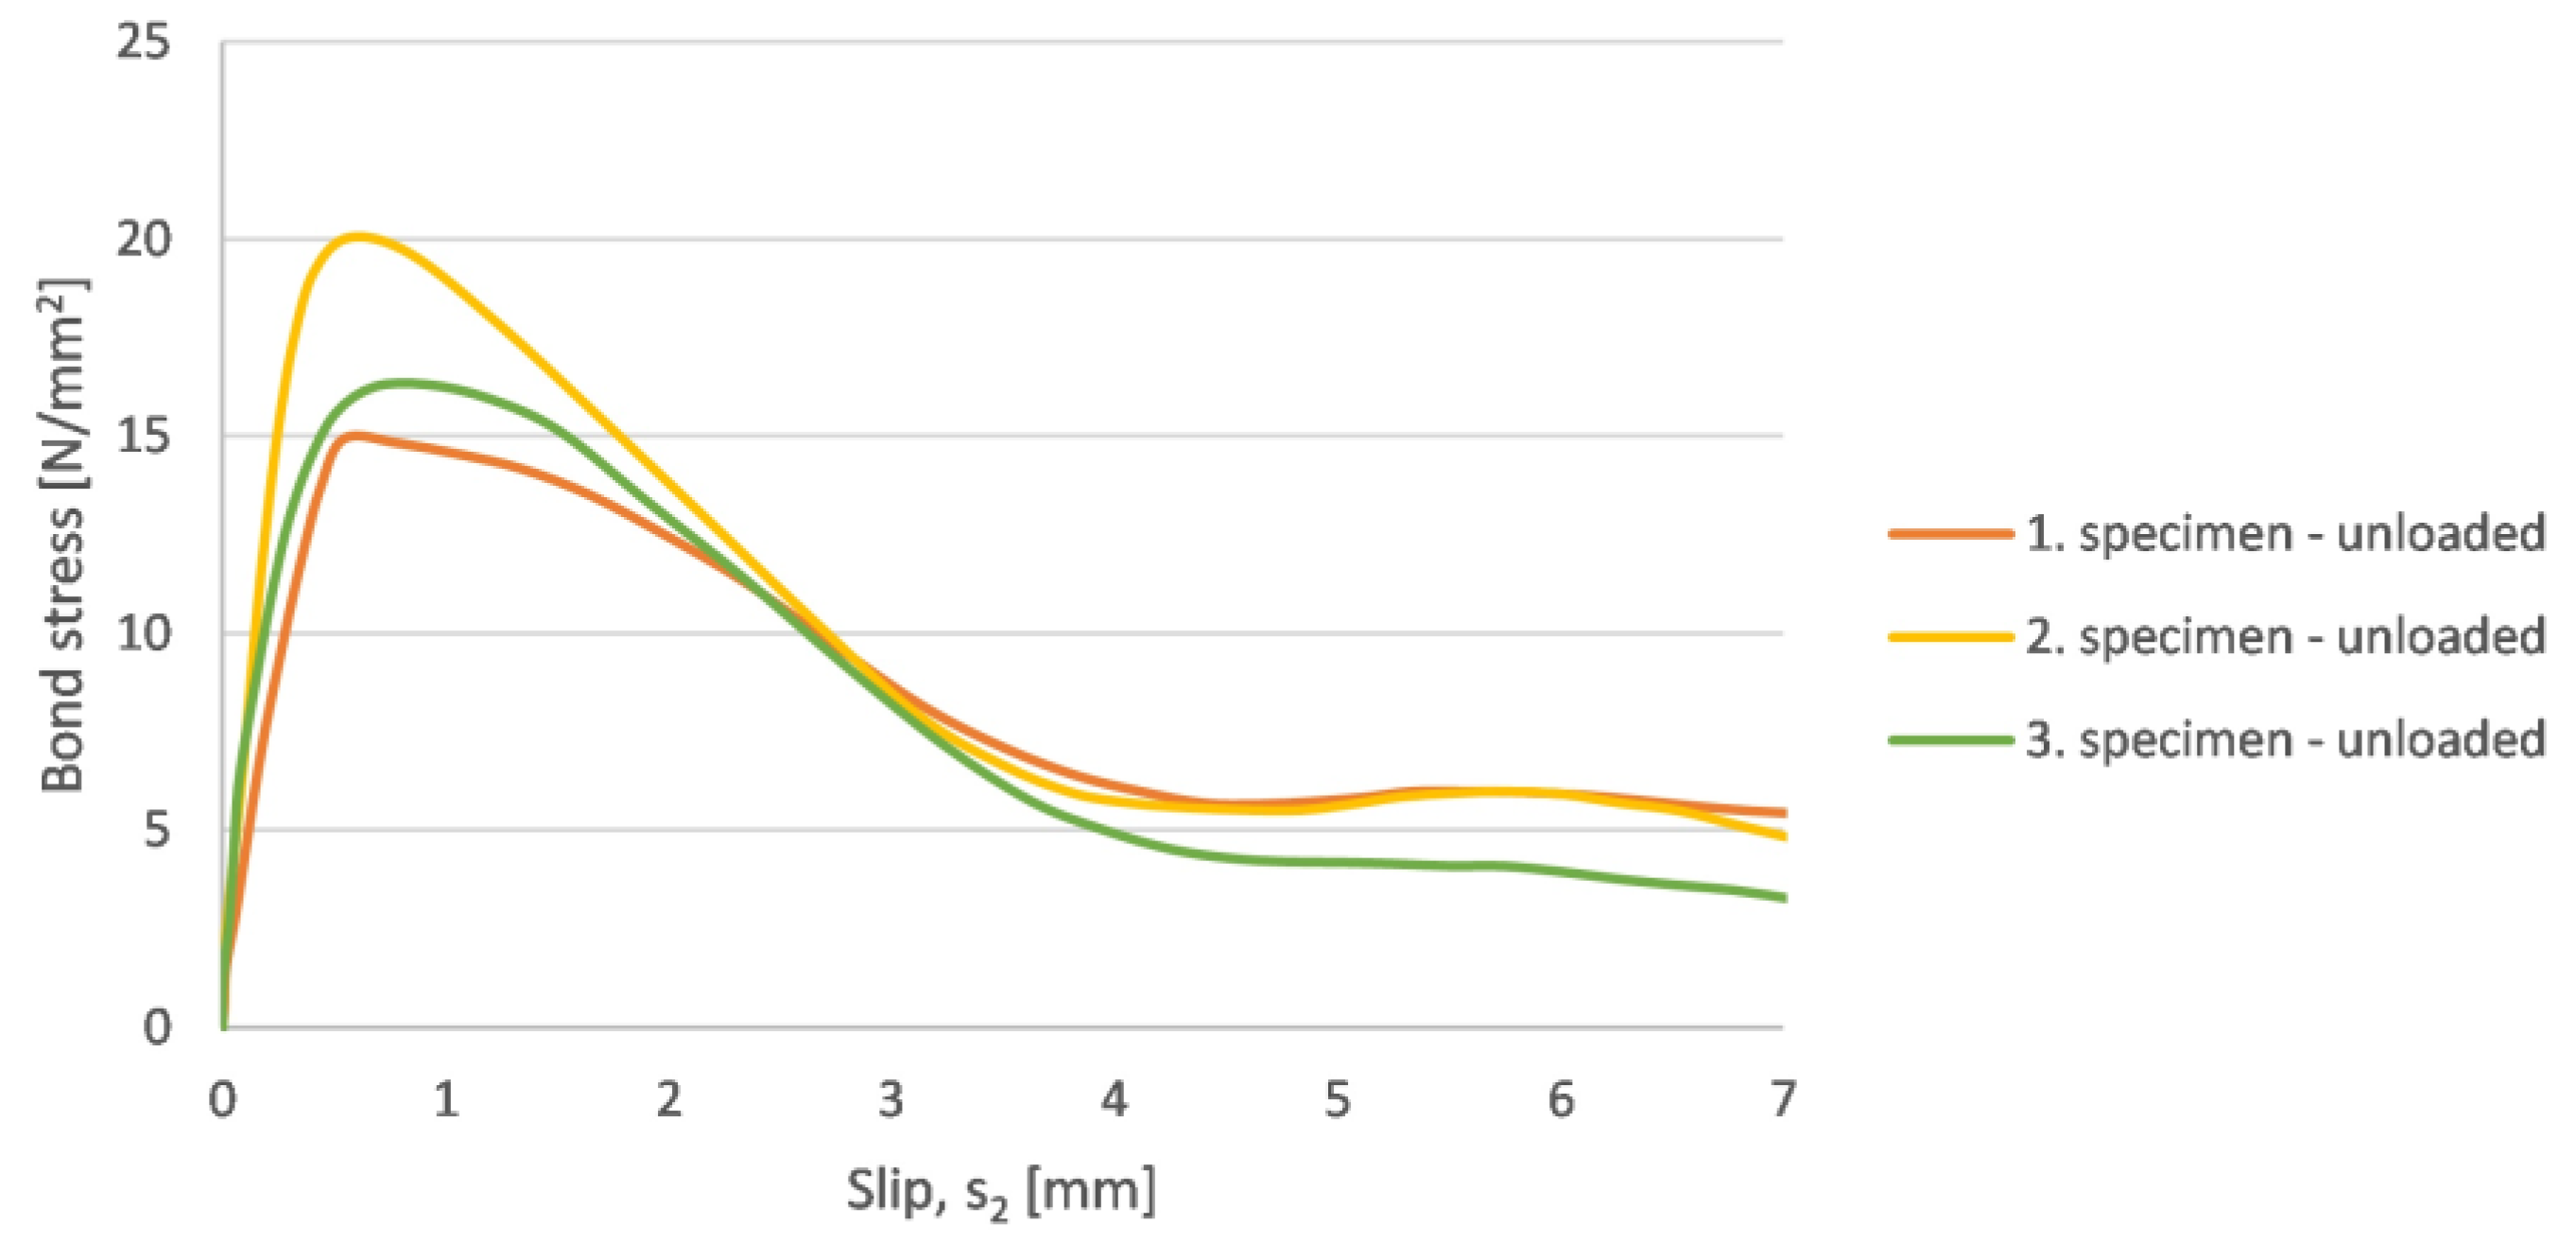
3.2.1. Standard Pull-Out Test of Lightweight Concrete

During these tests, the pull-out force (F) was measured in parallel with the corresponding slips on the loaded (s1) and unloaded (s2) ends of the rebar, as detailed in Section 2.1. Three tests on identical specimens were performed, whose results are seen in Figure 7.
As shown in Figure 7, the behaviours of the three specimens were very similar; however, quite large differences occurred between the maximum forces. This latter point can be explained by the short (only 40 mm long) bonded length relative to the applied particle size. Any heterogeneity along this bonded length due, for instance, to the presence of air-bubbles or the inadequate mixing of large particles may reduce the bond significantly. The last part of the curves in Figure 7 indicates a residual force corresponding to 25–30% of the maximum force that remains active (without significant reduction) in the domain of large (4–7 mm) slip.
The difference between the loaded and unloaded surfaces can be explained by the non-uniform stress distribution and by cracks developing during the test. Based on the results, the bond stress ( τ b ) can be calculated based on Equation (3).
Figure 8 shows the relation of the bond stress and slip in case of the lightweight concrete calculated based on the above equation. The characteristics of the diagram are similar to the previous one. It is interesting to see that the length of the plateau of the maximal stresses is inversely proportional to the value of the maximum stress. Meaning, that the higher maximum stress belongs shorter plateau.
The results of the pull-out test can be seen in tabular form in Table 5.

3.2.2. Standard Pull-Out Test of Normal Concrete

Figure 9 shows, that in case of NWAC, the resulting curves have very similar shapes to each other as it was in case of the lightweight concrete. The initial displacements were negligible and the initial slope of the curves is steeper than it was in case of LWAC. The reason for the steeper initial slope curve is that the modulus of elasticity of NWAC is larger than that of LWAC [41]. The maximum force has a large standard deviation similarly to the LWAC. The plateau belonging to the residual forces can be observed in the case of the 1. and 3. specimens, but in the case of the 2. it was not so distinctive.
Based on the previously mentioned calculation, the bond stresses were calculated. The results can be seen in Figure 10 and Table 6.
The low values of the 3. specimen can be explained by the failure of the protective tube, which occurred during the form working.
Based on Table 6 the standard deviation of the results is quite high.

3.3. Comparison of the Normal and Lightweight Concrete Standard Pull-Out Tests

If the results of the NWAC and LWAC pull-out test are plotted in one figure, the following observations can be drawn (Figure 11):
  • The phenomenon is similar in both cases;
  • The bond strength of NWAC is higher (in average about 5 N/mm2);
  • The maximum slip of the unloaded surface (s2) is in the range of 0.5–1.0 mm for both concretes;
  • The initial slope of the figure is higher in case of the normal concrete;
  • The residual stresses are in the range of 5–10 N/mm2 for both concretes.
Based on the tabular results, presented in Table 7, it can be seen that:
  • The compressive strength is 20% lower in case of LWAC;
  • The tensile strength of LWAC is 71% of the tensile strength of NWAC;
  • The bond strength of LWAC is 22% lower compared to NWAC;
  • The NWAC shows larger standard deviations in case of compressive strength and bond strength–
  • The ratio of the bond strength in LWAC and in NWAC (77.87%) is between the values corresponding to the compressive (80.27%) and tensile (71.09%) strength. The bond strength is considered in the literature to be proportional to the tensile strength. The experiments show a higher ratio in case of bond strength (than in case of tensile strength) that can be explained by the different contact zone between the steel and the aggregates of normal and lightweight concrete.

3.4. Cyclic Pull-Out Test

3.4.1. Cyclic Pull-Out Test of LWAC

Cyclic loading was applied as a proportion of the maximal loading capacity (50%, 60%, 80%, 90%, and 100%) then (when the highest bond stress was measured) the 92.5% and 100% of the maximum load was applied on the specimens. To do that the relative displacements were monitored in every cycle.
The effect of cyclic loading can be seen on Figure 12.
From the measured forces and slips the bond stress can be calculated based on the equation detailed in Section 2.1.
In Figure 12 and Figure 13, it can be seen that:
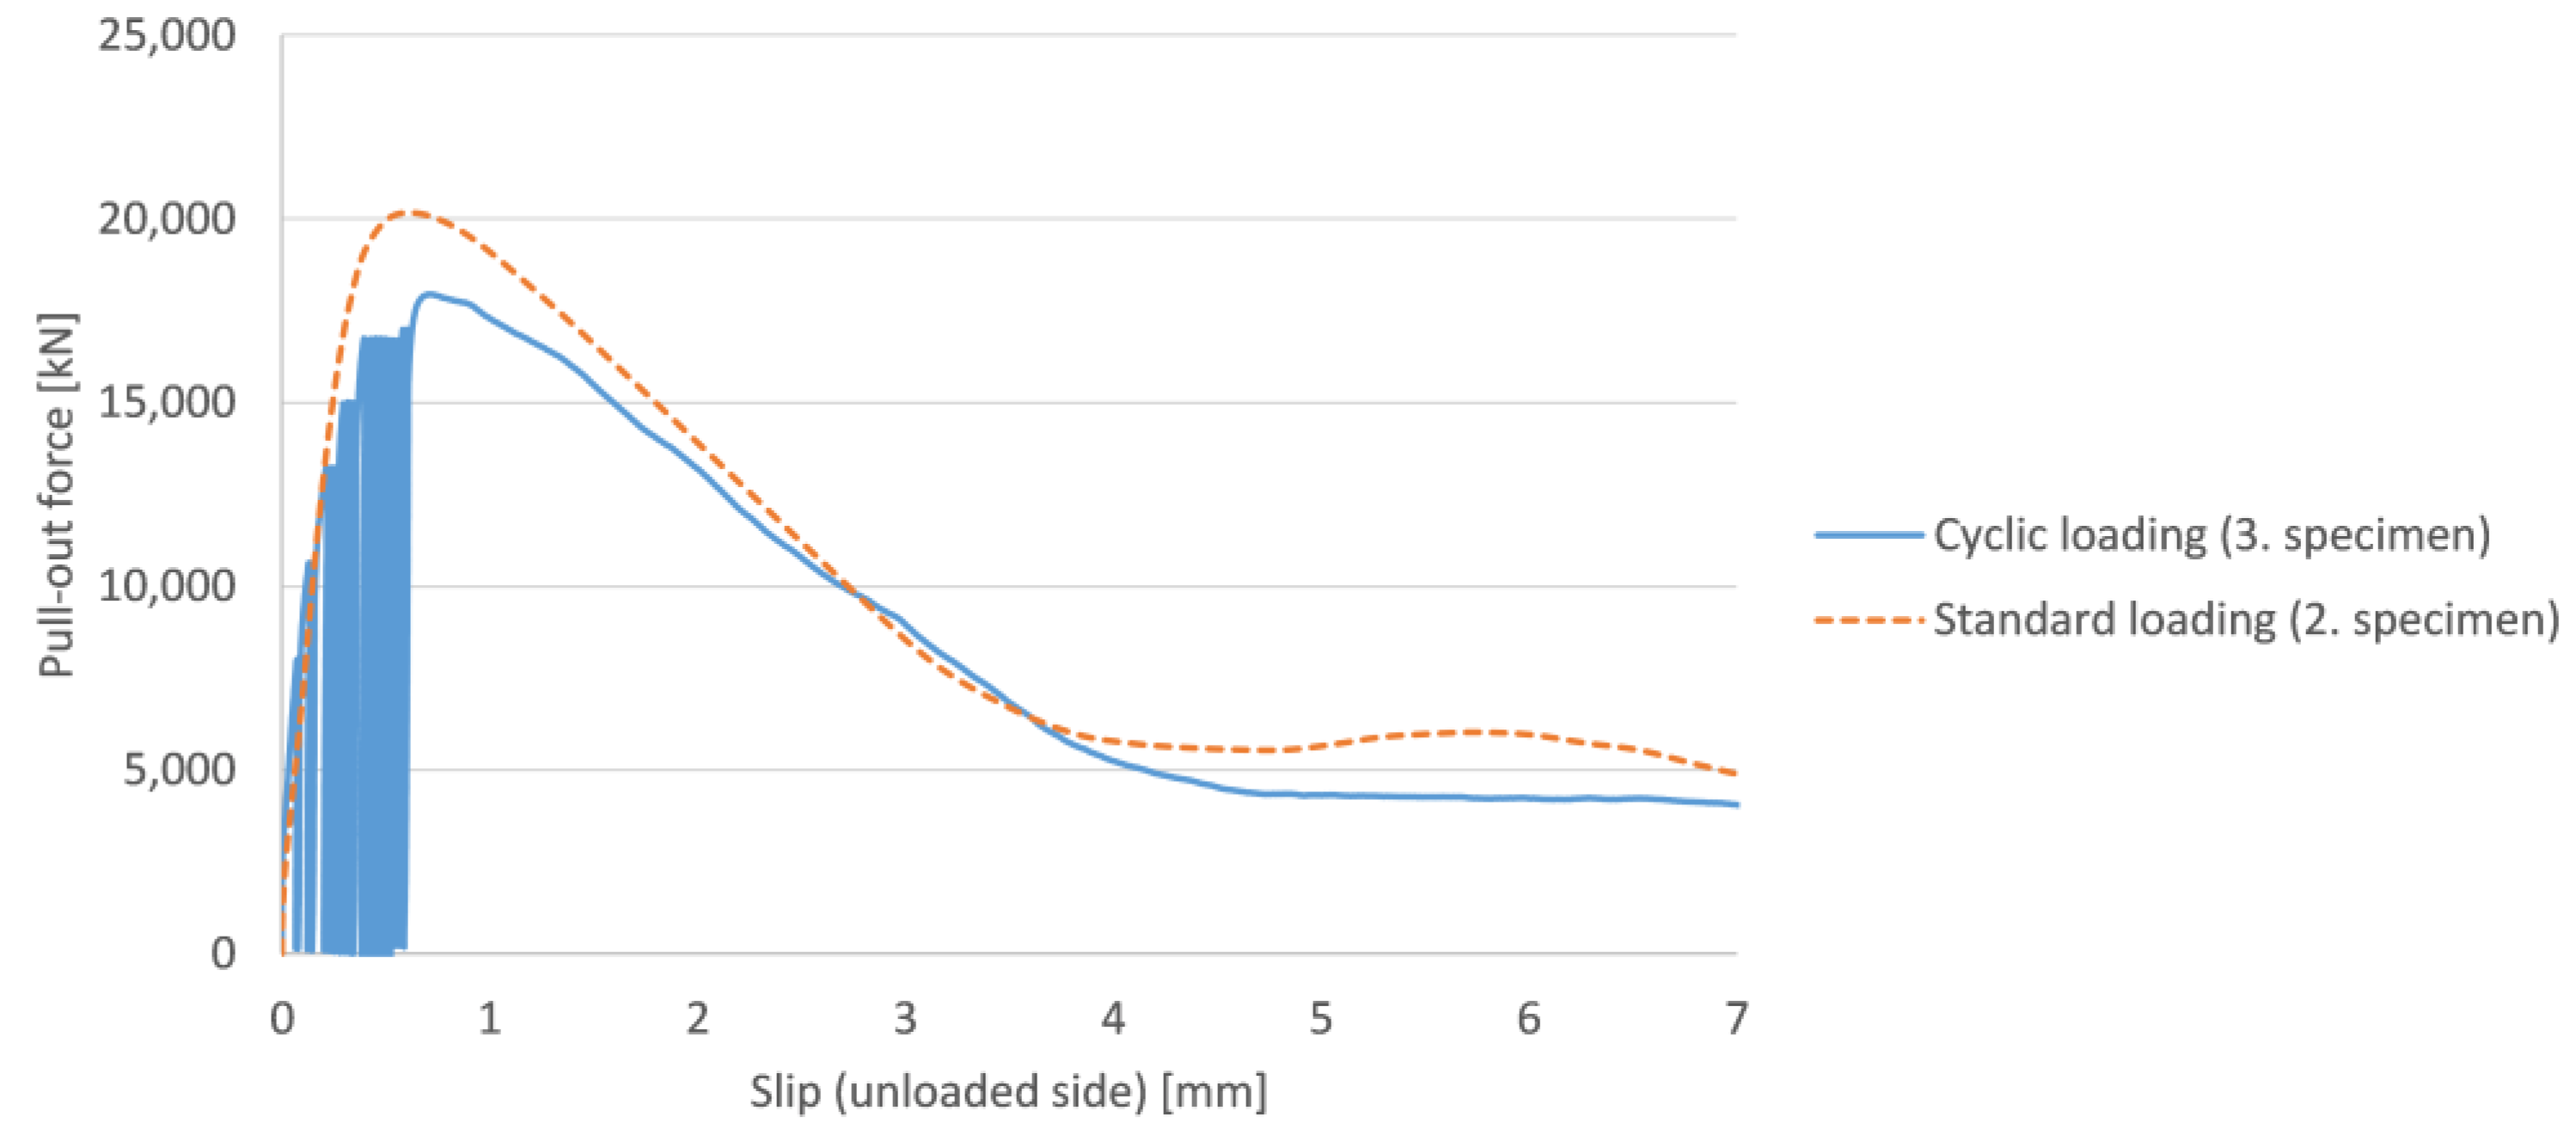
  • The enveloping curve of the cyclic loading is similar to the standard pull-out test, but in the maximal load bearing capacity significant differences were observed. As a conclusion it can be stated that the force–slip curve of the cyclic loading always stays inside the figure of the standard pull-out test;
  • At the unloaded surface under a given load level, no displacement was observable;
  • It can be seen that always the first cycle of the given load level produces the largest displacement. After the first cycle at a given load level, the slips in every cycle (at a given load level) are similar to each other;
  • The descending part of the cyclic loading curve is similar to the curve of the standard loading.

3.4.2. Cyclic Pull-Out Test of NWAC

The loading history of normal weight concrete was identical to the lightweight concrete’s loading history. The average maximum load bearing capacity (the value belonging to the 100% loading) was 26,000 N in the case of NWAC.
The results of the test are shown in Figure 14 and Figure 15; thus, the differences and similarities between the two loading scenarios can be identified:
  • The curve of the standard pull-out test envelopes the curve of the cyclic loading. In case of NWAC the standard bond stress–slip curve also envelopes the curve of the cyclic loading;
  • It can be seen that the specimen can resist the maximum 26,000 N loading multiple times without failure. It is due to the short time period of this loading that there is not enough time for the development of microcracks. It can lead us to the conclusion that the number of cycles is a function of the loading rate. If one decreases the loading rate, the number of cycles (necessary for the failure) decreases in case of the same type of concrete;
  • It can be seen that always the first cycle of the given load level produces the largest displacement. After the first cycle, the cycles in a given load level always become smaller and smaller. This is true only until the maximum bond stress is reached, after that, the first slip of the given load level is the smallest;
  • The slip belonging to the maximum bond stress is shifting;
  • The residual bond stress and the descending part of the figures (standard and cyclic) are not affected by the loading scenario, they are similar to each other;
  • The slope of the (re)loading is always the same independently of the load level;
  • The cyclic pull-out test causes plastic displacements (in case of NWAC and LWAC as well).
Similarly to the previous section, the bond stress is calculated based on the equation detailed in Section 2.1.

3.4.3. Comparison of the Results

It is a difficult task to compare concretes composed of different aggregates. The NWAC produced higher strength values (as it was expected) and it performed better in the pull-out tests as well. It indicates a correlation between the strength of the material and the bond strength, which was found in the literature as well [10]. It was found that for normal strength concretes (≤C60), the bond strength of ribbed rebars in normal weight aggregate concrete or lightweight aggregate concrete is proportional to the square root of the compressive strength of concrete. If one would like to investigate this phenomenon more properly for different types of concretes, then it is useful to normalize the bond stress values with the compressive strength of the material (τ.bu/f.cm). The compressive strength was chosen based on literature recommendation (this is the value based on which the concretes are distinguished in standards, such as C25/30).
Standard pull-out tests:
As a first step, some special characteristic points were chosen from the bond stress–slip diagram and then the specific value of these points was calculated, as it can be seen in Table 8.
The chosen points were the following:
  • The maximum bond stress;
  • Fifty percent of the maximum stress on the ascending and the descending part of the curve;
  • The stress belonging to the 4.5 mm slip value to represent the residual stress. (The value of the slip was chosen arbitrarily based on the figures.)
The points are plotted into Figure 16 too.
Based on Table 8 and Figure 16, the following observations can be drawn:
  • The discrete values show larger standard deviations in case of NWAC;
  • The initial slope of the figure is less steep in the case of the LWAC;
  • The average curve of the NWAC always envelops the curve of the lightweight concrete. It means that the energy absorption capacity of the NWAC is higher; however, the difference between the two curves is quite small.
  • The difference of normal and lightweight concrete in maximum stress is less than 3%;
  • At the ascending part of the curves, it can be observed that the lightweight concrete needs higher displacements to reach the same stress level as the normal weight concrete, which can cause difficulties in case of design for serviceability.
Cyclic pull-out tests:
To compare the cyclic pull-out tests of NWAC and LWAC, the Balázs principle [34] was used. The principle states that the damage is linear until the maximum point of the enveloping curve. Based on the literature, the maximum number of cycles can be approximated, which belongs to this maximum point. Thus, the upper limit is a displacement; however, the lower limit of the linear damage can be determined by looking at the figure and finding the number of cycles where the displacements look to be the same. It can be seen in Figure 17.
It can be seen in Figure 17 that the higher the loading the steeper the slope of the lines, as it was already observed on the bond stress–slip diagrams. The parameters (a and b) of the lines can be collected into Table 9.
Based on Table 9, the proportion of the bond strength and the number of cycles can be determined, based on which the fatigue curve can be obtained. In the case of the cyclic pull-out test, the bond strength was specified with the maximum value of the bond strength. It did not cause a major difference in the results.
The fatigue diagram belonging to the small number of cycles can be seen in Figure 18.
In Figure 18, it can be seen that with the increase in the specific bond stress, the number of cycles (that can be reached) is decreasing linearly. A linear line can be fit to the data with a high coefficient of determination (R2 = 0.9813 for LWAC and R2 = 0.9945 for NWAC).
A similar approach can be performed on the NWAC results as well. If one plots the bond stress ratio vs. the number of cycles of normal- and lightweight concrete, Figure 18 can be obtained.
Based on Figure 18 it can be observed that the difference between the NWAC and LWAC is very small on average; however, it is important to note that to draw clear conclusions a larger cycle number would be necessary.

4. Conclusions

The present project is dealing with the valuation of results of standard pull-out static and cyclic bond tests completed on ordinary ribbed reinforcing steel bars embedded in two types of concrete: one with a lightweight aggregate and another with a normal aggregate, used as reference. The only difference between the two mixes is the type of the coarse aggregate. Compressive strength, splitting-tensile strength, and (standard and cyclic) pull-out tests were performed on the samples, casted from the two types of concrete.
For the pull-out tests, cube specimens with a 150 mm edge length were produced, in which a ∅8 ribbed reinforcing steel bar was placed in the center of the surface of the cube. The contact bond length was the same in every case (40 mm). Besides the specimens casted for the pull-out tests, standard samples for compression and splitting-tension test were produced as well. Based on the results of the experiments, the following conclusions can be drawn:
  • The concrete mix with the lightweight aggregate resulted in a 20% lower compressive strength, and a 29% lower splitting-tensile strength compared to the normal weight aggregate concrete mix. This showed sufficient correlation with the values calculated with the expressions of the Eurocode and Model Code;
  • Based on the fracture surface of the lightweight samples subjected to the splitting-tensile strength test, it could be stated that the mortar and the aggregate both took part in the load bearing;
  • The pull-out bond stress and slip values results showed a higher standard deviation compared to the ones of the compression and bending-tensile strength tests;
  • It was observed for both mixes, that the bond stress–slip diagram showed a good correlation with each other (in shape); moreover, it could be seen that the failure mode was the same for all samples;
  • The standard pull-out test did not show a significant difference in shape between the normal and lightweight aggregate concrete mixes until the maximum bond stress was reached. After that, the difference remained small and, in contrast to our expectations, the lightweight concrete did not show a more rigid behaviour;
  • The bond stress—slip figure of the standard pull-out test covered (enveloped) properly the same figure of the cyclic pull-out test in the case of NWAC. In the case of LWAC, this was not true for all specimens;
  • Both concrete types were able to resist the maximum pull-out force multiple times in the case of cyclic loading. It was possible because there was no time for the formation/further development of cracks or the redistribution of stresses. In the case of cyclic loading, not only was the loading rate was important, but the time while the maximum load was applied on the sample influenced the results;
  • For cyclic bond tests carried out at low load levels (50–80% of maximum bond stress), always the first cycle produced the largest slip; however, for a high load level (90% of maximum bond stress) the slip in the subsequent cycles gradually intensified;
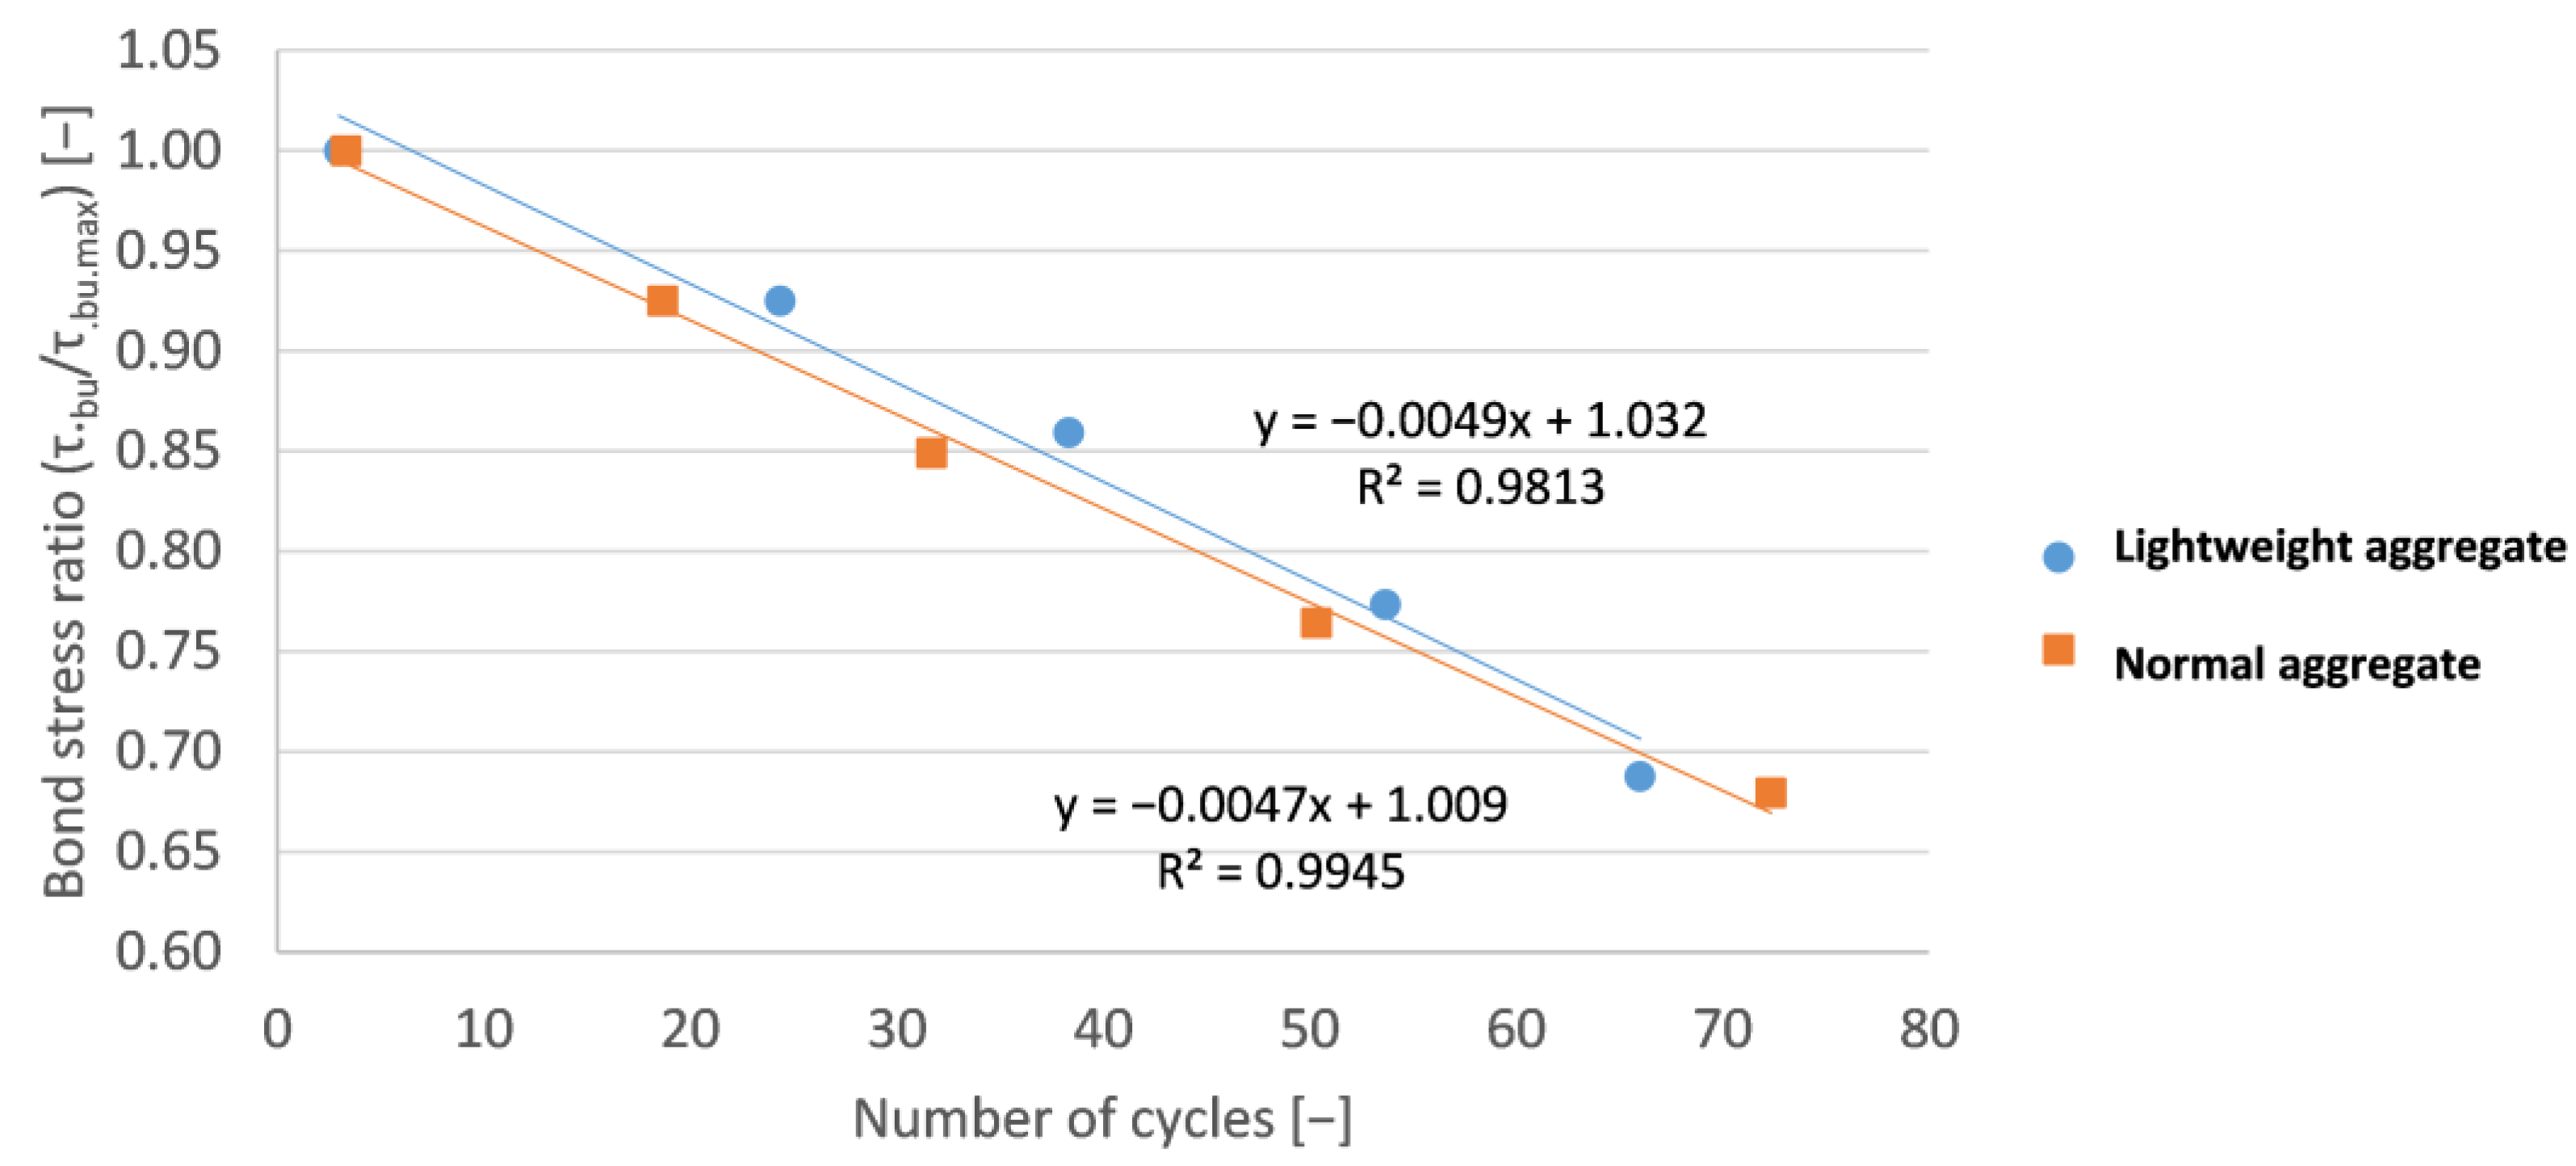
  • For cyclic bond tests, the accumulating slip versus the cycle number relationship could be well described by a linear for all load levels; however, the inclination of these lines increased with the load level;
  • In the case of a low cycle number fatigue, there was no significant difference between the pull-out bond test results of the normal and lightweight aggregate concrete;
  • In the standards, only limited data can be found on bond strength in case of cyclic loading.

Author Contributions

Conceptualization, T.K. and R.N.; methodology, T.K. and R.N.; validation, L.J., T.K. and R.N.; formal analysis, T.K. and R.N.; investigation, L.J., T.K. and R.N.; resources, R.N.; data curation, L.J. and Z.G.; writing—original draft preparation, Z.G.; writing—review and editing, T.K. and R.N.; visualization, L.J. and Z.G.; supervision, T.K. and R.N. All authors have read and agreed to the published version of the manuscript.

Funding

This research received no external funding.

Institutional Review Board Statement

Not applicable.

Informed Consent Statement

Not applicable.

Data Availability Statement

Not applicable.

Acknowledgments

Special thanks to the colleagues of the laboratories of the Department of Construction Materials and Technologies and the Department of Structural Engineering for their help in the preparation and execution of the experiments presented in this paper.

Conflicts of Interest

The authors declare no conflict of interest.

References

  1. Kovács, T.; Nemes, R. Bond between strands and high-strength lightweight aggregate concrete. In Proceedings of the 11th CCC Congress Hainburg, Hainburg, Austria, 2 October 2015. [Google Scholar]
  2. Farina, I.; Moccia, I.; Salzano, C.; Singh, N.; Sadrolodabaee, P.; Colangelo, F. Compressive and Thermal Properties of Non-Structural Lightweight Concrete Containing Industrial Byproduct Aggregates. Materials 2022, 15, 4029. [Google Scholar] [CrossRef] [PubMed]
  3. Bogas, J.A.; Cunha, D. Non-structural lightweight concrete with volcanic scoria aggregates for lightweight fill in building’s floors. Constr. Build. Mater. 2017, 135, 151–163. [Google Scholar] [CrossRef]
  4. Dilli, M.E.; Atahan, H.N.; Sengül, C. A comparison of strength and elastic properties between conventional and lightweight structural concretes designed with expanded clay aggregates. Constr. Build. Mater. 2015, 101, 260–267. [Google Scholar] [CrossRef]
  5. Wang, X.F.; Fang, C.; Kuang, W.Q.; Li, D.W.; Han, N.X.; Xing, F. Experimental study on early cracking sensitivity of lightweight aggregate concrete. Constr. Build. Mater. 2017, 136, 173–183. [Google Scholar] [CrossRef]
  6. Ganesan, N.; Indira, P.V.; Sabeena, M.V. Bond stress slip response of bars embedded in hybrid fibre reinforced high performance concrete. Constr. Build. Mater. 2014, 50, 108–115. [Google Scholar] [CrossRef]
  7. Wang, L.; Yi, J.; Xia, H.; Fan, L. Experimental study of a pull-out test of corroded steel and concrete using the acoustic emission monitoring method. Constr. Build. Mater. 2016, 122, 163–170. [Google Scholar] [CrossRef]
  8. Vos, E. Influence of Loading Rate and Radial Pressure on Bond in Reinforced Concrete: A Numerical and Experimental Approach. Ph.D. Thesis, Delft University Press, Delft, The Netherlands, 1983. [Google Scholar]
  9. Bilek, V.; Bonczková, S.; Hurta, J.; Pytlík, D.; Mrovec, M. Bond Strength Between Reinforcing Steel and Different Types of Concrete. Procedia Eng. 2017, 190, 243–247. [Google Scholar] [CrossRef]
  10. Eligehausen, R.; Popov, E.P.; Bertero, V.V. Local Bond Stress-Slip Relationships of Deformed Bars under Generalized Excitations; Report No. UCB/EERC 83-19; University of California: Berkeley, CA, USA, 1982. [Google Scholar]
  11. Morita, S.; Fuji, S. Bond capacity of deformed bars due to splitting of surrounding concrete. Bond. Concr. 1982, 331–341. [Google Scholar]
  12. Vos, E.; Reinhardt, H.W. Bond stress-slip behaviour of deformed bars, plain bars and strands under impact loading. In Bond in Concrete; Applied Science Publishers: London, UK, 1982; 173p. [Google Scholar]
  13. Al-Shannag, M.J.; Charif, A. Bond behavior of steel bars embedded in concretes made with natural lightweight aggregates. J. King Saud Univ. Eng. Sci. 2017, 29, 365–372. [Google Scholar] [CrossRef]
  14. Lundgren, K. Pull-out tests of steel-encased specimens subjected to reversed cyclic loading. Mater. Struct. 2012, 33, 450–456. [Google Scholar] [CrossRef]
  15. Fathi, H.; Farhang, K. Effect of cyclic loadings on heated self-compacting concrete. Constr. Build. Mater. 2014, 69, 26–31. [Google Scholar] [CrossRef]
  16. Baea, B.-I.; Choi, H.-K.; Choi, C.-S. Bond stress between conventional reinforcement and steel fibre reinforced reactive powder concrete. Constr. Build. Mater. 2016, 112, 825–835. [Google Scholar] [CrossRef]
  17. Sinha, B.P.; Gerstle, K.H.; Tulin, L.G. Stress–strain relations for concrete under cyclic loading. ACI Struct. J. 1964, 61, 195–211. [Google Scholar]
  18. Li, X.; Zhao, J.; Zhang, X. A mechanical bond model for reinforcing bar in concrete subjected to monotonic and reversed cyclic loading. J. Build. Eng. 2021, 44, 102912. [Google Scholar] [CrossRef]
  19. Zhang, X.; Zhao, Y.; Zhu, Z.; Sha, S.; Lv, C. Experimental study on the cyclic bond behavior of corroded rebar based on modified beam test. J. Build. Eng. 2022, 47, 103834. [Google Scholar] [CrossRef]
  20. Fathi, H.; Dabbagh, H. Damage mechanism of SCC under cyclic loading with different speed. Constr. Build. Mater. 2015, 101, 252–259. [Google Scholar] [CrossRef]
  21. Park, R.; Paulay, T. Reinforced Concrete Structure; Wiley: Hoboken, NJ, USA, 1975. [Google Scholar]
  22. Boulekbache, B.; Hamrat, M.; Chemrouk, M.; Amziane, S. Flexural behaviour of steel fibre-reinforced concrete under cyclic loading. Constr. Build. Mater. 2016, 126, 253–262. [Google Scholar] [CrossRef]
  23. Lin, H.; Ožbolt, Y.Z.J. The bond behavior between concrete and corroded steel bar under repeated loading. Eng. Struct. 2017, 140, 390–405. [Google Scholar] [CrossRef]
  24. Caratelli, A.; Meda, A.; Rinaldi, Z. Monotonic and cyclic behaviour of lightweight concrete beams with and without steel fiber reinforcement. Constr. Build. Mater. 2016, 122, 23–35. [Google Scholar] [CrossRef]
  25. Bogas, J.A.; Gomes, M.G.; Real, S. Bonding of steel reinforcement in structural expanded clay lightweight aggregate concrete: The influence of failure mechanism and concrete composition. Constr. Build. Mater. 2014, 65, 350–359. [Google Scholar] [CrossRef]
  26. Robins, P.J.; Standish, I.G. Effect of lateral pressure on bond of reinforcing bars in concrete. Int. J. Adhes. Adhes. 1982, 2, 129–133. [Google Scholar] [CrossRef]
  27. American Concrete Institute. Guide for Structural Lightweight-Aggregate Concrete in Specifications for Structural Concrete; ACI 301-05; American Concrete Institute: Indianapolis, IN, USA, 2014. [Google Scholar]
  28. Zhou, H.; Lu, J.; Xv, X.; Dong, B.; Xing, F. Effects of stirrup corrosion on bond–slip performance of reinforcing steel in concrete: An experimental study. Constr. Build. Mater. 2015, 93, 257–266. [Google Scholar] [CrossRef]
  29. Zhou, H.; Liang, X.; Xiaolin, Z.; Jinlong, L.; Feng, X.; Liu, M. Variation and Degradation of Steel and Concrete Bond Performance with Corroded Stirrups. Constr. Build. Mater. 2017, 138C, 56–68. [Google Scholar] [CrossRef]
  30. Fib Bulletins 51, 52 and 53: Structural Concrete Textbook on Behaviour, Design and Performance, 2nd ed.; Beton- und Stahlbetonbau: Berlin, Germany, 2010. [CrossRef]
  31. Rehm, G.; Eligehausen, R. Bond of Ribbed Bars under High-Cycle Repeated Loads. ACI J. 1979, 76, 297–309. [Google Scholar]
  32. Balázs, G.L.; Koch, R.; Harre, W. Verbund von Stahl in Beton unter Betriebsbeanspruchung. In Proceedings of the Deutscher Ausschuss für Stahlbeton–30, Forschungskolloquium, Stuttgart, Germany, 24–25 March 1994; pp. 167–176. [Google Scholar]
  33. Balázs, G.L. Fatigue of Bond. ACI Mater. J. 1991, 88, 620–629. [Google Scholar]
  34. Balázs, G.L.; Koch, R. Bond Characteristics under Reversed Cyclic Loading. Otto Graf J. 1995, 6, 47–62. [Google Scholar]
  35. RILEM; CEB; FIP. Bond test for reinforcing steel. Mater. Struct. 1973, 6, 96–105. [Google Scholar]
  36. EN 10080:2005; Steel for the Reinforcement of Concrete—Weldable Reinforcing Steel—General. BSI: London, UK, 2005.
  37. Windisch, A. A Modified Pull-out Test and New Evaluation Methods for a More Real Local Bond-Slip Relationship. Mater. Struct. 1985, 18, 181–184. [Google Scholar] [CrossRef]
  38. Chao, S.-H. Bond Characterization of Reinforcing Bars and Prestressing Strands in High Performance Fiber Reinforced Cementious Composites under Monotonic and Cyclic Loading. Ph.D. Thesis, University of Michigan, ProQuest Dissertations Publishing, Ann Arbor, MI, USA, 2005. [Google Scholar]
  39. EN 12390-3:2009; Testing Hardened Concrete. Part 3: Compressive Strength of Test Specimens. European Committee for Standardization: Brussels, Belgium, 2009.
  40. EN 12390-5:2010; Testing Hardened Concrete. Part 5: Flexural Strength of Test Specimens. European Committee for Standardization: Brussels, Belgium, 2010.
  41. Maree, A.F.; Riad, K.H. Analytical and experimental investigation for bond behaviour of newly developed polystyrene foam particles’ lightweight concrete. Eng. Struct. 2014, 58, 1–11. [Google Scholar] [CrossRef]
Figure 1. Compressive strength as function of concrete age (LWAC: Mix L7 and L8; NWAC: Mix E).
Solids 03 00028 g001
Figure 2. Bond strength as function of concrete age (LWAC: Mix L7 and L8; NWAC: Mix E).
Solids 03 00028 g002
Figure 3. Setups for pull-out bond test. (a) Test for bond in tension. (b) Test for bond under transverse pressure. (c) Standardized pull-out test for bond.
Solids 03 00028 g003
Figure 4. Force-controlled cyclic loading.
Solids 03 00028 g004
Figure 5. Pull-out test at the laboratory of BME Department of Structural Engineering.
Solids 03 00028 g005
Figure 6. Scheme of the pull-out test (values in mm).
Solids 03 00028 g006
Figure 7. Standard pull-out test results for lightweight concrete (Pull-out force (F)–slip (s) curve).
Solids 03 00028 g007
Figure 8. Bond stress–slip diagram of lightweight concrete.
Solids 03 00028 g008
Figure 9. Results of the standard pull-out tests of NWAC.
Solids 03 00028 g009
Figure 10. Bond stress–slip diagram of NWAC.
Solids 03 00028 g010
Figure 11. Bond stress–slip diagram of NWAC and LWAC.
Solids 03 00028 g011
Figure 12. Comparison of standard and cyclic loading force of LWAC.
Solids 03 00028 g012
Figure 13. Comparison of standard and cyclic bond stress of LWAC.
Solids 03 00028 g013
Figure 14. Comparison of standard and cyclic loading force vs. slip of NWAC.
Solids 03 00028 g014
Figure 15. Comparison of standard and cyclic bond stress vs. slip of NWAC.
Solids 03 00028 g015
Figure 16. Bond strength ratio of normal- and lightweight concrete (discrete values) and their average curves.
Solids 03 00028 g016
Figure 17. Slips belonging to the given cycles in case of LWAC.
Solids 03 00028 g017
Figure 18. Fatigue curves belonging to the bond stress (R2: the coefficient of determination).
Solids 03 00028 g018
Table 1. Number of test specimens.
Pull-Out TestsStrength Tests
Standard LoadingCyclic LoadingCompression StrengthSplitting Tensile Strength
Lightweight (LWAC)3343
Normal weight (NWAC)3353
Total1296
Table 2. Composition of (1 m3) mixes.
ComponentsNormal Weight Concrete (NWAC) MixLightweight Concrete (LWAC) Mix
(kg)(kg)
Cement (CEM II/A-S 42.5 R)360360
Water (v/c = 0.5)180180
Coarse aggregate: Quartz gravel (NWAC: 4/16 mm fraction) or Liapor HD 5n (LWAC: 4/8 mm fraction)1193450
Fine aggregate: Quartz sand (0/4 mm fraction)646646
Table 3. Compressive and splitting tensile strength of lightweight concrete.
Lightweight Concrete
Compressive StrengthSplitting Tensile Strength
SpecimenDensityMax. ForceStrengthSpecimenDensityMax. ForceStrength
(kg/m3)(kN)(N/mm2)(kg/m3)(kN)(N/mm2)
LWAC1JL-K-11178395742.03JL-KH-1117351862.62
LWAC2JL-K-12173692741.09JL-KH-1217411932.72
LWAC3JL-K-22178295041.83JL-KH-2217561702.40
LWAC4JL-K-21177990339.40----
Average 1770 41.09 1744 2.58
Table 4. Compressive and splitting tensile strength of normal weight concrete.
Normal Weight Concrete
Compressive StrengthSplitting Tensile Strength
SpecimenDensityMax. ForceStrengthSpecimenDensityMax. ForceStrength
(kg/m3)(kN)(N/mm2)(kg/m3)(kN)(N/mm2)
NWAC1JL-N-112383117652.06JL-NH-1123632633.68
NWAC2JL-N-122364121953.29JL-NH-2123792463.47
NWAC3JL-N-212350107547.49JL-NH-2223552663.73
NWAC4JL-N-222354107547.75----
NWAC5JL-N-232333126655.34----
Average 2357 51.19 2366 3.63
Table 5. Bond stress of lightweight concrete.
Lightweight ConcreteSlip (At Max. Force)Max. ForceBond Stress
(mm)(N)(N/mm2)
1. Specimen0.54715,01014.93
2. Specimen0.57020,14920.04
3. Specimen0.91916,40216.32
Average17,18717.10
Standard deviation21702.16
Table 6. Bond stress of NWAC.
Normal ConcreteSlip (At Max. Force)Max. ForceBond Stress
(mm)(N)(N/mm2)
1. Specimen0.73726,08725.95
2. Specimen0.67321,96921.85
3. Specimen0.68018,17318.08
Average22,07621.96
Standard deviation32323.21
Table 7. Strengths of normal and lightweight concrete.
Type of ConcreteStatistical DataCompressive StrengthSplitting-Tensile StrengthBond Strength
(N/mm2)(N/mm2)(N/mm2)
LightweightAverage41.092.5817.10
Std. deviation1.040.212.16
NormalAverage51.193.6321.96
Std. deviation3.100.183.21
Lightweight compared to normal weight concrete (%)
(%)Average80.2771.0977.87
Std. deviation33.48120.3867.29
Table 8. Bond strength and slip of NWAC and LWAC.
Type of Concretef.cm1. Specimen2. Specimen3. SpecimenAverage
s2τ.bu/f.cms2τ.bu/f.cms2τ.bu/f.cms2τ.bu/f.cm
(N/mm2)(mm)(-)(mm)(-)(mm)(-)(mm)(-)
NWAC51.190.0610.250.1060.210.0470.180.0720.21
0.7370.510.6730.430.6800.350.6970.43
3.9390.253.3490.212.7880.183.3590.21
4.5000.234.5000.174.5000.074.5000.16
LWAC41.090.1890.180.1470.240.1290.200.1550.21
0.5470.360.5700.490.9190.400.6790.41
3.3790.182.7140.243.0210.203.0380.21
4.5000.144.5000.144.5000.114.5000.13
Table 9. Parameters of the lines and the approximated number of cycles in case of LWAC.
yend0.679[mm]
Load HistoryParametersNumber of CyclesBond Strength/Compressive Strength Ratio
abCalculatedRounding (to Bottom)
(N)(-)(mm)(-)(-)(-)
8594----0.43
11,172----0.56
13,7500.00670.154578.27780.69
15,4680.00730.20964.37640.77
17,1870.00810.275149.85490.86
18,5000.00910.371733.76330.93
20,0000.04360.55322.8821.00
Publisher’s Note: MDPI stays neutral with regard to jurisdictional claims in published maps and institutional affiliations.

