
Plasma versus Serum Analysis by FTIR Spectroscopy to Capture the Human Physiological State


Abstract
:1. Introduction
2. Materials and Methods
2.1. Study Population and Design
2.2. Collection of Biological Samples
2.3. FTIR Spectra Acquisition
2.4. Spectra Preprocessing and Processing
3. Results
4. Discussion
5. Conclusions
Author Contributions
Funding
Institutional Review Board Statement
Informed Consent Statement
Conflicts of Interest
References
- Sahu, R.K.; Mordechai, S. Spectroscopic techniques in medicine: The future of diagnostics. Appl. Spectrosc. Rev. 2016, 51, 484–499. [Google Scholar] [CrossRef]
- Güler, G.; Guven, U.; Oktem, G. Characterization of CD133+/CD44+ human prostate cancer stem cells with ATR-FTIR spectroscopy. Analyst 2019, 144, 2138–2149. [Google Scholar] [CrossRef]
- Rosa, F.; Sales, K.C.; Cunha, B.R.; Couto, A.; Lopes, M.B.; Calado, C.R.C. A comprehensive high-throughput FTIR spectroscopy-based method for evaluating the transfection event: Estimating the transfection efficiency and extracting associated metabolic responses. Anal. Bioanal. Chem. 2015, 407, 8097–8108. [Google Scholar] [CrossRef]
- Marques, V.; Cunha, B.; Couto, A.; Sampaio, P.; Fonseca, L.P.; Aleixo, S.; Calado, C.R. Characterization of gastric cells infection by diverse Helicobacter pylori strains through Fourier-transform infrared spectroscopy. Spectrochim. Acta Part A Mol. Biomol. Spectrosc. 2019, 210, 193–202. [Google Scholar] [CrossRef] [PubMed]
- Martak, D.; Valot, B.; Sauget, M.; Cholley, P.; Thouverez, M.; Bertrand, X.; Hocquet, D. Fourier-Transform InfraRed Spectroscopy Can Quickly Type Gram-Negative Bacilli Responsible for Hospital Outbreaks. Front. Microbiol. 2019, 10, 1440. [Google Scholar] [CrossRef] [PubMed] [Green Version]
- Clemens, G.; Hands, J.R.; Dorling, K.M.; Baker, M.J. Vibrational spectroscopic methods for cytology and cellular research. Analyst 2014, 139, 4411–4444. [Google Scholar] [CrossRef]
- de Bruyne, S.; Speeckaert, M.M.; Delanghe, J.R. Applications of mid-infrared spectroscopy in the clinical laboratory setting. Crit. Rev. Clin. Lab. Sci. 2018, 55, 1–20. [Google Scholar] [CrossRef]
- Baker, M.J.; Trevisan, J.; Bassan, P.; Bhargava, R.; Butler, H.J.; Dorling, K.M.; Fielden, P.R.; Fogarty, S.W.; Fullwood, N.J.; Heys, K.A.; et al. Using Fourier transform IR spectroscopy to analyze biological materials. Nat. Protoc. 2014, 9, 1771–1791. [Google Scholar] [CrossRef] [Green Version]
- Hughes, C.; Clemens, G.; Bird, B.; Dawson, T.; Ashton, K.M.; Jenkinson, M.D.; Brodbelt, A.; Weida, M.; Fotheringham, E.; Barre, M.; et al. Introducing Discrete Frequency Infrared Technology for High-Throughput Biofluid Screening. Sci. Rep. 2016, 6, 20173. [Google Scholar] [CrossRef] [Green Version]
- Hughes, C.; Baker, M.J. Can mid-infrared biomedical spectroscopy of cells, fluids and tissue aid improvements in cancer survival? A patient paradigm. Analyst 2016, 141, 467–475. [Google Scholar] [CrossRef] [PubMed]
- Gregório, I.; Zapata, F.; García-Ruiz, C. Analysis of human bodily fluids on superabsorbent pads by ATR-FTIR. Talanta 2017, 162, 634–640. [Google Scholar] [CrossRef] [PubMed]
- Travo, A.; Paya, C.; Déléris, G.; Colin, J.; Mortemousque, B.; Forfar, I. Potential of FTIR spectroscopy for analysis of tears for diagnosis purposes. Anal. Bioanal. Chem. 2014, 406, 2367–2376. [Google Scholar] [CrossRef] [PubMed]
- Takamura, A.; Watanabe, K.; Akutsu, T.; Ozawa, T. Soft and Robust Identification of Body Fluid Using Fourier Transform Infrared Spectroscopy and Chemometric Strategies for Forensic Analysis. Sci. Rep. 2018, 8, 8459. [Google Scholar] [CrossRef] [PubMed] [Green Version]
- Lechowicz, L.; Chrapek, M.; Gaweda, J.; Urbaniak, M.; Konieczna, I. Use of Fourier-transform infrared spectroscopy in the diagnosis of rheumatoid arthritis: A pilot study. Mol. Biol. Rep. 2016, 43, 1321–1326. [Google Scholar] [CrossRef] [PubMed] [Green Version]
- El Khoury, Y.; Collongues, N.; De Sèze, J.; Gulsari, V.; Patte-Mensah, C.; Marcou, G.; Varnek, A.; Mensah-Nyagan, A.G.; Hellwig, P. Serum-based differentiation between multiple sclerosis and amyotrophic lateral sclerosis by Random Forest classification of FTIR spectra. Analyst 2019, 144, 4647–4652. [Google Scholar] [CrossRef] [PubMed]
- Ildiz, G.O.; Arslan, M.; Unsalan, O.; Araujo-Andrade, C.; Kurt, E.; Karatepe, H.T.; Yilmaz, A.; Yalcinkaya, O.B.; Herken, H. FT-IR spectroscopy and multivariate analysis as an auxiliary tool for diagnosis of mental disorders: Bipolar and schizophrenia cases. Spectrochim. Acta Part A Mol. Biomol. Spectrosc. 2016, 152, 551–556. [Google Scholar] [CrossRef]
- Lopes, J.; Correia, M.; Martins, I.; Henriques, A.G.; Delgadillo, I.; da Cruz e Silva, O.; Nunes, A. FTIR and Raman Spectroscopy Applied to Dementia Diagnosis Through Analysis of Biological Fluids. J. Alzheimer’s Dis. 2016, 52, 801–812. [Google Scholar] [CrossRef]
- WHO. Coronavirus Disease (COVID-19): Vaccines; WHO: Geneva, Switzerland, 2022.
- Guder, W.G.; Narayanan, S.; Wisser, H.; Zawta, B. Samples: From the Patient to the Laboratory: The Impact of Preanalytical Variables on the Quality of Laboratory Results; John Wiley & Sons: New York, NY, USA, 2008. [Google Scholar]
- World Health Organization. Diagnostic Imaging and Laboratory Technology. In Use of Anticoagulants in Diagnostic Laboratory Investigations; This is the 2nd Revision of Document WHO/DIL/LAB/9; World Health Organization: Geneva, Switzerland, 2002. [Google Scholar]
- Kronenberg, F.; Trenkwalder, E.; Kronenberg, M.F.; König, P.; Utermann, G.; Dieplinger, H. Influence of hematocrit on the measurement of lipoproteins demonstrated by the example of lipoprotein(a). Kidney Int. 1998, 54, 1385–1389. [Google Scholar] [CrossRef] [Green Version]
- Lundblad, R.L. Considerations for the Use of Blood Plasma and Serum for Proteomic Analysis. Internet J. Genom. Proteom. 2005, 1, 1–8. [Google Scholar] [CrossRef]
- Benoy, I.; Salgado, R.; Colpaert, C.; Weytjens, R.; Vermeulen, P.B.; Dirix, L.Y. Serum Interleukin 6, Plasma VEGF, Serum VEGF, and VEGF Platelet Load in Breast Cancer Patients. Clin. Breast Cancer 2002, 2, 311–315. [Google Scholar] [CrossRef] [PubMed]
- Mannello, F. Serum or Plasma Samples? Arterioscler. Thromb. Vasc. Biol. 2008, 28, 611–614. [Google Scholar] [CrossRef] [PubMed] [Green Version]
- Liu, F.; Lee, S.A.; Riordan, S.M.; Zhang, L.; Zhu, L. Global Studies of Using Fecal Biomarkers in Predicting Relapse in Inflammatory Bowel Disease. Front. Med. 2020, 7, 580803. [Google Scholar] [CrossRef] [PubMed]
- Aydin, S.; Tokaç, D.; Başaran, N.; Başaran, A.A. Effect of epigallocatechin gallate on oxidative DNA damage in human lymphocytes. Turk. J. Pharm. Sci. 2015, 12, 19–28. [Google Scholar]
- Singh, S.; Li, S.S.-L. Epigenetic Effects of Environmental Chemicals Bisphenol A and Phthalates. Int. J. Mol. Sci. 2012, 13, 10143–10153. [Google Scholar] [CrossRef]
- Chakrawarti, L.; Agrawal, R.; Dang, S.; Gupta, S.; Gabrani, R. Therapeutic effects of EGCG: A patent review. Expert Opin. Ther. Pat. 2016, 26, 907–916. [Google Scholar] [CrossRef]
- Araújo, R.; Ramalhete, L.; da Paz, H.; Ribeiro, E.; Calado, C.R.C. A Simple, Label-Free, and High-Throughput Method to Evaluate the Epigallocatechin-3-Gallate Impact in Plasma Molecular Profile. High-Throughput 2020, 9, 9. [Google Scholar] [CrossRef] [Green Version]
- Sales, K.C.; Rosa, F.; Cunha, B.R.; Sampaio, P.N.; Lopes, M.B.; Calado, C.R.C. Metabolic profiling of recombinant Escherichia coli cultivations based on high-throughput FT-MIR spectroscopic analysis. Biotechnol. Prog. 2017, 33, 285–298. [Google Scholar] [CrossRef]
- Lum, G.; Gambino, S.R. A Comparison of Serum versus Heparinized Plasma for Routine Chemistry Tests. Am. J. Clin. Pathol. 1974, 61, 108–113. [Google Scholar] [CrossRef]
- Liu, L.; Aa, J.; Wang, G.; Yan, B.; Zhang, Y.; Wang, X.; Zhao, C.; Cao, B.; Shi, J.; Li, M.; et al. Differences in metabolite profile between blood plasma and serum. Anal. Biochem. 2010, 406, 105–112. [Google Scholar] [CrossRef]
- Usoltsev, D.; Sitnikova, V.; Kajava, A.; Uspenskaya, M. Systematic FTIR Spectroscopy Study of the Secondary Structure Changes in Human Serum Albumin under Various Denaturation Conditions. Biomolecules 2019, 9, 359. [Google Scholar] [CrossRef] [Green Version]
- Ayache, S.; Panelli, M.C.; Byrne, K.M.; Slezak, S.; Leitman, S.F.; Marincola, F.M.; Stroncek, D.F. Comparison of proteomic profiles of serum, plasma, and modified media supplements used for cell culture and expansion. J. Transl. Med. 2006, 4, 40. [Google Scholar] [CrossRef] [PubMed]
- Ishikawa, M.; Maekawa, K.; Saito, K.; Senoo, Y.; Urata, M.; Murayama, M.; Tajima, Y.; Kumagai, Y.; Saito, Y. Plasma and Serum Lipidomics of Healthy White Adults Shows Characteristic Profiles by Subjects’ Gender and Age. PLoS ONE 2014, 9, e91806. [Google Scholar] [CrossRef] [PubMed]


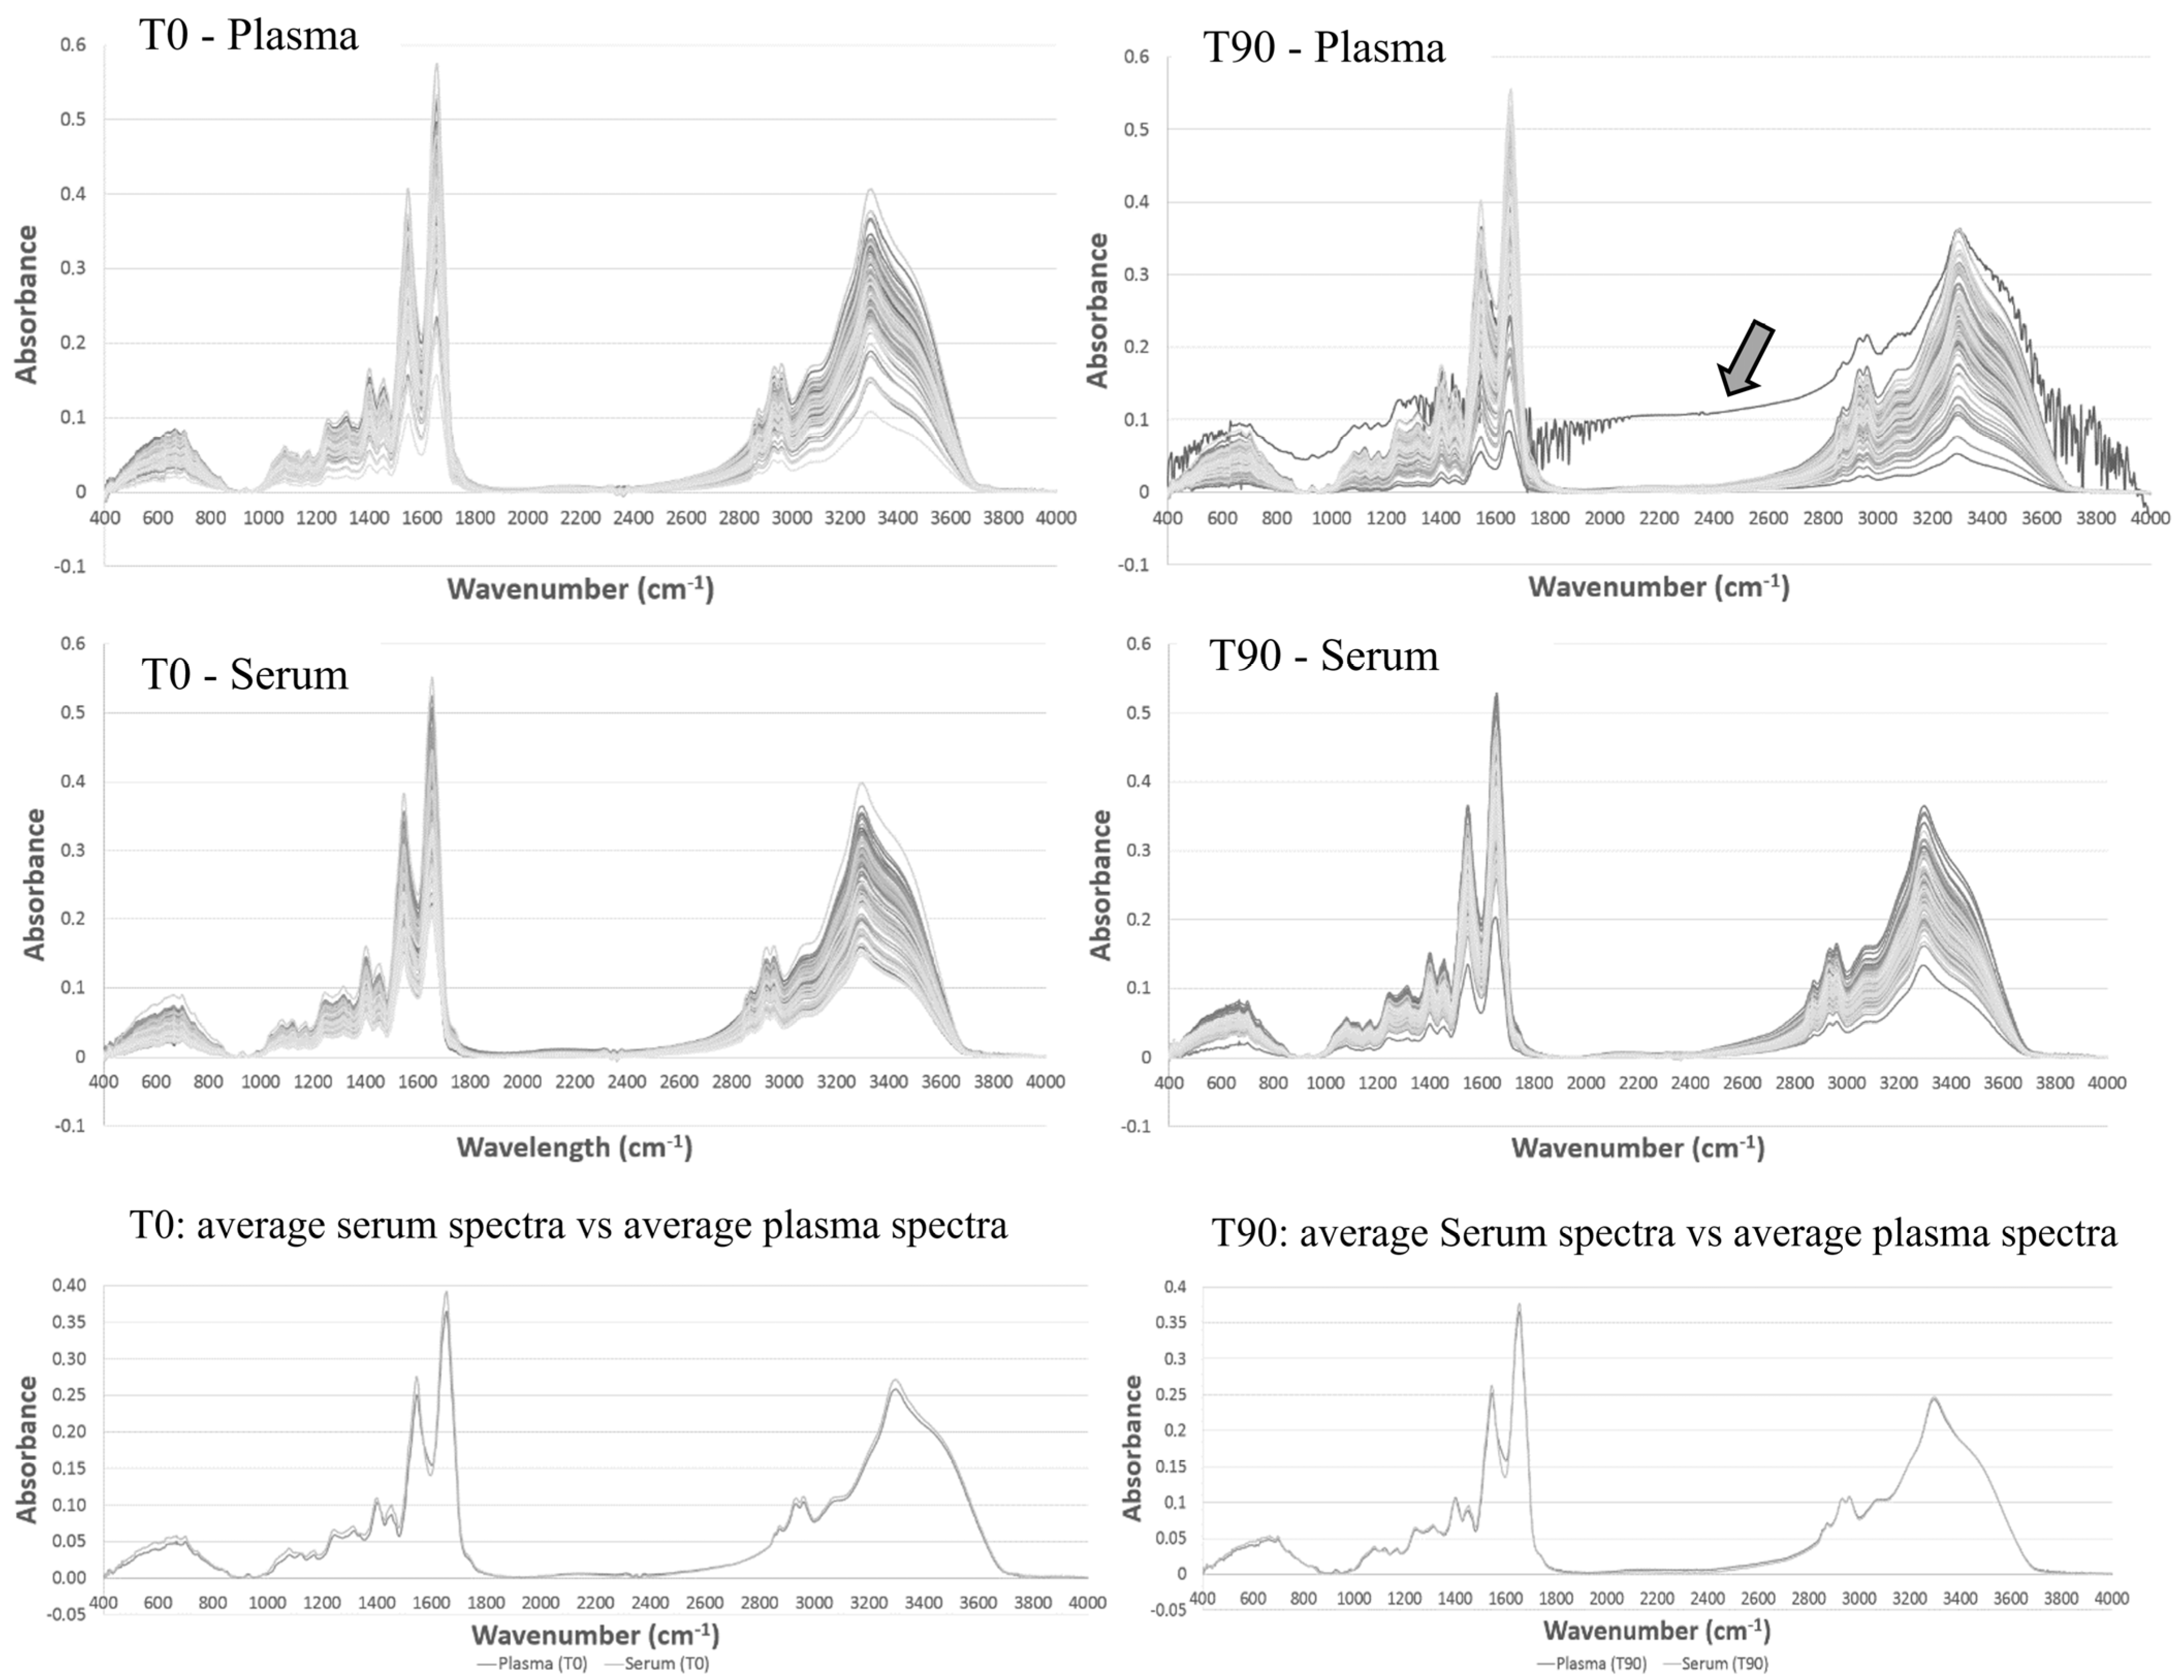
| Absorbance at 1656 cm−1 | Student’s t-Test | |||
|---|---|---|---|---|
| Mean | Standard Deviation | Analyzed Group | p-Value | |
| Plasma T0 | 0.36 | 0.07 | Plasma T0 vs. Plasma T90 | >0.1 |
| Plasma T90 | 0.36 | 0.07 | Serum T0 vs. Serum T90 | >0.1 |
| Serum T0 | 0.39 | 0.06 | Plasma (T0 + T90) vs. Serum (T0 + T90) | 0.06 |
| Serum T90 | 0.37 | 0.05 | Plasma T0 vs. Serum T0 | 0.04 |
| Plasma T90 vs. Serum T90 | >0.1 | |||
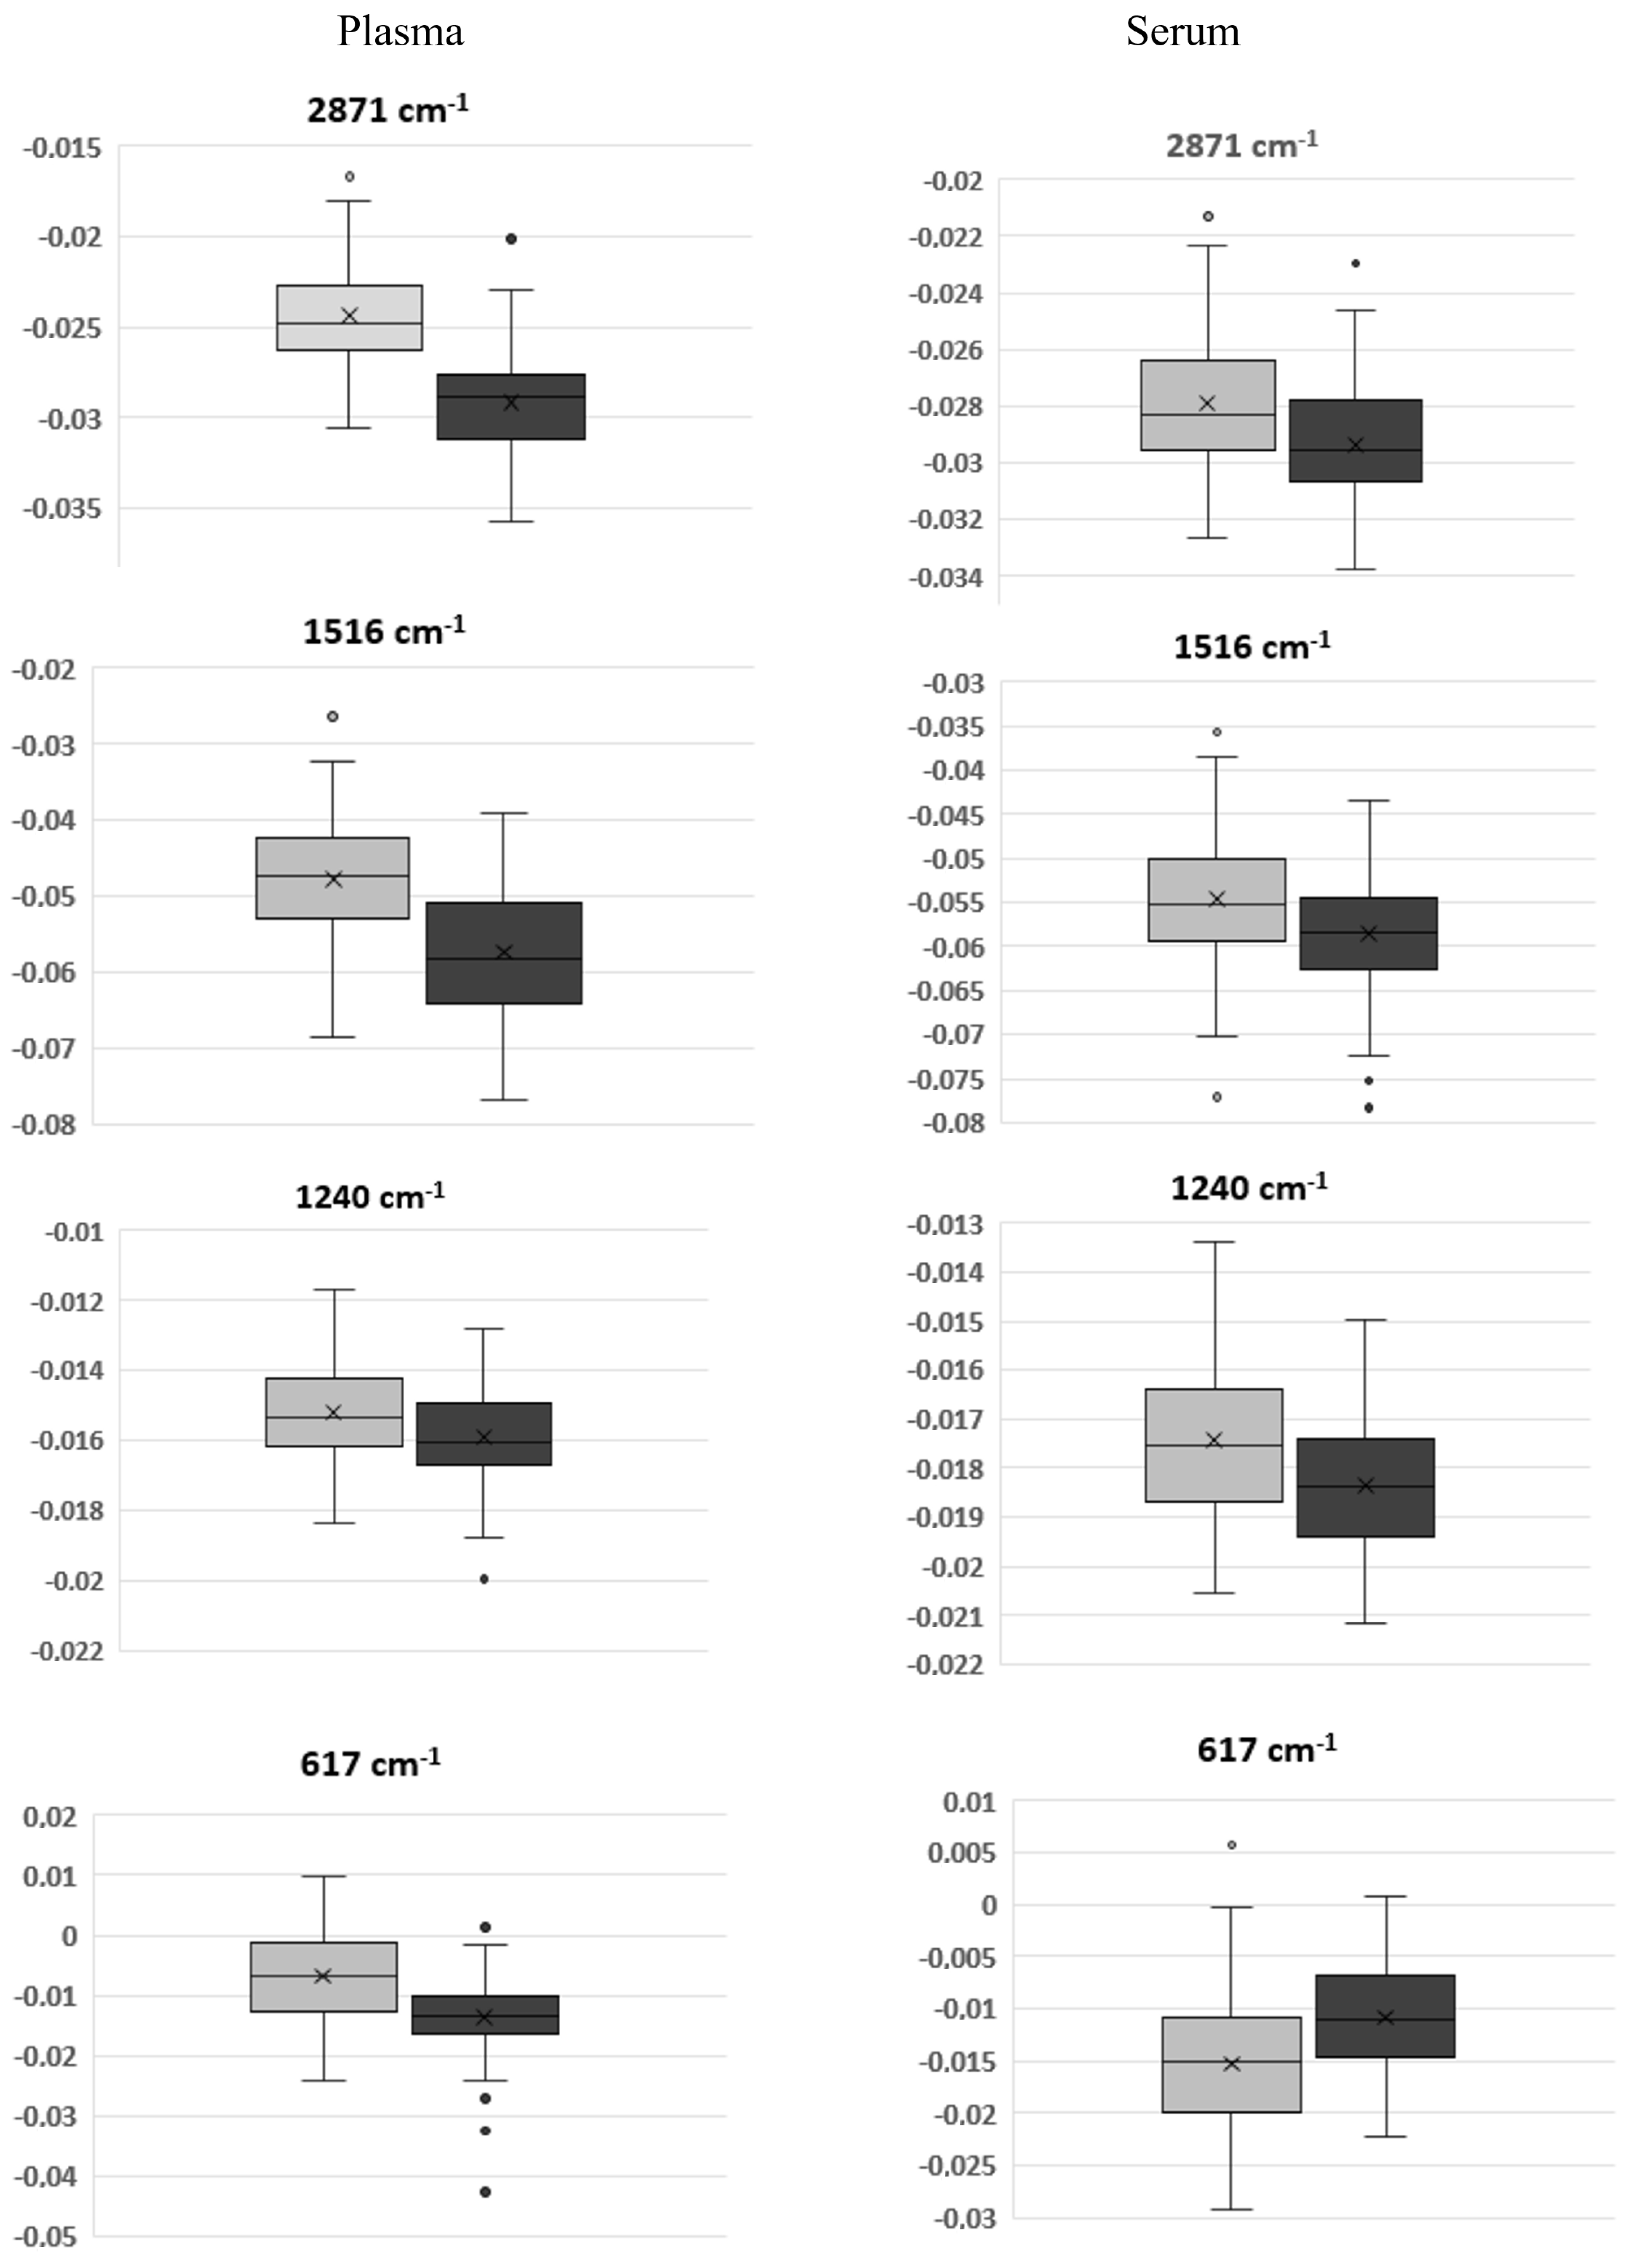
| Wavenumber (cm−1) | T0 | T90 | p-Value (T0 vs. T90) | ||
|---|---|---|---|---|---|
| Mean | Standard Deviation | Mean | Standard Deviation | ||
| 2872 | −2.50 × 10⁻² | 2.88 × 10⁻³ | −3.06 × 10⁻² | 2.53 × 10⁻³ | 7.14 × 10⁻²² |
| 1738 | 1.06 × 10⁻³ | 7.62 × 10⁻³ | −8.46 × 10⁻³ | 3.40 × 10⁻³ | 3.5 × 10⁻²⁰ |
| 1690 | −2.95 × 10⁻² | 6.79 × 10⁻³ | −3.59 × 10⁻² | 6.81 × 10⁻³ | 3.47 × 10⁻⁹ |
| 1656 | −1.55 × 10⁻¹ | 1.98 × 10⁻² | −1.49 × 10⁻¹ | 1.86 × 10⁻² | 3.39 × 10⁻² |
| 1639 | −8.74 × 10⁻² | 2.05 × 10⁻² | −1.00 × 10⁻¹ | 2.86 × 10⁻² | 7.66 × 10⁻⁴ |
| 1545 | −1.26 × 10⁻¹ | 1.21 × 10⁻² | −1.17 × 10⁻¹ | 1.37 × 10⁻² | 9.68 × 10⁻⁷ |
| 1515 | −4.22 × 10⁻² | 7.04 × 10⁻³ | −5.38 × 10⁻² | 7.42 × 10⁻³ | 4.97 × 10⁻¹⁷ |
| 1469 | −3.20 × 10⁻² | 4.63 × 10⁻³ | −3.56 × 10⁻² | 5.05 × 10⁻³ | 9.97 × 10⁻⁶ |
| 1455 | −4.71 × 10⁻² | 6.06 × 10⁻³ | −4.14 × 10⁻² | 7.70 × 10⁻³ | 2.13 × 10⁻⁷ |
| 1440 | −1.81 × 10⁻² | 3.98 × 10⁻³ | −2.17 × 10⁻² | 3.18 × 10⁻³ | 5.32 × 10⁻¹⁰ |
| 1400 | −4.54 × 10⁻² | 4.00 × 10⁻³ | −4.83 × 10⁻² | 3.34 × 10⁻³ | 1.03 × 10⁻⁷ |
| 1340 | −2.29 × 10⁻² | 8.48 × 10⁻³ | −1.04 × 10⁻² | 2.17 × 10⁻³ | 8.05 × 10⁻²⁶ |
| 1285 | −6.35 × 10⁻³ | 1.30 × 10⁻³ | −4.53 × 10⁻³ | 1.24 × 10⁻³ | 2.82 × 10⁻¹³ |
| 1240 | −1.52 × 10⁻² | 1.44 × 10⁻³ | −1.59 × 10⁻² | 1.35 × 10⁻³ | 2.58 × 10⁻³ |
| 1172 | −2.36 × 10⁻² | 2.75 × 10⁻³ | −2.18 × 10⁻² | 3.97 × 10⁻³ | 1.25 × 10⁻³ |
| 1085 | −9.93 × 10⁻³ | 2.34 × 10⁻³ | −1.36 × 10⁻² | 2.08 × 10⁻³ | 4.01 × 10⁻¹⁹ |
| 1031 | −1.13 × 10⁻² | 2.06 × 10⁻³ | −9.26 × 10⁻³ | 2.58 × 10⁻³ | 3.44 × 10⁻⁷ |
| 928 | −8.43 × 10⁻³ | 1.92 × 10⁻³ | −1.27 × 10⁻² | 2.01 × 10⁻³ | 4.02 × 10⁻²² |
| 854 | −1.36 × 10⁻² | 2.70 × 10⁻³ | −1.17 × 10⁻² | 2.85 × 10⁻³ | 6.51 × 10⁻⁵ |
| 745 | −1.28 × 10⁻² | 2.10 × 10⁻³ | −8.73 × 10⁻³ | 3.11 × 10⁻³ | 2.06 × 10⁻¹⁷ |
| 700 | −2.82 × 10⁻² | 2.53 × 10⁻³ | −2.64 × 10⁻² | 3.89 × 10⁻³ | 3.63 × 10−04 |
| 631 | −1.12 × 10⁻² | 4.57 × 10⁻³ | −2.03 × 10⁻² | 5.53 × 10⁻³ | 4.99 × 10⁻²¹ |
| 616 | −2.10 × 10⁻³ | 5.56 × 10⁻³ | −1.25 × 10⁻² | 6.55 × 10⁻³ | 1.53 × 10⁻²² |
| Wavenumber (cm−1) | T0 | T90 | p-Value (T0 vs. T90) | ||
|---|---|---|---|---|---|
| Mean | Standard Deviation | Mean | Standard Deviation | ||
| 2960 | −3.19 × 10⁻² | 2.27 × 10⁻³ | −3.49 × 10⁻² | 1.93 × 10⁻³ | 2.09 × 10⁻¹⁸ |
| 2926 | −2.54 × 10⁻² | 5.15 × 10⁻³ | −2.75 × 10⁻² | 5.08 × 10⁻³ | 1.41 × 10⁻⁶ |
| 2871 | −2.79 × 10⁻² | 2.45 × 10⁻³ | −2.94 × 10⁻² | 2.14 × 10⁻³ | 6.07 × 10⁻⁶ |
| 2853 | −2.87 × 10⁻² | 6.84 × 10⁻³ | −2.51 × 10⁻² | 7.30 × 10⁻³ | 3.25 × 10⁻¹⁰ |
| 1657 | −1.54 × 10⁻¹ | 1.67 × 10⁻² | −1.48 × 10⁻¹ | 1.54 × 10⁻² | 1.19 × 10⁻² |
| 1516 | −5.47 × 10⁻² | 7.50 × 10⁻³ | −5.86 × 10⁻² | 6.52 × 10⁻³ | 3.72 × 10⁻⁴ |
| 1455 | −4.69 × 10⁻² | 5.26 × 10⁻³ | −5.42 × 10⁻² | 4.07 × 10⁻³ | 1.95 × 10⁻¹⁷ |
| 1400 | −5.12 × 10⁻² | 3.39 × 10⁻³ | −5.02 × 10⁻² | 3.03 × 10⁻³ | 2.79 × 10⁻² |
| 1240 | −1.74 × 10⁻² | 1.59 × 10⁻³ | −1.84 × 10⁻² | 1.28 × 10⁻³ | 9.36 × 10⁻⁶ |
| 1081 | −1.79 × 10⁻² | 2.78 × 10⁻³ | −1.96 × 10⁻² | 1.93 × 10⁻³ | 7.47 × 10⁻⁷ |
| 1032 | −1.21 × 10⁻² | 2.23 × 10⁻³ | −1.29 × 10⁻² | 1.88 × 10⁻³ | 4.43 × 10⁻³ |
| 700 | −2.94 × 10⁻² | 2.98 × 10⁻³ | −3.28 × 10⁻² | 3.28 × 10⁻³ | 7.81 × 10⁻¹⁰ |
| 617 | −1.52 × 10⁻² | 6.76 × 10⁻³ | −1.08 × 10⁻² | 4.99 × 10⁻³ | 8.50 × 10⁻⁸ |
Publisher’s Note: MDPI stays neutral with regard to jurisdictional claims in published maps and institutional affiliations. |
© 2022 by the authors. Licensee MDPI, Basel, Switzerland. This article is an open access article distributed under the terms and conditions of the Creative Commons Attribution (CC BY) license (https://creativecommons.org/licenses/by/4.0/).
Share and Cite
Araújo, R.; Ramalhete, L.; Ribeiro, E.; Calado, C. Plasma versus Serum Analysis by FTIR Spectroscopy to Capture the Human Physiological State. BioTech 2022, 11, 56. https://doi.org/10.3390/biotech11040056
Araújo R, Ramalhete L, Ribeiro E, Calado C. Plasma versus Serum Analysis by FTIR Spectroscopy to Capture the Human Physiological State. BioTech. 2022; 11(4):56. https://doi.org/10.3390/biotech11040056
Chicago/Turabian StyleAraújo, Rúben, Luís Ramalhete, Edna Ribeiro, and Cecília Calado. 2022. "Plasma versus Serum Analysis by FTIR Spectroscopy to Capture the Human Physiological State" BioTech 11, no. 4: 56. https://doi.org/10.3390/biotech11040056