
Comparing Space Use and Fecal Glucocorticoid Concentrations during and after the COVID-19 Closure to Investigate Visitor Effects in Multiple Species

 , ,
, ,
Abstract
:1. Introduction
2. Materials and Methods
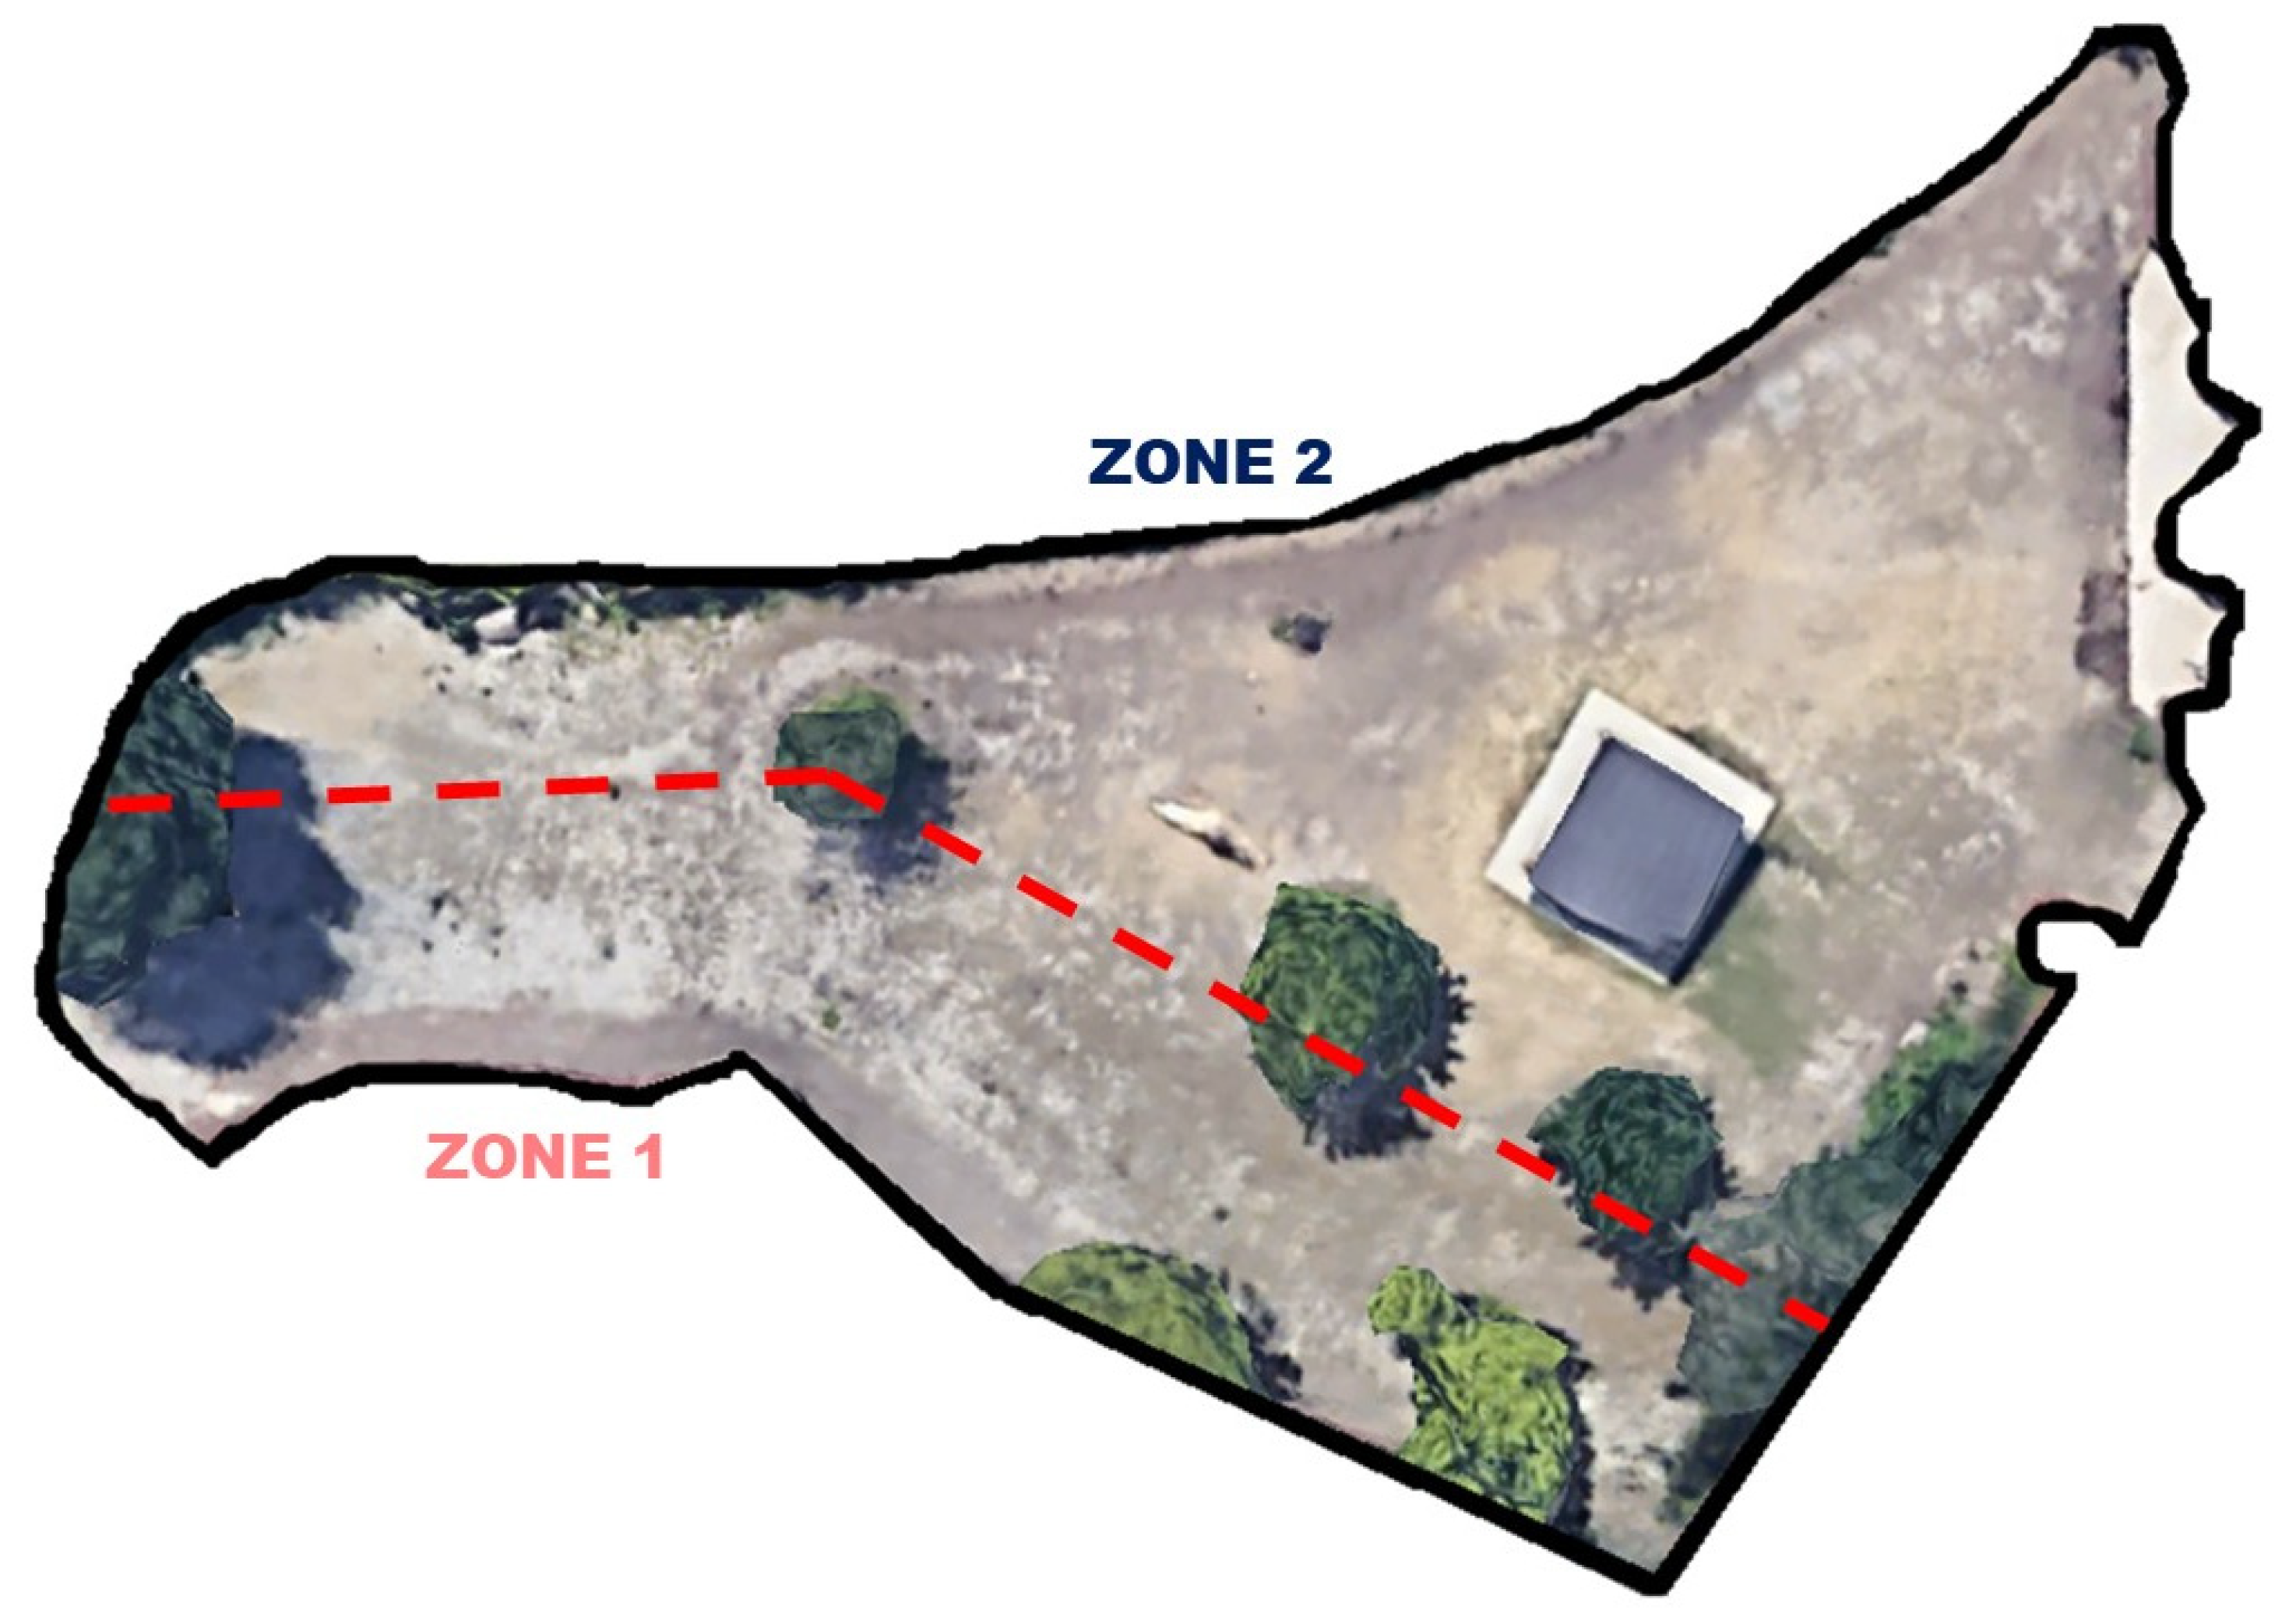
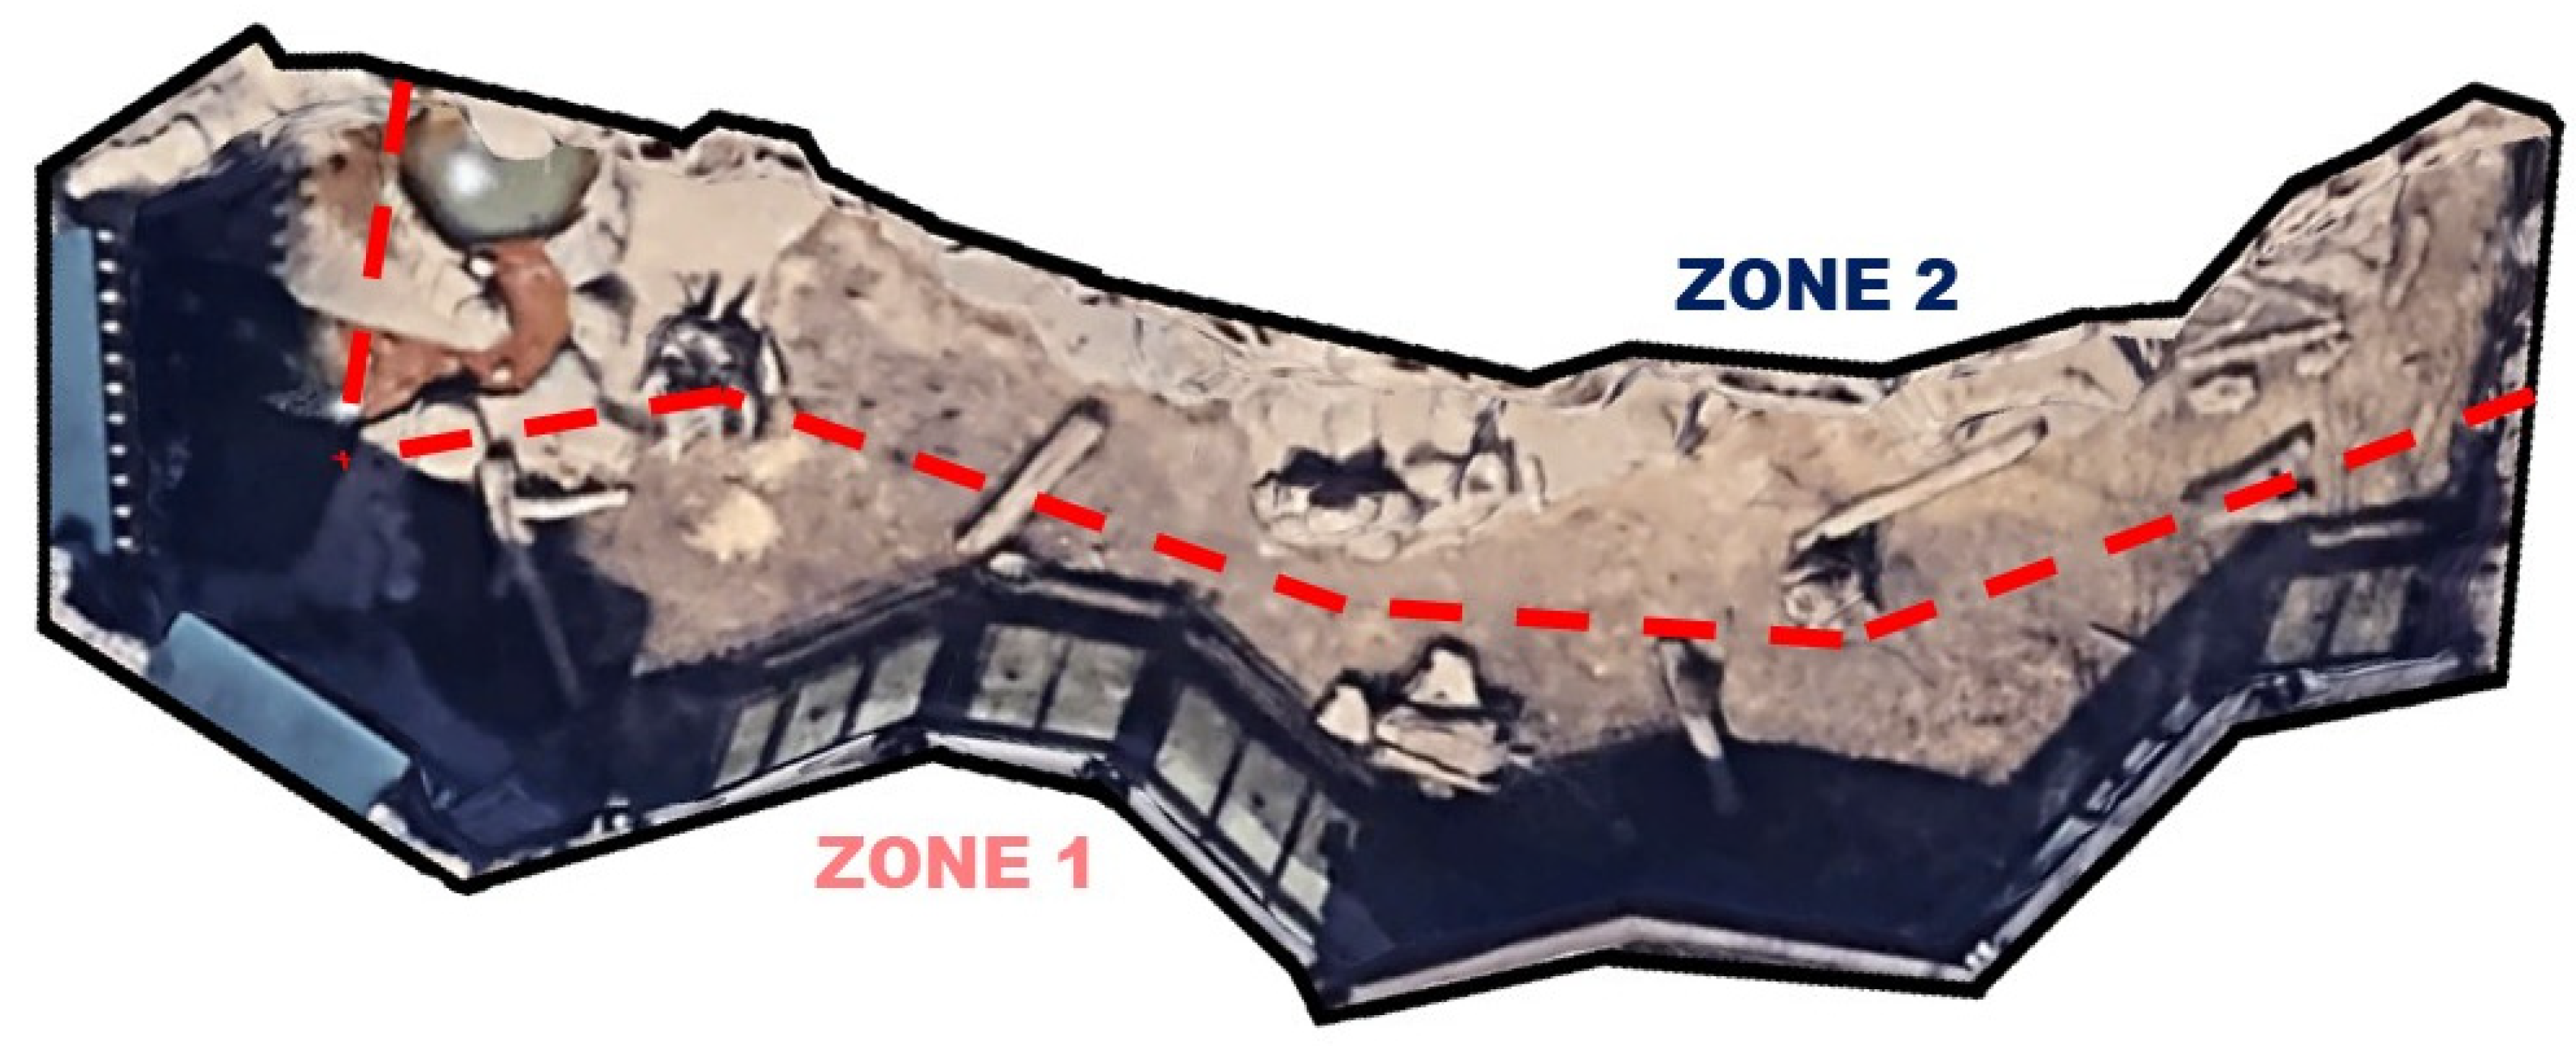
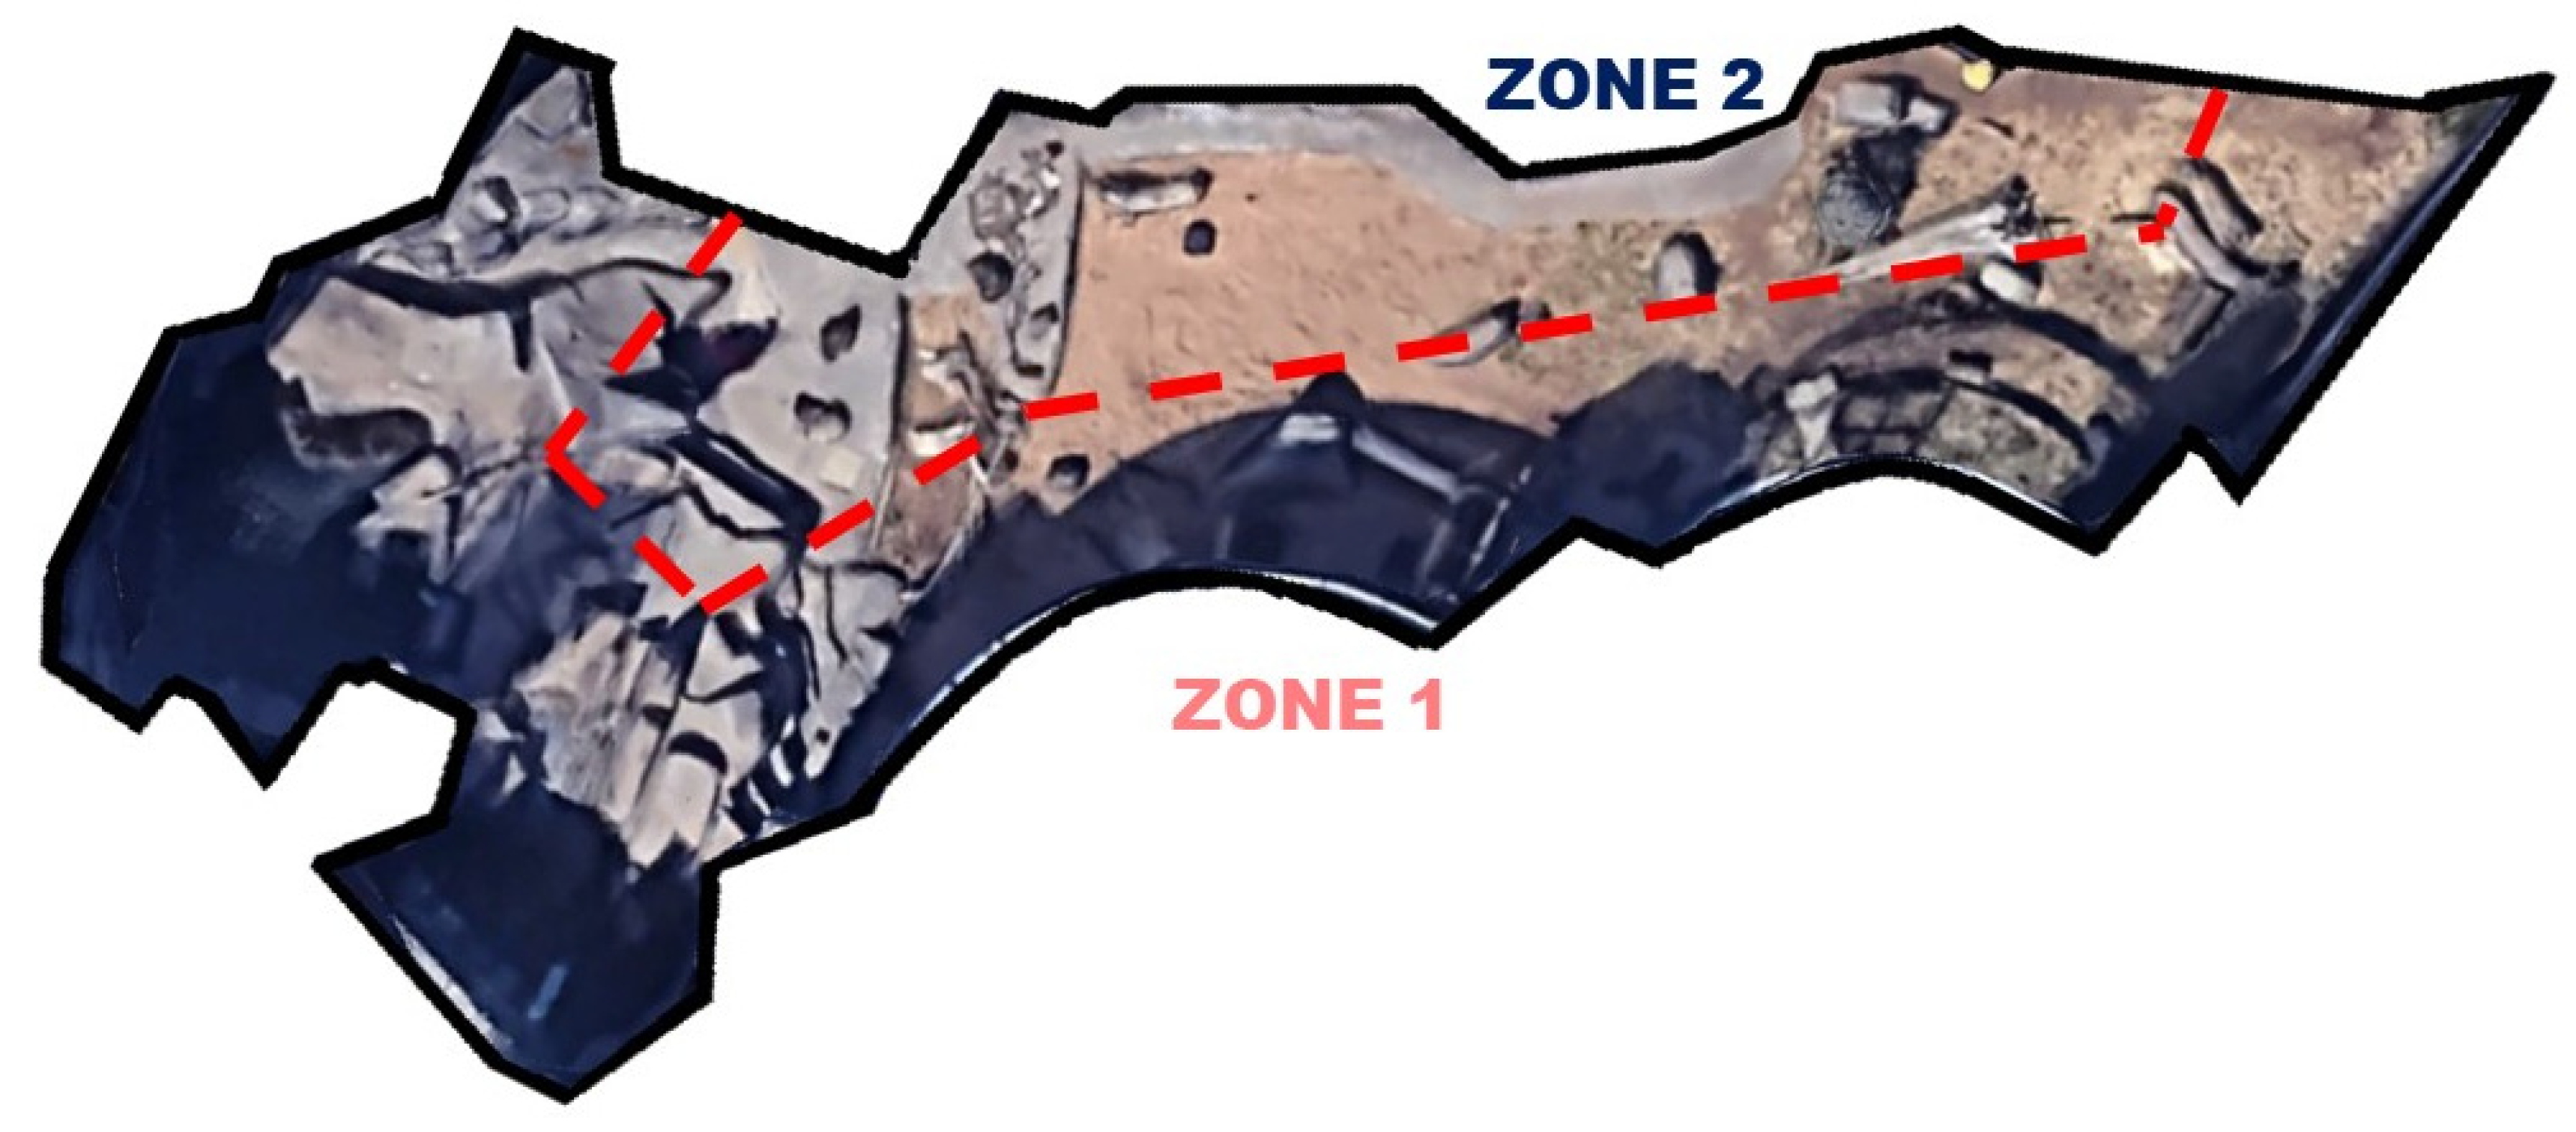
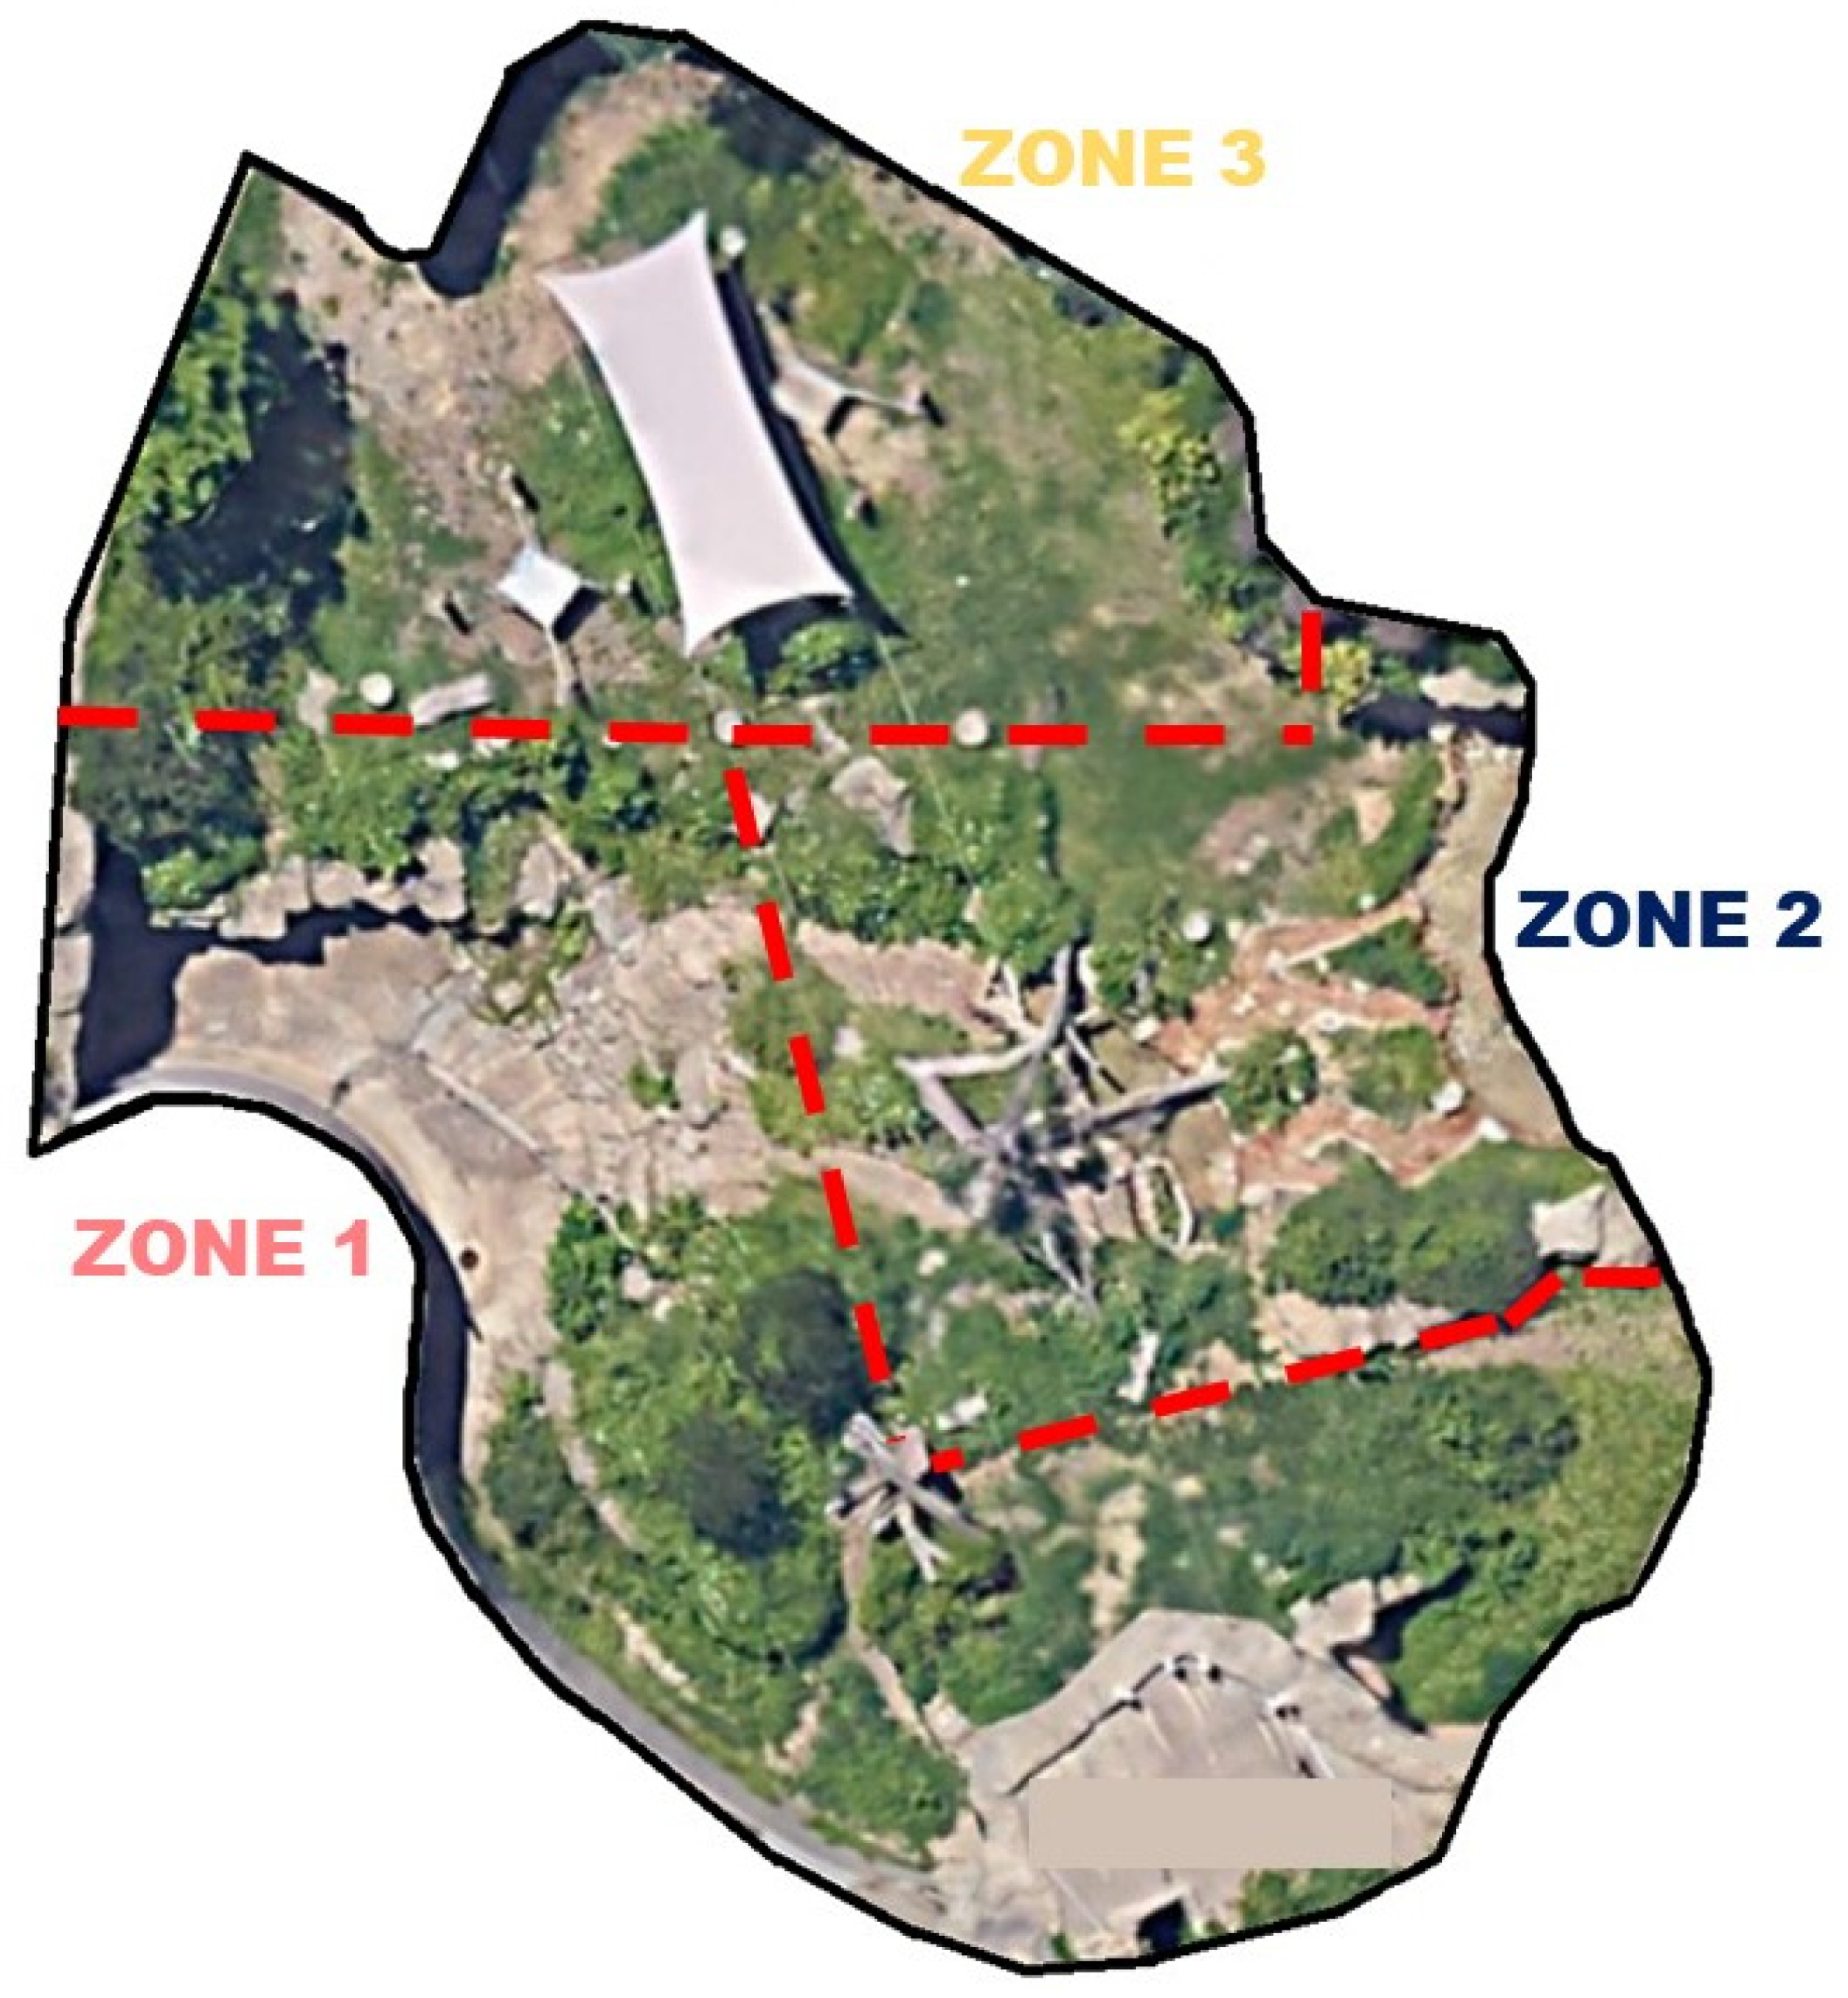
2.1. Subjects and Space Use Data
2.2. Physiological Data
2.3. Quantitative Analyses
3. Results
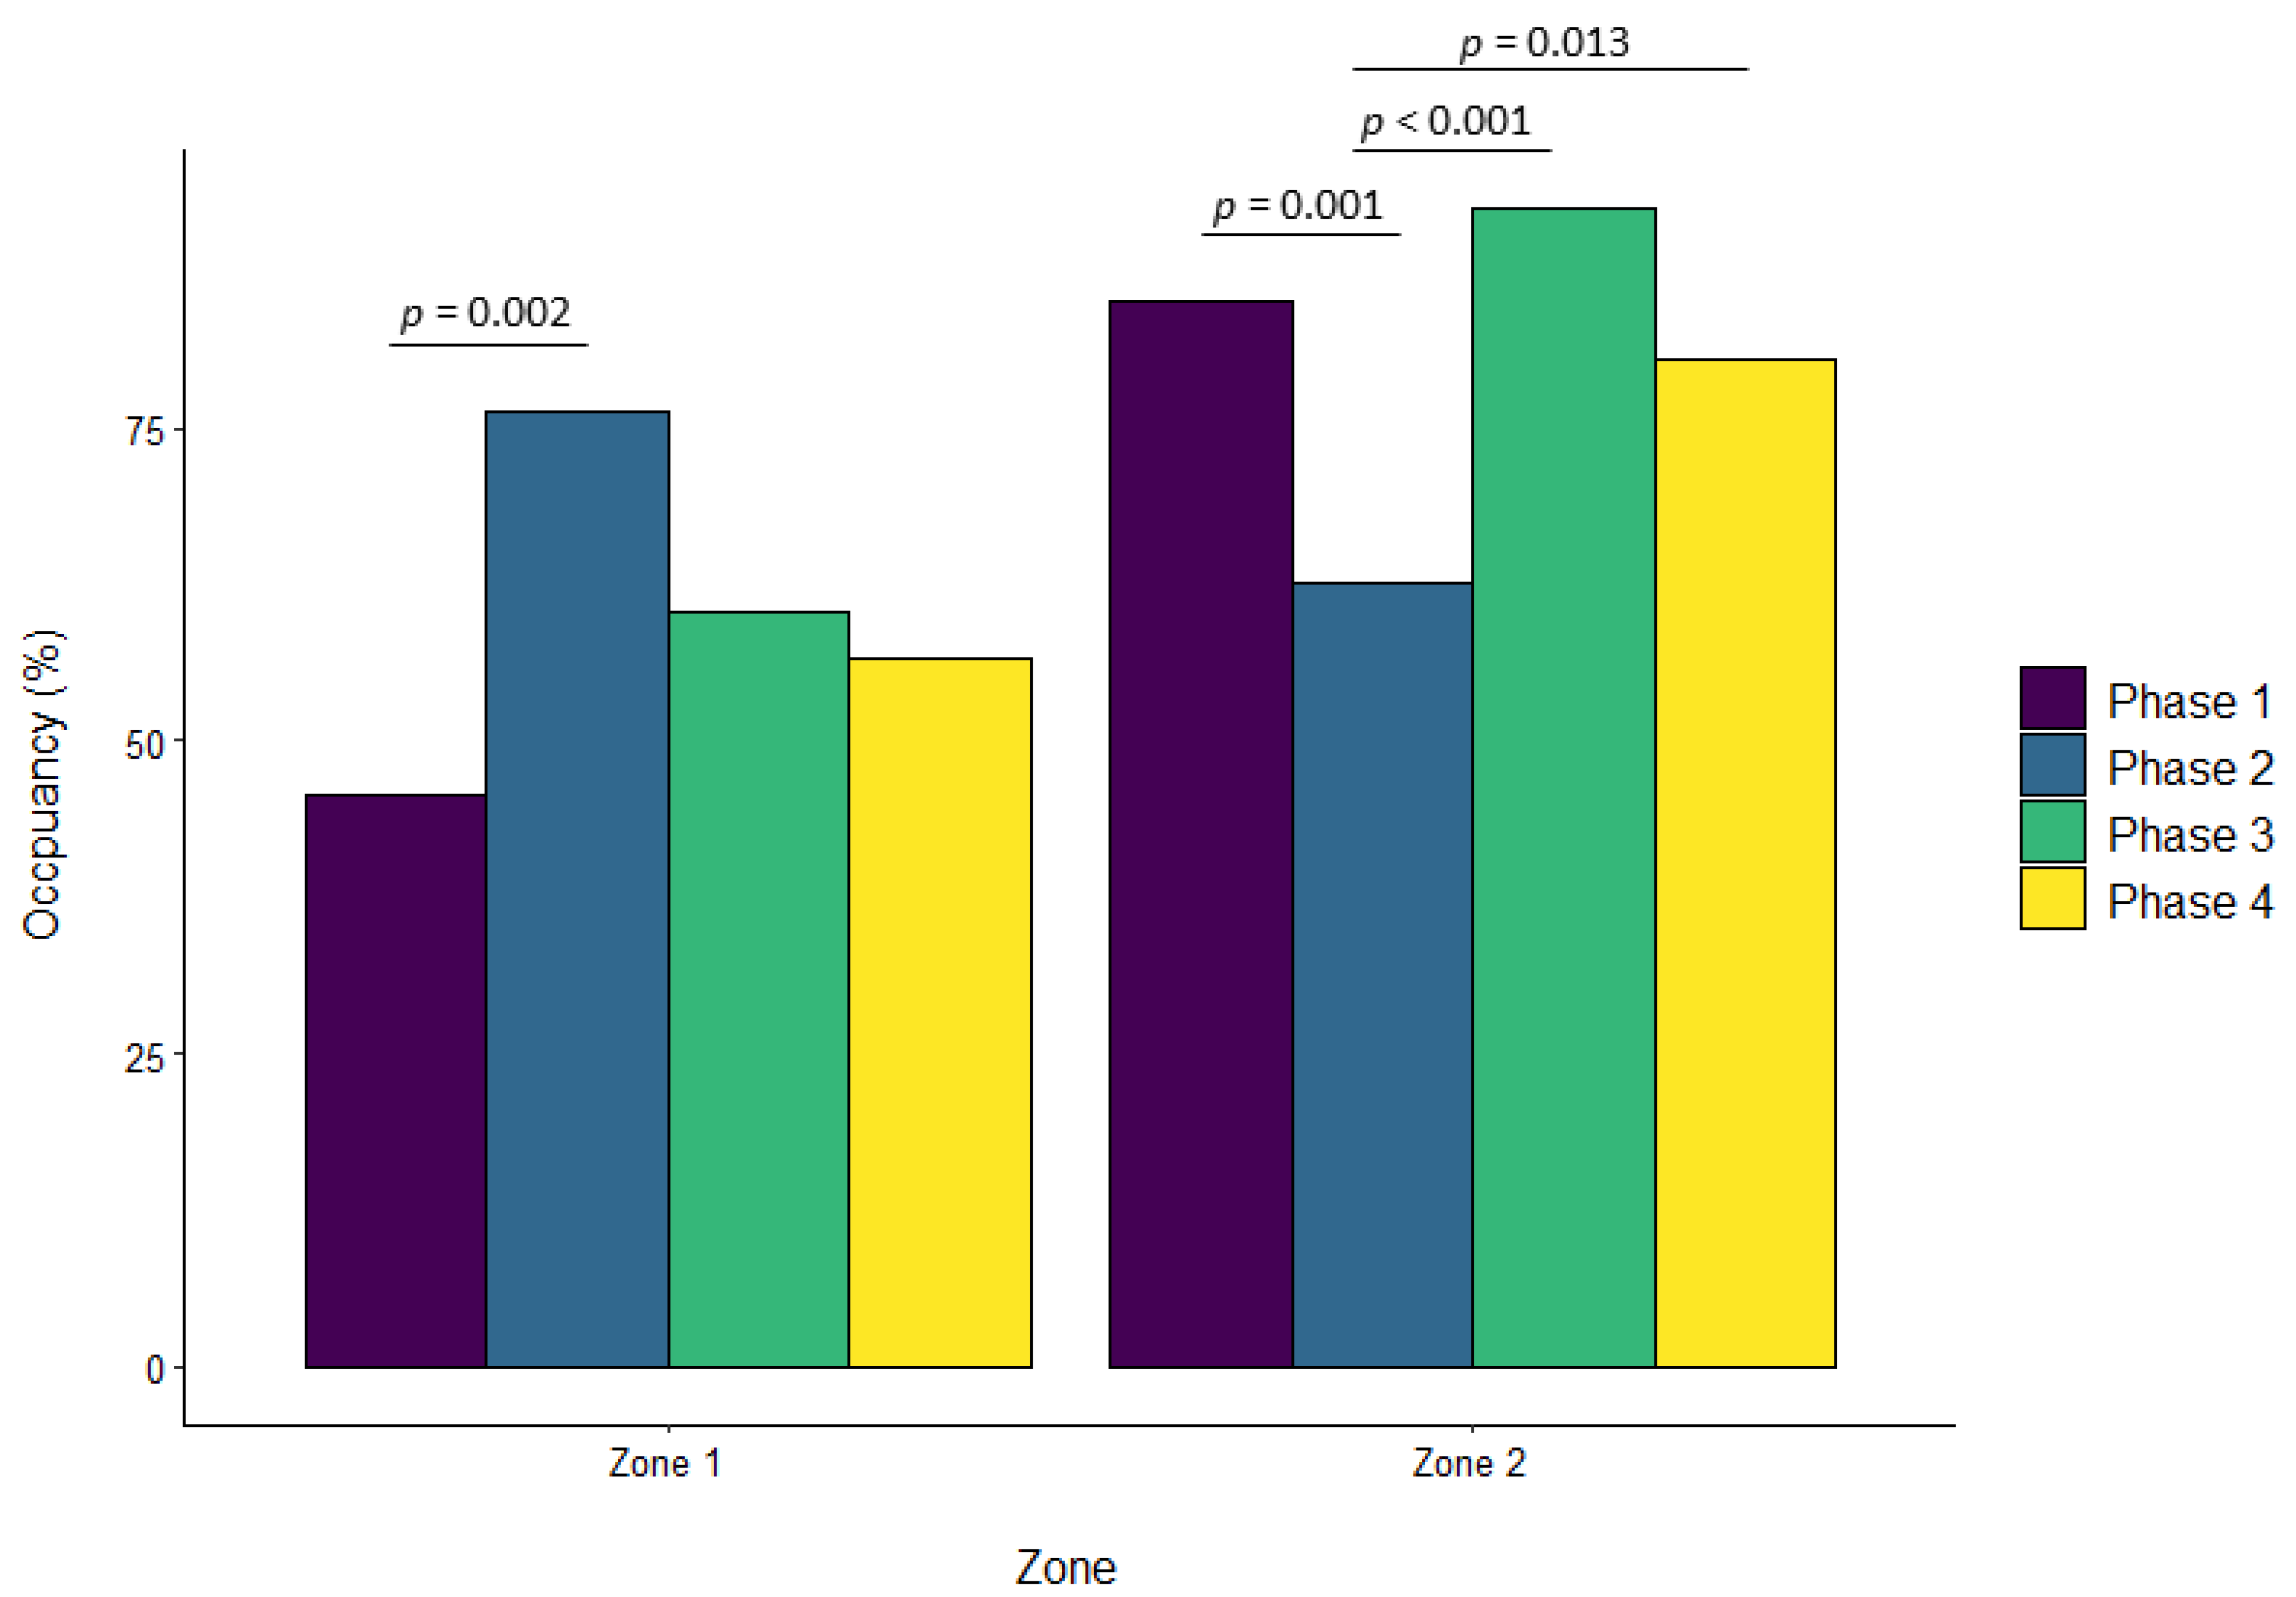
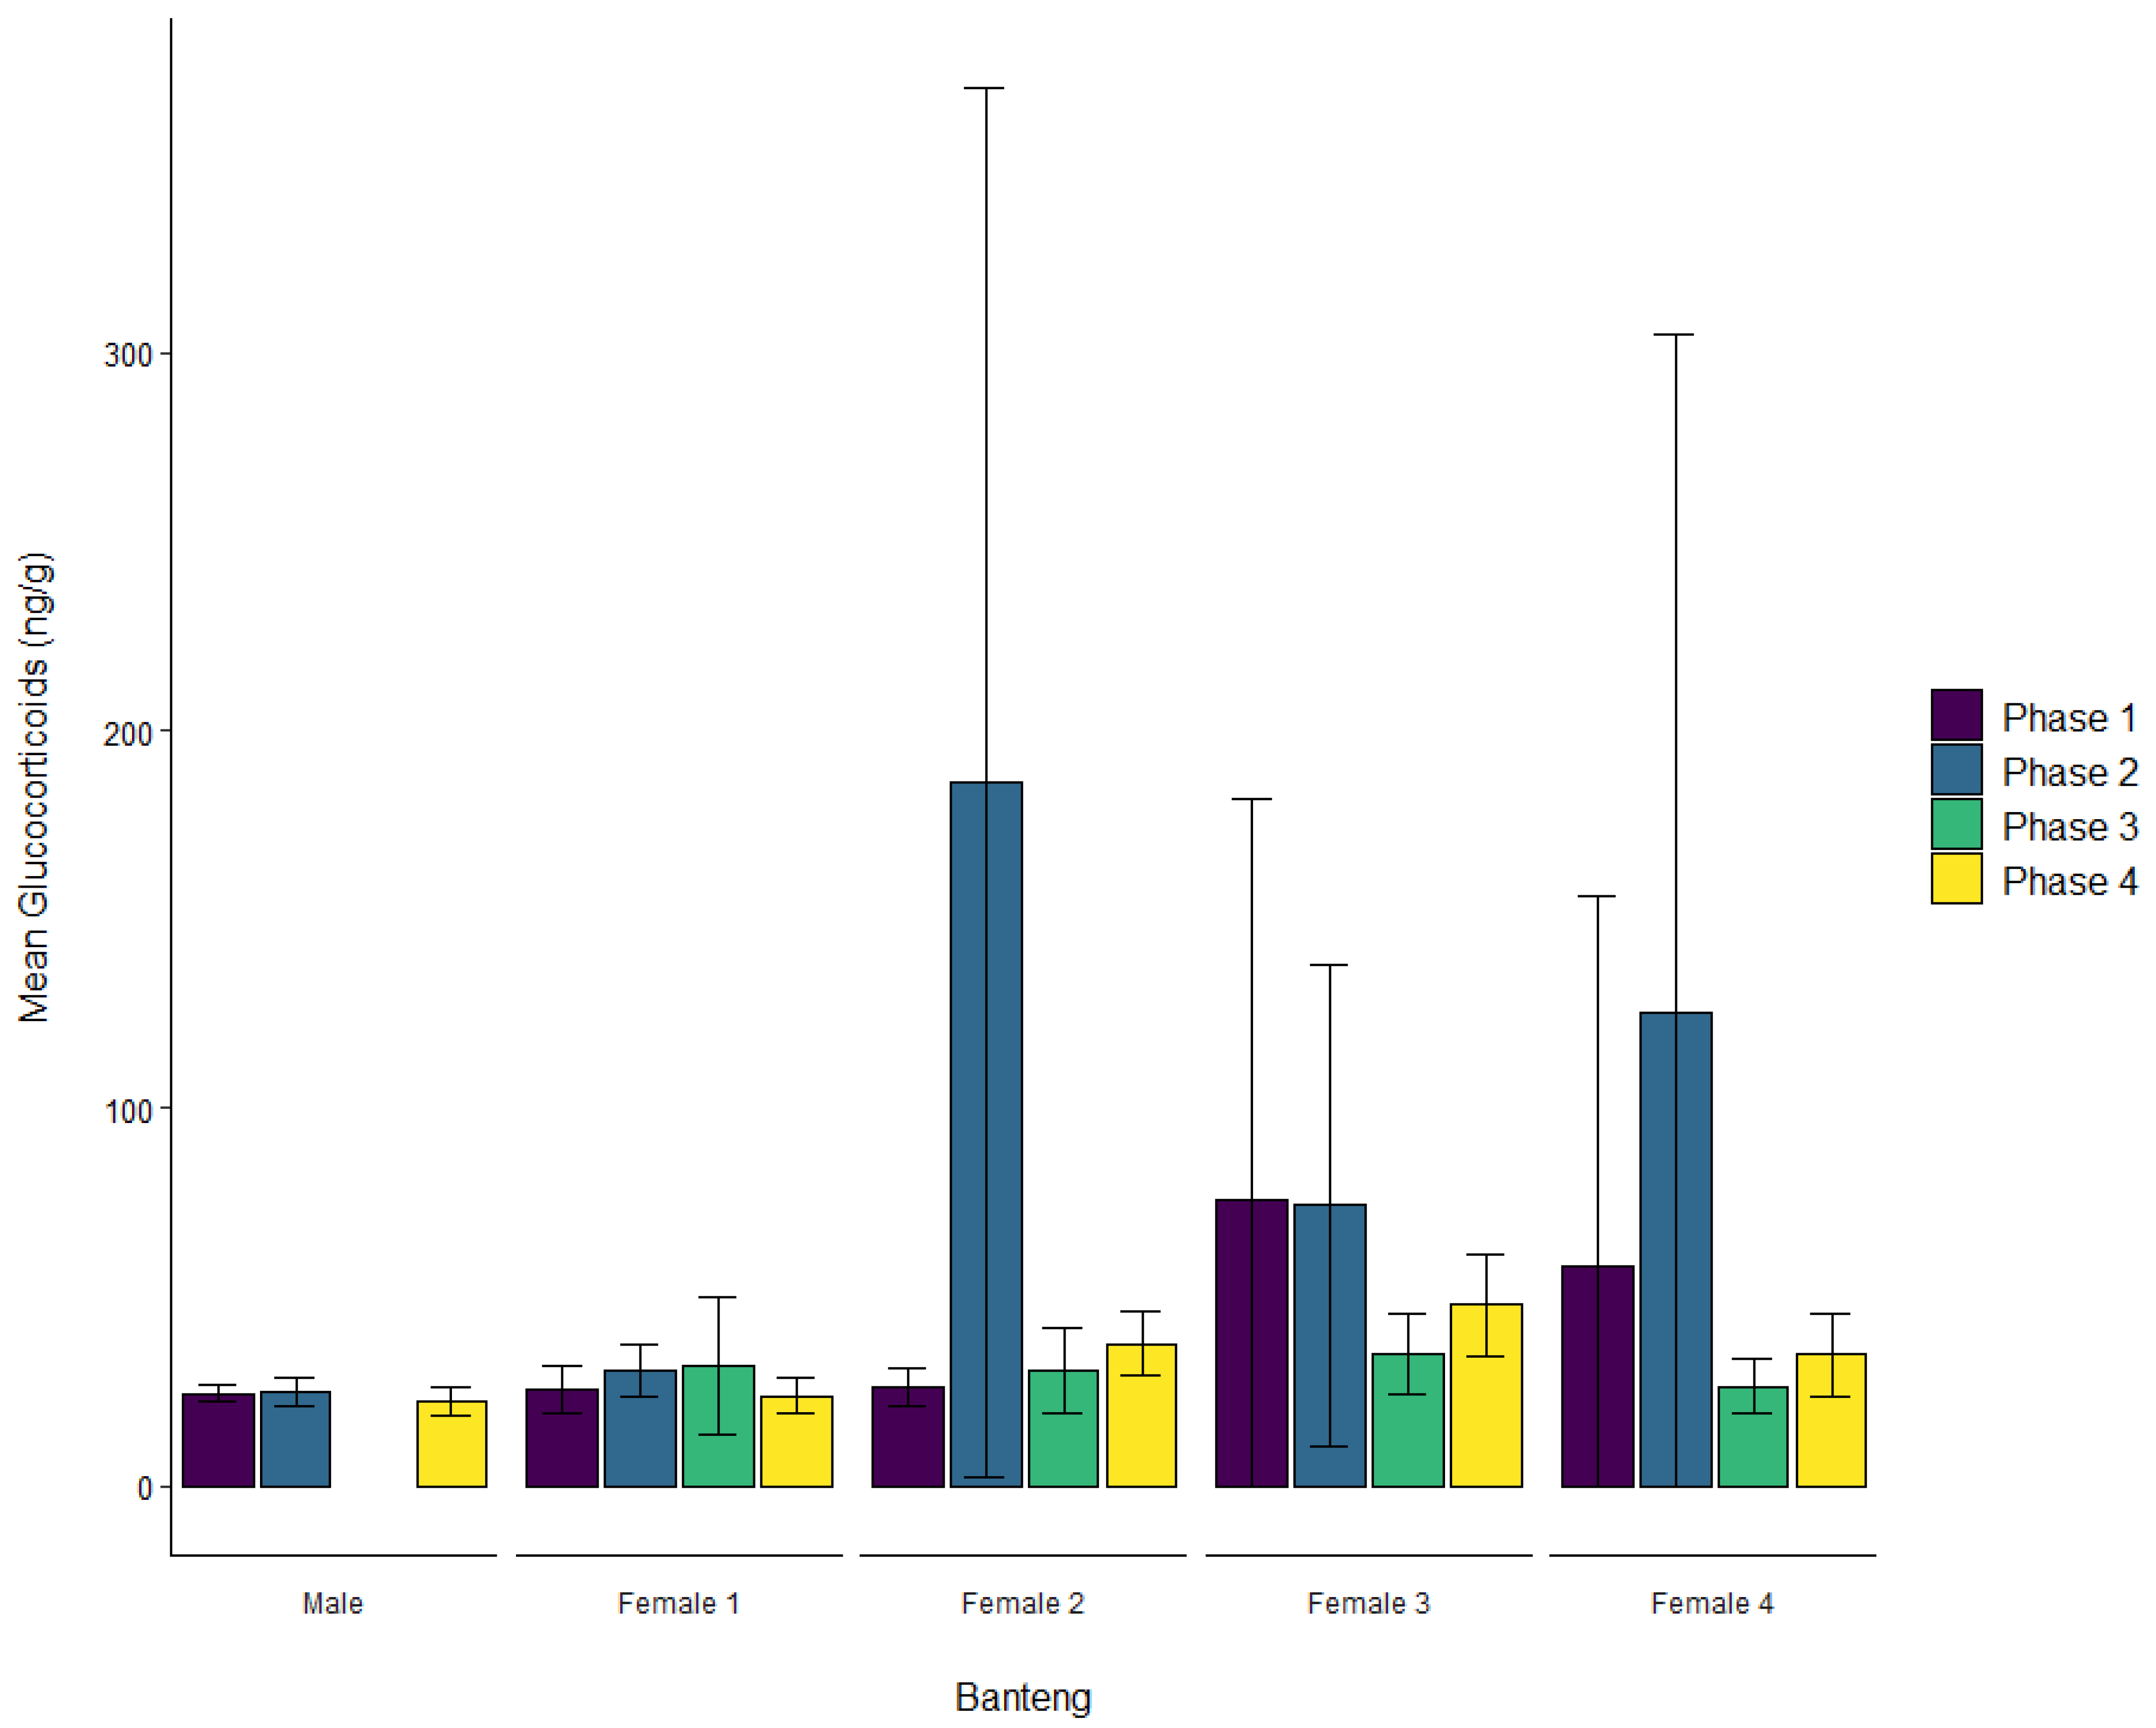
3.1. Banteng
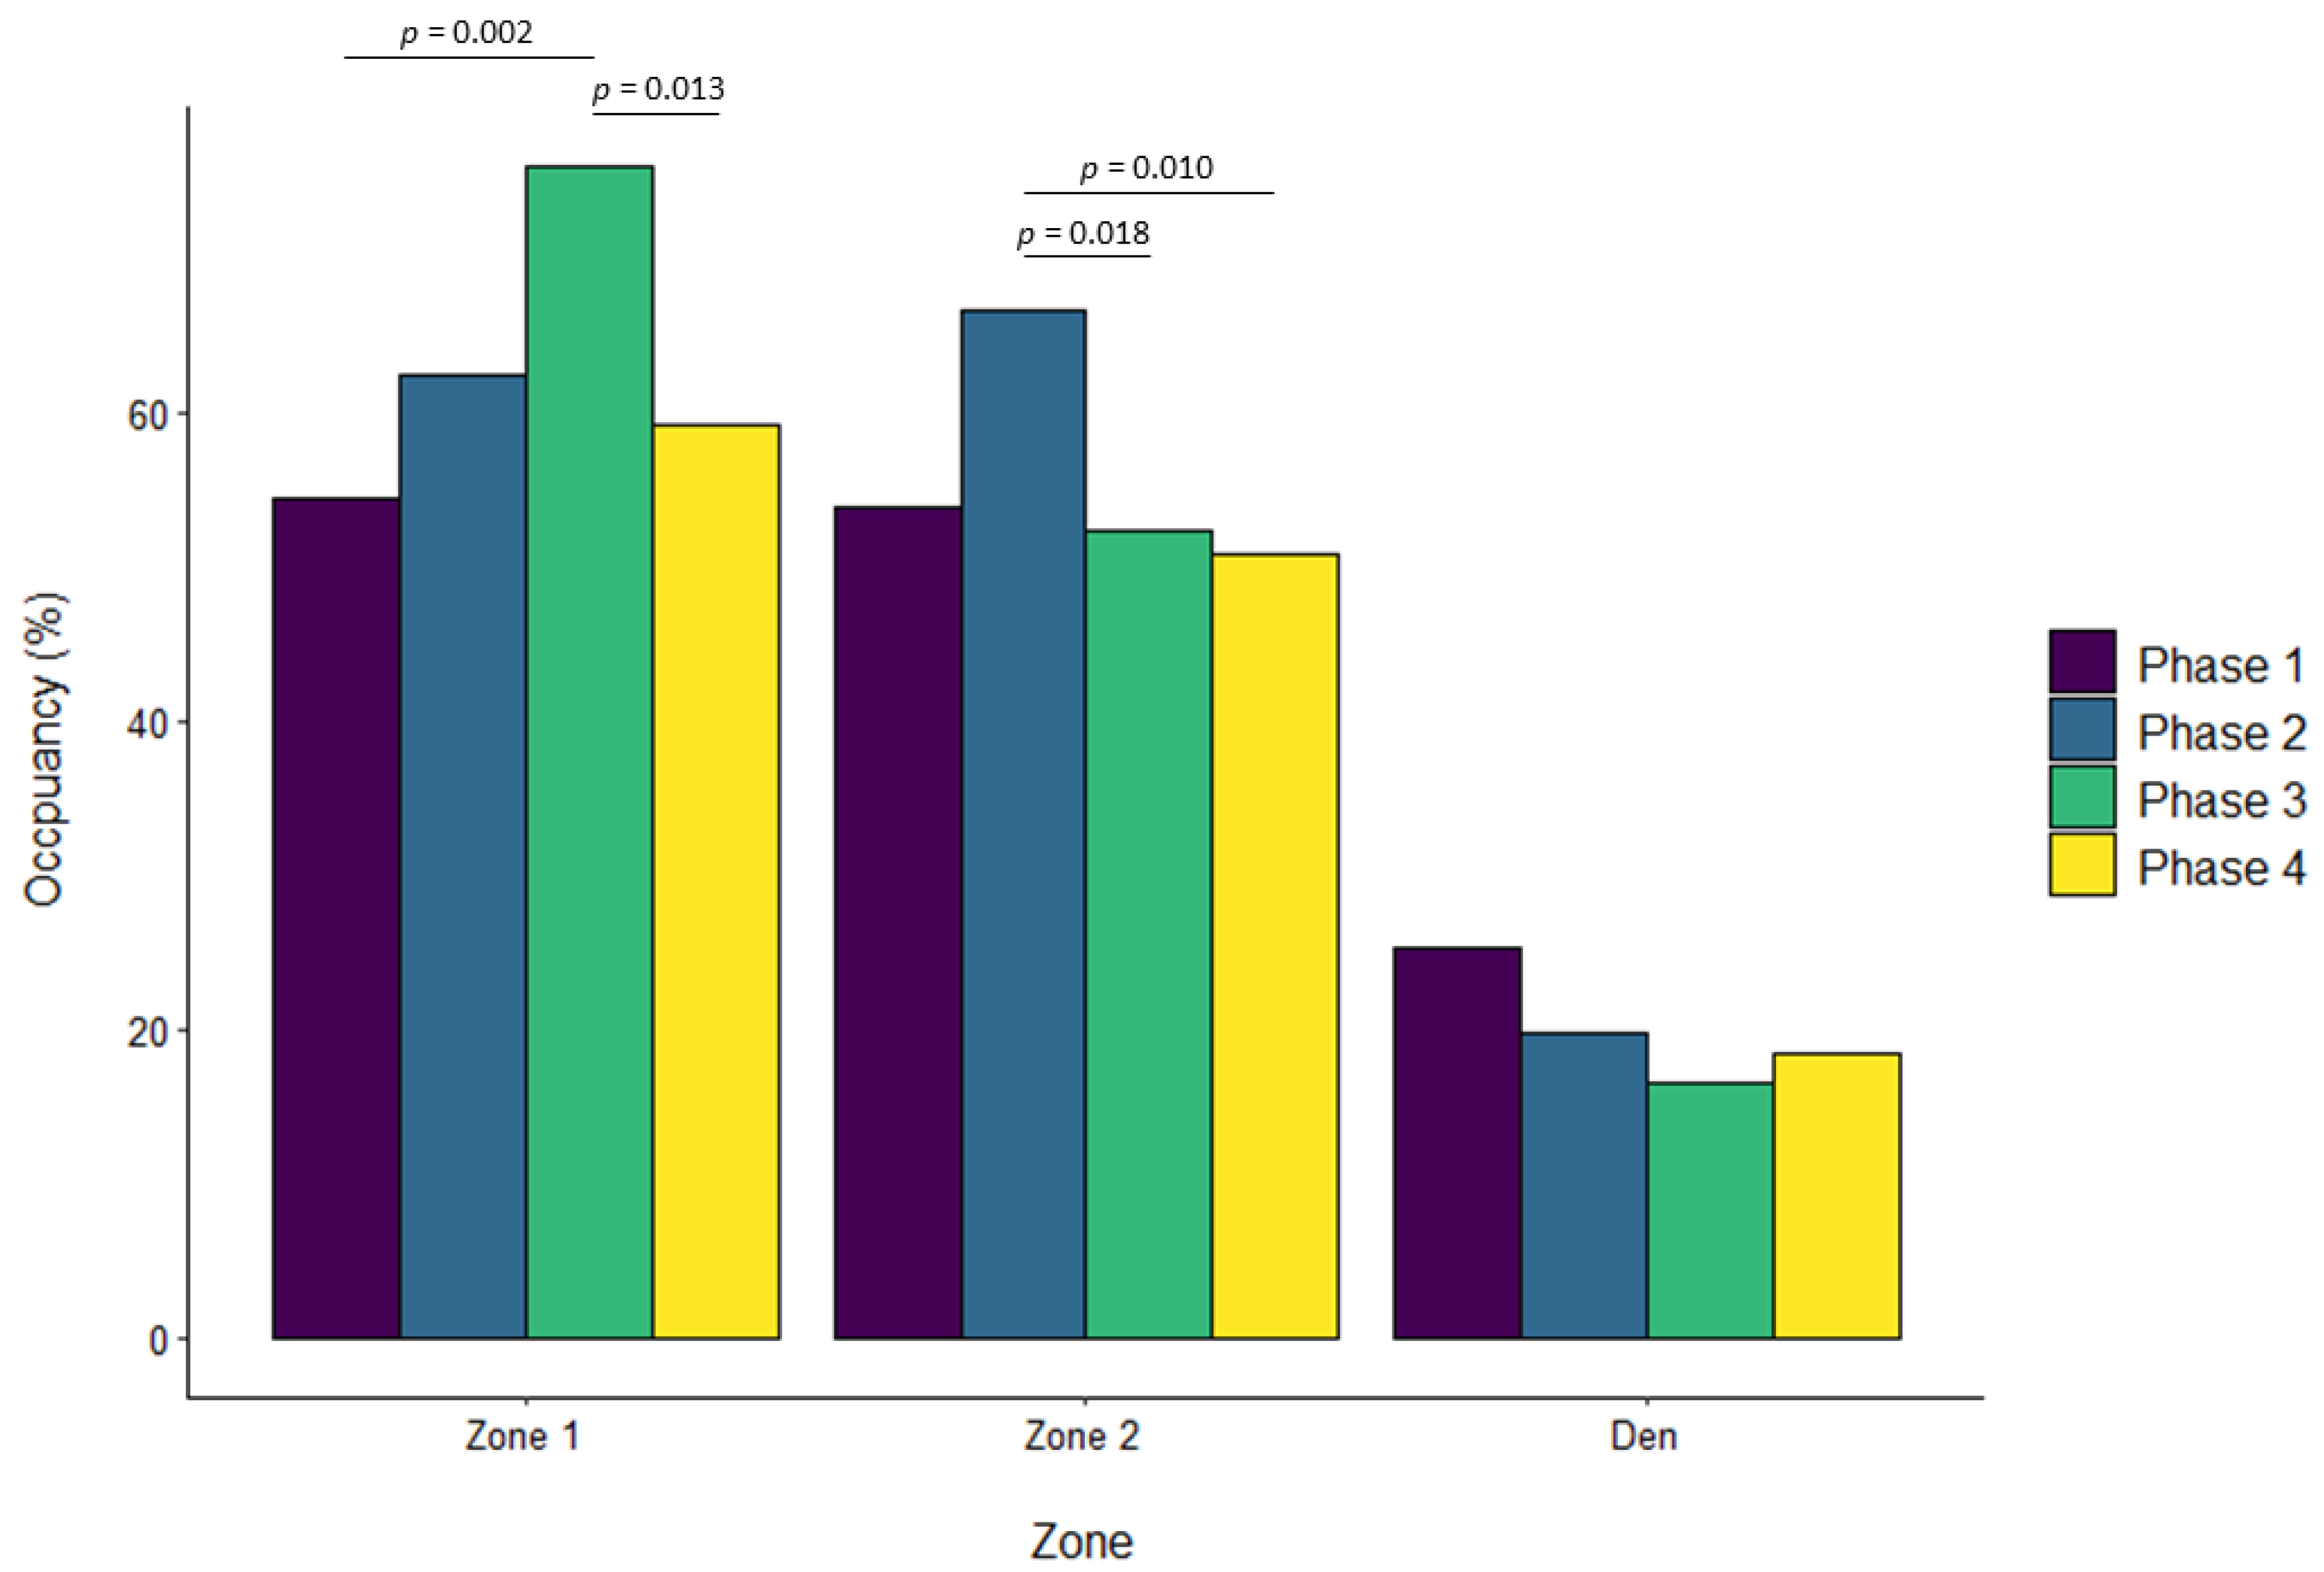
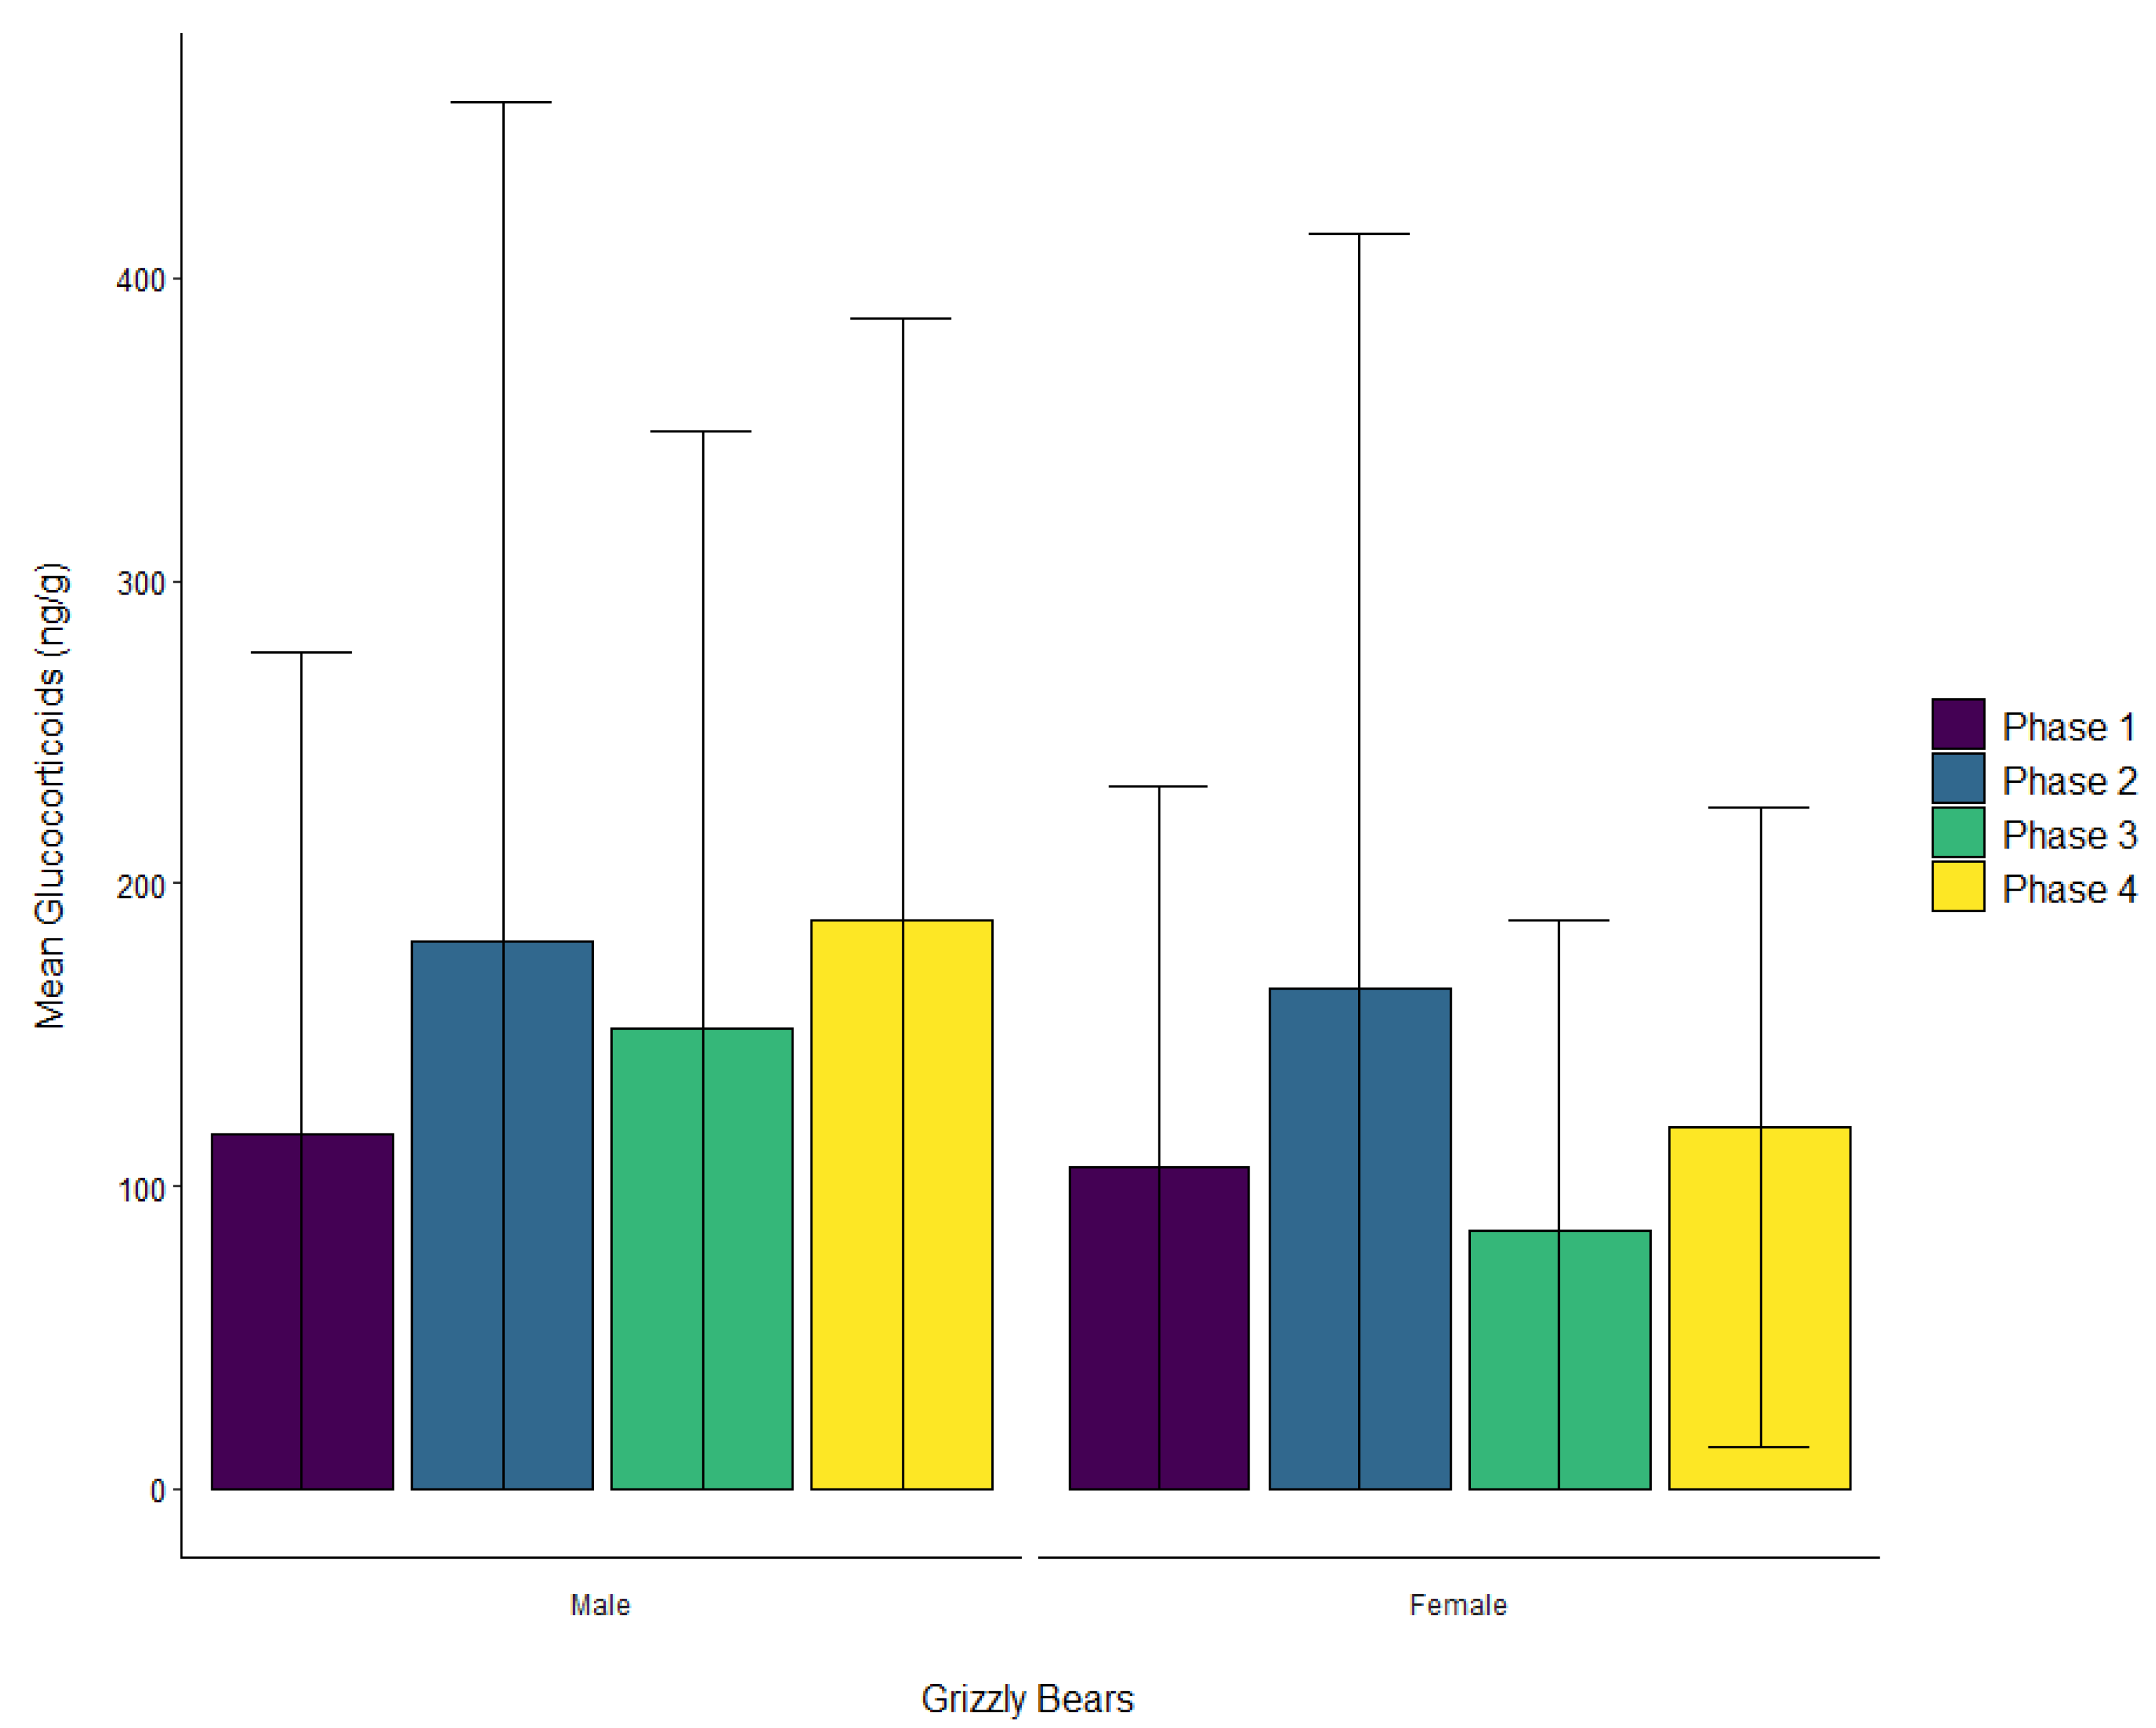
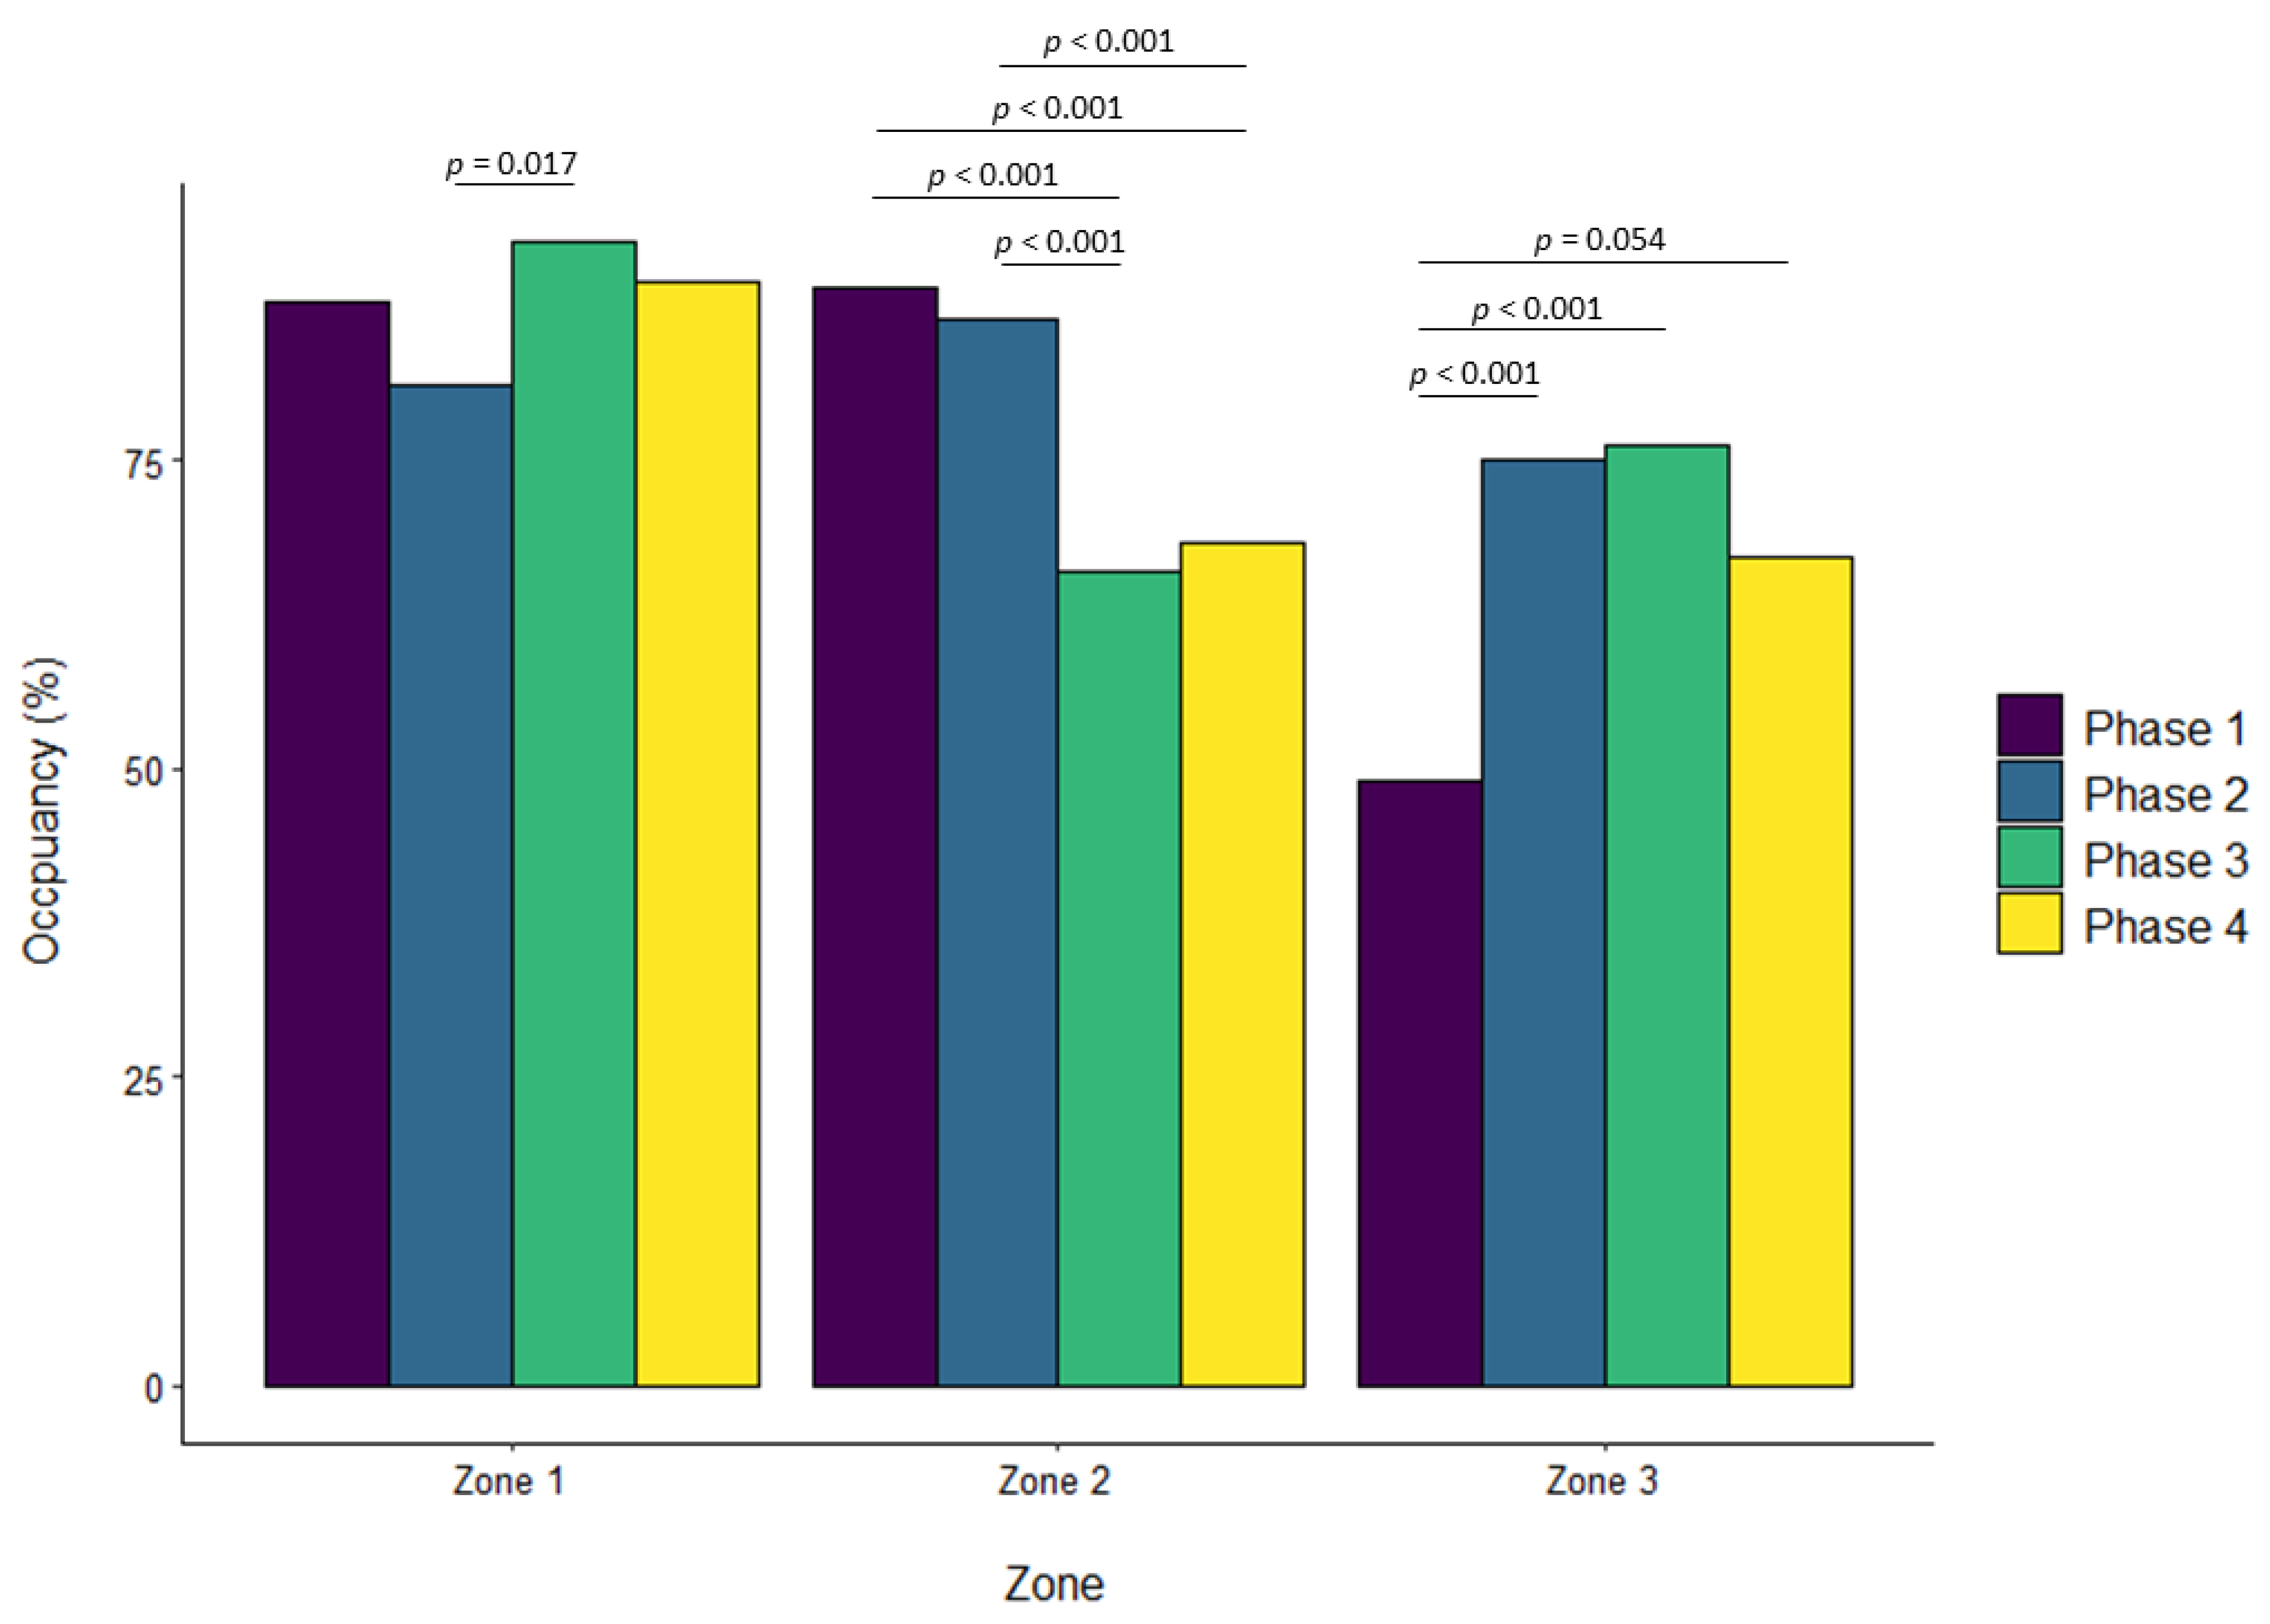
3.2. Grizzly Bears
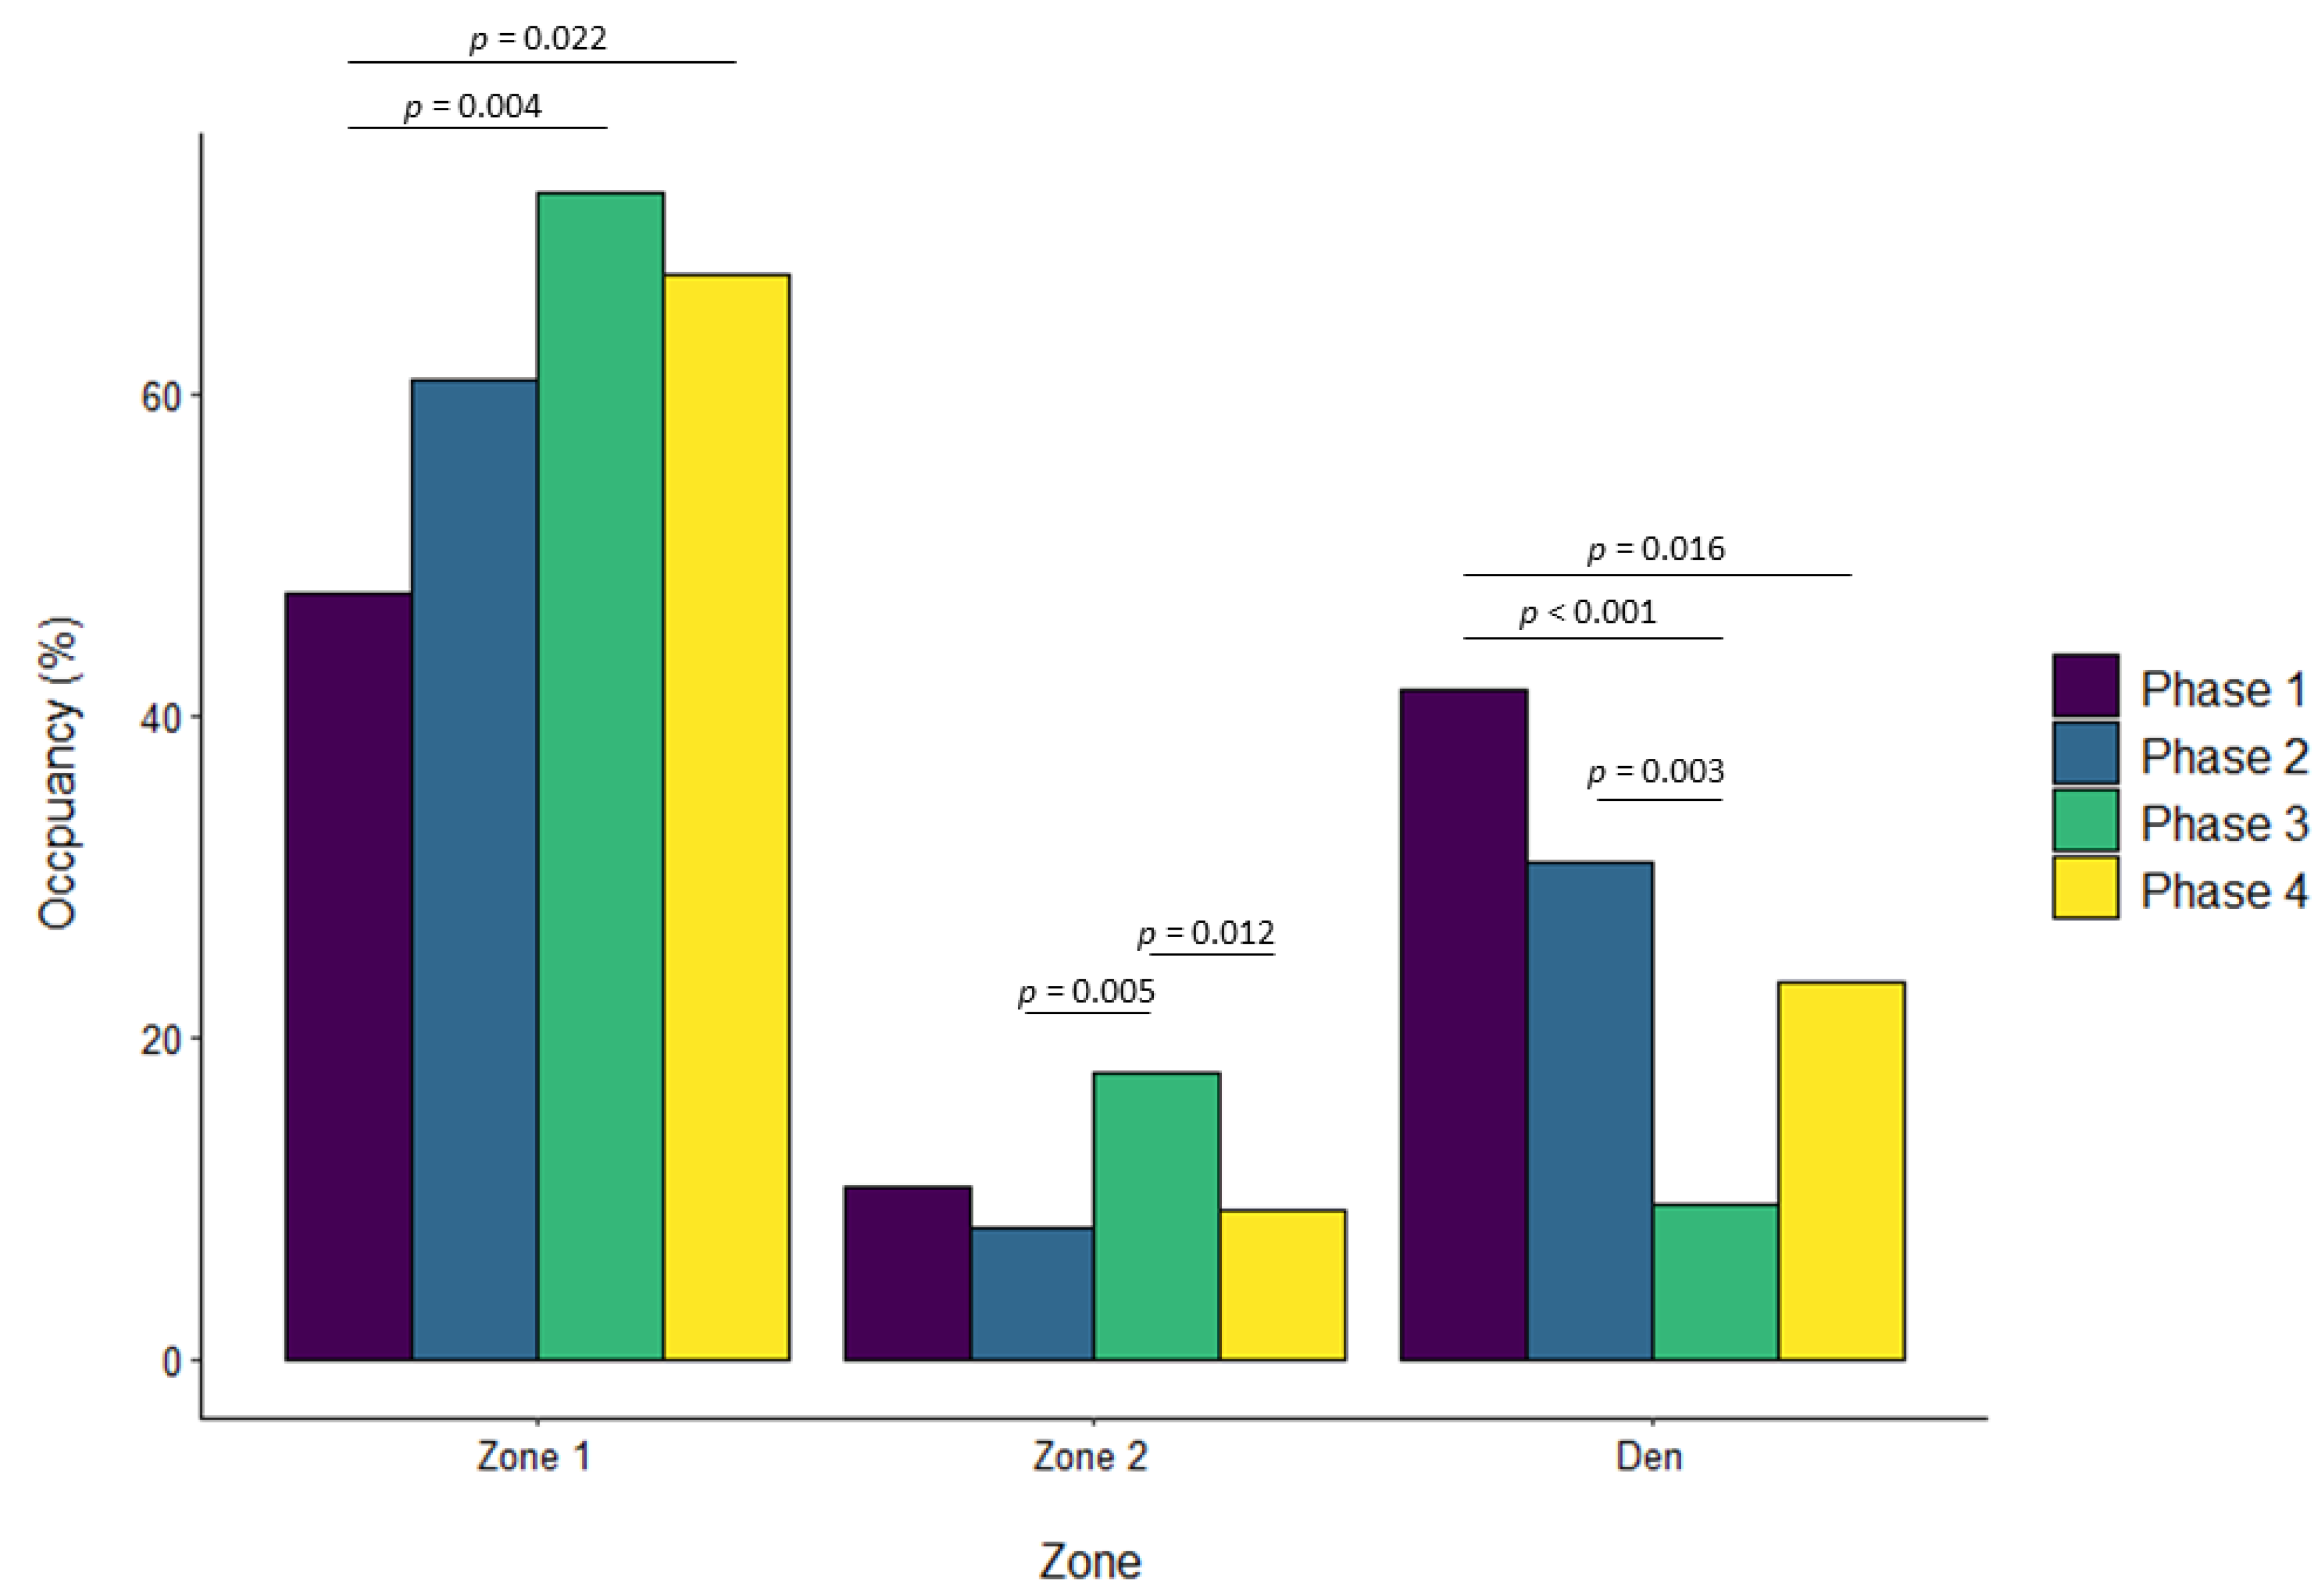
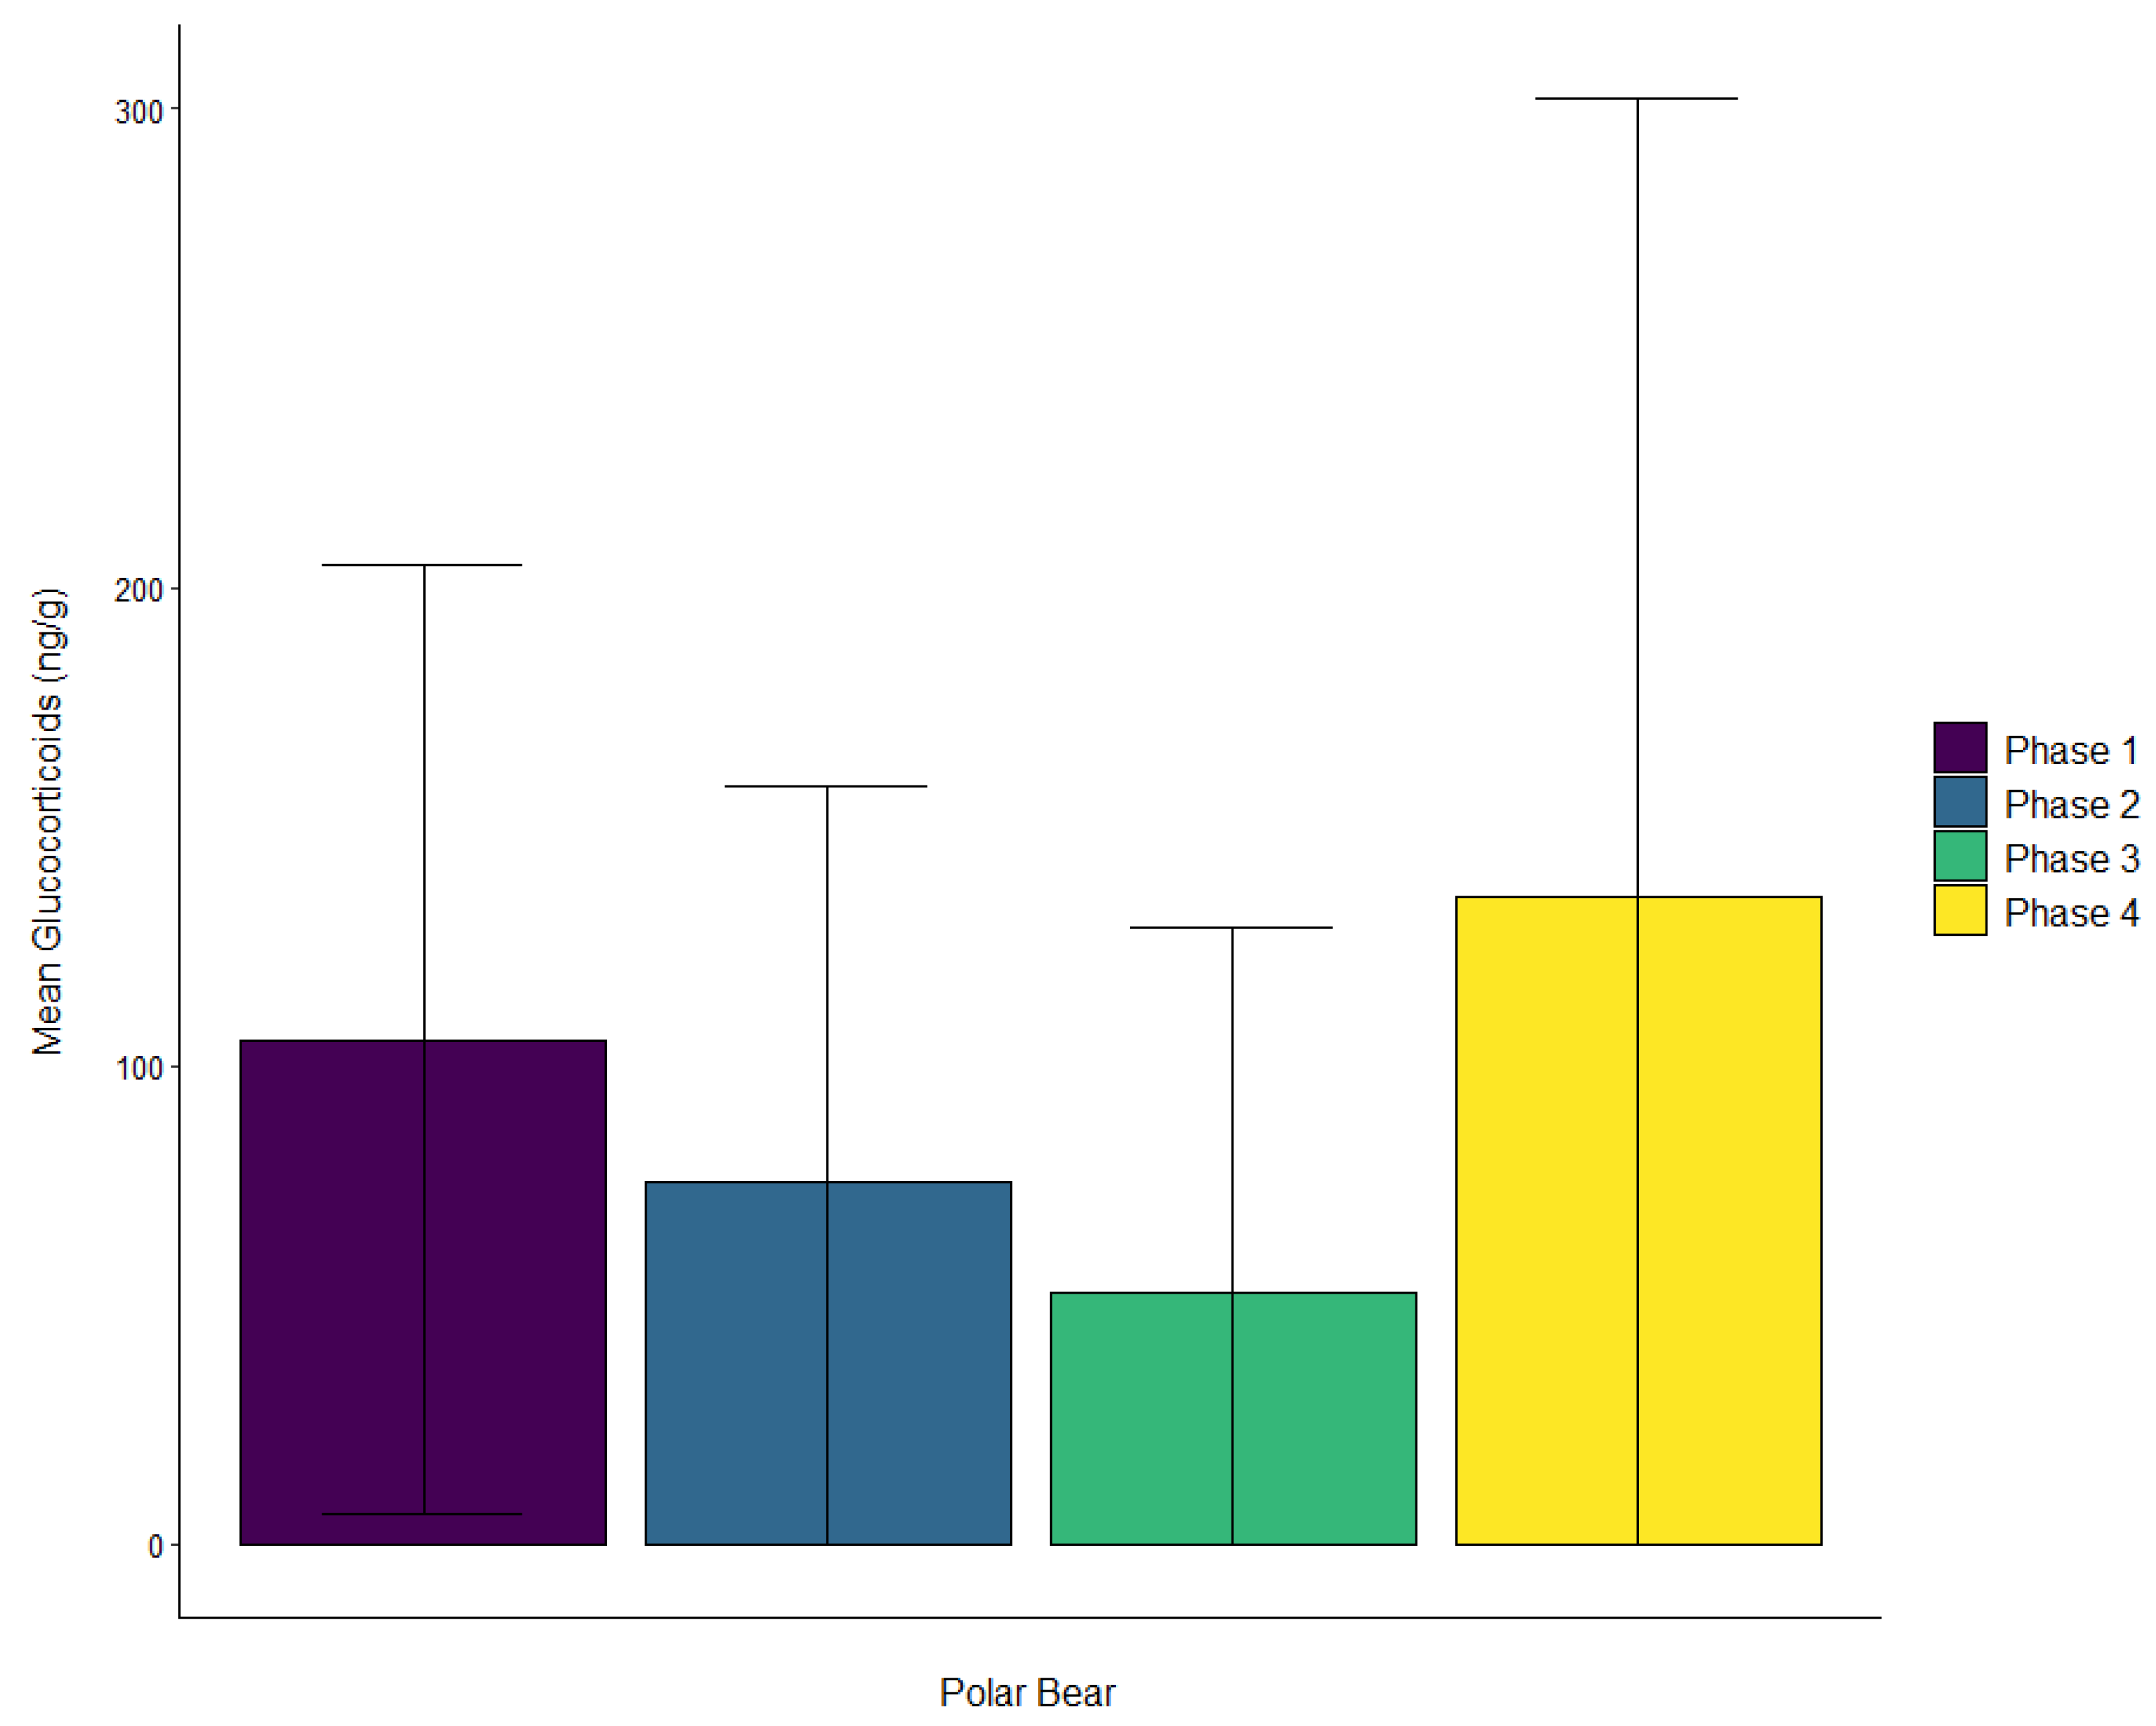
3.3. Polar Bear
3.4. Western Lowland Gorillas
4. Discussion
Author Contributions
Funding
Institutional Review Board Statement
Data Availability Statement
Acknowledgments
Conflicts of Interest
References
- Pifarré, M.; Valdez, R.; González-Rebeles, C.; Vázquez, C.; Romano, M.; Galindo, F. The Effect of Zoo Visitors on the Behaviour and Faecal Cortisol of the Mexican Wolf (Canis lupus baileyi). Appl. Anim. Behav. Sci. 2012, 136, 57–62. [Google Scholar] [CrossRef]
- Collins, C.; Quirke, T.; Overy, L.; Flannery, K.; O’Riordan, R. The Effect of the Zoo Setting on the Behavioural Diversity of Captive Gentoo Penguins and the Implications for Their Educational Potential. J. Zoo Aquar. Res. 2016, 4, 85–90. [Google Scholar]
- Chiapero, F.; Ferrari, H.R.; Prieto, M.V.; García Capocasa, M.C.; Busso, J.M. Multivariate Analyses of the Activity Pattern and Behavior of the Lesser Anteater on Open and Closed Days at Córdoba Zoo, Argentina. J. Appl. Anim. Welf. Sci. 2021, 24, 83–97. [Google Scholar] [CrossRef]
- Sellinger, R.L.; Ha, J.C. The Effects of Visitor Density and Intensity on the Behavior of Two Captive Jaguars (Panthera onca). J. Appl. Anim. Welf. Sci. 2005, 8, 233–244. [Google Scholar] [CrossRef]
- Vidal, L.S.; Guilherme, F.R.; Silva, V.F.; Faccio, M.C.S.R.; Martins, M.M.; Briani, D.C. The Effect of Visitor Number and Spice Provisioning in Pacing Expression by Jaguars Evaluated through a Case Study. Braz. J. Biol. 2016, 76, 506–510. [Google Scholar] [CrossRef] [Green Version]
- Sherwen, S.L.; Hemsworth, P.H. The Visitor Effect on Zoo Animals: Implications and Opportunities for Zoo Animal Welfare. Animals 2019, 9, 366. [Google Scholar] [CrossRef] [Green Version]
- Quadros, S.; Goulart, V.D.L.; Passos, L.; Vecci, M.A.M.; Young, R.J. Zoo Visitor Effect on Mammal Behaviour: Does Noise Matter? Appl. Anim. Behav. Sci. 2014, 156, 78–84. [Google Scholar] [CrossRef]
- Sekar, M.; Rajagopal, T.; Archunan, G. Influence of Zoo Visitor Presence on the Behavior of Captive Indian Gaur (Bos gaurus gaurus) in a Zoological Park. J. Appl. Anim. Welf. Sci. 2008, 11, 352–357. [Google Scholar] [CrossRef]
- Learmonth, M.J.; Sherwen, S.; Hemsworth, P.H. The Effects of Zoo Visitors on Quokka (Setonix brachyurus) Avoidance Behavior in a Walk-through Exhibit. Zoo Biol. 2018, 37, 223–228. [Google Scholar] [CrossRef]
- Riley, A.; Terry, M.; Freeman, H.; Alba, A.C.; Soltis, J.; Leeds, A. Evaluating the Effect of Visitor Presence on Nile Crocodile (Crocodylus niloticus) Behavior. J. Zool. Bot. Gard. 2021, 2, 115–129. [Google Scholar] [CrossRef]
- Huskisson, S.M.; Doelling, C.R.; Ross, S.R.; Hopper, L.M. Assessing the Potential Impact of Zoo Visitors on the Welfare and Cognitive Performance of Japanese Macaques. Appl. Anim. Behav. Sci. 2021, 243, 105453. [Google Scholar] [CrossRef]
- Cairo-Evans, A.; Wierzal, N.K.; Wark, J.D.; Cronin, K.A. Do Zoo-Housed Primates Retreat from Crowds? A Simple Study of Five Primate Species. Am. J. Primatol. 2022, e23386. [Google Scholar] [CrossRef]
- Hamilton, J.; Gartland, K.N.; Jones, M.; Fuller, G. Behavioral Assessment of Six Reptile Species during a Temporary Zoo Closure and Reopening. Animals 2022, 12, 1034. [Google Scholar] [CrossRef]
- Carter, K.C.; Keane, I.A.T.; Clifforde, L.M.; Rowden, L.J.; Fieschi-Méric, L.; Michaels, C.J. The Effect of Visitors on Zoo Reptile Behaviour during the COVID-19 Pandemic. J. Zool. Bot. Gard. 2021, 2, 664–676. [Google Scholar] [CrossRef]
- Bernstein-Kurtycz, L.M.; Koester, D.C.; Snyder, R.J.; Vonk, J.; Willis, M.A.; Lukas, K.E. “Bearly” Changing with the Seasons: Bears of Five Species Show Few Behavioral Changes across Seasons and at Varying Visitor Densities. Anim. Behav. Cogn. 2021, 8, 538–557. [Google Scholar] [CrossRef]
- Williams, E.; Carter, A.; Rendle, J.; Ward, S.J. Understanding Impacts of Zoo Visitors: Quantifying Behavioural Changes of Two Popular Zoo Species during COVID-19 Closures. Appl. Anim. Behav. Sci. 2021, 236, 105253. [Google Scholar] [CrossRef]
- Jones, M.; Gartland, K.N.; Fuller, G. Effects of Visitor Presence and Crowd Size on Zoo-Housed Red Kangaroos (Macropus rufus) during and after a COVID-19 Closure. Anim. Behav. Cogn. 2021, 8, 521–537. [Google Scholar] [CrossRef]
- Kidd, P.; Ford, S.; Rose, P.E. Exploring the Effect of the COVID-19 Zoo Closure Period on Flamingo Behaviour and Enclosure Use at Two Institutions. Birds N. Am. 2022, 3, 117–137. [Google Scholar] [CrossRef]
- Miller, M.E.; Robinson, C.M.; Margulis, S.W. Behavioral Implications of the Complete Absence of Guests on a Zoo-Housed Gorilla Troop. Animals 2021, 11, 1346. [Google Scholar] [CrossRef]
- Williams, E.; Carter, A.; Rendle, J.; Ward, S.J. Impacts of COVID-19 on Animals in Zoos: A Longitudinal Multi-Species Analysis. J. Zool. Bot. Gard. 2021, 2, 130–145. [Google Scholar] [CrossRef]
- Boultwood, J.; O’Brien, M.; Rose, P. Bold Frogs or Shy Toads? How Did the COVID-19 Closure of Zoological Organisations Affect Amphibian Activity? Animals 2021, 11, 1982. [Google Scholar] [CrossRef]
- Fink, L.B.; Scarlata, C.D.; VanBeek, B.; Bodner, T.E.; Wielebnowski, N.C. Applying Behavioral and Physiological Measures to Assess the Relative Impact of the Prolonged COVID-19 Pandemic Closure on Two Mammal Species at the Oregon Zoo: Cheetah (A. jubatus) and Giraffe (G. c. reticulata and G. c. tippelskirchii). Animals 2021, 11, 3526. [Google Scholar] [CrossRef]
- Bonnie, K.E.; Ang, M.Y.L.; Ross, S.R. Effects of Crowd Size on Exhibit Use by and Behavior of Chimpanzees (Pan Troglodytes) and Western Lowland Gorillas (Gorilla gorilla) at a Zoo. Appl. Anim. Behav. Sci. 2016, 178, 102–110. [Google Scholar] [CrossRef]
- Pollard, T.M. Use of Cortisol as a Stress Marker: Practical and Theoretical Problems. Am. J. Hum. Biol. 1995, 7, 265–274. [Google Scholar] [CrossRef]
- McEwen, B.S. What is the Confusion with Cortisol? Chronic Stress 2019, 3, 2470547019833647. [Google Scholar] [CrossRef]
- Wielebnowski, N.C.; Fletchall, N.; Carlstead, K.; Busso, J.M.; Brown, J.L. Noninvasive Assessment of Adrenal Activity Associated with Husbandry and Behavioral Factors in the North American Clouded Leopard Population. Zoo Biol. 2002, 21, 77–98. [Google Scholar] [CrossRef]
- Sherwen, S.L.; Harvey, T.J.; Magrath, M.J.L.; Butler, K.L.; Fanson, K.V.; Hemsworth, P.H. Effects of Visual Contact with Zoo Visitors on Black-Capped Capuchin Welfare. Appl. Anim. Behav. Sci. 2015, 167, 65–73. [Google Scholar] [CrossRef]
- Scott, K.; Heistermann, M.; Cant, M.A.; Vitikainen, E.I.K. Group Size and Visitor Numbers Predict Faecal Glucocorticoid Concentrations in Zoo Meerkats. R. Soc. Open Sci. 2017, 4, 161017. [Google Scholar] [CrossRef] [Green Version]
- Ozella, L.; Anfossi, L.; Di Nardo, F.; Pessani, D. Effect of Weather Conditions and Presence of Visitors on Adrenocortical Activity in Captive African Penguins (Spheniscus demersus). Gen. Comp. Endocrinol. 2017, 242, 49–58. [Google Scholar] [CrossRef]
- Sherwen, S.L.; Hemsworth, P.H.; Butler, K.L.; Fanson, K.V.; Magrath, M.J.L. Impacts of Visitor Number on Kangaroos Housed in Free-Range Exhibits. Zoo Biol. 2015, 34, 287–295. [Google Scholar] [CrossRef]
- Clark, F.E.; Fitzpatrick, M.; Hartley, A.; King, A.J.; Lee, T.; Routh, A.; Walker, S.L.; George, K. Relationship Between Behavior, Adrenal Activity, and Environment in Zoo-Housed Western Lowland Gorillas (Gorilla gorilla gorilla). Zoo Biol. 2012, 31, 306–321. [Google Scholar] [CrossRef]
- Clow, A.; Hucklebridge, F.; Thorn, L. The Cortisol Awakening Response in Context. In International Review of Neurobiology; Clow, A., Thorn, L., Eds.; Academic Press: Cambridge, MA, USA, 2010; Volume 93, pp. 153–175. [Google Scholar]
- Bonier, F.; Moore, I.T.; Martin, P.R.; Robertson, R.J. The Relationship between Fitness and Baseline Glucocorticoids in a Passerine Bird. Gen. Comp. Endocrinol. 2009, 163, 208–213. [Google Scholar] [CrossRef]
- Busch, D.S.; Hayward, L.S. Stress in a Conservation Context: A Discussion of Glucocorticoid Actions and How Levels Change with Conservation-Relevant Variables. Biol. Conserv. 2009, 142, 2844–2853. [Google Scholar] [CrossRef]
- Madliger, C.L.; Love, O.P. The Need for a Predictive, Context-Dependent Approach to the Application of Stress Hormones in Conservation. Conserv. Biol. 2013, 28, 283–287. [Google Scholar] [CrossRef]
- Cockrem, J.F. Individual Variation in Glucocorticoid Stress Responses in Animals. Gen. Comp. Endocrinol. 2013, 181, 45–58. [Google Scholar] [CrossRef]
- Dantzer, B.; Fletcher, Q.E.; Boonstra, R.; Sheriff, M.J. Measures of Physiological Stress: A Transparent or Opaque Window into the Status, Management and Conservation of Species? Conserv. Physiol. 2014, 2, cou023. [Google Scholar] [CrossRef] [PubMed]
- Crespi, E.J.; Williams, T.D.; Jessop, T.S.; Delehanty, B. Life History and the Ecology of Stress: How Do Glucocorticoid Hormones Influence Life-History Variation in Animals? Funct. Ecol. 2013, 27, 93–106. [Google Scholar] [CrossRef]
- Möstl, E.; Palme, R. Hormones as Indicators of Stress. Domest. Anim. Endocrinol. 2002, 23, 67–74. [Google Scholar] [CrossRef]
- Broom, D. Cortisol: Often Not the Best Indicator of Stress and Poor Welfare. Physiol. News 2017, 107, 30–32. [Google Scholar] [CrossRef]
- MacDougall-Shackleton, S.A.; Bonier, F.; Romero, L.M.; Moore, I.T. Glucocorticoids and “Stress” Are Not Synonymous. Integr. Org. Biol. 2019, 1, obz017. [Google Scholar] [CrossRef] [Green Version]
- Goodenough, A.E.; McDonald, K.; Moody, K.; Wheeler, C. Are “Visitor Effects” Overestimated? Behaviour in Captive Lemurs Is Mainly Driven by Co-Variation with Time and Weather. J. Zoo Aquar. Res. 2019, 7, 59–66. [Google Scholar]
- Rose, P.E.; Scales, J.S.; Brereton, J.E. Why the “Visitor Effect” Is Complicated. Unraveling Individual Animal, Visitor Number, and Climatic Influences on Behavior, Space Use and Interactions with Keepers-A Case Study on Captive Hornbills. Front. Vet. Sci. 2020, 7, 236. [Google Scholar] [CrossRef]
- Kozlowski, C.P.; Clawitter, H.L.; Thier, T.; Fischer, M.T.; Asa, C.S. Characterization of Estrous Cycles and Pregnancy in Somali Wild Asses (Equus africanus somaliensis) through Fecal Hormone Analyses. Zoo Biol. 2018, 37, 35–39. [Google Scholar] [CrossRef]
- Palme, R. Non-Invasive Measurement of Glucocorticoids: Advances and Problems. Physiol. Behav. 2019, 199, 229–243. [Google Scholar] [CrossRef]
- White, B.C.; Kozlowski, C.; Taylor, S.R.; Franklin, J.A.; Burns, R. Faecal Glucocorticoid Metabolite Concentrations during ACTH Challenge Tests in Captive Grizzly Bears (Ursus arctos horribilus) and Polar Bears (Ursus maritimus). J. Zoo Aquar. Res. 2015, 3, 59–62. [Google Scholar]
- Kozlowski, C.P.; Bauman, K.L.; Clawitter, H.L.; Thier, T.; Fischer, M.; Powell, D.M. Noninvasive Monitoring of Steroid Hormone Production and Activity of Zoo-Housed Banteng (Bos javanicus). In review.
- Bates, D.; Maechler, M.; Bolker, B.; Walker, S.; Christensen, R.H.B.; Singmann, H.; Dai, B.; Scheipl, F.; Grothendieck, G.; Green, P.; et al. Lme4: Linear Mixed-Effects Models Using “Eigen” and S4; The R Project for Statistical Computing: Vienna, Austria, 2015. [Google Scholar]
- Hothorn, T.; Bretz, F.; Westfall, P.; Heiberger, R.M.; Schuetzenmeister, A.; Scheibe, S. Multcomp: Simultaneous Inference in General Parametric Models; The R Project for Statistical Computing: Vienna, Austria, 2022. [Google Scholar]
- R Core Team. R: A Language and Environment for Statistical Computing; R Foundation for Statistical Computing: Vienna, Austria, 2018. [Google Scholar]
- Greenland, S.; Senn, S.J.; Rothman, K.J.; Carlin, J.B.; Poole, C.; Goodman, S.N.; Altman, D.G. Statistical Tests, P Values, Confidence Intervals, and Power: A Guide to Misinterpretations. Eur. J. Epidemiol. 2016, 31, 337–350. [Google Scholar] [CrossRef] [Green Version]
- McShane, B.B.; Gal, D.; Gelman, A.; Robert, C.; Tackett, J.L. Abandon Statistical Significance. Am. Stat. 2019, 73, 235–245. [Google Scholar] [CrossRef] [Green Version]
- Nakagawa, S.; Cuthill, I.C. Effect Size, Confidence Interval and Statistical Significance: A Practical Guide for Biologists. Biol. Rev. Camb. Philos. Soc. 2007, 82, 591–605. [Google Scholar] [CrossRef]
- Coleman, C. AZA Regional Studbook Banteng (Bos javanicus); Association of Zoos and Aquariums: Silver Spring, MD, USA, 2020. [Google Scholar]
- Kenagy, G.J.; Place, N.J. Seasonal Changes in Plasma Glucocorticosteroids of Free-Living Female Yellow-Pine Chipmunks: Effects of Reproduction and Capture and Handling. Gen. Comp. Endocrinol. 2000, 117, 189–199. [Google Scholar] [CrossRef]
- Rajagopal, T.; Archunan, G.; Sekar, M. Impact of Zoo Visitors on the Fecal Cortisol Levels and Behavior of an Endangered Species: Indian Blackbuck (Antelope cervicapra L.). J. Appl. Anim. Welf. Sci. 2011, 14, 18–32. [Google Scholar] [CrossRef]
- Klich, D.; Łopucki, R.; Gałązka, M.; Ścibior, A.; Gołębiowska, D.; Brzezińska, R.; Kruszewski, B.; Kaleta, T.; Olech, W. Stress Hormone Level and the Welfare of Captive European Bison (Bison bonasus): The Effects of Visitor Pressure and the Social Structure of Herds. Acta Vet. Scand. 2021, 63, 24. [Google Scholar] [CrossRef]
- Leake, J. The Livestock Industry. Bull. Indones. Econ. Stud. 1980, 16, 65–74. [Google Scholar] [CrossRef]
- Martojo, H. Indigenous Bali Cattle Is Most Suitable for Sustainable Small Farming in Indonesia. Reprod. Domest. Anim. 2012, 47 (Suppl. S1), 10–14. [Google Scholar] [CrossRef]
- Copland, R.S. Observations on Banteng Cattle in Sabah. Trop. Anim. Health Prod. 1974, 6, 89–94. [Google Scholar] [CrossRef]
- Leishman, E.M.; Franke, M.; Marvin, J.; McCart, D.; Bradford, C.; Gyimesi, Z.S.; Nichols, A.; Lessard, M.-P.; Page, D.; Breiter, C.-J.; et al. The Adrenal Cortisol Response to Increasing Ambient Temperature in Polar Bears (Ursus maritimus). Animals 2022, 12, 672. [Google Scholar] [CrossRef]
- Soriano, A.I.; Vinyoles, D.; Maté, C. The Influence of Visitors on Behaviour and on the Use of Space in Two Species of Ursids: A Management Question? Int. Zoo News 2013, 60, 341–356. [Google Scholar]
- Kelly, K.R.; Harrison, M.L.; Size, D.D.; MacDonald, S.E. Individual Effects of Seasonal Changes, Visitor Density, and Concurrent Bear Behavior on Stereotypical Behaviors in Captive Polar Bears (Ursus maritimus). J. Appl. Anim. Welf. Sci. 2015, 18, 17–31. [Google Scholar] [CrossRef]
- Wells, D.L. A Note on the Influence of Visitors on the Behaviour and Welfare of Zoo-Housed Gorillas. Appl. Anim. Behav. Sci. 2005, 93, 13–17. [Google Scholar] [CrossRef]
- Ross, S.R.; Lukas, K.E. Use of Space in a Non-Naturalistic Environment by Chimpanzees (Pan troglodytes) and Lowland Gorillas (Gorilla gorilla gorilla). Appl. Anim. Behav. Sci. 2006, 96, 143–152. [Google Scholar] [CrossRef]
- Stoinski, T.S.; Jaicks, H.F.; Drayton, L.A. Visitor Effects on the Behavior of Captive Western Lowland Gorillas: The Importance of Individual Differences in Examining Welfare. Zoo Biol. 2012, 31, 586–599. [Google Scholar] [CrossRef]
- Kurtycz, L.M.B.; Ross, S.R. Western Lowland Gorilla (Gorilla gorilla gorilla) Birth Patterns and Human Presence in Zoological Settings. Zoo Biol. 2015, 34, 518–521. [Google Scholar] [CrossRef]
- Collins, C.K.; Marples, N.M. The Effects of Zoo Visitors on a Group of Western Lowland Gorillas Gorilla gorilla gorilla before and after the Birth of an Infant at Dublin Zoo. Int. Zoo Yearb. 2016, 50, 183–192. [Google Scholar] [CrossRef]
- Hashmi, A.; Sullivan, M. The Visitor Effect in Zoo-Housed Apes: The Variable Effect on Behaviour of Visitor Number and Noise. J. Zoo Aquar. Res. 2020, 8, 268–282. [Google Scholar]
- Lewis, R.N.; Chang, Y.-M.; Ferguson, A.; Lee, T.; Clifforde, L.; Abeyesinghe, S.M. The Effect of Visitors on the Behaviour of Zoo-Housed Western Lowland Gorillas (Gorilla gorilla gorilla). Zoo Biol. 2020, 39, 283–296. [Google Scholar] [CrossRef]
- Kuhar, C.W. Group Differences in Captive Gorillas’ Reaction to Large Crowds. Appl. Anim. Behav. Sci. 2008, 110, 377–385. [Google Scholar] [CrossRef]
- Carder, G.; Semple, S. Visitor Effects on Anxiety in Two Captive Groups of Western Lowland Gorillas. Appl. Anim. Behav. Sci. 2008, 115, 211–220. [Google Scholar] [CrossRef]
- Hill, S.P.; Broom, D.M. Measuring Zoo Animal Welfare: Theory and Practice. Zoo Biol. 2009, 28, 531–544. [Google Scholar] [CrossRef]
- Ross, S.R.; Wagner, K.E.; Schapiro, S.J.; Hau, J. Ape Behavior in Two Alternating Environments: Comparing Exhibit and Short-Term Holding Areas. Am. J. Primatol. 2010, 72, 951–959. [Google Scholar] [CrossRef]
- Kurtycz, L.M.; Wagner, K.E.; Ross, S.R. The Choice to Access Outdoor Areas Affects the Behavior of Great Apes. J. Appl. Anim. Welf. Sci. 2014, 17, 185–197. [Google Scholar] [CrossRef]
- Choo, Y.; Todd, P.A.; Li, D. Visitor Effects on Zoo Orangutans in Two Novel, Naturalistic Enclosures. Appl. Anim. Behav. Sci. 2011, 133, 78–86. [Google Scholar] [CrossRef]
- Hosey, G.R.; Melfi, V.; Formella, I.; Ward, S.J.; Tokarski, M.; Brunger, D.; Brice, S.; Hill, S.P. Is Wounding Aggression in Zoo-Housed Chimpanzees and Ring-Tailed Lemurs Related to Zoo Visitor Numbers? Zoo Biol. 2016, 35, 205–209. [Google Scholar] [CrossRef] [Green Version]
- Margulis, S.W.; Hoyos, C.; Anderson, M. Effect of Felid Activity on Zoo Visitor Interest. Zoo Biol. 2003, 22, 587–599. [Google Scholar] [CrossRef]


| Phase | Dates | Description | Average Temp. (°C) |
|---|---|---|---|
| Phase 1 | 20 April–30 May 2020 | Zoo closed for COVID-19 | 17.3° |
| Phase 2 | 9 June–18 July 2020 | Zoo reopened, one-third capacity | 26.9° |
| Phase 3 | 14 September–24 October 2020 | Half capacity, following re-acclimation in Phase 2 | 16.5° |
| Phase 4 | 19 April–29 May 2021 3 May–12 June 2021 1 | Half capacity, seasonal comparison with Phase 1 | 17.3° 20.5° |
| Project Phases in 2020 & 2021 | Time-Matched Comparisons from 2019 | ||||
|---|---|---|---|---|---|
| Weekdays | Weekends | Weekdays | Weekends | ||
| Phase 1 | Range | COVID-19 closure | 3484–20,516 | 4595–24,976 | |
| 9066.8 | 17,040.8 | ||||
| Phase 2 | Range | 2928–9837 | 4418–10,187 | 5417–17,044 | 7825–20,824 |
| 5644.6 | 7660.3 | 10,310.4 | 14,650.8 | ||
| Phase 3 | Range | 2438–7147 | 3312–13,531 | 2742–12,827 | 2581–22,982 |
| 3318.7 | 8810.9 | 5369.9 | 12,552.0 | ||
| Phase 4 | Range | 630–7892 | 5175–15,312 | 3484–20,516 | 4595–24,976 |
| 5034.3 | 10,176.5 | 9066.8 | 17,040.8 | ||
| Phase 4 1 | Range | 2270–14,178 | 7238–15,312 | 7215–20,516 | 4595–24,717 |
| 6593.5 | 12,012.3 | 10,543.2 | 17,917.6 | ||
| Project Phase | |||||
|---|---|---|---|---|---|
| Species | Phase 1 | Phase 2 | Phase 3 | Phase 4 | |
| Banteng | Hours | 70.5 | 82.6 | 79.6 | 79.5 |
| Observation Points | 1409 | 1651 | 1591 | 1589 | |
| Grizzly bears | Hours | 73.3 | 87.2 | 92.6 | 87.8 |
| Observation Points | 1466 | 1744 | 1851 | 1756 | |
| Polar bear | Hours | 83.8 | 87.0 | 88.3 | 84.3 |
| Observation Points | 1676 | 1739 | 1765 | 1686 | |
| Gorillas | Hours | 82.4 | 85.3 | 91.5 | 85.7 |
| Observation Points | 1647 | 1705 | 1829 | 1714 | |
| Banteng | Grizzly Bears | Polar Bear | Gorillas | |||||||||
|---|---|---|---|---|---|---|---|---|---|---|---|---|
| Phase Comparison | β | SE | p | β | SE | p | β | SE | p | β | SE | p |
| Zone 1 | ||||||||||||
| Phase 2 vs. Phase 1 | 0.322 | 0.092 | 0.002 | 0.069 | 0.057 | 0.629 | 0.136 | 0.068 | 0.195 | −0.076 | 0.041 | 0.243 |
| Phase 3 vs. Phase 1 | 0.180 | 0.090 | 0.190 | 0.206 | 0.057 | 0.002 | 0.232 | 0.068 | 0.004 | 0.044 | 0.040 | 0.696 |
| Phase 4 vs. Phase 1 | 0.108 | 0.092 | 0.643 | 0.035 | 0.057 | 0.929 | 0.198 | 0.069 | 0.022 | 0.003 | 0.041 | 0.999 |
| Phase 3 vs. Phase 2 | −0.142 | 0.091 | 0.401 | 0.137 | 0.056 | 0.071 | 0.096 | 0.067 | 0.476 | 0.120 | 0.041 | 0.017 |
| Phase 4 vs. Phase 2 | −0.214 | 0.093 | 0.094 | −0.034 | 0.057 | 0.933 | 0.063 | 0.068 | 0.796 | 0.079 | 0.041 | 0.225 |
| Phase 4 vs. Phase 3 | −0.072 | 0.091 | 0.860 | −0.171 | 0.056 | 0.013 | −0.034 | 0.068 | 0.960 | −0.041 | 0.041 | 0.754 |
| Zone 2 | ||||||||||||
| Phase 2 vs. Phase 1 | −0.233 | 0.061 | 0.001 | 0.101 | 0.049 | 0.156 | −0.026 | 0.033 | 0.850 | −0.015 | 0.044 | 0.986 |
| Phase 3 vs. Phase 1 | 0.059 | 0.060 | 0.757 | −0.038 | 0.048 | 0.861 | 0.081 | 0.032 | 0.062 | −0.224 | 0.044 | <0.001 |
| Phase 4 vs. Phase 1 | −0.047 | 0.061 | 0.872 | −0.046 | 0.048 | 0.775 | −0.018 | 0.033 | 0.947 | −0.201 | 0.044 | <0.001 |
| Phase 3 vs. Phase 2 | 0.293 | 0.061 | <0.001 | −0.139 | 0.047 | 0.018 | 0.107 | 0.032 | 0.005 | −0.209 | 0.044 | <0.001 |
| Phase 4 vs. Phase 2 | 0.186 | 0.062 | 0.013 | −0.148 | 0.048 | 0.010 | 0.008 | 0.033 | 0.994 | −0.185 | 0.045 | <0.001 |
| Phase 4 vs. Phase 3 | −0.106 | 0.061 | 0.302 | −0.008 | 0.047 | 0.998 | −0.099 | 0.032 | 0.012 | 0.024 | 0.045 | 0.952 |
| Den/Zone 3 | ||||||||||||
| Phase 2 vs. Phase 1 | −0.015 | 0.060 | 0.994 | −0.109 | 0.061 | 0.273 | 0.253 | 0.063 | <0.001 | |||
| Phase 3 vs. Phase 1 | −0.059 | 0.059 | 0.751 | −0.314 | 0.060 | <0.001 | 0.261 | 0.063 | <0.001 | |||
| Phase 4 vs. Phase 1 | −0.047 | 0.059 | 0.857 | −0.181 | 0.061 | 0.016 | 0.162 | 0.064 | 0.054 | |||
| Phase 3 vs. Phase 2 | −0.044 | 0.059 | 0.880 | −0.205 | 0.059 | 0.003 | 0.007 | 0.064 | 0.999 | |||
| Phase 4 vs. Phase 2 | −0.032 | 0.059 | 0.949 | −0.072 | 0.060 | 0.630 | −0.091 | 0.065 | 0.494 | |||
| Phase 4 vs. Phase 3 | 0.012 | 0.059 | 0.997 | 0.133 | 0.060 | 0.117 | −0.098 | 0.064 | 0.417 | |||
| Fecal Glucocorticoid Levels (ng/g) | ||||||
|---|---|---|---|---|---|---|
| Species | Sex | Phase 1 | Phase 2 | Phase 3 | Phase 4 | |
| Banteng | Male | ± SD | 24.5 ± 2.3 | 25.0 ± 3.9 | 27.9 ± 9.8 | 22.4 ± 3.5 |
| Female 1 | ± SD | 25.8 ± 6.3 | 30.4 ± 6.8 | 31.9 ± 18.2 | 23.9 ± 4.6 | |
| Female 2 | ± SD | 26.2 ± 4.8 | 186.1 ± 183.9 | 30.4 ± 11.2 | 37.7 ± 8.4 | |
| Female 3 | ± SD | 75.6 ± 106.2 | 74.4 ± 63.7 | 34.8 ± 10.8 | 48.0 ± 13.6 | |
| Female 4 | ± SD | 58.4 ± 97.6 | 125.5 ± 179.1 | 26.3 ± 7.2 | 34.7 ± 10.8 | |
| Grizzly bear | Male | ± SD | 116.9 ± 159.4 | 181.0 ± 277.0 | 152.5 ± 197.0 | 187.6 ± 198.8 |
| Female | ± SD | 106.6 ± 125.4 | 165.6 ± 249.3 | 85.4 ± 102.1 | 119.8 ± 105.6 | |
| Polar bear | Male | ± SD | 105.4 ± 99.2 | 75.8 ± 82.6 | 52.5 ± 76.4 | 135.5 ± 166.9 |
| Male 1 | Female 1 | Female 2 | Female 3 | Female 4 | |||||||||||
|---|---|---|---|---|---|---|---|---|---|---|---|---|---|---|---|
| Phase Comparison | β | SE | p | β | SE | p | β | SE | p | β | SE | p | β | SE | p |
| Phase 2 vs. Phase 1 | 0.043 | 0.069 | 0.808 | 0.326 | 0.143 | 0.100 | 1.924 | 0.234 | <0.001 | 0.021 | 0.349 | 1.000 | 0.788 | 0.444 | 0.281 |
| Phase 3 vs. Phase 1 | 0.181 | 0.109 | 0.344 | 0.145 | 0.179 | 0.847 | −0.468 | 0.264 | 0.283 | −0.696 | 0.338 | 0.163 | |||
| Phase 4 vs. Phase 1 | −0.090 | 0.048 | 0.142 | −0.060 | 0.109 | 0.945 | 0.365 | 0.179 | 0.177 | −0.156 | 0.265 | 0.935 | −0.468 | 0.343 | 0.519 |
| Phase 3 vs. Phase 2 | −0.146 | 0.143 | 0.735 | −1.779 | 0.234 | <0.001 | −0.489 | 0.342 | 0.477 | −1.484 | 0.444 | 0.005 | |||
| Phase 4 vs. Phase 2 | −0.132 | 0.066 | 0.107 | −0.387 | 0.140 | 0.029 | −1.562 | 0.230 | <0.001 | −0.176 | 0.335 | 0.952 | −1.257 | 0.434 | 0.020 |
| Phase 4 vs. Phase 3 | −0.241 | 0.109 | 0.120 | 0.217 | 0.179 | 0.616 | 0.261 | 0.261 | 0.624 | 0.228 | 0.343 | 0.909 | |||
| Temperature | −0.001 | 0.003 | 0.674 | −0.010 | 0.005 | 0.068 | 0.002 | 0.008 | 0.837 | 0.014 | 0.012 | 0.265 | 0.014 | 0.016 | 0.384 |
| Day of Week | 0.042 | 0.042 | 0.315 | −0.102 | 0.083 | 0.224 | −0.070 | 0.136 | 0.609 | −0.212 | 0.199 | 0.290 | −0.152 | 0.261 | 0.562 |
| Male | Female | |||||
|---|---|---|---|---|---|---|
| Phase Comparison | β | SE | p | β | SE | p |
| Phase 2 vs. Phase 1 | 0.358 | 0.378 | 0.777 | 0.079 | 0.341 | 0.996 |
| Phase 3 vs. Phase 1 | 0.263 | 0.301 | 0.817 | −0.223 | 0.273 | 0.844 |
| Phase 4 vs. Phase 1 | 0.471 | 0.295 | 0.379 | 0.218 | 0.269 | 0.848 |
| Phase 3 vs. Phase 2 | −0.096 | 0.382 | 0.994 | −0.302 | 0.338 | 0.806 |
| Phase 4 vs. Phase 2 | 0.112 | 0.375 | 0.991 | 0.139 | 0.344 | 0.978 |
| Phase 4 vs. Phase 3 | 0.208 | 0.299 | 0.898 | 0.441 | 0.273 | 0.367 |
| Temperature | 0.005 | 0.013 | 0.701 | 0.024 | 0.012 | 0.051 |
| Day of Week | 0.057 | 0.217 | 0.794 | −0.157 | 0.198 | 0.428 |
| Phase Comparison | β | SE | p |
|---|---|---|---|
| Phase 2 vs. Phase 1 | −0.433 | 0.362 | 0.627 |
| Phase 3 vs. Phase 1 | −0.676 | 0.290 | 0.090 |
| Phase 4 vs. Phase 1 | 0.285 | 0.299 | 0.775 |
| Phase 3 vs. Phase 2 | −0.244 | 0.358 | 0.903 |
| Phase 4 vs. Phase 2 | 0.717 | 0.359 | 0.187 |
| Phase 4 vs. Phase 3 | 0.961 | 0.281 | 0.003 |
| Temperature | 0.008 | 0.013 | 0.548 |
| Day of Week | −0.037 | 0.207 | 0.860 |
Publisher’s Note: MDPI stays neutral with regard to jurisdictional claims in published maps and institutional affiliations. |
© 2022 by the authors. Licensee MDPI, Basel, Switzerland. This article is an open access article distributed under the terms and conditions of the Creative Commons Attribution (CC BY) license (https://creativecommons.org/licenses/by/4.0/).
Share and Cite
Edes, A.N.; Liu, N.C.; Baskir, E.; Bauman, K.L.; Kozlowski, C.P.; Clawitter, H.L.; Powell, D.M. Comparing Space Use and Fecal Glucocorticoid Concentrations during and after the COVID-19 Closure to Investigate Visitor Effects in Multiple Species. J. Zool. Bot. Gard. 2022, 3, 328-348. https://doi.org/10.3390/jzbg3030026
Edes AN, Liu NC, Baskir E, Bauman KL, Kozlowski CP, Clawitter HL, Powell DM. Comparing Space Use and Fecal Glucocorticoid Concentrations during and after the COVID-19 Closure to Investigate Visitor Effects in Multiple Species. Journal of Zoological and Botanical Gardens. 2022; 3(3):328-348. https://doi.org/10.3390/jzbg3030026
Chicago/Turabian StyleEdes, Ashley N., Nathan C. Liu, Eli Baskir, Karen L. Bauman, Corinne P. Kozlowski, Helen L. Clawitter, and David M. Powell. 2022. "Comparing Space Use and Fecal Glucocorticoid Concentrations during and after the COVID-19 Closure to Investigate Visitor Effects in Multiple Species" Journal of Zoological and Botanical Gardens 3, no. 3: 328-348. https://doi.org/10.3390/jzbg3030026