
Location, Location, Location! Evaluating Space Use of Captive Aquatic Species—A Case Study with Elasmobranchs


Abstract
:1. Introduction
2. Materials and Methods
2.1. Subjects
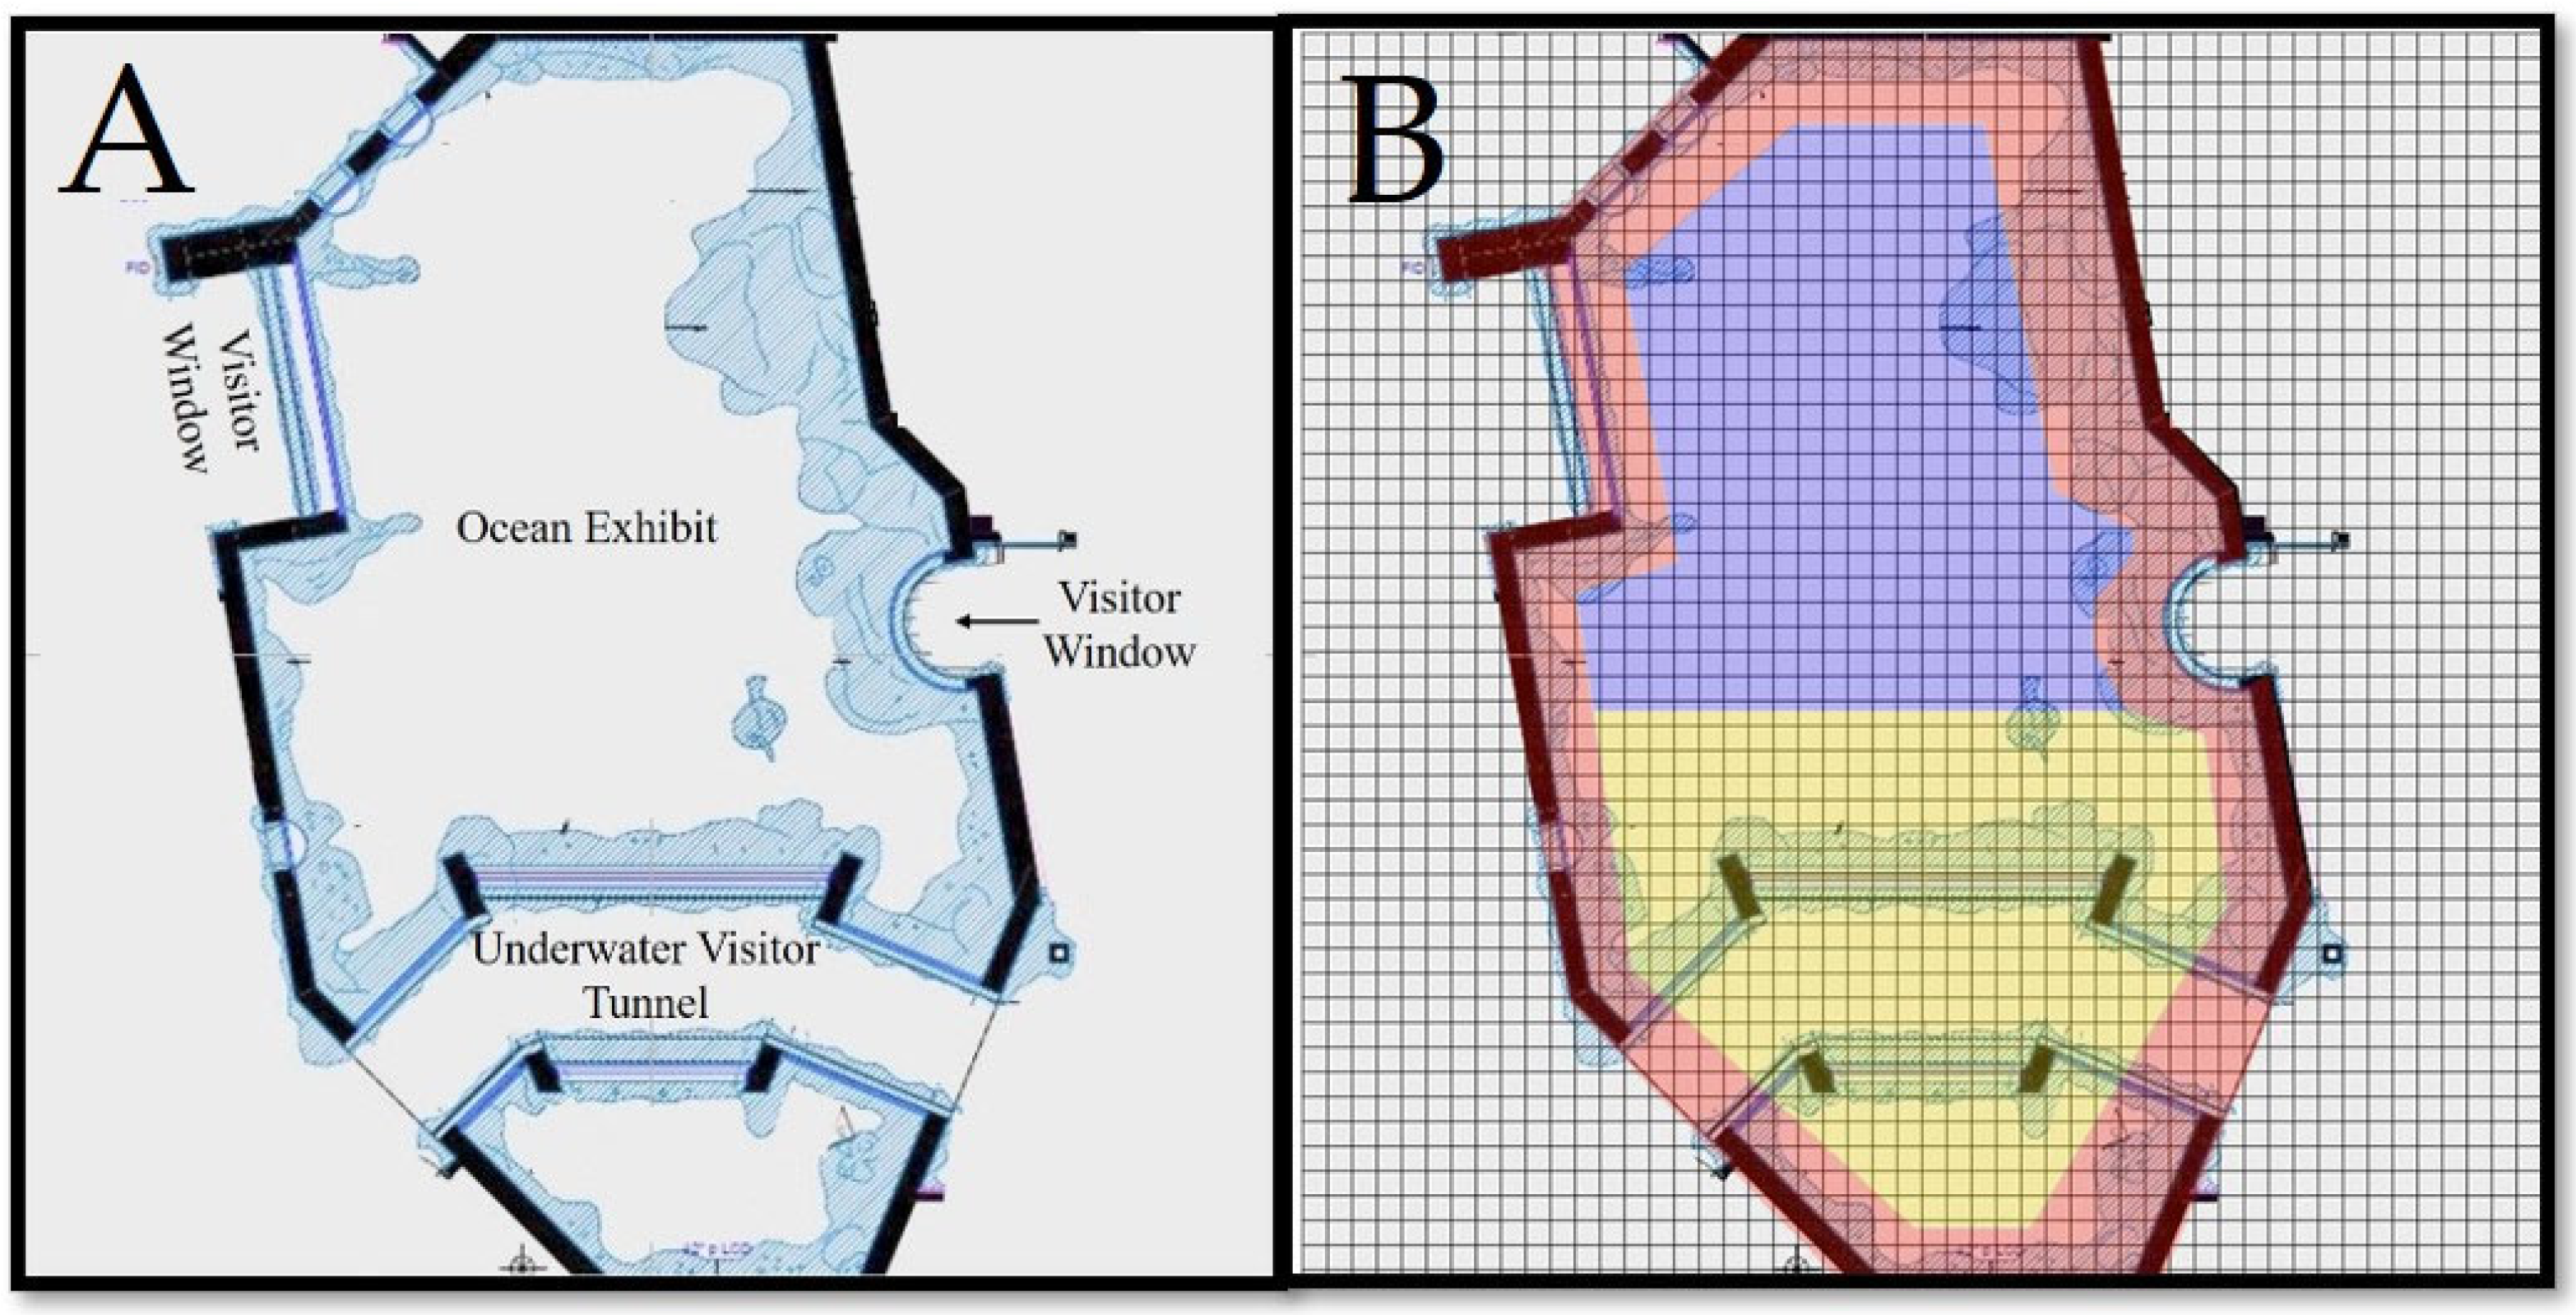
2.2. Exhibit
2.3. Data Collection
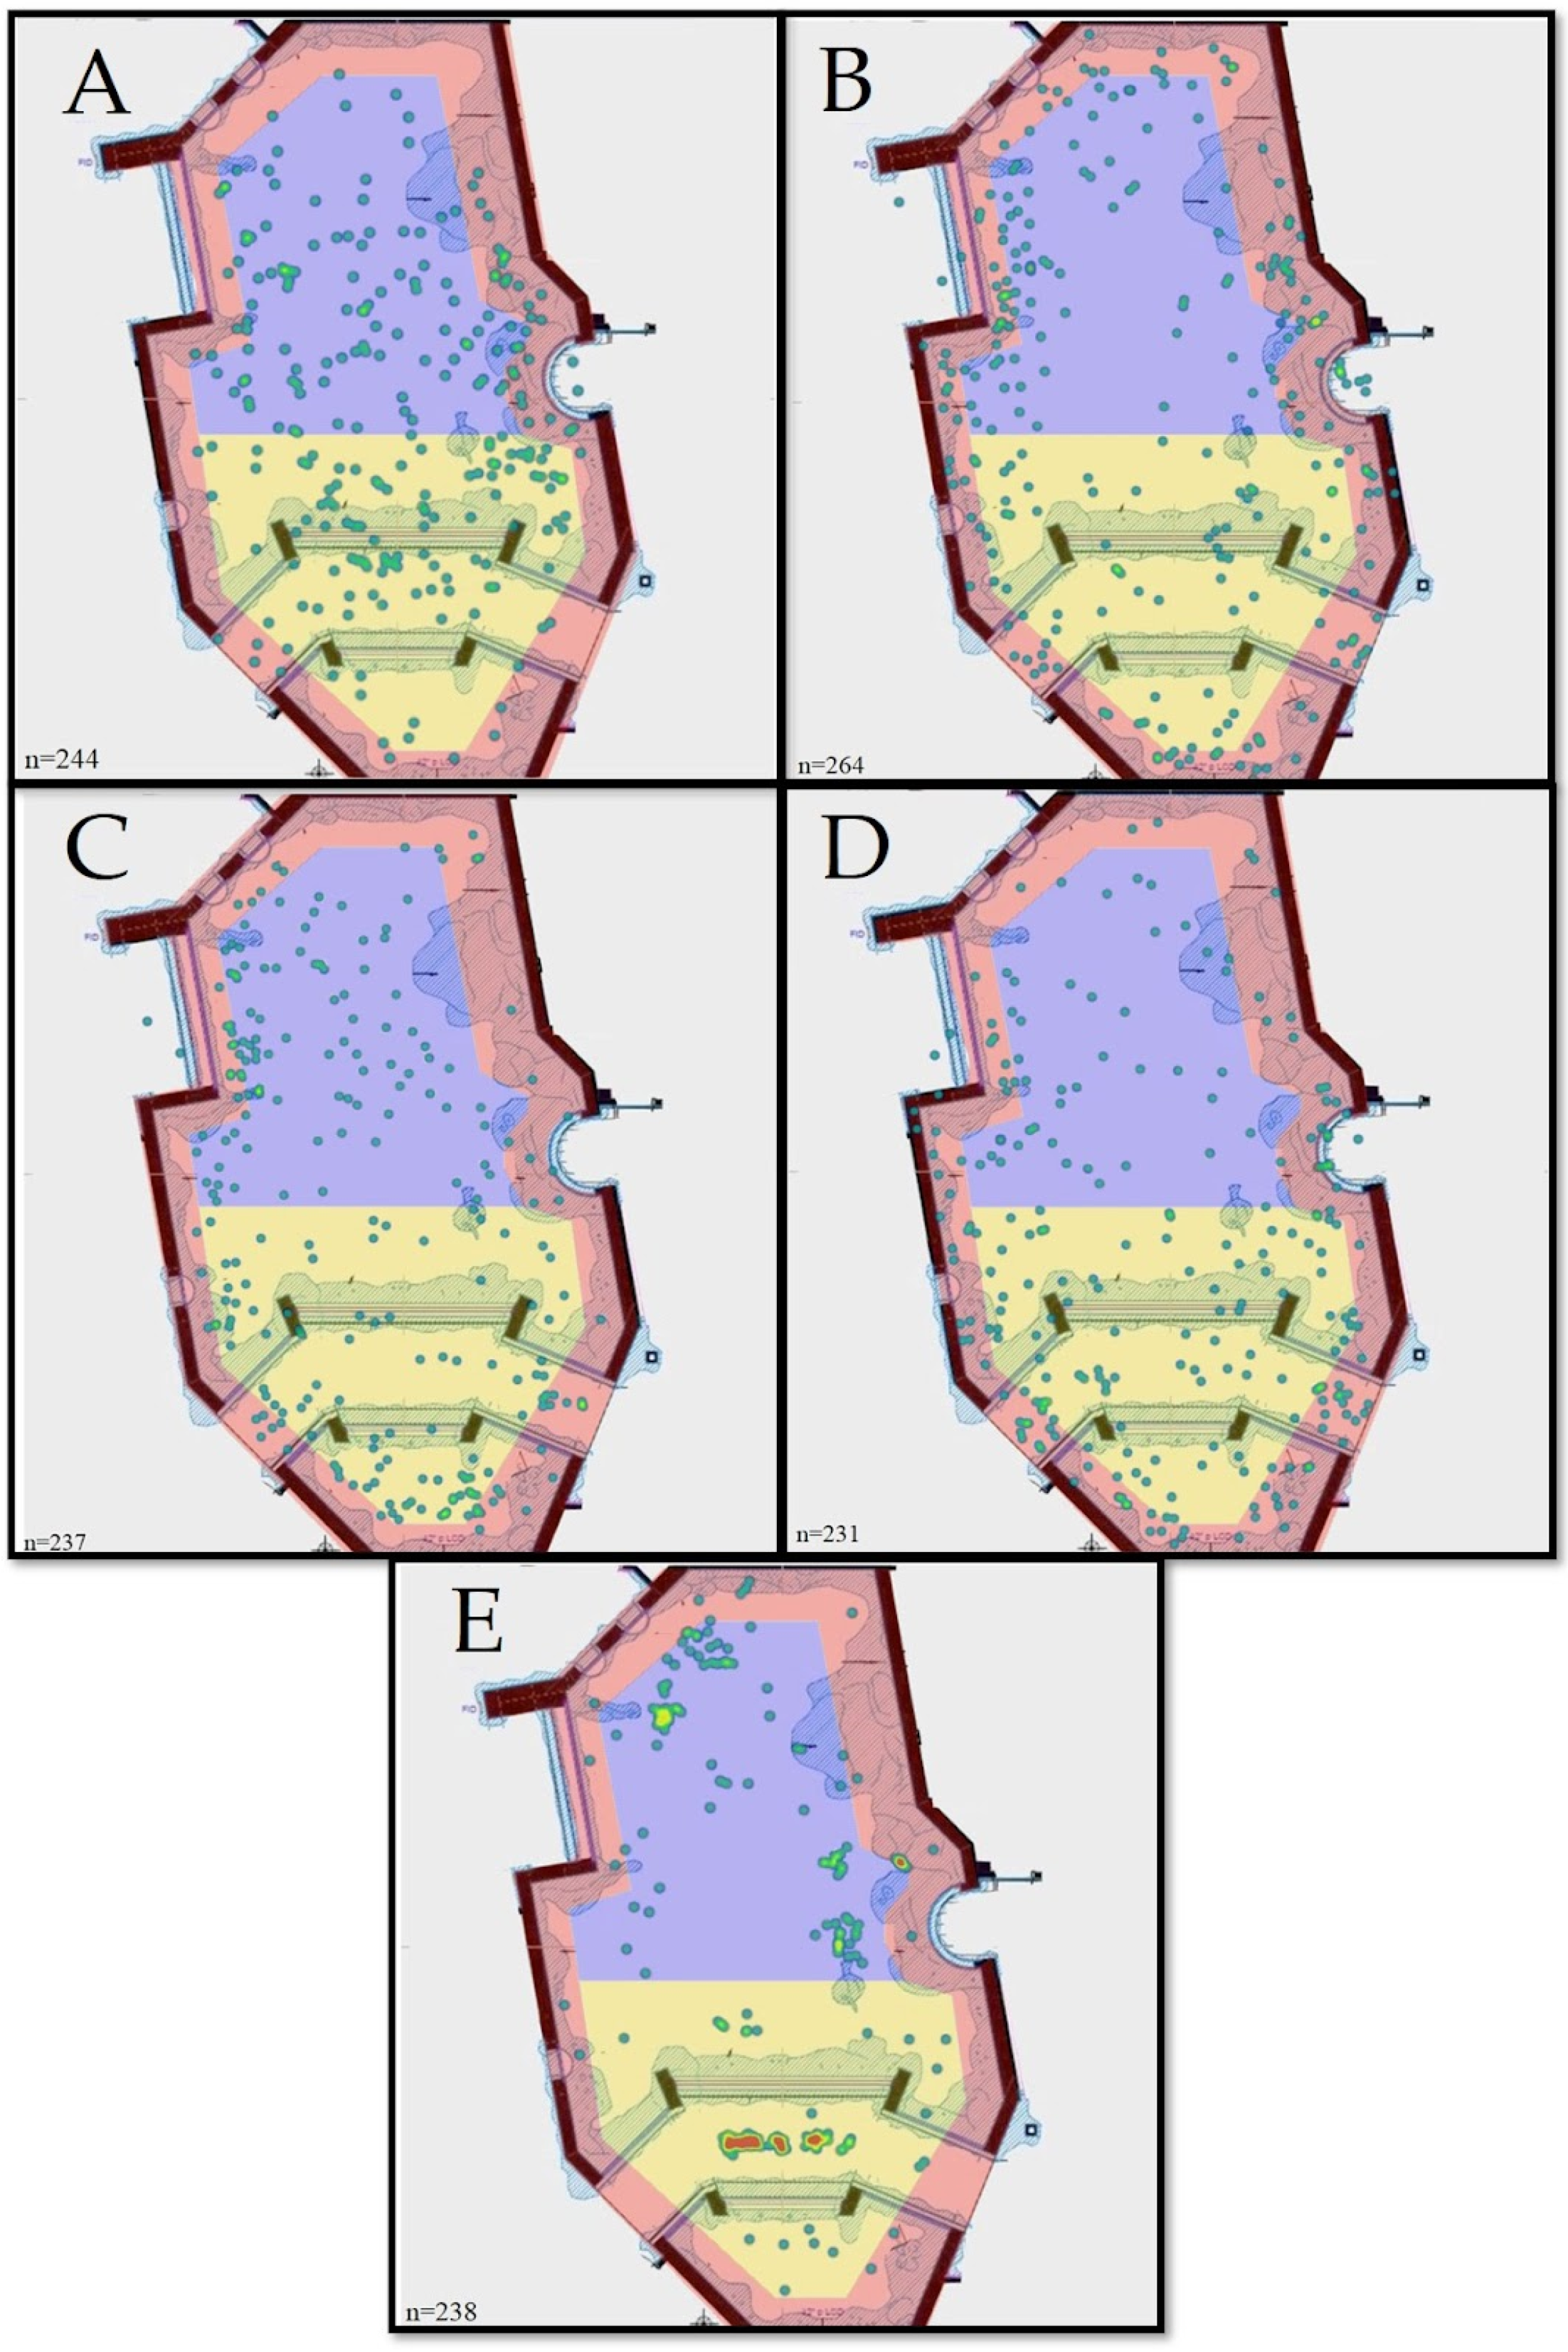
2.4. Data Analysis
3. Results
4. Discussion
Author Contributions
Funding
Institutional Review Board Statement
Informed Consent Statement
Data Availability Statement
Acknowledgments
Conflicts of Interest
References
- Goff, C.; Howell, S.M.; Fritz, J.; Nankivell, B. Space use and proximity of captive chimpanzee (Pan troglodytes) mother/offspring pairs. Zoo Biol. 1994, 13, 61–68. [Google Scholar] [CrossRef]
- Mallapur, A.; Qureshi, Q.; Chellam, R. Enclosure design and space utilization by Indian leopards (Panthera pardus) in four zoos in southern India. J. Appl. Anim. Welf. Sci. 2002, 5, 111–124. [Google Scholar] [CrossRef]
- Rose, P.E.; Brereton, J.E.; Croft, D.P. Measuring welfare in captive flamingos: Activity patterns and exhibit usage in zoo-housed birds. Appl. Anim. Behav. Sci. 2018, 205, 115–125. [Google Scholar] [CrossRef]
- Ross, S.R.; Schapiro, S.J.; Hau, J.; Lukas, K. Space use as an indicator of enclosure appropriateness: A novel measure of captive animal welfare. Appl. Anim. Behav. Sci. 2009, 121, 42–50. [Google Scholar] [CrossRef]
- Wark, J.D.; Cronin, K.A.; Niemann, T.; Shender, M.A.; Horrigan, A.; Kao, A.; Ross, M.R. Monitoring the behavior and habitat use of animals to enhance welfare using the ZooMonitor app. Anim. Behav. Cognit. 2019, 6, 158–167. [Google Scholar] [CrossRef]
- Breton, G.; Barrot, S. Influence of enclosure size on the distances covered and paced by captive tigers (Panthera tigris). Appl. Anim. Behav. Sci. 2014, 154, 66–75. [Google Scholar] [CrossRef]
- Troxell-Smith, S.; Miller, L. Using natural history information for zoo animal management: A case study with okapi (Okapia johnstoni). J. Zoo Aquar. Res. 2016, 4, 38–41. [Google Scholar]
- Whitney, N.M.; Lear, K.O.; Gaskins, L.C.; Gleiss, A.C. The effects of temperature and swimming speed on the metabolic rate of the nurse shark (Ginglymostoma cirratum, Bonaterre). J. Exp. Mar. Biol. Ecol. 2016, 477, 40–46. [Google Scholar] [CrossRef] [Green Version]
- Clark, F.E.; Melfi, V.A. Environmental enrichment for a mixed-species nocturnal mammal exhibit. Zoo Biol. 2012, 31, 397–413. [Google Scholar] [CrossRef]
- Fábregas, M.C.; Guillén-Salazar, F.; Garcés-Narro, C. Do naturalistic enclosures provide suitable environments for zoo animals? Zoo Biol. 2012, 31, 362–373. [Google Scholar] [CrossRef] [PubMed]
- Brereton, J.E. Current directions in animal enclosure use studies. J. Zoo Aquar. Res. 2020, 8, 1–9. [Google Scholar]
- Kolarevic, J.; Baeverfjord, G.; Takle, H.; Ytteborg, E.; Kristin, B.; Reiten, M.; Nergård, S.; Terjesen, B.F. Performance and welfare of Atlantic salmon smolt reared in recirculating or flow through aquaculture systems. Aquaculture 2014, 432, 15–25. [Google Scholar] [CrossRef]
- De Freitas Souza, C.; Baldissera, M.D.; Baldisserotto, B.; Heinzmann, B.M.; Martos-Sitcha, J.A.; Mancera, J.M. Essential oils as a stress-reducing agents for fish aquaculture: A review. Front. Physiol. 2019, 10, 785. [Google Scholar] [CrossRef] [Green Version]
- Ross, M.R.; Niemann, T.; Wark, J.D.; Heintz, M.R.; Horrigan, A.; Cronin, K.A.; Shender, M.A.; Gillespie, K. ZooMonitor (Version 1) (Mobile Application Software). Available online: https://zoomonitor.org (accessed on 10 March 2022).
- Saiyed, S.T.; Hopper, L.M.; Cronin, K.A. Evaluating the behavior and temperament of African penguins in a non-contact animal encounter program. Animals 2019, 9, 326. [Google Scholar] [CrossRef] [PubMed] [Green Version]
- Fazio, J.M.; Barthel, T.; Freeman, E.W.; Garlick-Ott, K.; Scholle, A.; Brown, J.L. Utilizing camera traps, closed circuit cameras and behavior observation software to monitor activity budgets, habitat use, and social interactions of zoo-housed Asian elephants (Elephas maximus). Animals 2020, 10, 2026. [Google Scholar] [CrossRef]
- Huskisson, S.M.; Doelling, C.R.; Ross, S.R.; Hopper, L.M. Assessing the potential impact of zoo visitors on the welfare and cognitive performance of Japanese macaques. Appl. Anim. Behav. Sci. 2021, 243, 105453. [Google Scholar] [CrossRef]
- Hart, A.; Reynolds, Z.; Troxell-Smith, S.M. Using individual-specific conditioning to reduce stereotypic behaviours: A study on smooth dogfish (Mustelus canis) in captivity. J. Zoo Aquar. Res. 2021, 9, 193–199. [Google Scholar]
- Preiser, W.F.E.; Rabinowitz, H.Z.; White, E.T. Post-Occupancy Evaluation, 1st ed.; Van Nostrand Reinhold: New York, NY, USA, 1988. [Google Scholar]
- Hadjri, K.; Crozier, C. Post-occupancy evaluation: Purpose, benefits and barriers. Facilities 2009, 27, 21–33. [Google Scholar] [CrossRef]
- Kelling, A.S.; Gaalema, D.E. Post-occupancy evaluations in zoological settings. Zoo Biol. 2011, 30, 597–610. [Google Scholar] [CrossRef]
- Dickens, M. A statistical formula to quantify the “spread-of-participation” in group discussion. Speech Monogr. 1995, 22, 28–30. [Google Scholar] [CrossRef]
- Plowman, A.B. A note on a modification of the spread of participation index allowing for unequal zones. Appl. Anim. Behav. Sci. 2003, 83, 331–336. [Google Scholar] [CrossRef]
- Vanderploeg, H.A.; Scavia, D. Two electivity indices for feeding with special reference to zooplankton grazing. J. Fish. Board Can. 1979, 36, 362–365. [Google Scholar] [CrossRef]
- Brereton, J.E.; Fernandez, E.J. Which index should I use? A comparison of indices for enclosure use studies. Anim. Behav. Cognit. 2022, 9, 119–132. [Google Scholar] [CrossRef]
- Richard, H. Welfare and Ethics in Aquatic Collections. Available online: https://www.aza.org/connect-stories/stories/animal-welfare-in-aquariums?locale=en (accessed on 10 March 2022).
- Altmann, J. Observational study of behavior: Sampling methods. Behaviour 1974, 49, 227–267. [Google Scholar] [CrossRef] [Green Version]
- Gehlenborg, N.; Wong, B. Points of view: Heat maps. Nat. Methods 2012, 9, 213. [Google Scholar] [CrossRef] [PubMed]
- Castro, J.I. The biology of the nurse shark, Ginglymostoma cirratum, off the Florida east coast and the Bahama Islands. Env. Biol. Fish. 2000, 58, 1–22. [Google Scholar] [CrossRef]
- Dapp, D.R.; Walker, T.I.; Huveneers, C.; Reina, R.D. Respiratory mode and gear type are important determinants of elasmobranch immediate and post-release mortality. Fish Fish. 2016, 17, 507–524. [Google Scholar] [CrossRef]
- Talwar, B.S.; Bouyoucos, I.A.; Brooks, E.J.; Brownscombe, J.W.; Suski, C.D.; Cooke, S.J.; Grubbs, R.D.; Mandelman, J.W. Variation in behavioural responses of sub-tropical marine fishes to experimental longline capture. ICES J. Mar. Sci. 2020, 77, 2763–2775. [Google Scholar] [CrossRef]
- Kelly, M.L.; Spreitzenbarth, S.; Kerr, C.C.; Hemmi, J.M.; Lesku, J.A.; Radford, C.A.; Collin, S.P. Behavioural sleep in two species of buccal pumping sharks (Heterodontus portusjacksoni and Cephaloscyllium isabellum). J. Sleep Res. 2020, 30, e13139. [Google Scholar] [CrossRef]
- Motta, P.J.; Hueter, R.E.; Tricas, T.C.; Summers, A.P.; Huber, D.R.; Lowry, D.; Mara, K.R.; Matott, M.P.; Whitenack, L.B.; Wintzer, A.P. Functional morphology of the feeding apparatus, feeding constraints, and suction performance in the nurse shark Ginglymostoma cirratum. J. Morph. 2008, 269, 1041–1055. [Google Scholar] [CrossRef]
- Mullins, L.L.; Drymon, J.M.; Moore, M.; Skarke, A.; Moore, A.; Rodgers, J.C. Defining distribution and habitat use of west-central Florida’s coastal sharks through a research and education program. Eco. Evo. 2021, 11, 16055–16069. [Google Scholar] [CrossRef] [PubMed]
- Schwieterman, G.D.; Winchester, M.M.; Shiels, H.A.; Bushnell, P.G.; Bernal, D.B.; Marshall, H.M.; Brill, R.W. The effects of elevated potassium, acidosis, reduced oxygen levels, and temperature on the functional properties of isolated myocardium from three elasmobranch fishes: Clearnose skate (Rostrojara aglanteria), smooth dogfish (Mustelus canis), and sandbar shark (Carcharhinus plumbeus). J. Comp. Physiol. B 2021, 191, 127–241. [Google Scholar]
- Carlson, J.K.; Parsons, G.R. Respiratory and hematological responses of the bonnethead shark, Sphyrna tibuto, to acute changes in dissolved oxygen. J. Exp. Mari. Biol. Ecol. 2003, 294, 15–26. [Google Scholar] [CrossRef]
- Kelly, M.L.; Murray, E.R.P.; Kerr, C.C.; Radford, C.A.; Collin, S.P.; Lesku, J.A.; Hemmi, J.M. Diverse activity rhythms in sharks (Elasmobranchii). J. Biol. Rhythm. 2020, 35, 476–488. [Google Scholar] [CrossRef]
- Larsen, J.; Bushnell, P.; Steffensen, J.; Pedersen, M.; Qvortrup, K.; Brill, R. Characterization of the functional and anatomical differences in the atrial and ventricular myocardium from three species of elasmobranch fishes: Smooth dogfish (Mustelus canis), sandbar shark (Carcharhinus plumbeus) and clearnose skate (Raja eglanteria). J. Comp. Physiol. B 2016, 187, 291–313. [Google Scholar] [CrossRef] [PubMed]
- Gelsleichter, J.; Musick, J.A.; Nichols, S. Food habits of the smooth dogfish, Mustelus canis, dusky shark, Carcharhinus obscurus, Atlantic sharpnose shark, Rhizoprionodon terraenovae, and the sand tiger, Carcharias taurus, from the northwest Atlantic Ocean. Env. Biol. Fish. 1999, 54, 205–217. [Google Scholar] [CrossRef]
- Species Survival Plan® Programs. Available online: https://www.aza.org/species-survival-plan-programs (accessed on 14 May 2022).
- IUCN. The IUCN Red List of Threatened Species. Version 2021-3. 2021. Available online: https://www.iucnredlist.org (accessed on 18 May 2022).


| Exhibit Use | Depth Use | ||||||||
|---|---|---|---|---|---|---|---|---|---|
| Number of Data Points in Each Zone | Number of Data Points in Each Zone | ||||||||
| Individual | A | B | C | Total | SPI | Upper Water Column | Lower Water Column | Total | SPI |
| Blacktip reef shark | 85 (35.9%) | 78 (32.9%) | 74 (31.2%) | 237 | 0.0378 ⬥ | 199 (84.0%) | 38 (16.0%) | 237 | 0.679 ⬥ |
| Bonnethead shark | 104 (42.6%) | 94 (38.5%) | 46 (18.9%) | 244 | 0.217 | 234 (95.9%) | 10 (4.1%) | 244 | 0.922 ⬥⬥ |
| Blacknose shark | 54 (20.4%) | 73 (27.7%) | 137 (51.9%) | 264 | 0.278 | 242 (91.7%) | 22 (8.3%) | 264 | 0.833 |
| Smooth dogfish shark | 72 (31.2%) | 33 (14.3%) | 126 (54.5%) | 231 | 0.318 | 221 (95.7%) | 10 (4.3%) | 231 | 0.913 |
| Nurse shark | 110 (46.2%) | 107 (45.0%) | 21 (8.8%) | 238 | 0.367 ⬥⬥ | 30 (12.6%) | 208 (87.4%) | 238 | 0.761 |
Publisher’s Note: MDPI stays neutral with regard to jurisdictional claims in published maps and institutional affiliations. |
© 2022 by the authors. Licensee MDPI, Basel, Switzerland. This article is an open access article distributed under the terms and conditions of the Creative Commons Attribution (CC BY) license (https://creativecommons.org/licenses/by/4.0/).
Share and Cite
Hart, A.M.; Reynolds, Z.; Troxell-Smith, S.M. Location, Location, Location! Evaluating Space Use of Captive Aquatic Species—A Case Study with Elasmobranchs. J. Zool. Bot. Gard. 2022, 3, 246-255. https://doi.org/10.3390/jzbg3020020
Hart AM, Reynolds Z, Troxell-Smith SM. Location, Location, Location! Evaluating Space Use of Captive Aquatic Species—A Case Study with Elasmobranchs. Journal of Zoological and Botanical Gardens. 2022; 3(2):246-255. https://doi.org/10.3390/jzbg3020020
Chicago/Turabian StyleHart, Alexis M., Zac Reynolds, and Sandra M. Troxell-Smith. 2022. "Location, Location, Location! Evaluating Space Use of Captive Aquatic Species—A Case Study with Elasmobranchs" Journal of Zoological and Botanical Gardens 3, no. 2: 246-255. https://doi.org/10.3390/jzbg3020020