Article

Experimental Study and Thermodynamic Analysis of Carbon Dioxide Adsorption onto Activated Carbons Prepared from Biowaste Raw Materials

by
Olga V. Solovtsova
*,
Ilya E. Men’shchikov
,
Andrey V. Shkolin
,
Alexander E. Grinchenko
,
Elena V. Khozina
* and
Anatoly A. Fomkin
A.N. Frumkin Institute of Physical Chemistry and Electrochemistry, Leninskii pr. 31/4, 119071 Moscow, Russia
*
Authors to whom correspondence should be addressed.
Gases 2023, 3(3), 112-135; https://doi.org/10.3390/gases3030008
Submission received: 5 June 2023 / Revised: 2 July 2023 / Accepted: 9 August 2023 / Published: 14 August 2023

Abstract

:
Nutshells are regarded as cost-effective and abundant raw materials for producing activated carbons (ACs) for CO2 capture, storage, and utilization. The effects of carbonization temperature and thermochemical KOH activation conditions on the porous structure as a BET surface, micropore volume, micropore width, and pore size distribution of ACs prepared from walnut (WNS) and hazelnut (HNS) shells were investigated. As a result, one-step carbonization at 900/800 °C and thermochemical KOH activation with a char/KOH mass ratio of 1:2/1:3 were found to be optimal for preparing ACs from WNS/HNS: WNS-AC-3 and HNS-AC-2, respectively. The textural properties of the WNS/HNS chars and ACs were characterized by low-temperature nitrogen vapor adsorption, XRD, and SEM methods. Dubinin’s theory of volume filling of micropores was used to evaluate the microporosity parameters and to calculate the CO2 adsorption equilibrium over the sub- and supercritical temperatures from 216.4 to 393 K at a pressure up to 10 MPa. The CO2 capture capacities of WNS- and HNS-derived adsorbents reached 5.9/4.1 and 5.4/3.9 mmol/g at 273/293 K under 0.1 MPa pressure, respectively. A discrepancy between the total and delivery volumetric adsorption capacities of the adsorbents was attributed to the strong binding of CO2 molecules with the adsorption sites, which were mainly narrow micropores with a high adsorption potential. The high initial differential heats of CO2 adsorption onto ACs of ~32 kJ/mol confirmed this proposal. The behaviors of thermodynamic functions (enthalpy and entropy) of the adsorption systems were attributed to changes in the state of adsorbed CO2 molecules determined by a balance between attractive and repulsive CO2–CO2 and CO2–AC interactions during the adsorption process. Thus, the chosen route for preparing ACs from the nutshells made it possible to prepare efficient carbon adsorbents with a relatively high CO2 adsorption performance due to a substantial volume of micropores with a size in the range of 0.6–0.7 nm.

1. Introduction

Currently, the most pressing issue that necessitates a revision of the existent technological practice is the severity of the major environmental challenges, such as climate change and global warming brought on by the greenhouse effect. Carbon dioxide is the primary greenhouse gas produced by burning fossil fuels. The governments of many countries make an effort to control greenhouse gas emissions. In 2015, the participating countries ratified the Paris Agreement and pledged to reduce greenhouse gas emissions with the goal of preventing a rise in global temperature of more than 2 degrees Celsius above current levels by the end of this century [1].
Carbon dioxide capture/storage (CCS) technology consists of carbon dioxide sequestration directly from exhaust gases from industrial sources followed by its transportation and long-term underground storage. Carbon dioxide can also be utilized to produce valuable materials like plastics, concrete, or biofuels while maintaining the carbon neutrality of the production processes [2]. The carbon dioxide capture process plays a leading role in these technological chains. For the purpose of carbon dioxide capturing [3,4], various technologies have been developed and put in use, including solvent absorption [5], chemical and physical adsorption [6], membranes [7], and cryogenic separations [8]. Although methods based on chemical absorption, such as chemical absorption through aqueous mixtures of organic amines, gain widespread acceptance in carbon dioxide capture, their use raises concerns about serious environmental damage brought on by the volatile and corrosive components of the absorbing mixture as well as high energy consumption in the regeneration process. Conversely, physical adsorption techniques provide the possibility of handling gas streams with a low content of carbon dioxide and guarantee a high degree of gas separation that is unattainable through other methods [9]. In addition, this method is applicable over a wide range of temperatures and pressures. It should be noted that physical adsorption has the advantages of easy operation, environmental compliance, low cost, and high recovery rate.
The adsorption-based CCS process rests on the principle of adsorption cyclic processes, which consist of multiple cycles of adsorption and desorption (regeneration). The transition from adsorption to desorption is carried out with a pressure swing (PSA), temperature swing (TSA), or vacuum pressure swing (VPSA) [10].
Usually, all-purpose adsorbents like zeolites, calcium oxides, and activated carbons (ACs) are suggested to load the adsorption columns at the large CO2 emission point sources [11]. The adsorption capacity of porous materials depends on several characteristics, including packing density, porosity (pore size and volume), and surface chemistry. The performance of an adsorption-based system for gas capture/delivery depends on the thermal effects that accompany the adsorption/desorption processes.
Currently, material such as ACs [12,13,14,15], zeolites [16], mesoporous silica [17], and metal–organic framework structures (MOF) [18] are used as CO2 adsorbents. Each type of material can be employed successfully in the CCS processes within a given characteristic range of CO2 concentrations. ACs are the most promising adsorbents for the capture of relatively significant amounts of CO2 (more than 1%) because of their extremely high porosity, tunable pore size, and potential for surface functionalization, for example, by amino groups [15,19]. Additionally, ACs meet crucial requirements such as low cost and high availability, adsorption rate, mechanical strength, and easy regenerability.
From an economic point of view, it makes sense to produce ACs at the places of their potential application in the CCS processes. It would therefore be wiser to develop an easy and universal technology for producing ACs with specified properties from local raw materials. This technology can be implemented in the form of a modular plant that can be transported to locations, where (1) appropriate raw materials are abundant and (2) sources of CO2 emissions are concentrated. The plant produces a carbon adsorbent with a tailored porous structure from locally available, naturally occurring biomass resources or waste byproducts from the food crop sector. One can easily adjust the synthesis conditions by altering the carbonization and activation parameters (temperature, activating agent, activation duration, etc.). Such mobile and modular plants for producing adsorbents near CO2 emission sources promise to be economically viable. A similar modular principle was realized in the form of an adsorption plant that consists of several cargo containers loaded with an adsorbent, pumping devices, and other blocks that can be readily transported and quickly put together as specified in the patent [20].
It is worth mentioning that the adsorption-based CCS technology, which uses inexpensive carbon adsorbents prepared from agricultural waste, is a fascinating field because it has two advantages: it reduces the greenhouse gas concentration in the atmosphere and manages waste [12,13,14,15,21,22,23,24,25,26].
Walnut and hazelnut shells, WNS and HNS, are frequently employed as raw materials to produce carbon adsorbents [14,27,28] due to their abundance and low cost. In 2016, 6000–8000 tons of nutshells were produced in Russia, and 40,000–65,000 tons throughout the CIS countries [29]. Carbon adsorbents prepared from WNS and HNS show good chemical stability and mechanical strength, low ash content, and excellent adsorption performance with respect to water purification [30,31] and gas adsorption [32].
Production routes of ACs from seeds and nutshells are well documented [24,25,26,27,28,29,30,31,32,33,34,35,36]. ACs are produced via the chemical or physical activation of char (or non-activated carbon) prepared by carbonizing a raw material (precursor). In the physical activation, oxidant gases (carbon dioxide, air), steam, or their mixture pass through the char at temperatures within a range from 800 to 1000 °C [24]. An activating agent contributes to the final porous structure: CO2 significantly influences the micropores, whereas steam encourages the development of pores with a wide range of sizes [37]. In the thermochemical activation, reagents such as H3PO4, ZnCl2, FeCl3, NaOH, and KOH are mixed with the char and heated at temperatures within a range of 500 to 900 °C [38]. At the last stage, the activating agent and the products of its decomposition are washed out from the pores. The KOH activation is an effective way to obtain ACs with a preset porosity from various organic raw materials [39,40].
Over the past decades, many researchers have focused on the crucial parameters of adsorbents that determine their adsorption behaviors with respect to carbon dioxide [9,11,34,36,39,41,42,43,44,45,46,47,48,49,50,51]. Since, in general, the adsorption of carbon dioxide (weak Lewis acid) is often considered a combination of chemosorption and physical adsorption [46], two factors such as the surface chemical properties and pore structure of an adsorbent are responsible for its adsorption capacity. Shafeeyan and coauthors analyzed various methods of chemical modification of ACs and came to the conclusion that the introduction of nitrogen-containing functionalities and the decomposition of oxygen-containing acidic groups contribute to CO2 adsorption capacity [42]. These findings were supported by the experimental data and the results of molecular dynamics simulations carried out by Khosrowshahi et al., who found a downstream impact of various surface functionalities on CO2 adsorption enhancement and adsorption kinetics: presence of both carboxyl-hydroxyl groups and graphite pyridinic nitrogen species > only pyridinic nitrogen species > carboxylic groups > hydroxylic groups [43]. Kwiatkowski and coauthors revealed the high CO2 adsorption capacity of S-doped microporous carbon adsorbents [44]. Moreover, Seema et al. showed that S-doped microporous carbon material was more efficient in capturing CO2 than similarly prepared N-doped microporous carbon [45]. Based on the results of both the experimental measurements and the grand canonical Monte Carlo calculations, Ma et al. also emphasized the fact that the CO2 adsorption capacity of microporous ACs was sensitive to the presence of carboxyl and hydroxyl groups due to their strong electrostatic interactions with CO2 [46]. At the same time, according to their estimates, the impact of the porous structure of microporous carbon adsorbents accounted for about 63% of CO2 uptake. There are numerous experimental and theoretical studies that point to the key role of micropores with a size less than 0.8–0.9 nm in the effective performance of ACs as efficient adsorbents of carbon dioxide [36,39,47,48,49]. Presser et al. obtained a linear correlation between the CO2 adsorption capacity of the nitrogen-free carbide-derived ACs and the volume of pores with a size less than 0.8 nm [47]. An effect of adsorption pressure on the pore size, which contributes the most to CO2 adsorption, was found [47,48,49]. Numerical simulations by Yakovlev with coworkers [50], who used the Dubinin theory of volume filling of micropores (TVFM) [52,53], revealed that a carbon adsorbent with a slit-like micropore width of ~0.9 nm and a characteristic energy of adsorption of ~25 kJ/mol could exhibit the optimal CO2 adsorption (capture)/desorption behaviors. At a temperature of 293 K and a pressure P = 10 bar, such a model microporous carbon structure showed a CO2 volumetric adsorption capacity of up to 423 m3(NTP)/m3. The deliverable volume of CO2 was found to achieve a value of 305 m3(NTP)/m3 at a pressure drop from 10 to 1 bar at T = 293 K.
Summarizing the above, one can conclude that the specific features of microporosity of ACs, whose development is dependent on raw materials and activation conditions, determines their ability to adsorb carbon dioxide [51].
The present study aimed to examine the synthesis of ACs from WN and HN shells with the optimal porous structure for CO2 capture. We examined the influence of carbonization and activation conditions on the porous structure of the resulting ACs and their adsorption behaviors with the aid of measurements of nitrogen vapor adsorption at 77 K. The morphology and elemental composition of the final carbon adsorbents were investigated using the methods of X-ray diffraction and scanning electron microscopy, respectively. We studied the CO2 adsorption behaviors of the adsorbents over the sub- and supercritical temperatures using experimental data and the calculations using Dubinin’s theory of volume filling of micropores (TVFM) [51,52]. The total and deliverable CO2 adsorption capacities of the AC adsorbents were evaluated. The performance of an adsorption system depends both on the adsorption capacity of a porous material with respect to a target gas and the amount of heat released/absorbed during accumulation/delivery (or adsorption and desorption) processes [54,55,56,57,58,59]. Therefore, the evaluation of thermodynamic state functions of adsorption systems, such as heat of adsorption, enthalpy, entropy, and heat capacity, is an important stage in designing the heat management of adsorption-based industrial processes. As a first step in this direction, we estimated these thermodynamic parameters for the CO2–AC adsorption systems as a function of CO2 uptake and temperature.

2. Materials and Methods

2.1. Synthesis of Activated Carbons from Hazelnut and Walnut Shells

In the present study, two series of carbon adsorbents, WNS-AC and HNS-AC, were prepared from WN and HN shells, respectively. The synthesis of the ACs included the following stages: (1) preliminary treatment of the raw material: washing, drying, and crushing of the WN and HN shells followed by sieving to the particle size of 2–3 mm, and (2) carbonization of the nutshell particles without oxygen access in a muffle oven without oxygen access at a temperature of 600–900 °C (in increments of 100 °C) at a heating rate of 10 °C/min. These temperature ranges were chosen based on the reported data for the synthesis of industrial activated carbons [24]. This was followed by (3) thermochemical activation of the WNS and HNS char samples and (4) washing and drying the resulting ACs to remove chemicals.
Following the declared objective of the study, we considered the carbonization temperature and the carbon/KOH ratio, which largely determine the performance of the synthesis process, as variable parameters.
Before the stage of KOH activation, the porosity parameters of the thus prepared WNS and HNS char samples were analyzed in order to choose the optimal samples for subsequent activation. Each of the chosen WNS and HNS char samples was mixed with KOH in a ratio of 1:1, 1:2, and 1:3 in the steel vessel. The mixtures were placed in an oven. Thermochemical activation was carried out at 800 °C in accordance with a route described in the recent work [60], and the heating rate was 10 °C/min. The samples were kept for 60 min at the proper temperature, and then the oven was turned off.
After cooling, the samples were rinsed with distilled water until the filtrate has a pH of 8. The resulting WNS-AC and HNS-AC adsorbents were dried in the oven at 120 °C for 12 h.

2.2. Adsorptive

High-purity carbon dioxide (99.995%), purchased from Linde Gas Rus (Balashikha, Russia), was used as an adsorptive.
Table 1 lists the physicochemical properties of carbon dioxide, which were used in the analysis and calculations, such as molecular mass M, boiling point Tb [K], critical temperature Tcr [K], critical pressure Pcr [MPa], critical density ρcr [kg/m3], and the kinetic diameter of a molecule dkin [nm].

2.3. Textural Characteristics of the Carbon Adsorbents

The porosity characteristics of both the intermediate samples of char and the ACs prepared from them were calculated from the standard low-temperature (77 K) nitrogen vapor adsorption/desorption isotherms measured with a Quantachrome Autosorb iQ multifunctional surface area analyzer.
The equations of TVFM [51,52] were used to calculate the structural and energy characteristics (SEC) that are descriptive of the micropores of the prepared adsorbents: the intermediate char samples and the corresponding ACs, namely, the specific micropore volume W0 [cm3/g], standard characteristic energy of adsorption E0 [kJ/mol], and the average radius of micropores X0 [nm].
The general TVFM equation is the Dubinin–Astakhov equation:
a = a 0 e x p A E n ,
where a0 [mmol/g] is the maximum amount of adsorbed gas corresponding to the saturation of the pore volume; E [kJ/mol] is the characteristic adsorption energy; A [kJ/mol] is the differential molar work of adsorption; and the power n depends on the type of adsorbent. Since for ACs, n = 2, we employed the well-known Dubinin–Radushkevich equation [51]:
a = a 0 e x p A E 2 ,
to calculate the values of W0, E, and X0.
Here, A is the differential molar work of adsorption, which was calculated by the equation:
A = R T l n f s f ,
where R [J/(mol·K)] is the universal gas constant and f and fs [Pa] are the fugacity of a gas phase in equilibrium and saturated vapor, respectively.
On the assumption that at Ps/P = 1, the adsorbate density (ρad) is equal to the liquid density (ρL), the micropore volume W0 can be calculated from the value of a0:
W 0 = a 0 / ρ L ,
The values of the characteristic energy of nitrogen vapor adsorption E onto the carbon adsorbents are related with the characteristic energy of standard vapor (benzene) via the affinity coefficient of nitrogen and standard vapor (benzene) β:
E = β · E 0 ,
The affinity coefficient β was determined from the ratio of the parachors of nitrogen (Π [(J1/4 × cm5/2)/mol]) and the standard benzene vapors (Π0 [(J1/4 × cm5/2)/mol]) at the boiling points:
β = Π / Π 0 ,
The effective half-width of slit-like micropore X0 was estimated from the characteristic adsorption energy of standard benzene vapor E0 using a semi-empirical relationship derived within a framework of TVFM:
X 0 = 12 / E 0 ,
For all the char and AC samples, the specific surface area, SBET [m2/g], was estimated using the Brunauer–Emmet–Teller (BET) equation with Rouquerol’s criterium for microporous adsorbents [63,64,65]. In addition, the specific surface area of mesopores, SME, was also obtained from the low-temperature nitrogen vapor adsorption/desorption data using the Kelvin equation [66]. The specific mesopore volume, WME [cm3/g], was calculated as the difference W M E = W S W 0 , where WS [cm3/g] is the total pore volume obtained from the low-temperature nitrogen vapor adsorption data at the relative pressure P/Ps = 0.99.
The low-temperature N2 vapor adsorption isotherms were also used to evaluate the pore size distribution (PSD) in the ACs that resulted from the KOH activation with a different content of KOH by employing the nonlocal density functional theory (NLDFT) method [67] and assuming a slit-like pore model.
The surface morphology of the ACs was observed using a JEOL JSM-6060 electron scanning microscope (Oxford Instruments, Abingdon, UK) equipped with an energy-dispersive X-ray (EDX) detector (Oxford Instruments, Abingdon, UK). The surface elemental composition of the ACs was evaluated by averaging the results of ten measurements.
The phase composition of the final carbon adsorbents was determined from the X-ray diffraction (XRD) patterns, which were acquired using an Empyrean (Panalytical BV, Almero, The Netherlands) diffractometer working in Bragg–Brentano geometry and using nickel-filtered CuKα radiation (λCu = 0.1542 nm). A 2θ angular range from 0° to 50° was scanned.

2.4. The Adsorption of Carbon Dioxide onto Carbon Adsorbents Prepared from Nutshells

The CO2 adsorption onto the carbon adsorbents was measured within the pressure range from 0.1 Pa to 0.15 MPa at temperatures of 216.4, 243, 273, 293, and 333 K on a semi-automatic adsorption gravimetric setup [68,69]. The maximum absolute measurement error was ±0.01 mmol/g with a confidence probability of 95%; the average measurement error was about 1.5%.
The CO2 adsorption equilibrium in the high-pressure region (up to 10 MPa) and supercritical temperatures was calculated using the microporosity parameters determined from the low-temperature nitrogen vapor adsorption and the equations of TVFM [52,53,70] applied to carbon dioxide as an adsorbate, namely Equations (2) and (5), in accordance with the well-proven route [71]. The parachor of carbon dioxide (ΠCO2 [(J1/4 × cm5/2)/mol]) at boiling point was obtained from the formula [72]:
Π C O 2 = M · σ 1 4 ρ L ρ v a p o r ,
Here, σ [J/m2] is the surface tension of carbon dioxide, and ρL and ρvapor are the densities of liquid and vapor of carbon dioxide at the boiling temperature.
At temperatures between the boiling point Tb and the critical temperature Tcr, the limiting amount of adsorbed carbon dioxide was calculated using the Dubinin–Nikolaev formula [70]:
a 0 T = a 0 T b exp α T T b .
Here, a0(Tb) is the limiting adsorption achieved at the triple point temperature Tλ, and α = −(dlna0/dT)Ps [1/K] is the thermal coefficient of limiting adsorption.
In the region of supercritical temperatures, the isotherms of CO2 adsorption onto the carbon adsorbents were calculated using Equation (2), where the value of saturated pressure Ps is a result of the linear extrapolation of a function:
ln P s T = M N T .
The constants M and N were evaluated from two characteristic points for carbon dioxide, (Tb, Ps) and (Tcr, Pcr).
From the linear extrapolation of the Dubinin–Nikolaev formula (9), we obtained the value of limiting adsorption a0 at the saturation pressure.

3. Results and Discussion

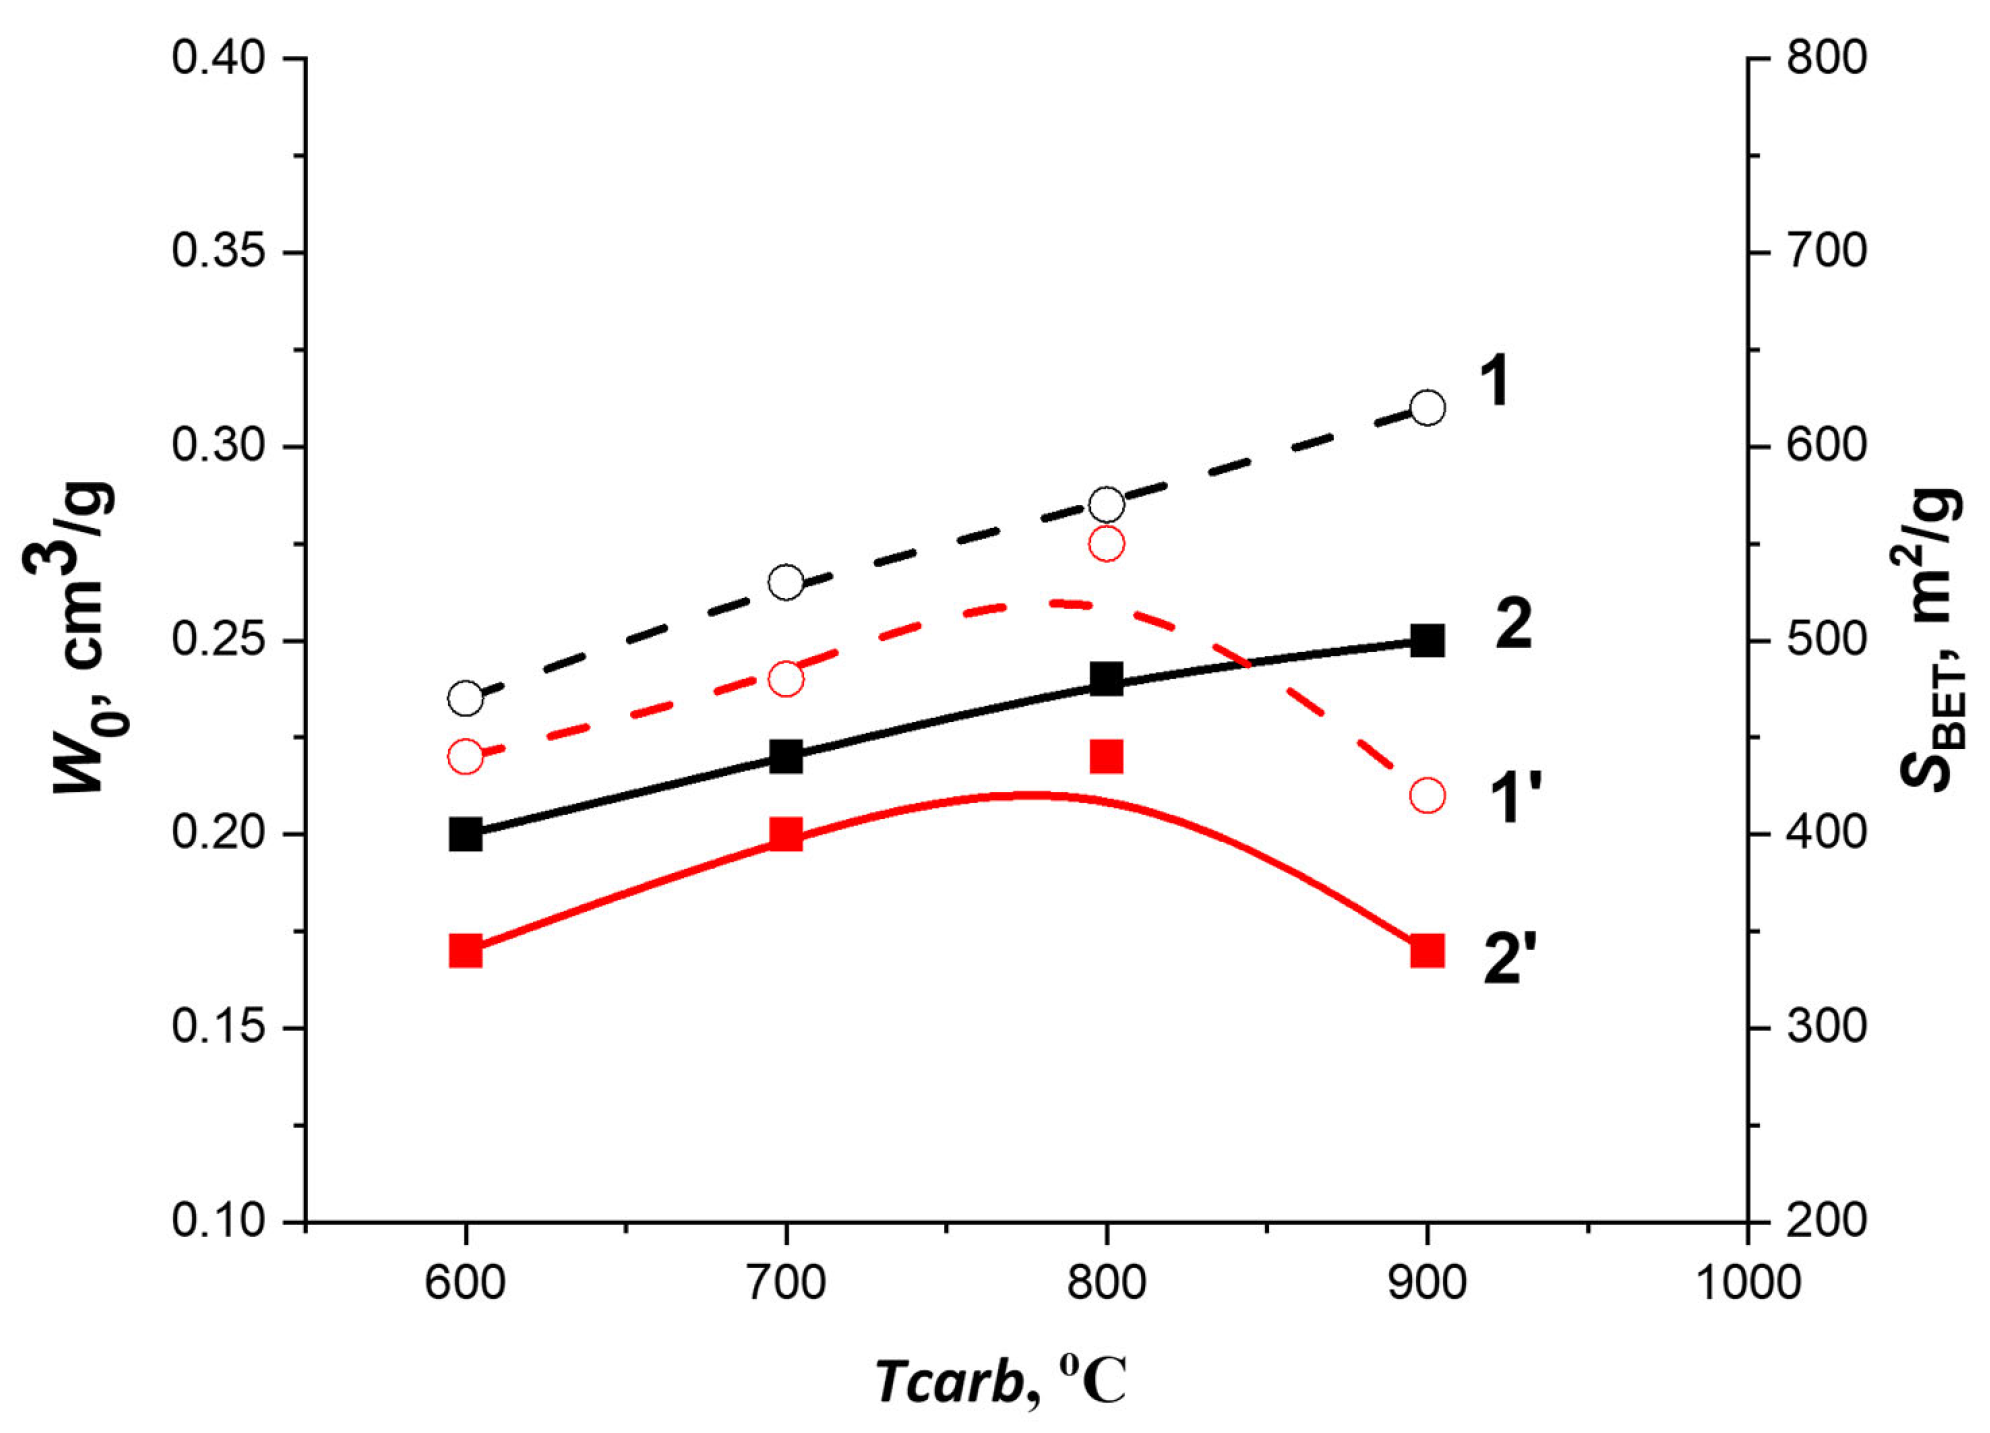
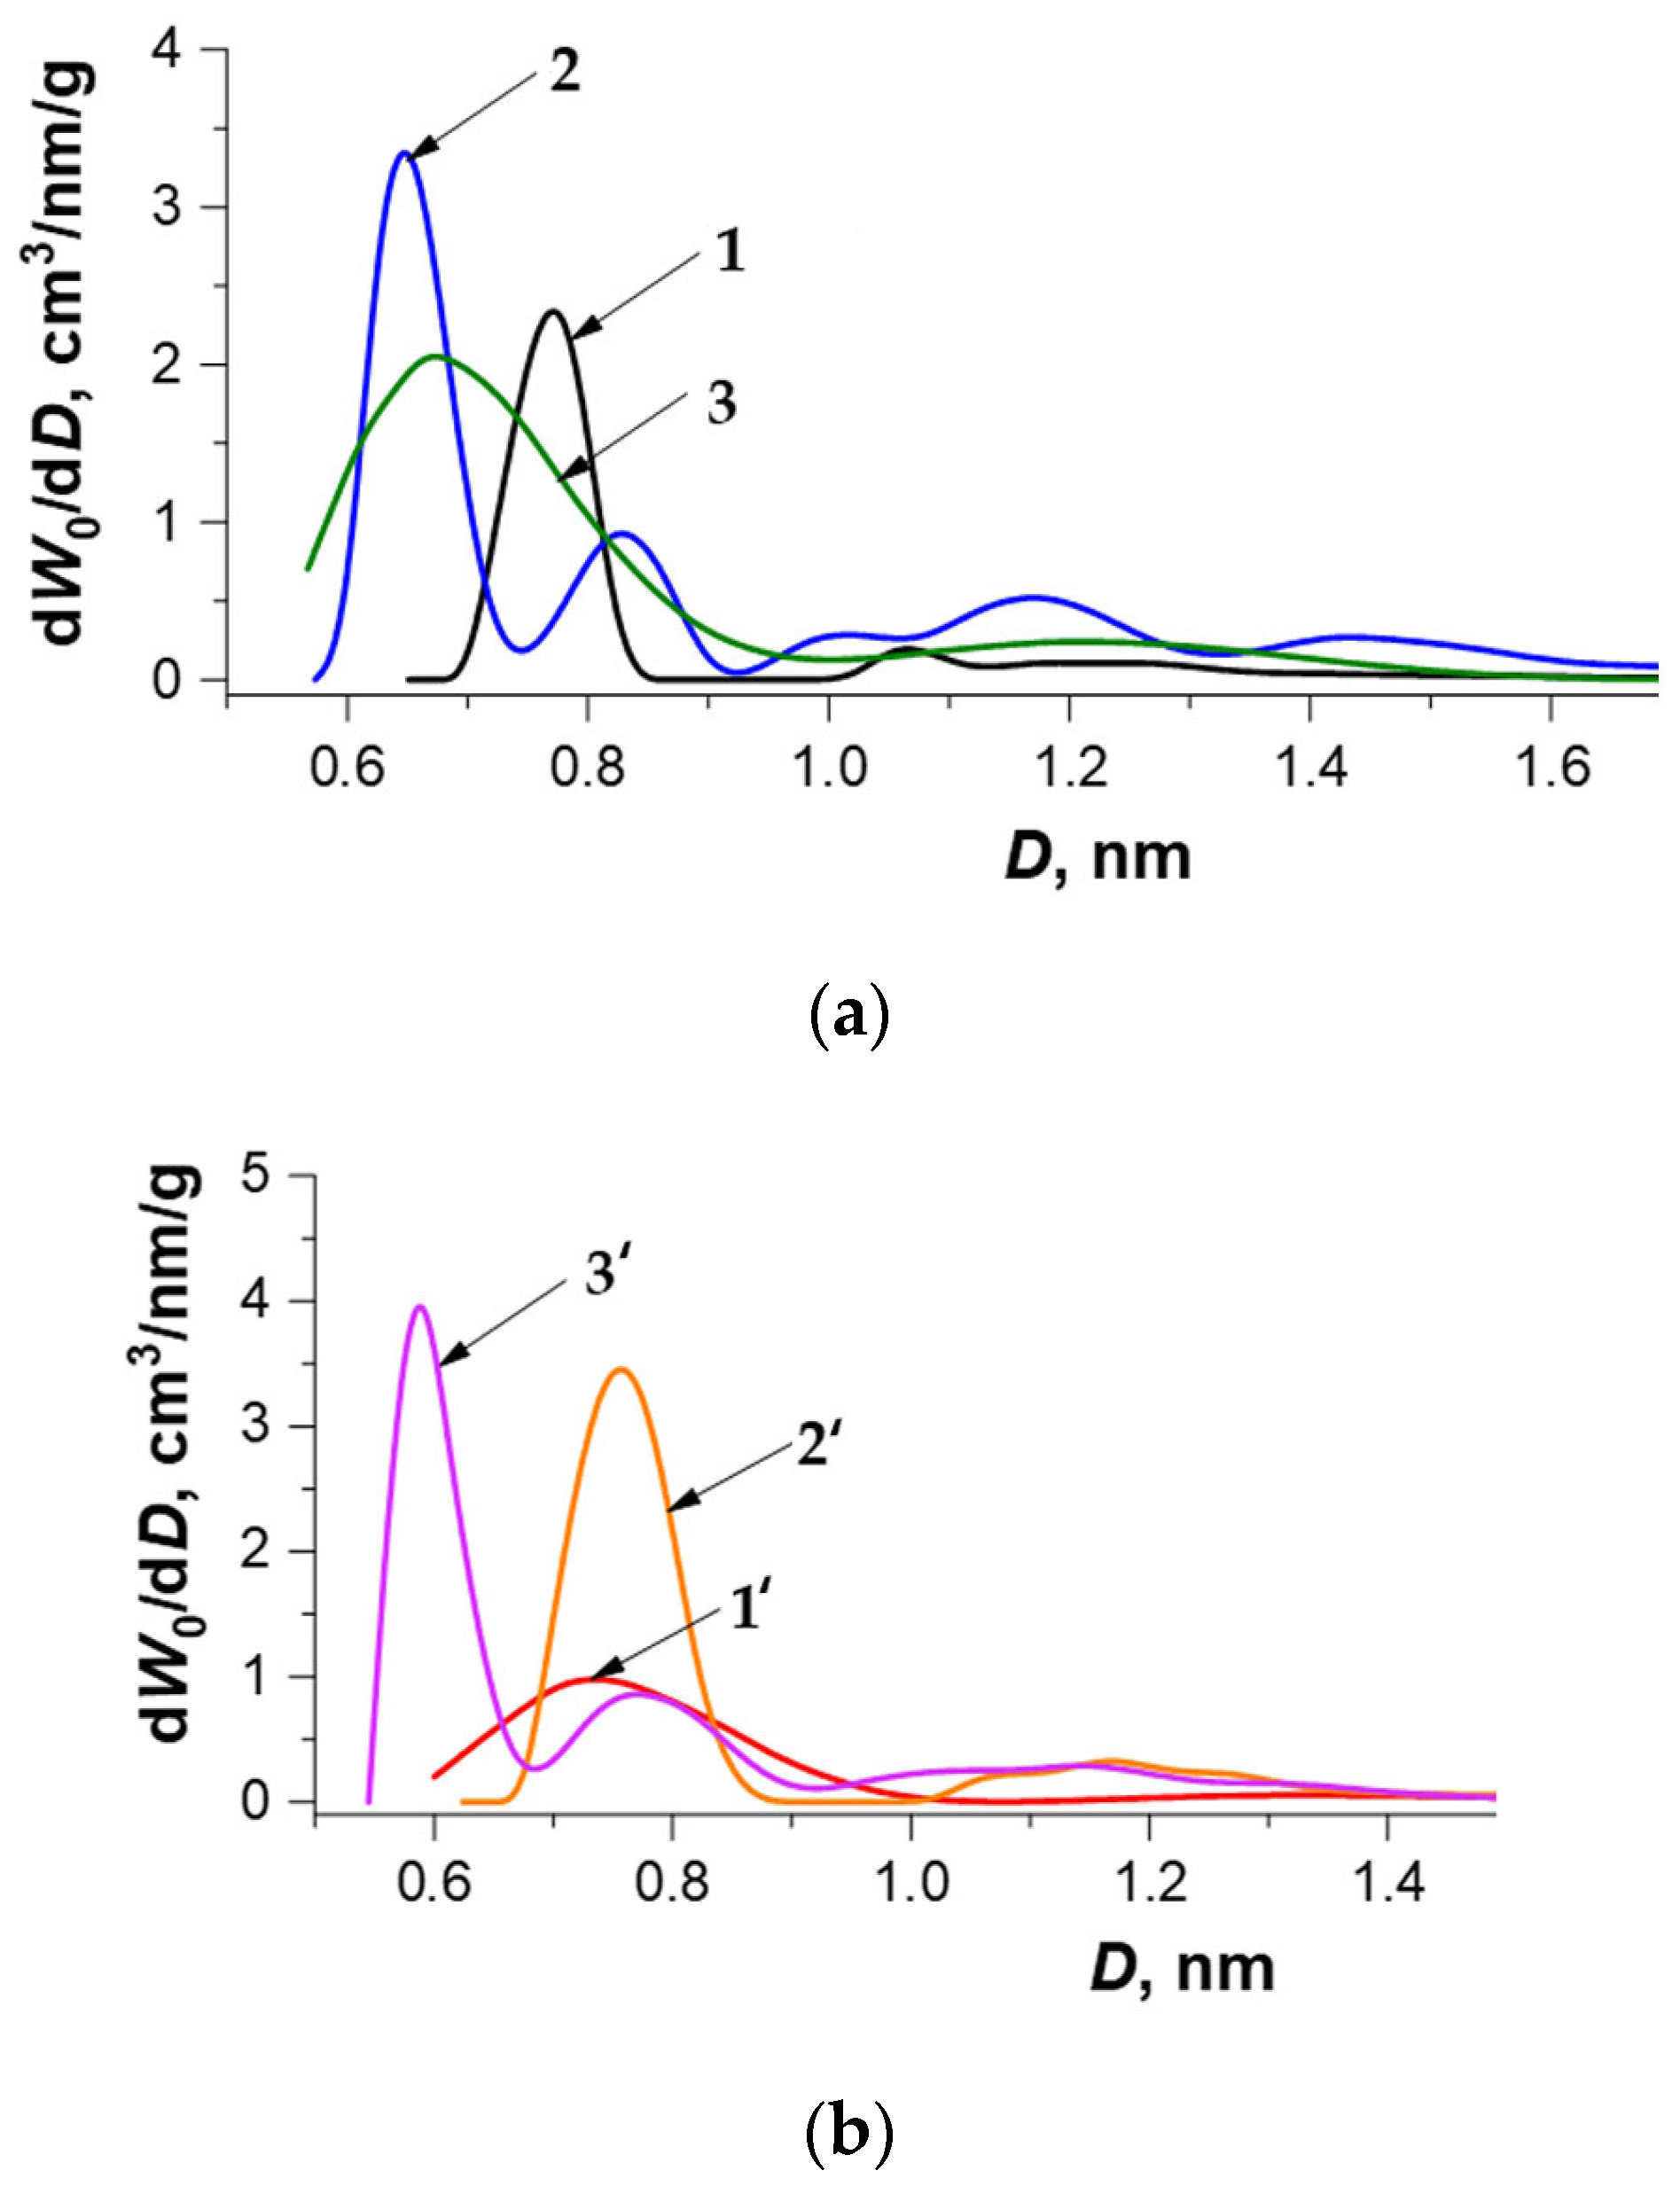
3.1. Optimal Conditions for Synthesis of Carbon Adsorbents and Characterization of Their Textural Properties

The first step in finding optimal synthesis conditions was the choice in carbonization temperature (Tcarb) for each type of nutshell based on the data on the porous structure of the char samples. Figure 1 shows the parameters of the porous structure of the WNS char and HNS char samples, namely the specific BET surface and specific micropore volume, versus the carbonization temperature. As noted above, the range of Tcarb values was chosen in accordance with the data on carbonization temperatures of industrial ACs [24].
According to Figure 1, a rise in the carbonization temperature from 700 to 900 °C causes the porosity in the WNS char sample to develop. This development manifests in an increase in the volume of micropores from 0.20 to 0.25 cm3/g (curve 1) and the specific BET surface from 470 to 620 m2/g (curve 2). Hence, in the following experiments, we chose the WNS char sample carbonized at a temperature of 900 °C with the greatest W0 and SBET values. It should be emphasized that a further increase in the carbonization temperature is inexpedient since it entails higher energy consumption and, ultimately, a higher cost of the carbon adsorbent.
As follows from the data on W0 and SBET for the HNS char series in Figure 1, at a temperature of 800 °C, both parameters reached their maximum values: of 0.22 cm3/g and 550 m2/g, respectively. With a further increase in the carbonization temperature, the values of W0 and SBET decreased (curves 1′ and 2′). Therefore, the HNS char sample produced at a carbonization temperature of 800 °C was chosen for subsequent activation.
Next, we performed a series of KOH activations with different char/KOH ratios of the chosen WNS char and HNS char samples and measured the isotherms of low-temperature nitrogen vapor adsorption onto the obtained activated carbons. As an example, Figure 2 shows the low-temperature N2 vapor adsorption isotherms for two samples obtained after the KOH activation of WNS char and HNS char with the char/KOH = 1:2 and 1:3, respectively.
The isotherms of low-temperature nitrogen vapor adsorption onto all the ACs were used to calculate the parameters of their porous structure, including the SEC values (W0, E0, and X0), specific BET surface (SBET), volume of mesopores (Wme), and total pore volume (Ws) of the carbon adsorbents. The results of these calculations, shown in Table 2, were compared to determine the impact of the carbon/KOH ratio on the porosity of the resulting AC samples, including micro- and mesopores.
The comparison of the data of the TVFM-based calculations listed in Table 2 for the ACs produced under the various activation conditions showed that an increase in the char/KOH ratio causes the following changes in the porosity:
  • The specific BET surface in the WNS-AC and HNS-AC series increased almost three and two times, respectively;
  • The micropore volume in the WNS-AC and HNS-AC series increased by almost 2.6 and 1.9 times, respectively;
  • The volume of mesopores in both series increased with increasing content of KOH and achieved a maximum value at the char/KOH ratio = 1:3;
  • According to the TVFM-based calculations, the effective width of slit-like micropore increased by a factor of 1.2 for the WNS-AC series and decreased insignificantly for the HNS-AC series;
The isotherms of low-temperature nitrogen vapor adsorption were used to evaluate the PSD function (dW0/dD = f(D)) in these two series of ACs by utilizing the NLDFT method assuming a slit-like pore model. The results of these calculations are shown in Figure 3a,b for the WHS-AC and HNS-AC series, respectively.
Analysis of the PSD functions obtained for the carbon adsorbents prepared from nutshells via KOH activation revealed a difference in the effect of the char/KOH ratio on the development of porosity in the WNS char and HNS char during activation. During the activation, the interactions of the WNS char with KOH led to the formation of both micropores with a predominant size of 0.78 nm and an insignificant amount of wide micropores with a size ranging from 1.1 to 1.4 nm (see curve 1 in Figure 3a). As follows from Figure 3a (curve 2), a two-fold increase in the KOH content led to an increase in the micropore volume, which included the narrow micropores with a predominant size D~0.65 nm (the highest peak of the PSD curve) and micropores with wider sizes described by a relatively broad peak of lesser intensity with a maximum at D~0.85 nm and a small number of pores with a size ranging from 1.0 to 1.6 nm (several overlapping low-intensity peaks). The KOH activation with an increased content of KOH produced the microporosity in the WNS-derived adsorbents described by the f(D) curve with a relatively high and wide peak and a very broad peak of low intensity corresponding to pores with a size D ranging from 0.6 to 0.85 nm and 1.1 to 1.4 nm, respectively (see curve 3, Figure 3a). In the HNS char samples (Figure 3b), an increase in the KOH content resulted in a rise in the proportion of narrow micropores, as illustrated by the formation of a peak at D~0.75 nm (compare curves 1′ and 2′), and a subsequent increase in its intensity accompanied by a shift to smaller pore sizes of D~0.6 nm (see curve 3′).
As follows from Table 2, the pore sizes of two adsorbents, namely WNS-AC-2 and HNS-AC-3 (highlighted in bold in the table), are comparable, as are their PSD functions (curve 2 in Figure 3a and curve 3′ in Figure 3b). Moreover, the pore volumes of these two samples are composed mostly of pores with a size ranging from 0.6 to 0.7 nm; this fact supports our expectations associated with the high CO2 adsorption capacity [41,47,48,49,51]. It should be noted that the SEC values of WNS-AC-2 and HNS-AC-3 are close to that determined through the above-mentioned computer simulations of CO2 adsorption in a model carbon adsorbent with slit-like micropores formed by burning out two graphite layers of four, which ensures the highest performance of the CO2 capture and delivery system [50]. Thus, carbon adsorbents with a potentially high adsorption capacity for CO2 can be prepared from the nutshells through the carbonization process at 900 and 800 °C, followed by the KOH activation with a char/KOH mass ratio of 1:2 and 1:3, respectively.
Next, we will focus on studying the texture properties and adsorption behaviors of these two samples. Figure 4 shows the SEM images of the WNS-AC-2 (a,b) and HNS-AC-3 (c,d) samples. It can be seen that the surface of both samples is evenly pitted with close-to-cylindrical channels (macropores) with a near-circular (WNS-AC-2) or oval (HNS-AC-3) cross-section, with a diameter ranging from 10 to 20 microns. During the adsorption process, these pores serve as transport pores for adsorptive molecules. In general, the heterogeneous surface with open pit channels of the carbon adsorbents is inherited from the precursors, walnut [73] and hazelnut [74] shells, which consist of polylobate cells, forming a 3D structure with thick lignified cell walls. All changes in the surface morphology and the porous system of the nutshells occurring upon the carbonization and activation processes can be attributed to the disruption of the original macromolecular network structure formed by the cellulose and lignin units, the removal of volatile organic compounds, and the subsequent rearrangement of a new matrix structure with micropores [73,74].
A large volume of micropores in ACs provides their high adsorption capacity for CO2. The open macropores facilitate the diffusion of CO2 to the centers of adsorption, which are heteroatoms [41,42,43] and narrow micropores with a size comparable with a CO2 molecular dimension [41,46,47,75].
When examining the data on the elemental analysis provided in Table 3, one can state that the WNS-AC-2 sample has more carbon species than HNS-AC-3, which can be attributed to the higher temperature of carbonization. The activation of the char with a larger char/KOH mass ratio is responsible for the more significant amount of potassium atoms in HNS-AC-3 compared to WNS-AC-2.
The structural transformations of the nutshells upon the carbonization and activation processes manifest themselves in the specific features of the XRD patterns recorded for the WNS-AC-2 and HNS-AC-3 adsorbents (see Figure 5).
The weakly pronounced (100), (002), and (101) reflections are indicative of the mostly amorphous phase composition of both carbon adsorbents. The XRD patterns of the WNS-AC-2 and HNS-AC-3 adsorbents do not show the strong broad peaks characteristic of crystalline cellulose (at 2θ = 16 and 22 degrees [76]) that were observed for both walnut and hazelnut shells [76,77]. The complete disruption of the crystallographic ordering in both adsorbents is caused by the aggressive action of KOH in accordance with the activation mechanism [78]. The noticeable increase in the intensity at small angles observed for the WNS-AC-2 adsorbent can be associated with a large fraction of micropores [79].

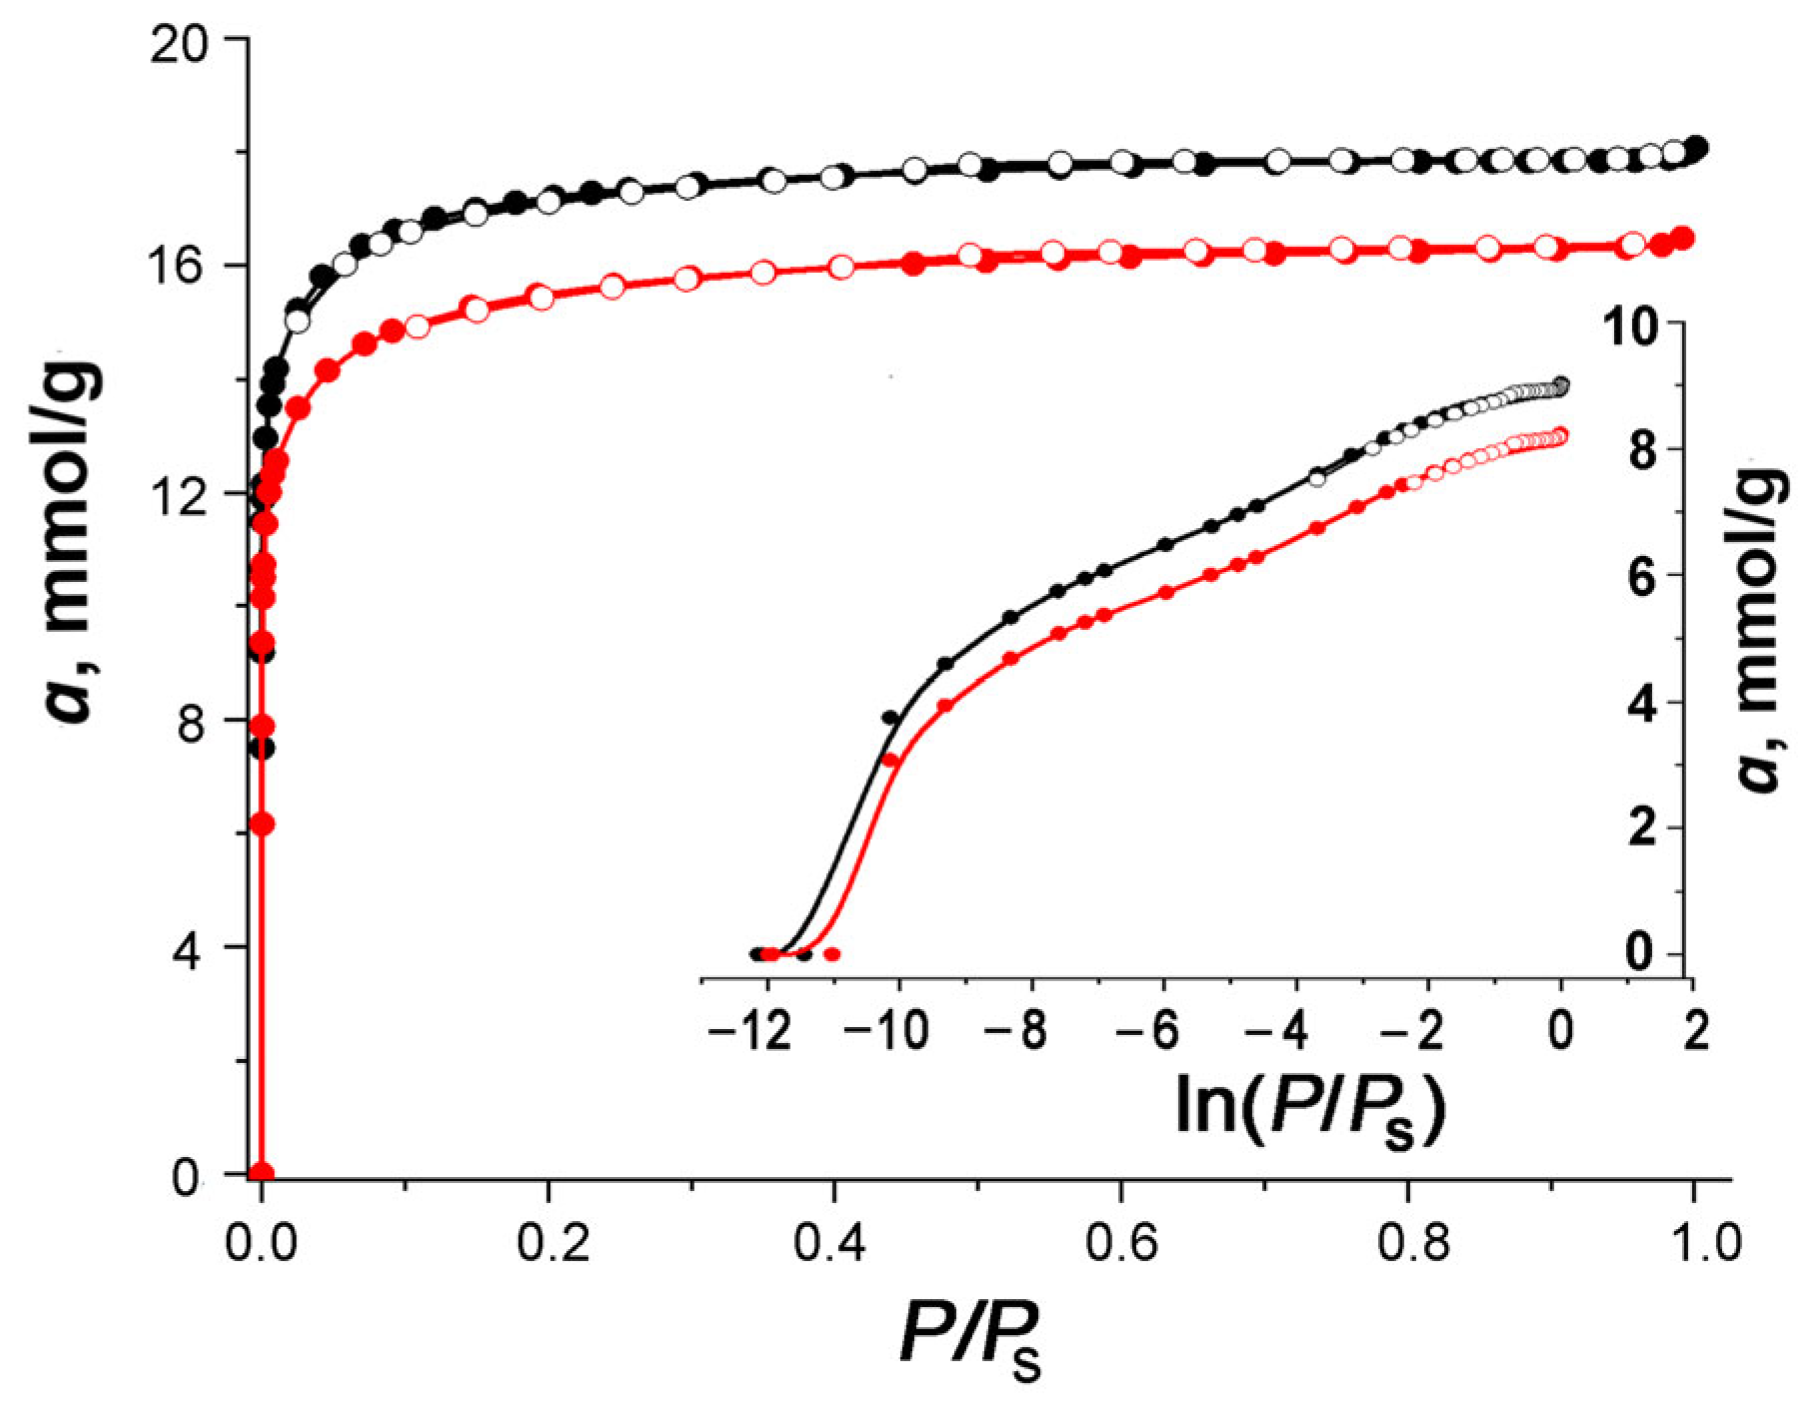
3.2. Carbon Dioxide Adsorption Properties of Nutshell-Derived Carbon Adsorbents

The experimental data on carbon dioxide adsorption onto both nutshell-derived ACs measured within a temperature range from 216.4 to 393 K were used to plot the isosteres lnP = f(1/T)|a=const, which were found to be linear over wide ranges of temperatures: Tλ < T < Tcr, and Tcr < T. The linear behaviors of the isosteres of adsorption preserved upon transition to the supercritical (P > Pcr, T > Tcr) state of the adsorbing substance are intrinsic for the adsorption in microporous adsorbents [71,80]. We used this positive consequence of the linearity of the isosteres to predict the adsorption equilibrium from the minimal set of experimental data. In addition, the TVFM equations (Equations (2)–(10)) and the SEC data for WNS-AC-2 and HNS-AC-3 (Table 2) were employed to calculate the carbon dioxide adsorption over the temperature range of 216.4 to 333 K and up to 10 MPa. Figure 6a,b show the experimental data represented by solid symbols and the results of calculations marked by open symbols (predictions from the linearity of the isosteres) and solid lines (calculations by the TVFM equations) for carbon dioxide adsorption onto WNS-AC-2 and HNS-AC-3, respectively, over the ranges of temperatures from 216.4 to 333 K and pressures up to 10 MPa.
As can be seen from Figure 6a,b, the predictions show good agreement with the experimental results for both adsorbents, indicating the adequacy of the data processing method using the TVFM equations. The values of CO2 adsorption rise as expected with increasing pressure and decreasing temperature.
Figure 7 shows the isotherms of CO2 adsorption onto the WNS-AC-2 and HNS-AC-3 adsorbents up to 0.1 MPa at different temperatures (symbols: the experimental data, solid curves: theoretical predictions using the TVFM equations). As follows from the figure, at the lowest temperature of 216.4 K, the CO2 uptake of the WNS-AC-2 and HNS-AC-3 adsorbents reaches a value of 13.4 and 11.8 mmol/g, respectively, at a pressure of ~0.1 MPa. However, according to the results of the calculations based on TVFM, at a temperature of 273/293 K, the maximum CO2 capture capacity WNS-AC-2 and HNS-AC-3 could be up to 13.4/12.5 and 12.0/11.1 mmol/g at a pressure of about 3.3 MPa, respectively. The obtained values of CO2 uptake should be compared, taking into account the data on the porosity (Table 2) and the content of heteroatoms (Table 3) in the adsorbents. It is evident that despite the lower content of heteroatoms including oxygen species (and, probably, oxygen-containing functionalities), the larger volume of micropores in WNS-AC-2 compared to that in HNS-AC-3 was the primary factor in the higher adsorption capacity that this adsorbent exhibited at these P,T-conditions. The observed effect is in agreement with the previous studies [46].
We compared the experimental data on the CO2 adsorption capacity at P = 0.1 MPa (see Figure 7) with that reported for the carbon adsorbents prepared from various biowaste (Table 4).
It should be noted that most of the researchers emphasized that the presence a sufficient fraction of the micropores with a size of ≤0.8–0.9 nm is crucial for efficient CO2 capture. The analysis of the table allowed us to conclude that the proposed route of the AC synthesis from nutshells made it possible to prepare the adsorbents with a sufficiently high CO2 capture capacity, especially at low temperatures, which is comparable with that reported by other researchers for carbon adsorbents from various biowaste, including the same nutshells [14,87].
The present study aims to prepare a high-performance carbon adsorbent for CO2 capture and delivery for subsequent utilization. In this context, the specific CO2 total capture and deliverable volumetric capacities of an adsorption tank loaded with this adsorbent are the main indicators of the effectiveness of this system. In fact, while assessing the integral specific efficiency of an adsorption-based system for CO2 capture and storage that comprises a tank loaded with an adsorbent, it is necessary to take into account not only the adsorbed phase of the target gas, but also the free gaseous phase in the space unoccupied by the adsorbent. Thus, we consider the total specific CO2 volumetric capacity including both the adsorbed and free gas phase as an efficiency criterion. It is important to stress that the volumetric storage capacity is relevant for a gas storage application of porous materials due to necessity to adsorb a maximum amount of target gas molecules in a minimum volume. As follows from a definition of the volumetric storage capacity, its value strongly depends not only on the adsorption behaviors of the adsorbent determined by the pore geometry and adsorption sites, but also on its packing density [98].
The specific deliverable (working) capacity is defined as the amount of the target gas (converted to STP or NTP conditions) released when the pressure in the storage tank with the adsorbent is reduced from the current level to a specified minimum value divided by the geometric volume of the tank [50,98,99,100]. We used the isotherms of CO2 adsorption at 293 K (Figure 5 and Figure 6) and the experimental data on the packing density of the ACs (~2.56 kg/m3 for both ACs) to evaluate the CO2 total and deliverable volumetric capacities at a pressure drop from 1 to 0.1 MPa. Table 5 summarizes the results of these calculations for both carbon adsorbents.
As follows from the data in Table 4, the BET surface plays a less significant role in the CO2 adsorption capacity of carbon adsorbents; hence, we consider a significant volume of narrow micropores with a size <0.8 nm with strong adsorption potentials to be a key parameter. At the initial stage of adsorption, these micropores along with heteroatoms serve as adsorption sites with high binding strength for CO2 molecules, and, hence, the total adsorption capacity is determined by the micropore volume in accordance with TVFM. At the same time, the high binding strength significantly increases the amount of unremovable CO2 molecules, and, as a result, reduces the deliverable capacity of the adsorbents, which is confirmed by the data in Table 5. One way to increase the deliverable capacity is a combined pressure–temperature swing delivery proposed, for example, for the hydrogen adsorption-based storage systems [100], when the target gas is accumulated at low temperatures and high pressures and is released at high temperatures and low pressures.

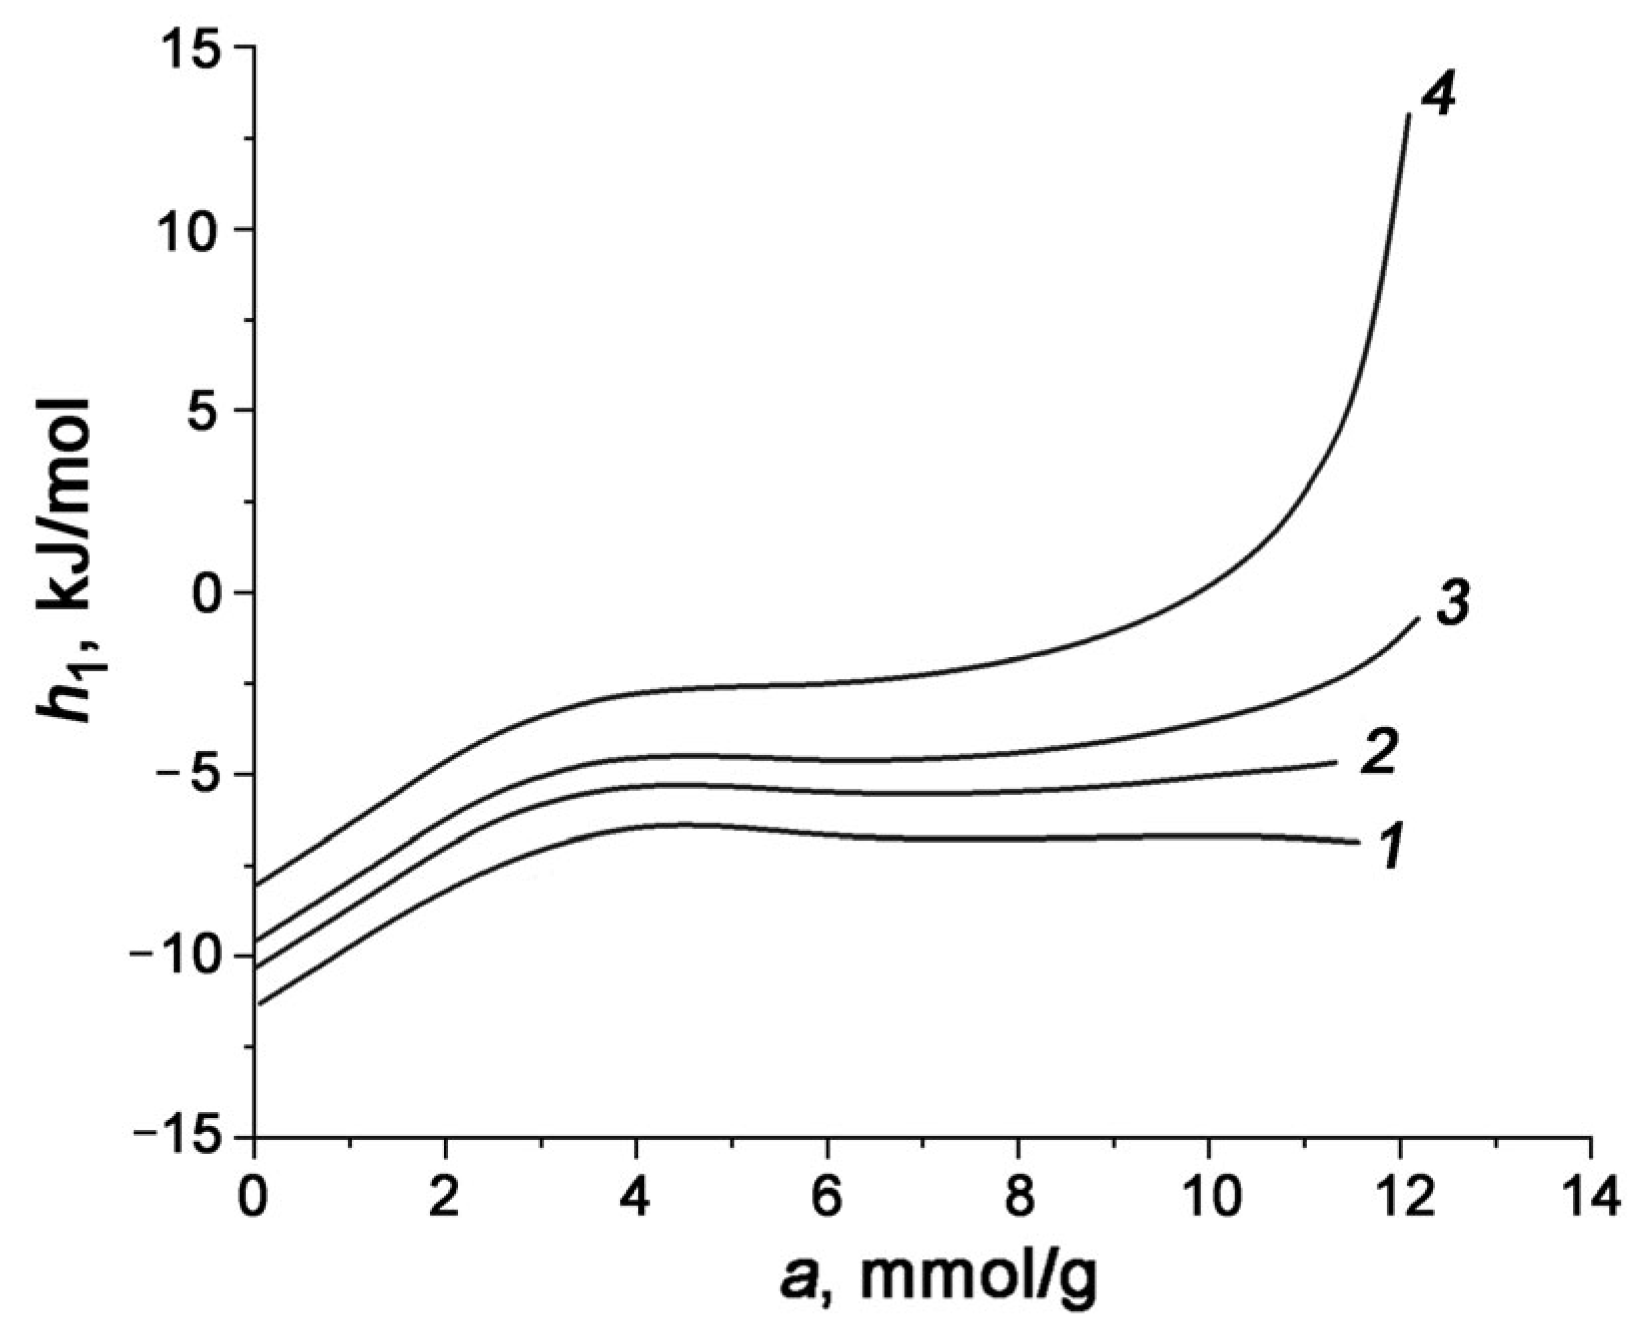
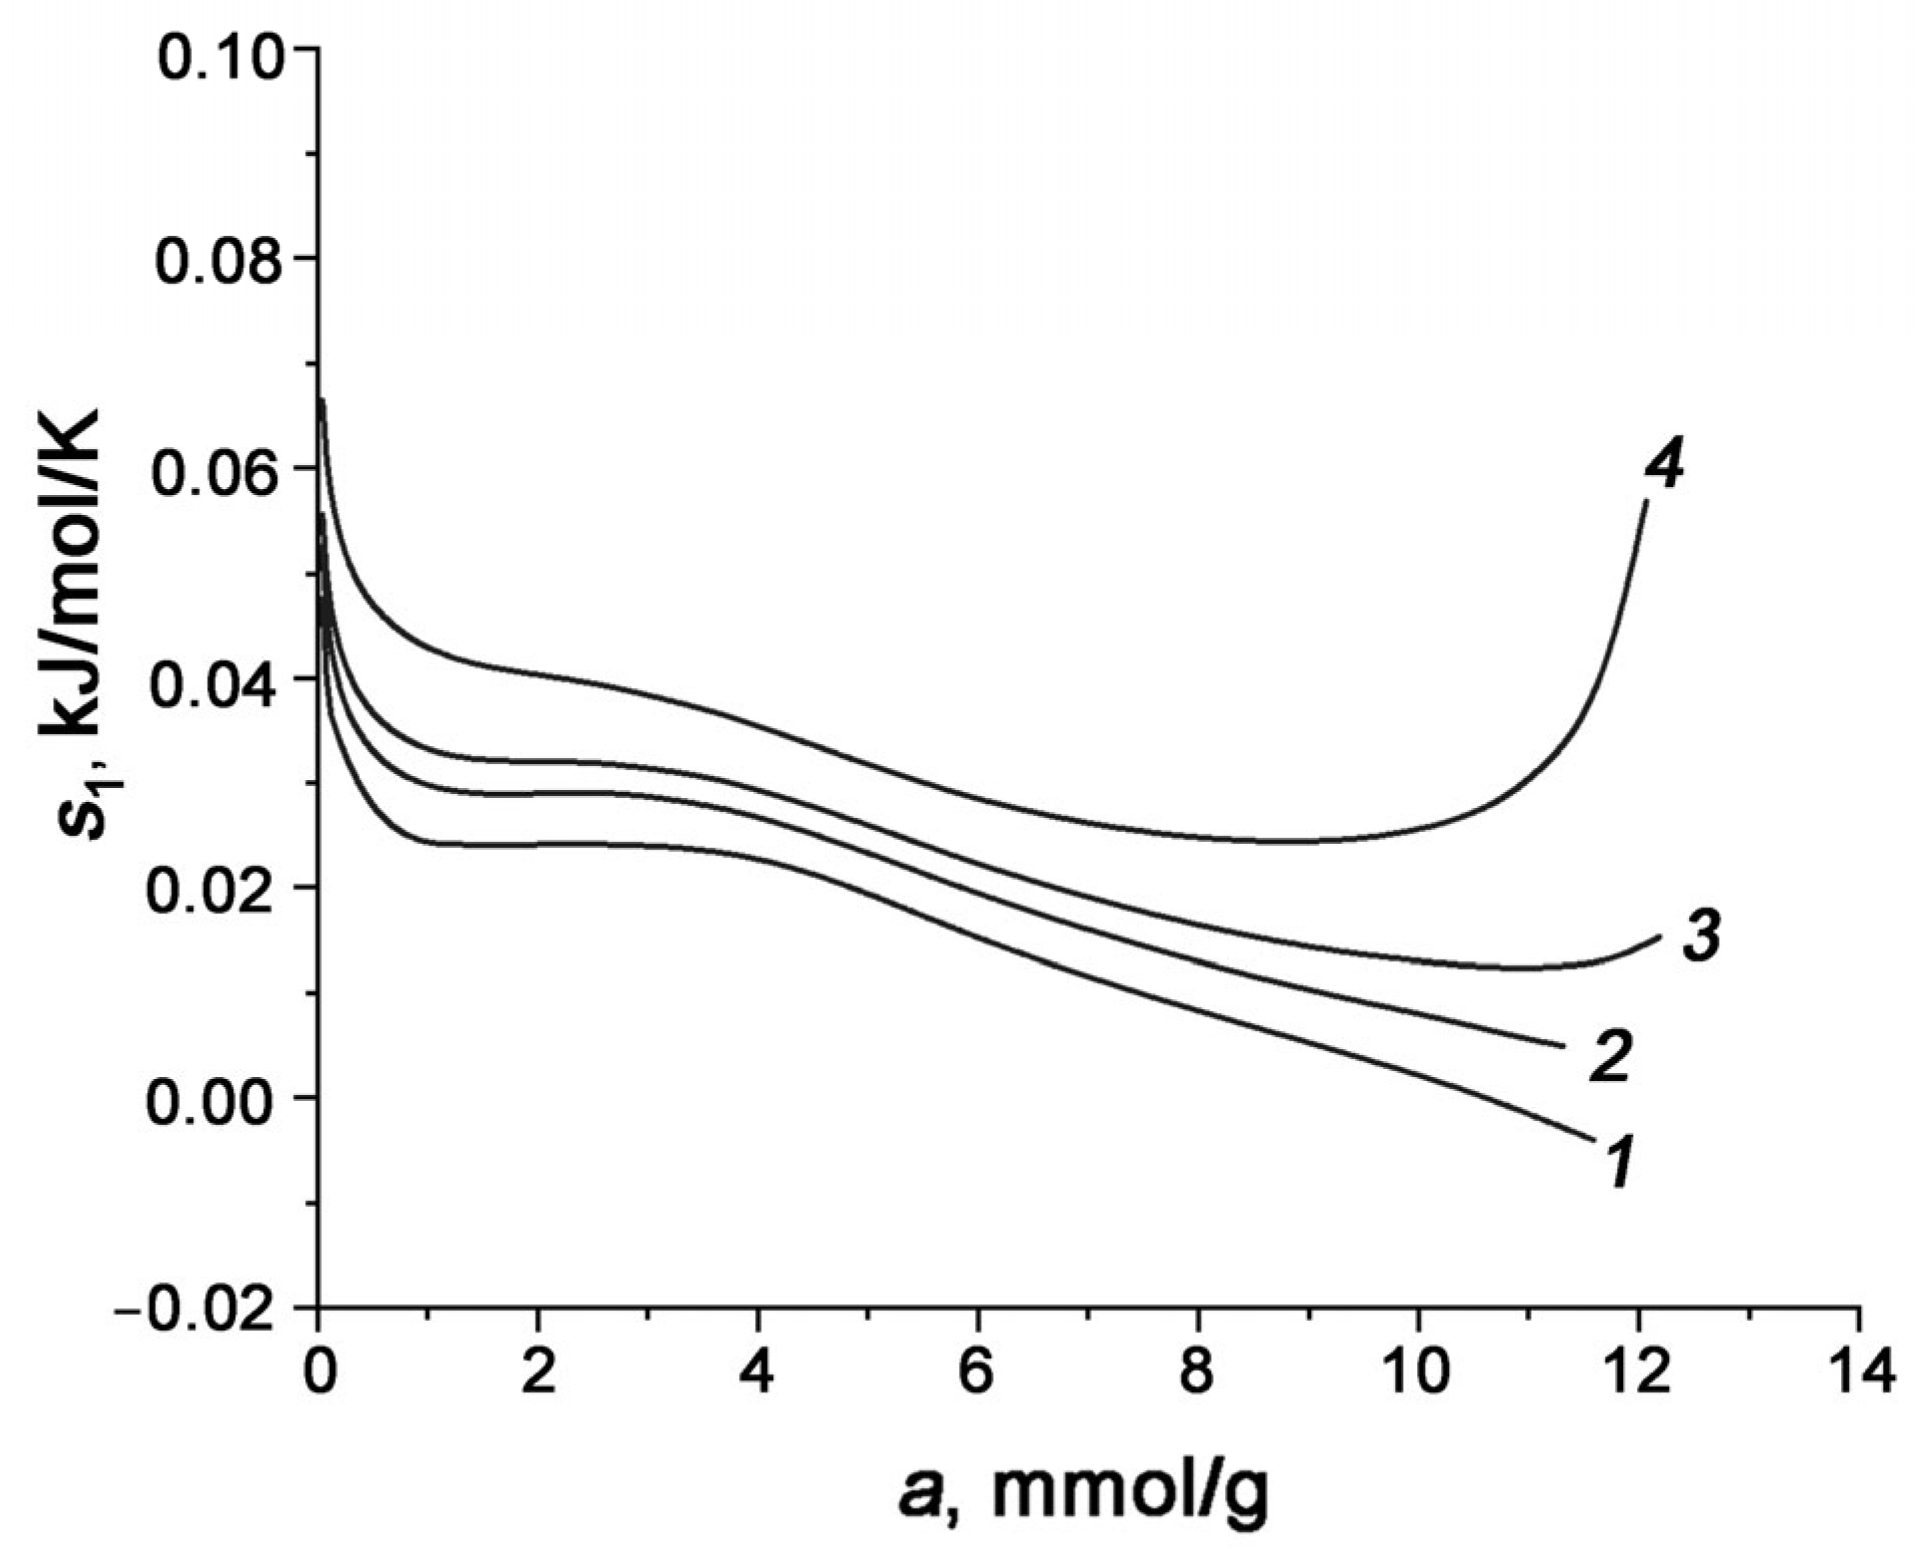
3.3. Differential Molar Isosteric Heat of CO2 Adsorption onto Carbon Adsorbents

Isosteric heat is generally interpreted as the energy required for an adsorptive gas molecule to move from the free state to the adsorbed one under fixed thermodynamic conditions of the system: constant pressure, temperature, and adsorbed amount. According to the definition posed by Hill [54,55], who replaced Gibbs’s formalism of excess adsorption with an alternative model of absolute adsorption, the differential molar isosteric heat of adsorption, qst, is calculated as a difference between the molar enthalpy of the equilibrium gas phase hg and the differential molar enthalpy of the adsorption phase H 1 a T :
q s t = h g H 1 a T = h g h 1 ,
If one assumes that the properties of the adsorbate in the gas phase adhere to the laws of ideal gas, the Clausius–Clapeyron formula is used to calculate the heat of adsorption [55]:
q s t = R T 2 d l n P d T .
Bakaev proposed a complete formula that includes the terms related to the non-ideality of an equilibrium gas phase and the non-inertness of an adsorbent at high pressures and temperatures; it provides the possibility to estimate the essential thermodynamic characteristic of the adsorption process as the isosteric differential molar heat of adsorption from experimental isosteres of adsorption calculated as total content [101,102]:
q s t = R · Z · l n P 1 / T a · 1 V a a T / ν g P a T · V a T · V a T a ,
here, Z = P·νg/(RT) is the compressibility of the equilibrium gaseous phase at specified P,T-conditions; νg [m3/kg] is the specific volume of the gaseous phase; Va = V0(P,T)/m0 [cm3/g] is the reduced volume of the adsorbent–adsorbate system; and V0 [cm3] is the volume of the regenerated adsorbent and m0 [g] is its mass.
It is evident that Equation (13) considers all the factors that contribute to the value of the differential molar isosteric heat of adsorption, namely: isothermal adsorption-induced deformation (∂Va/∂a)T, temperature isosteric deformation (∂Va/∂T)a, the slopes of the isotherm of adsorption (∂P/∂a)T and isosteres [lnP/(1/T)]a, and the non-ideality of a gas phase Z(P,T). The factors associated with the adsorption- and temperature-induced deformations of the adsorbent are relevant to adsorption processes at high temperatures and pressures.
When the effects associated with the thermal and adsorption non-inertness (deformation) of an adsorption system are insignificant, Equation (13) simplifies to the form:
q s t = R Z · l n P 1 / T a P a T · V a ,
It should be noted that the carbon adsorbents are regarded as exceptionally rigid and heat-resistant during adsorption since the contribution of their deformation stimulated by adsorption does not exceed 1% [103]. Therefore, the deformations of the material caused by adsorption and temperature, (∂Va/∂a)T and (∂Va/∂T)a, can be neglected in our calculations of the differential isosteric heat of adsorption from the CO2 adsorption isosteres.
Figure 8a,b show the isosteric differential molar heats of CO2 adsorption onto WNS-AC-2 (a) and HNS-AC-3 (b), which were calculated by applying Equation (14) to the CO2 adsorption data. The heats of CO2 adsorption are plotted as a function of the CO2 adsorption, qst(a), for different temperatures in order to follow the variations in the contributions of the adsorbate–adsorbent and adsorbate–adsorbate interactions to the total energy of molecular interactions during filling the pores with CO2.
It can be seen that the qst = f(a) plots obtained for the CO2 adsorption onto WNS-AC-2 (Figure 8a) and HNS-AC-3 (Figure 8b) are similar. The initial values of qst for CO2 adsorption onto WNSAC-2 and HNSAC-3 are about 32 kJ/mol that exceed the reported data for heats of CO2 adsorption onto carbon adsorbents [56,57,58,59]. At the early stage of adsorption, the high initial isosteric heat of adsorption points to the strong interactions between the carbon adsorbent and CO2 that cause the large number of retained molecules at low pressures during the delivery (desorption) process.
During the adsorption process, the heat of adsorption decreases. The decrease in qst is caused by the gradual occupation of the adsorption sites by CO2 molecules, which are narrow micropores and heteroatoms. The low rates of this decrease indicate a relatively slight difference between the adsorption sites for CO2 molecules, which is in agreement with the relatively narrow pore size distribution and small amounts of impurities.
After reaching a~4 mmol/g, the behaviors of qst(a) can be considered a result of the increasing contribution from the attractive CO2–CO2 interactions resulting in the formation of the clusters of adsorbed molecules [44,80]. Then, as the pores are filled with the adsorbate (a = 8–9 mmol/g,), the distances between the molecules decrease, and the repulsive intermolecular forces cause the rearrangement of adsorbed molecules.
As can be seen from Figure 8a,b, at the initial stage of adsorption, the heat of adsorption does not change with temperature, and curves 1–5 almost coincide up to a = 4 mmol/g. But during adsorption, the temperature affects the behaviors of the qst(a) function. At low temperatures, the heat of adsorption changes insignificantly (curves 1–3). In contrast, at T ≥ 293, a sharp decrease in qst was observed with the increase in carbon dioxide uptake (curves 4 and 5). This effect can be explained by the temperature-induced change in the contribution of the slope of the adsorption isosteres and the compressibility coefficient of the gas phase (the first term in Equation (14)) [80]. With increasing temperature, these effects manifest at lower pore fillings due to an increasing contribution of kinetic energy associated with CO2 molecular mobility.
Figure 9 shows the dependences of the differential molar isosteric enthalpy of the of the WNS-AC-2–CO2 adsorption system, h1 = f(a), calculated according to Equation (10) using the corresponding data on qst(a) for different temperatures. In the following discussion, we restrict ourselves to the thermodynamic parameters for the WNS-AC-2–CO2 adsorption system since the characters of the qst(a) dependences for both adsorbents are similar.
The changes in the behaviors of the h1 = f(a) curves with rising temperature can be explained by considering the temperature effect on the terms of Equation (11). At the initial stage, when temperature changes do not affect the heat of adsorption, i.e., qstf(T), the enthalpy of the adsorption system is determined by the linear temperature dependence of the molar enthalpy of the equilibrium gas phase, hg(T). As a result, the curves h1(a) for different temperatures are almost parallel. After reaching a = 3–4 mmol/g, the temperature-dependent compressibility of the gas phase Z and the product (∂P/∂aVa in Equation (14) for qst determine the behaviors of h1 = f(a) at each of the studied temperatures with increasing CO2 uptake.
The differential molar entropy of the adsorption system, s1, was calculated as follows [54,55]:
s 1 = s g q s t / T ,
The values of s1 plotted as a function of CO2 uptake in Figure 10 reflect the changes in the state of CO2 molecules during their adsorption caused by the interaction with the adsorption sites compared to the gas phase.
As follows from Figure 10, at the initial stage of CO2 adsorption, up to the adsorption value of a ~ 1 mmol/g was achieved, and the entropy decreases sharply, suggesting that CO2 molecules move to a bound state at the high-energy adsorption sites. In the range of adsorption values of 2–10 mmol/g, the gradual filling of the pore space with CO2 and, consequently, the enhancement of the CO2–CO2 interactions cause the entropy drop to slow down. One can see an increase in the s1(a) values observed at a > 10 mmol/g at 293 and 333 K. In a recent study [104], we found a similar effect for methane adsorption onto microporous carbon adsorbent prepared from mineral coal and explained it via the impact of temperature-dependent molecular mobility on the structural rearrangements of adsorbed molecules at high micropore fillings.
The heat capacity of an adsorption system is a crucial parameter that determines its thermal stability during a large number of adsorption/desorption cycles. Distinct from the heat capacity of any bulk phase, the heat capacity of the adsorption system depends both on P,T-conditions and the amount of adsorbed substance. Therefore, a full thermodynamic description of an adsorption system requires us to explore the differential molar isosteric heat capacity Ca as a function of P,T-conditions and the amount of adsorbed substance. According to the Kirchhoff equation [80]
C a = h 1 T a = h g T a q s t T a
the value of Ca can be evaluated using the data on the isosteric differential heat of adsorption and the molar enthalpy of the equilibrium gas phase hg.
Figure 11 shows the temperature dependence of the differential molar isosteric heat capacity of the WNS-AC-2–CO2 adsorption system for various amounts of adsorbed carbon dioxide.
As follows from Figure 11, the increase in the CO2 uptake leads to the enhancement of the temperature dependence of Ca for the WNS-AC-2–CO2 adsorption system: at a = 3 mmol/g, the heat capacity increases from 0.027 to 0.35 kJ/mol/K when the temperature rises within a range of 216.4–330 K, and when the CO2 uptake achieves a = 11 mmol/g, the value of Ca increases by a factor of 8 with a rise in temperature of 100 °C.
The results obtained can be interpreted by considering the temperature dependencies of the terms of Equation (16). Due to the temperature invariance in the heat of adsorption observed at the early stages of adsorption (see Figure 7), i.e., qst ≠ f(T)a, the initial growth in Ca with temperature is a result of the temperature dependence of the enthalpy of the carbon dioxide gaseous phase. However, as the number of adsorbed molecules increase, the function qst becomes more temperature-sensitive (see Figure 8a), and it is this effect that makes a dominant contribution to the behaviors of the Ca(T) function.

4. Conclusions

In summary, we showed that walnut and hazelnut shells can be used as precursors for preparing efficient carbon adsorbents for carbon dioxide capture and storage. By conducting comparative structural investigations of the chars, we found the optimal carbonization temperature for both precursors. After performing the KOH thermochemical activation of the char with the highest porosity, we determined the optimal KOH/carbon ratios for fabricating ACs with an optimal porous structure for CO2 adsorption via analysis of the porosity characteristics. The data of the CO2 adsorption over the sub- and supercritical thermodynamic conditions obtained from the direct measurements and the calculations based on TVFM showed that the carbon adsorbents prepared from walnut and hazelnut shells under relatively mild carbonization at 600 to 900 °C and activation conditions KOH/carbon = 2 and 3, respectively, exhibited efficient CO2 capture capacities. It was concluded that the presence of narrow micropores with a size of 0.6–0.7 nm in both adsorbents ensured a high adsorption energy of ~25 kJ/mol and initial heats of CO2 adsorption of ~32 kJ/mol. Comparison of the CO2 adsorption capacity exhibited by both, taking into account the microporosity and the elemental composition (the presence of heteroatoms), revealed the decisive contribution of the micropore volume to the adsorption value.
The thermodynamic functions of the CO2–AC adsorption system (heat of adsorption, enthalpy, and entropy) evaluated as functions of CO2 uptake and temperature were shown to be governed by the changes in the molecular adsorbent–adsorbate and adsorbate–adsorbate interactions during the transitions of CO2 molecules from a bound state at the high-energy adsorption sites (heteroatoms and narrow micropores with a size ≤0.6–0.7 nm) to the molecular clusters and their rearrangement.
The results obtained are essential for designing a route for the synthesis of carbon adsorbents from abundant agricultural waste and designing the thermal management of the corresponding capture, storage, and delivery facilities with improved performance. The large-scale production of these carbon adsorbents can solve the problem of capture and sequestration from point source emissions and stabilize CO2 in the atmosphere.

Author Contributions

Conceptualization, I.E.M. and A.V.S.; methodology, O.V.S. and I.E.M.; software, A.E.G.; validation, A.V.S., A.A.F. and E.V.K.; formal analysis, O.V.S. and A.E.G.; investigation, O.V.S.; resources, A.V.S.; data curation, A.E.G.; writing—original draft preparation, O.V.S.; writing—review and editing, E.V.K.; visualization, A.E.G.; supervision, I.E.M.; project administration, A.A.F.; funding acquisition, A.A.F. All authors have read and agreed to the published version of the manuscript.

Funding

The research was carried out within the State Assignment of the Russian Federation (Project No. 122011300053-8).

Institutional Review Board Statement

Not application.

Informed Consent Statement

Not application.

Data Availability Statement

The data that support the findings of this study are available from the corresponding author, O.V. Solovtsova, upon reasonable request.

Acknowledgments

All the experiments were carried out using equipment from the Center of Physical Methods of Investigations of the A.N. Frumkin Institute of Physical Chemistry and Electrochemistry of the Russian Academy of Sciences. The authors thank A.L. Pulin for his assistance in measuring low-temperature nitrogen vapor adsorption and A.D. Aliev for his assistance in the SEM experiments and constructive suggestions.

Conflicts of Interest

The authors declare no conflict of interest. The funders had no role in the design of the study; in the collection, analyses, or interpretation of data; in the writing of the manuscript; or in the decision to publish the results.

References

  1. The Paris Agreement. 2015. Available online: https://www.un.org/ru/climatechange/paris-agreement (accessed on 20 December 2022).
  2. Cuéllar-Franca, R.M.; Azapagic, A.J. Carbon capture, storage and utilization technologies: A critical analysis and comparison of their life cycle environmental impacts. J. CO2 Util. 2015, 9, 82–102. [Google Scholar] [CrossRef]
  3. Leung, D.Y.C.; Caramanna, G.; Maroto-Valer, M.M. An overview of current status of carbon dioxide capture and storage technologies. Renew. Sust. Energy Rev. 2014, 39, 426–443. [Google Scholar] [CrossRef]
  4. Nanda, S.; Reddy, S.N.; Mitra, S.K.; Kozinski, J.A. The progressive routes for carbon capture and sequestration. Energy Sci. Eng. 2016, 4, 99–122. [Google Scholar] [CrossRef]
  5. Aschenbrenner, O.; Styring, P. Comparative study of solvent properties for carbon dioxide absorption. Energy Environ. Sci. 2010, 3, 1106–1113. [Google Scholar] [CrossRef]
  6. Zhu, X.; Hillesheim, P.C.; Mahurin, S.M.; Wang, C.; Tian, C.; Brown, S.; Luo, H.; Veith, G.M.; Han, K.S.; Hagaman, E.W.; et al. Efficient CO2 capture by porous, nitrogen-doped carbonaceous adsorbents derived from task-specific ionic liquids. Chem. Sus. Chem. 2012, 5, 1912–1917. [Google Scholar] [CrossRef] [PubMed]
  7. Zhu, X.; Tian, C.; Mahurin, S.M.; Chai, S.-H.; Wang, C.; Brown, S.; Veith, G.M.; Luo, H.; Liu, H.; Dai, S. A superacid-catalyzed synthesis of porous membranes based on triazine frameworks for CO2 separation. J. Am. Chem. Soc. 2012, 134, 10478–10484. [Google Scholar] [CrossRef]
  8. Tuinier, M.J.; van Sint Annaland, M.; Kramer, G.J.; Kuipers, J.A.M. Cryogenic CO2 capture using dynamically operated packed beds. Chem. Eng. Sci. 2010, 65, 114–119. [Google Scholar] [CrossRef]
  9. Hinkov, I.; Lamari, F.D.; Langlois, P.; Dicko, M.; Chilev, C.; Pentchev, I. Carbon dioxide capture by adsorption (Review). J. Chem. Technol. Metall. 2016, 51, 609–626. [Google Scholar]
  10. Abanades, J.C.; Arias, B.; Lyngfelt, A.; Mattisson, T.; Wiley, D.E.; Li, H.; Ho, M.T.; Mangano, E.; Brandani, S. Emerging CO2 capture systems. Int. J. Greenh. Gas. Control 2015, 40, 126–166. [Google Scholar] [CrossRef]
  11. Patel, H.A.; Byun, J.; Yavuz, C.T. Carbon Dioxide Capture Adsorbents: Chemistry and Methods. Chem. Sus. Chem. 2017, 10, 1303–1317. [Google Scholar] [CrossRef] [PubMed]
  12. Sun, H.; Yang, B.; Li, A. Biomass derived porous carbon for efficient capture of carbon dioxide, organic contaminants and volatile iodine with exceptionally high uptake. Chem. Eng. J. 2019, 372, 65–73. [Google Scholar] [CrossRef]
  13. Quan, C.; Su, R.; Gao, N. Preparation of activated biomass carbon from pine sawdust for supercapacitor and CO2 capture. Int. J. Energy Res. 2020, 14, 4335–4351. [Google Scholar] [CrossRef]
  14. Serafin, J.; Dziejarski, B.; Cruz Junior, O.F.; Srénscek-Nazzal, J. Design of highly microporous activated carbons based on walnut shell biomass for H2 and CO2 storage. Carbon 2023, 201, 633–647. [Google Scholar] [CrossRef]
  15. Kwiatkowski, M.; Hu, X.; Pastuszyński, P. Analysis of the Influence of Activated Carbons’ Production Conditions on the Porous Structure Formation on the Basis of Carbon Dioxide Adsorption Isotherms. Materials 2022, 15, 7939. [Google Scholar] [CrossRef] [PubMed]
  16. Siriwardane, R.V.; Shen, M.-S.; Fisher, E.P.; Losch, J. Adsorption of CO2 on zeolites at moderate temperatures. Energy Fuels 2005, 19, 1153–1159. [Google Scholar] [CrossRef]
  17. Vidoni, A.; Ravikovitch, P.I.; Afeworki, M.; Calabro, D.; Deckman, H.; Ruthven, D. Adsorption of CO2 on high silica MFI and DDR zeolites: Structural defects and differences between adsorbent samples. Microporous Mesoporous Mater. 2020, 294, 109818. [Google Scholar] [CrossRef]
  18. Younas, M.; Rezakazemi, M.; Daud, M.; Wazir, M.B.; Ahmad, S.; Inamuddin, N.U.; Ramakrishna, S. Recent progress and remaining challenges in postcombustion CO2 capture using metal-organic frameworks (MOFs). Prog. Energy Combust. Sci. 2020, 80, 100849. [Google Scholar] [CrossRef]
  19. Quan, C.; Wang, H.; Jia, X.; Gao, N.J. Effect of carbonization temperature on CO2 adsorption behavior of activated coal char. Energy Inst. 2021, 97, 92–99. [Google Scholar] [CrossRef]
  20. Coats, R.; Schefele, J.A.; Kingston, P.W. Adsorption Apparatus. U.S. Patent 6436175, 20 August 2002. [Google Scholar]
  21. Zhang, S.; Gao, N.; Quan, C.; Wang, F.; Wu, C. Autothermal CaO looping biomass gasification to increase process energy efficiency and reduce ash sintering. Fuel 2020, 277, 118199. [Google Scholar] [CrossRef]
  22. Ding, S.; Liu, Y. Adsorption of CO2 from flue gas by novel seaweed-based KOH activated porous biochars. Fuel 2020, 260, 116382. [Google Scholar] [CrossRef]
  23. Li, D.; Ma, T.; Zhang, R.; Tian, Y.; Qiao, Y. Preparation of porous carbons with high low-pressure CO2 uptake by KOH activation of rice husk char. Fuel 2015, 139, 68–70. [Google Scholar] [CrossRef]
  24. Mukhin, V.M.; Taranchenko, Y.F.; Gimatdinov, T.V. Technology for producing activated carbons based on compacted vegetable raw materials. Theor. Appl. Ecol. 2015, 3, 55–60. [Google Scholar]
  25. Savelyeva, Y.R.; Kryazhev, A.N.; Bogomolov, M.S.; Ivasenko, V.L.; Novikov, V.T. Production of activated carbon from the shell of pine nuts. Chem. Veg. Raw Mater. 2003, 4, 61–64. [Google Scholar]
  26. Bogaev, A.V.; Lebedev, I.A.; Karchevsky, D.F.; Berestennikov, D.A.; Vtorushina, O.O. Production of active coals from the shells of pine nuts. Polzunovsky Bull. 2013, 1, 282–284. [Google Scholar]
  27. Al Mesfer, M.K. Synthesis and characterization of high-performance activated carbon from walnut shell biomass for CO2 capture. Environ. Sci. Pollut. Res. 2020, 27, 15020–15028. [Google Scholar] [CrossRef]
  28. Liu, S.; Ma, R.; Hu, X.; Wang, L.; Wang, X.; Radosz, M.; Fan, M. CO2 adsorption on hazelnut-shell-derived nitrogen-doped porous carbons synthesized by single-step sodium amide activation. Ind. Eng. Chem. Res. 2020, 59, 7046–7053. [Google Scholar] [CrossRef]
  29. Laikam, K.E.; Vorob’eva, N.A.; Vysotskaya, N.A.; Demina, L.V.; Epikhina, A.V.; Zinchenko, A.P.; Kiselev, S.V.; Lennik, A.V.; Nesterov, V.N.; Novokshchenova, E.I. (Eds.) The Main Results of the All-Russian Agricultural Census of 2016; Federal State Statistics Service; Statistika Rossii: Moscow, Russia, 2016; Volume 1. Book 1. (in Russian) [Google Scholar]
  30. Kapica, J.; Pełech, R.; Przepiórski, J.; Morawski, A.W. Kinetics of the Adsorption of copper and lead ions from aqueous solution on to WD-ekstra activated carbon. Adsorpt. Sci. Technol. 2002, 20, 441–452. [Google Scholar] [CrossRef]
  31. Davidi, S.; Lashanizadegan, A.; Sharififard, H. Walnut shell activated carbon: Optimization of synthesis process, characterization and application for Zn (II) removal in batch and continuous process. Mater. Res. Express 2019, 6, 085621. [Google Scholar] [CrossRef]
  32. Mukhin, V.M.; Tarasov, A.V.; Klushin, V.N. Active Coals of Russia; Metallurgy: Moscow, Russia, 2000. [Google Scholar]
  33. Kambarova, G.B.; Sarymsakov, S. Obtaining activated carbon from walnut shells. Chem. Solid Fuels 2008, 3, 42–46. [Google Scholar]
  34. Deng, S.; Wei, H.; Chen, T.; Wang, B.; Huang, J.; Yu, G. Superior CO2 adsorption on pine nut shell-derived activated carbons and the effective micropores at different temperatures. Chem. Eng. J. 2014, 253, 46–54. [Google Scholar] [CrossRef]
  35. Nouralishahi, A.; Bahaeddini, M.; Rashidi, A.; Mahinnezhad, S.; Fazeli, A. Activated nanoporous carbon from walnut shell as a promising adsorbent for methane storage in adsorbed natural gas technology. Sci. Iran. 2019, 26, 3447–3455. [Google Scholar]
  36. Chomiak, K.; Gryglewicz, S.; Kierzek, K.; Machnikowski, J.J. Optimizing the properties of granular walnut-shell based KOH activated carbons for carbon dioxide adsorption. J. CO2 Util. 2017, 21, 436–443. [Google Scholar] [CrossRef]
  37. Mohammad-Khah, A.; Ansari, R. Activated Charcoal: Preparation, characterization and Applications: A review article. Int. J. Chem. Tech. Res. 2009, 1, 859–864. [Google Scholar]
  38. Bedia, J.; Peñas-Garzón, M.; Gómez-Avilés, A.; Rodriguez, J.J.; Belver, C. Review on Activated Carbons by Chemical Activation with FeCl3. J. Carbon Res. 2020, 6, 21. [Google Scholar] [CrossRef]
  39. Wei, H.; Deng, S.; Hu, B.; Chen, Z.; Wang, B.; Huang, J.; Yu, G. Granular bamboo-Derived activated carbon for high CO2 adsorption: The dominant role of narrow micropores. Chem. Sus. Chem. 2012, 5, 2354–2360. [Google Scholar] [CrossRef] [PubMed]
  40. Nor, N.M.; Chung, L.L.; Teong, L.K.; Mohamed, A.R. Synthesis of activated carbon from lignocellulosic biomass and its applications in air pollution control—A review. J. Chem. Eng. 2013, 1, 658–666. [Google Scholar]
  41. Reddy, M.S.B.; Ponnamma, D.; Sadasivuni, K.K.; Kumar, B.; Abdullah, A.M. Carbon dioxide adsorption based on porous materials. RSC Adv. 2021, 11, 12658–12681. [Google Scholar] [CrossRef]
  42. Shafeeyan, M.S.; Daud, M.A.W.; Houshmand, A.; Shamiri, A. A review on surface modification of activated carbon for carbon dioxide adsorption. J. Anal. Appl. Pyrolysis 2010, 89, 143–151. [Google Scholar] [CrossRef]
  43. Khosrowshahi, M.S.; Abdol, M.A.; Mashhadimoslem, H.; Khakpour, E.; Emrooz, H.B.M.; Sadegh Sadeghzadeh, S.; Ghaemi, A. The role of surface chemistry on CO2 adsorption in biomass-derived porous carbons by experimental results and molecular dynamics simulations. Sci. Rep. 2022, 12, 8917. [Google Scholar] [CrossRef]
  44. Kwiatkowski, M.; Policicchio, A.; Seredych, M.; Bandosz, T.J. Evaluation of CO2 interactions with S-doped nanoporous carbon and its composites with a reduced GO: Effect of surface features on an apparent physical adsorption mechanism. Carbon 2016, 98, 250–258. [Google Scholar] [CrossRef]
  45. Seema, H.; Kemp, K.C.; Le, N.H.; Park, S.-W.; Chandra, V.; Lee, J.W.; Kim, K.S. Highly selective CO2 capture by S-doped microporous carbon materials. Carbon 2014, 66, 320–326. [Google Scholar] [CrossRef]
  46. Ma, X.; Yang, Y.; Wu, Q.; Liu, B.; Li, D.; Chen, R.; Wang, C.; Li, H.; Zeng, Z.; Li, L. Underlying mechanism of CO2 uptake onto biomass-based porous carbons: Do adsorbents capture CO2 chiefly through narrow micropores? Fuel 2020, 282, 118727. [Google Scholar] [CrossRef]
  47. Presser, V.; McDonough, J.; Yeon, S.-H.; Gogotsi, Y. Effect of pore size on carbon dioxide sorption by carbide derived carbon. Energy Environ. Sci 2011, 4, 3059–3066. [Google Scholar] [CrossRef]
  48. Zhang, Z.; Zhou, J.; Xing, W.; Xue, Q.; Yan, Z.; Zhuo, S.; Qiao, S.Z. Critical role of small micropores in high CO2 uptake. Phys. Chem. Chem. Phys. 2013, 15, 2523–2529. [Google Scholar] [CrossRef]
  49. Casco, M.E.; Martinez-Escandell, M.; Silvestre-Albero, J.; Rodriguez-Reinoso, F. Effect of the porous structure in carbon materials for CO2 capture at atmospheric and high-pressure. Carbon 2014, 67, 230–235. [Google Scholar] [CrossRef]
  50. Yakovlev, V.Y.; Shkolin, A.V.; Fomkin, A.A.; Gorelikov, V.N.; Men’shchikov, I.E. Adsorption of Carbon Dioxide onto Model Carbon Structures with Slit-like Micropores. Prot. Met. Phys. Chem. Surf. 2021, 57, 1105–1114. [Google Scholar] [CrossRef]
  51. Lee, J.H.; Kwack, K.; Lee, H.J.; Lim, S.Y.; Jung, D.S.; Jung, Y.; Choi, J.W. Optimal activation of porous carbon for high performance CO2 capture. Chem. Nano Mat. 2016, 2, 528–533. [Google Scholar]
  52. Dubinin, M.M. Physical Adsorption of Gases and Vapors in Micropores. In Progress Surface Membrane Science, 1st ed.; Cadenhead, D.A., Danielli, J.F., Rosenberg, M.D., Eds.; Academic Press: New York, NY, USA, 1975; Volume 9, pp. 1–70. [Google Scholar]
  53. Dubinin, M.M. Fundamentals of the theory of adsorption in micropores of carbon adsorbents: Characteristics of their adsorption properties and microporous structures. Carbon 1989, 27, 457–467. [Google Scholar] [CrossRef]
  54. Hill, T.L. Theory of physical adsorption. Adv Catal. 1952, 4, 211–258. [Google Scholar]
  55. Myers, A.L. Thermodynamics of Adsorption. AIChE J. 2002, 48, 145–160. [Google Scholar] [CrossRef]
  56. Du, X.; Wu, T.; Hou, Z.; Liu, Z.; Huo, L.; Hao, Y.; Zhao, Y. Adsorption equilibrium and thermodynamic analysis of CO2 and CH4 on Quinshui Basin Anthracite. Geofluids 2019, 2019, 8268050. [Google Scholar] [CrossRef]
  57. Singh, V.K.; Kumar, E.A. Estimation of Thermodynamic Properties of CO2 Adsorption on Activated Carbon, Isotherm and Thermodynamic Analysis of Carbon Dioxide on Activated Carbon. ICAER 2017, Conference Paper. Available online: https://www.researchgate.net/publication/321824663_Estimation_of_Thermodynamic_Properties_of_CO2_Adsorption_on_Activated_Carbon/citations#fullTextFileContent (accessed on 23 April 2023).
  58. Singh, V.K.; Kumar, E.A. Experimental investigation and thermodynamic analysis of CO2 adsorption on activated carbons for cooling system. J. CO2 Util. 2017, 17, 290–304. [Google Scholar] [CrossRef]
  59. Calbry-Muzyka, A.S.; Edwards, C.F. Thermodynamic benchmarking of CO2 capture systems: Exergy analysis methodology for adsorption processes. Energy Procedia 2014, 63, 1–17. [Google Scholar] [CrossRef]
  60. Men’shchikov, I.E.; Fomkin, A.A.; Romanov, Y.A.; Kiselev, M.R.; Pulin, A.L.; Chugaev, S.S.; Shkolin, A.V. Carbon Nanoporous Adsorbents Prepared from Walnut Shell for Liquefied Natural Gas Vapor Recovery in Cryogenic Storage Systems. Prot. Met. Phys. Chem. Surf. 2020, 56, 1122–1133. [Google Scholar] [CrossRef]
  61. Bell, I.H.; Wronski, J.; Quoilin, S.; Lemort, V. Pure and pseudo-pure fluid thermophysical property evaluation and the open-source thermophysical property library CoolProp. Ind. Eng. Chem. Res. 2014, 53, 2498–2508. [Google Scholar] [CrossRef]
  62. Poling, B.E.; Prausnitz, J.M.; O’Connell, J.P. The Properties of Gases and Liquids; McGraw-Hill: New York, NY, USA, 2001. [Google Scholar]
  63. Brunauer, S.; Emmett, P.H.; Teller, E. Adsorption of gases in multimolecular layers. J. Am. Chem. Soc. 1938, 60, 309–319. [Google Scholar] [CrossRef]
  64. Rouquerol, J.; Llewellyn, P.; Rouquerol, F. Is the BET equation applicable to microporous adsorbents? Stud. Surf. Sci. Catal. 2007, 160, 49–56. [Google Scholar]
  65. Thommes, M.; Kaneko, K.; Neimark, A.V.; Oliver, J.P.; Rodrigues-Reinoso, F.; Rouquerol, J.; Sing, K. Physisorption of gases, with special reference to the evaluation of surface area and pore size distribution (IUPAC Technical Report). Pure Appl. Chem. 2015, 87, 1051–1069. [Google Scholar] [CrossRef]
  66. Gregg, S.J.; Sing, K.S.W. Adsorption, Surface Area and Porosity; Academic Press: London, UK; New York, NY, USA, 1982. [Google Scholar]
  67. Neimark, A.V.; Lin, Y.; Ravikovitch, P.I.; Thommes, M. Quenched solid density functional theory and pore size analysis of micro-mesoporous carbons. Carbon 2009, 47, 1617–1628. [Google Scholar] [CrossRef]
  68. Shkolin, A.V.; Fomkin, A.A. Measurement of Carbon-Nanotube Adsorption of Energy-Carrier Gases for Alternative Energy Systems. Meas. Tech. 2018, 61, 395–401. [Google Scholar] [CrossRef]
  69. Shkolin, A.V.; Fomkin, A.A.; Men’shchikov, I.E.; Kharitonov, V.M.; Pulin, A.L. Bench for Measuring the Adsorption of Gases and Vapors by the Gravimetric Method and the Method of Its Operational Use. R.U. Patent No. 2732199, 14 September 2020. [Google Scholar]
  70. Nikolaev, K.M.; Dubinin, M.M. Concerning adsorption properties of carbon adsorbents 3. A study of adsorption isotherms of gases and vapors on active carbons over a wide interval of temperatures, including the critical region. Russ. Chem. Bull. 1958, 7, 1124–1133. [Google Scholar] [CrossRef]
  71. Men’shchikov, I.E.; Fomkin, A.A.; Arabei, A.B.; Shkolin, A.V.; Strizhenov, E.M. Description of methane adsorption on microporous carbon adsorbents on the range of supercritical temperatures on the basis of the Dubinin–Astakhov equation. Prot. Met. Phys. Chem. Surf. 2016, 52, 575–580. [Google Scholar] [CrossRef]
  72. Sugden, S. The Parachor and Valency; G. Routledge: London, UK, 1930. [Google Scholar]
  73. Antreich, S.J.; Huss, J.C.; Xiao, N.X.; Singh, A.; Gierlinger, N. The walnut shell network: 3D visualisation of symplastic and apoplastic transport routes in sclerenchyma tissue. Planta 2022, 256, 49. [Google Scholar] [CrossRef]
  74. Kaya, N.; Yildiz, Z.; Ceylan, S. Preparation and Characterisation of Biochar from Hazelnut Shell and Its Adsorption Properties for Methylene Blue Dye. J. Polytech. 2018, 21, 765–776. [Google Scholar] [CrossRef]
  75. Gomez-Delgado, E.; Nunell, G.; Cukierman, A.L.; Bonelli, P. Tailoring activated carbons from Pinus canariensis cones for post-combustion CO2 capture. Environ. Sci. Pollut. Res. 2020, 27, 13915–13929. [Google Scholar] [CrossRef]
  76. Ayala, J.; Fernández, B. Removal of zinc, cadmium and nickel from mining waste leachate using walnut shells. Environ. Prot. Eng. 2019, 45, 141–158. [Google Scholar] [CrossRef]
  77. Khodadadi, B. Hazelnut shell as a valuable bio-waste support for green synthesis of Ag NPs using Origanum vulgare leaf extract: Catalytic activity for reduction of methyl orange and Congo red. Iran J. Catal. 2017, 7, 111–119. [Google Scholar]
  78. Lillo-Ródenas, M.A.; Cazorla-Amorós, D.; Linares-Solano, A. Understanding chemical reactions between carbons and NaOH and KOH: An insight into the chemical activation mechanism. Carbon 2003, 41, 267–275. [Google Scholar] [CrossRef]
  79. Zhu, Y.; Murali, S.; Stoller, M.D.; Ganesh, K.J.; Cai, W.; Ferreira, P.J.; Pirkle, A.; Wallace, R.M.; Cychosz, K.A.; Thommes, M.; et al. Carbon-based supercapacitors produced by activation of graphene. Science 2011, 332, 1537–1541. [Google Scholar] [CrossRef] [PubMed]
  80. Fomkin, A.A. Adsorption of gases, vapors and liquids by microporous adsorbents. Adsorption 2005, 11, 425–436. [Google Scholar] [CrossRef]
  81. Vargas, D.P.; Giraldo, L.; Erto, A.; Moreno-Pirajan, J.C. Chemical modification of activated carbon monoliths for CO2 adsorption. J. Therm. Anal. Calorim. 2013, 114, 1039–1047. [Google Scholar] [CrossRef]
  82. Nelson, K.M.; Mahurin, S.M.; Mayes, R.T.; Williamson, B.; Teague, C.M.; Binder, A.J.; Baggetto, L.; Veith, G.M.; Dai, S. Preparation and CO2 adsorption properties of soft-templated mesoporous carbons derived from chestnut tannin precursors. Microporous Mesoporous Mater. 2016, 222, 94–103. [Google Scholar] [CrossRef]
  83. Li, M.; Xiao, R. Preparation of a dual Pore Structure Activated Carbon from Rice Husk Char as an Adsorbent for CO2 Capture. Fuel Process Technol. 2019, 186, 35–39. [Google Scholar] [CrossRef]
  84. Goskula, S.; Siliveri, S.; Gujjula, S.R.; Chirra, S.; Adepu, A.K.; Narayanan, V. Sustainable Micro Porous Activated Carbons Synthesis from Gum Arabic Tree Seed Shell Using KOH as an Activation Agent and Their CO2 Capture. Available online: https://ssrn.com/abstract=4231053 (accessed on 20 May 2023).
  85. Hong, S.M.; Jang, E.; Dysart, A.D.; Pol, V.G.; Lee, K.B. CO2 Capture in the sustainable wheat-derived activated microporous carbon compartments. Sci. Rep. 2016, 6, 34590. [Google Scholar] [CrossRef]
  86. Alabadi, A.; Razzaque, S.; Yang, Y.; Chen, S.; Tan, B. Highly porous activated carbon materials from carbonized biomass with high CO2 capturing capacity. Chem. Eng. J. 2015, 281, 606–612. [Google Scholar] [CrossRef]
  87. Lewicka, K.; Polish, J. Activated carbons prepared from hazelnut shells, walnut shells and peanut shells for high CO2 adsorption. Chem. Tech. 2017, 19, 38–43. [Google Scholar] [CrossRef]
  88. Serafin, J.; Kiełbasa, K.; Michalkiewicz, B. The new tailored nanoporous carbons from the common polypody (Polypodium vulgare): The role of textural properties for enhanced CO2 adsorption. Chem. Eng. J. 2022, 429, 131751. [Google Scholar] [CrossRef]
  89. Xing, W.; Liu, C.; Zhou, Z.; Zhang, L.; Zhou, J.; Zhuo, S.; Yan, Z.; Gao, H.; Wang, G.; Qiao, S.Z. Superior CO2 uptake of N-doped activated carbon through hydrogenbonding interaction. Energy Environ. Sci. 2012, 5, 7323–7327. [Google Scholar] [CrossRef]
  90. Pramanik, P.; Patel, H.; Charola, S.; Neogi, S.; Maiti, S. High surface area porous carbon from cotton stalk agro-residue for CO2 adsorption and study of techno-economic viability of commercial production. J. CO2 Util. 2021, 45, 101450. [Google Scholar] [CrossRef]
  91. Cruz, O.F., Jr.; ·Campello-Gómez, I.; Casco, M.E.; Serafin, J.; Silvestre-Albero, J.; Martínez-Escandell, M.; Hotza, D.; Rambo, C.R. Enhanced CO2 capture by cupuassu shell-derived activated carbon with high microporous volume. Carbon Lett. 2022, 33, 727–735. [Google Scholar] [CrossRef]
  92. de Souza, L.K.C.; Gonçalves, A.A.S.; Queiroz, L.S.; Chaar, J.S.; da Rocha Filho, G.N.; da Costa, C.E.F. Utilization of acai stone biomass for the sustainable production of nanoporous carbon for CO2 capture. Sustain. Mater. Technol. 2020, 25, e00168. [Google Scholar] [CrossRef]
  93. Deng, S.; Hu, B.; Chen, T.; Wang, B.; Huang, J.; Wang, Y.; Yu, G. Activated carbons prepared from peanut shell and sunfower seed shell for high CO2 adsorption. Adsorption 2015, 21, 125–133. [Google Scholar] [CrossRef]
  94. Chen, J.; Yang, J.; Hu, G.; Hu, X.; Li, Z.; Shen, S.; Radosz, M.; Fan, M. Enhanced CO2 capture capacity of nitrogen-doped biomass-derived porous carbons. ACS Sustain. Chem. Eng. 2016, 4, 1439–1445. [Google Scholar] [CrossRef]
  95. Boujibar, O.; Souikny, A.; Ghamouss, F.; Achak, O.; Dahbi, M.; Chafik, T. CO2 capture using N-containing nanoporous activated carbon obtained from argan fruit shells. J. Environ. Chem. Eng. 2018, 6, 1995–2002. [Google Scholar] [CrossRef]
  96. Wang, P.; Zhang, G.; Chen, W.; Chen, Q.; Jiao, H.; Liu, L.; Wang, X.; Deng, X. Molten Salt Template Synthesis of Hierarchical Porous Nitrogen-Containing Activated Carbon Derived from Chitosan for CO2 Capture. ACS Omega 2020, 36, 23460–23467. [Google Scholar] [CrossRef]
  97. Serafin, J.; Narkiewicz, U.; Morawski, A.W.; Wróbel, R.J.; Michalkiewicz, B. Highly microporous activated carbons from biomass for CO2 capture and effective micropores at different conditions. J. CO2 Util. 2017, 18, 73–79. [Google Scholar] [CrossRef]
  98. Gross, K.J.; Carrington, K.R.; Barcelo, S.; Karkamkar, A.; Purewal, J.; Ma, S.; Zhou, H.-C.; Dantzer, P.; Ott, K.; Burrell, T.; et al. Recommended Best Practices for the Characterization of Storage Properties of Hydrogen Storage Materials, US Department of Energy Hydrogen Program. 2012. Available online: http://www1.eere.energy.gov/hydrogenandfuelcells/pdfs/best_practices_hydrogen_storage.pdf (accessed on 30 November 2021).
  99. Tsivadze AYu Aksyutin, O.E.; Ishkov, A.G.; Marina KKnyazeva, M.K.; Solovtsova, O.V.; Men’shchikov, I.E.; Fomkin, A.A.; Shkolin, A.A.; Khozina, E.V.; Grachev, V.A. Metal-organic framework structures: Adsorbents for natural gas storage. Russ. Chem. Rev. 2019, 88, 925–978. [Google Scholar] [CrossRef]
  100. Madden, D.G.; O’Nolan, D.; Rampal, N.; Babu, R.; Çamur, C.; Al Shakhs, A.N.; Zhang, S.Y.; Rance, G.A.; Perez, J.; Maria Casati, N.P.; et al. Densified HKUST-1 Monoliths as a Route to High Volumetric and Gravimetric Hydrogen Storage Capacity. J. Am. Chem. Soc. 2022, 144, 13729–13739. [Google Scholar] [CrossRef]
  101. Bakaev, V.A. One possible formulation of the thermodynamics of sorption equilibrium. Bull. Acad. Sci. USSR Div. Chem. Sci. 1971, 20, 2516–2520. [Google Scholar] [CrossRef]
  102. Bakaev, V.A. Molecular Theory of Physical Adsorption. Ph.D. Thesis, Moscow State University, Moscow, Russia, 1990. (In Russian). [Google Scholar]
  103. Shkolin, A.V.; Men’shchikov, I.E.; Khozina, E.V.; Yakovlev, V.Y.; Fomkin, A.A. Isotropic and anisotropic properties of adsorption-induced deformation of porous carbon materials. Adsorption 2022, 1–17. [Google Scholar] [CrossRef]
  104. Men’shchikov, I.E.; Shkolin, A.V.; Fomkin, A.A.; Khozina, E.V. Thermodynamics of methane adsorption on carbon adsorbent prepared from mineral coal. Adsorption 2021, 27, 1095–1107. [Google Scholar] [CrossRef]
Figure 1. Dependence of the porous structure parameters: SBET (dash curves 1, 1′) and W0 (solid curves 2, 2′) of the WNS char (black curves 1 and 2) and HNS char (red curves 1′ and 2′) samples on the carbonization temperature.
Gases 03 00008 g001
Figure 2. The standard isotherms of nitrogen vapor adsorption onto WNS-AC-2 (black symbols and lines) and HNS-AC-3 (red symbols and lines) measured at 77 K.
Gases 03 00008 g002
Figure 3. The PSD functions dW0/dD = f(D) in two series of carbon porous materials prepared from WNS char (a) and HNS char (b) via KOH thermochemical activation with a char/KOH ratio of 1:1 (curves 1 and 1′), 1:2 (curves 2 and 2′), and 1:3 (curves 3 and 3′).
Gases 03 00008 g003
Figure 4. SEM images of the WNS-AC-2 (a,b) and HNS-AC-3 (c,d) carbon adsorbents.
Gases 03 00008 g004
Figure 5. XRD patterns of the synthesized WNS-AC-2 (1) and HNS-AC-3 (2) adsorbents.
Gases 03 00008 g005
Figure 6. The CO2 adsorption isotherms onto the WNS-AC-2 (a) and HNS-AC-3 (b) samples plotted in semi-logarithmic coordinates at temperatures, K: 216.4 (1); 243.0 (2), 273.0 (3), 293.0 (4), and 333.0 (5). The solid symbols correspond to the experimental data, the open symbols are the results of prediction from the linearity of the isosteres, and the solid lines are the results of the calculations according to the TVFM equations. The dotted lines limit the area with experimental data and the results of calculations using two methods.
Gases 03 00008 g006
Figure 7. The initial part of the CO2 adsorption isotherms for the WNS-AC-2 (black) and HNS-AC-3 (red) samples up to pressures of 0.1 MPa at temperatures, K: 216.4 (1); 243.0 (2); 273.0 (3); 293.0 (4); 333.0 (5).
Gases 03 00008 g007
Figure 8. The differential molar isosteric heat of CO2 adsorption onto WNS-AC-2 (a) and HNS-AC-3 (b) versus the adsorption value at temperatures, K: 216.4 (1), 243.0 (2), 273.0 (3), 293.0 (4), and 333.0 (5).
Gases 03 00008 g008
Figure 9. The differential molar enthalpy of the WNS-AC-2–CO2 adsorption system versus the amount of adsorbed carbon dioxide at temperatures, K: 243.0 (1), 273.0 (2), 293.0 (3), and 333.0 (4).
Gases 03 00008 g009
Figure 10. The differential molar isosteric entropy of the WNS-AC-2–CO2 adsorption system versus the CO2 uptake at temperatures, K: 243.0 (1), 273.0 (2), 293 (3), and 303.0 (4).
Gases 03 00008 g010
Figure 11. The differential molar heat capacity, Ca, of the WNS-AC-2–CO2 adsorption system as a function of temperature for various CO2 uptakes: 11 mmol/g (1), 10 mmol/g (2), 9 mmol/g (3), 8 mmol/g (4), 7 mmol/g (5), 6 mmol/g (6), 5 mmol/g (7), 4 mmol/g (8), and 3 mmol/g (9).
Gases 03 00008 g011
Table 1. Physicochemical properties of carbon dioxide [61,62].
MTb [K]Tcr [K]Tλ [K]ρcr [kg/m3]Pcr [MPa]dkin [nm]
44.01194.65304.19216.554687.3820.33
Table 2. The parameters of the porous structure of the activated carbons prepared from WNS (Tcarb = 900 °C) and HNS (Tcarb = 800 °C) through the KOH activation at 800 °C with the different carbon/KOH ratios.
SampleChar/KOH RatioW0 [cm3/g]E0 [kJ/mol]X0 [nm]SBET [m2/g]Ws [cm3/g]Wme [cm3/g]
WNS-AC series
WNS-AC-11:10.2424.50.495900.270.03
WNS-AC-21:20.6024.90.4815100.650.05
WNS-AC-31:30.6223.40.6115500.710.09
HNS-AC series
HNS-AC-11:10.2924.20.506700.320.03
HNS-AC-21:20.4425.90.4610300.470.03
HNS-AC-31:30.5424.60.4913000.590.05
Table 3. Elemental composition of carbon adsorbents prepared from nutshells in at.%.
SampleCOKMetals (Cr, Fe)
WNS-AC-292.836.081.09-
HNS-AC-383.699.534.592.19
Table 4. Comparison of the CO2 adsorption capacity (273 and 298 K) at P = 0.1 MPa for activated carbons prepared from various biowaste [14,39,81,82,83,84,85,86,87,88,89,90,91,92,93,94,95,96,97]. The data on CO2 adsorption onto WNS-AC-2 and HNS-AC-3 are provided for 273 and 293 K (curves 3 and 4, Figure 7). The data of this work are highlighted in bold.
Carbon SourceActivationW0
[cm3/g]
SBET
[m2/g]
Adsorption Capacity [mmol/g]
at P = 0.1 MPa
Ref.
273 K298 K
Palm stoneChemical (H3PO4) activation + NH3 chemical modification0.245873.1n/a[81]
ChestnutChemical (NH3) activation~0.225613.42.3[82]
Rice huskCO2 activation + leaching with K2CO30.341097n/a3.1[83]
Gum Arabic tree seed shellKOH activation0.581472n/a3.4[84]
WheatKOH activation0.5814385.73.5[85]
StarchDry chemical activationn/a19577.53.8[86]
Hazelnut shellKOH activation0.4912705.63.9 (293 K)this work
Hazelnut shellKOH activation0.6419635.04.0[87]
Fern leavesKOH activation0.3315934.54.1[88]
Peanut shellKOH activation0.6819625.44.1[87]
Bean dregKOH activation + N-doping0.431060n/a4.2[89]
Cotton stalkKOH activationn/a26956.94.2[90]
Carrot peelsKOH activation0.4013795.64.2[88]
Walnut shellsKOH activation0.5214684.34.3[87]
Cupuassu shellKOH activation0.4322217.84.4[91]
Walnut shellsKOH activation0.5514206.24.4 (293 K)this work
BambooKOH activation~ 0.36~18467.04.5[39]
Assai stoneKOH(CO2) activation0.8632506.14.5[92]
Peanut shellKOH activation~ 0.39567.14.6[93]
Pine nutshellKOH activationn/an/a7.75.0[34]
Coconut shellKOH + N-doping0.731535~7.05.0[94]
Walnut shellKOH activation0.9418689.65.2[14]
Argan fruit shellKOH(NaOH) activation1.042251 n/a5.6[95]
ChitosanMolten salt template synthesis0.5620257.95.6[96]
Common
Polypody
KOH activation0.9219949.15.7[97]
Table 5. Total and deliverable CO2 adsorption capacities of the carbon adsorbents, which were prepared from walnut and hazelnut shells, evaluated at 293 K and a pressure drop from 1 to 0.1 MPa.
AdsorbentTotal Capacity,
[m3(NTP)/m3]
Deliverable Capacity,
[m3(NTP)/m3]
WNS-AC-2270115
HN-AC-3240110
Disclaimer/Publisher’s Note: The statements, opinions and data contained in all publications are solely those of the individual author(s) and contributor(s) and not of MDPI and/or the editor(s). MDPI and/or the editor(s) disclaim responsibility for any injury to people or property resulting from any ideas, methods, instructions or products referred to in the content.

