1. Introduction
Skin melanoma is a relatively rare but one of the most aggressive types of tumors. The incidence of melanoma varies depending on the country and geographical region [
1]. In the Russian Federation, the average annual growth rate of melanoma incidence over the past 10 years (2.69%) is more than twice the similar indicator for the overall oncology morbidity (1.13%) [
2]. In 2021, 11,412 new cases of melanoma and 3217 fatal cases were registered, which accounted for 69.2% of all deaths from malignant skin neoplasms [
2]. A number of new agents for melanoma treatment have been registered by the FDA and EMA, and a number of promising targets have been proposed recently [
3,
4,
5,
6,
7]. Patient-derived tumor models, including melanoma cell lines and tumor xenografts, are invaluable tools for developing and conducting highly reproducible studies under certain conditions that provide insight into drug sensitivity, the basics of cell biology, and elucidation of signaling pathways.
More than 2000 melanoma cell lines have been established worldwide [
8]. Among the most-used sources are the American Type Culture Collection (ATCC
® TCP-1013™ and ATCC
® TCP-1014™ panels); the European Collection of Authenticated Cell Cultures containing melanoma cell lines collected during the ESTDAB project (
https://www.ebi.ac.uk/ipd/estdab/, accessed on 27 October 2023); Rockland Immunochemicals Inc distributing the Wistar Institute melanoma cell lines developed and characterized over several decades in the laboratory of Meenhard Herlyn; and the Ludwig Institute melanoma cell line panel [
9]. The basic melanoma cell line information includes patient clinical data, proliferative activity data, and the mutational status for common mutated genes in melanoma. The extent to which melanoma cell lines from different sources are characterized varies. For instance, the ECACC melanoma cell lines were extensively immunologically characterized and HLA-typed. The Rockland melanoma cell lines were genetically characterized by sequencing [
10]. The ATCC melanoma cell line panels were provided with mutational status for four melanoma-associated genes. The Ludwig Institute melanoma cell lines were HLA-typed and their transcriptomes were profiled.
Melanoma is a highly heterogenous disease. To account for this, a number of different well-characterized melanoma cell lines should be used in potential target research and preclinical studies of novel treatment agents. Otherwise, the possibility that unrepresentative samples have been examined remains.
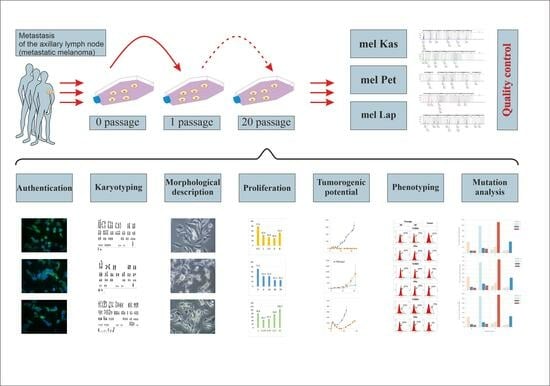
To this end, we have established three metastatic melanoma cell lines, obtained from the tumor material of patients with a verified diagnosis, as part of the bioresource collection in the N.N. Blokhin National Medical Research Center of Oncology of the Ministry of Health of the Russian Federation (
https://biocollection.org, accessed on 27 October 2023). The new cell lines were characterized using protocols developed at the center.
Studies were conducted across a wide range of indicators: assessment of proliferative activity, morphological and karyotypic analysis, phenotyping and genotyping, study of tumorigenicity and reproducibility, and others. To control the quality of the sample, STR profiling and inter-species contamination analysis were performed. Taking into account the specific feature of melanoma, namely the early metastasis of tumors, the following were selected as markers of the molecular characteristics of tumor cells: the protein of metastatic tumor aggressiveness and resistance to taxanes—TUBB3, cytokeratins—proteins of acquisition of epithelial–mesenchymal transient-like aggressive phenotype, as well as the PD-L1 protein—the most important target of immune checkpoint inhibitors and ERa as an important regulator of biological processes in cells and a potential target of hormone therapy.
2. Materials and Methods
Metastatic melanoma tumor specimens collected from newly diagnosed chemotherapy-naïve patients observed at the N.N. Blokhin National Medical Research Center of Oncology of the Ministry of Health of Russia were used (
Table 1). The study with patients was approved by the local ethics committee of the N.N. Blokhin National Medical Research Center of Oncology of the Russian Ministry of Health (the approval code is No. 7/2023. The approval date: 27 July 2023) and written informed consent was obtained.
To name a cell line, we used an abbreviation for the tissue for the first part of the cell line names and a random combination of letters for the second part.
2.1. Cell Culture Procedure
The tissue sample in a 50 mL tube filled 2/3 with transport medium (DMEM, 2% FBS, 2 mM L-glutamine, 0.01 mg/mL gentamicin) was shipped to the laboratory under sterile conditions within 30 min after excision. A cell suspension was obtained via the mechanical disaggregation of the tumor material on a BD Medimachine (BD Biosciences, Franklin Lakes, USA) in a 50 μm pore size sterile Medicons chambers (BD Biosciences, Franklin Lakes, USA) for 1–2 min. To remove large tissue fragments, the suspension was passed through sterile nylon filter Filcons with pore diameter 70 μm (BD Biosciences, Franklin Lakes, USA). In a 25 cm2 culture flask, 0.5 to 3 million cells were added in 5 mL of MBM-4 medium (Lonza, Switzerland) and placed in a CO2 incubator at 37 °C in a 5% CO2 atmosphere. After 24 h, the culture medium was replaced with a fresh one, and then the medium was changed every 3–4 days. The cell culture was considered stable (immortalized) when it reached 20 passages without a decrease in proliferative activity.
Cells were cultivated until a 70–80% cell monolayer was formed at 37 °C in a 5% CO2 atmosphere. The first 5 passages used growth medium for melanocytes with additives and growth factors MVM-4 (Lonza, Visp, Switzerland); from the 6th to the 10th passage, they were transferred to full growth medium RPMI-1640, containing 20% FBS, 1% HEPES, 1% NEAA, 2 mM L-glutamine, 0.01 mg/mL gentamicin, with subsequent transfer to full RPMI-1640 with 10% FBS, 2 mM L-glutamine, 0.01 mg/mL gentamicin.
2.2. Morphological Description
Cells at the 30th passage were seeded on glass, washed after a day, fixed, and stained with Romanowsky–Giemsa stain. The preparations with stained cells were evaluated using a light microscope (Leica DM1000, Wien, Austria), and images were obtained using a digital camera (Leica DFC295, Wien, Austria).
2.3. Karyotyping
Karyotype analysis was conducted after confirming the stability of the cell line (over 20 passages) and not earlier than the 3rd passage after thawing from cryopreservation (if necessary). To obtain preparations of metaphase chromosomes, cells were re-seeded into a 75 cm2 culture flask (Corning, New York, NY, USA). Upon reaching 80% confluence, the cell monolayer was replaced with a fresh one; then, after 23 h, colchicine solution (1 mg/mL) was added to reach its concentration in the final solution of 0.1 mg/mL and incubated for 1 h in a CO2 incubator at 37 °C in a 5% CO2 atmosphere. Next, cells were dissociated from the bottom of the flask with a 0.05% solution of trypsin-EDTA (PanEko, Moscow, Russia). After hypotonic treatment with a 0.075 M solution of KCl for 15 min, cells were fixed with a mixture of methanol and glacial acetic acid in a ratio of 3:1 (for mel Kas—9:1), changing the fixative three times. The prepared cell suspensions were spread onto chilled moistened slides (Epredia, Kalamazoo, MI, USA) above a water bath (ThermoFisher, Waltham, MA, USA). Structural karyotypic analysis was carried out via differential staining of preparations using the G-band staining method, with at least 100 metaphases studied for each line.
2.4. Authentication of Obtained Cell Lines
To confirm the melanoma origin of the cell lines, the expression of MelanA was assessed by the immunocytochemical method. For setting up an indirect immunofluorescence reaction, primary antibodies to MelanA (Dako, Agilent, Santa Clara, CA, USA) at a dilution of 1:100 and secondary antibodies FITC-conjugated goat anti-mouse IgG H&L (ab6785) at 1:800 (Abcam, Trumpington, UK) were used. For staining cell nuclei, 4′,6-diamidino-2-phenylindole (DAPI) was used. Results were evaluated using the AxioScopeA.1 microscope (Zeiss, Oberkochen, Germany). The analysis was conducted using Zen2012 software (Blue edition).
For the purpose of authentication and subsequent routine confirmation of the authenticity of the cell line, genomic DNA was isolated from the primary sample and after the 20th passage using the Genomic DNeasy Blood and Tissue kit (Qiagen, Hilden, Germany) in accordance with the manufacturer’s protocol. The amount of DNA was evaluated on a Qubit 4.0 fluorometer using the Qubit™ dsDNA BR Assay Kit (Thermo Fisher, Waltham, MA, USA). The authenticity of the cell lines (compared to the primary material) was confirmed by profiling based on short tandem repeats (STR) for 26 highly polymorphic loci using the COrDIS “EXPERT 26” kit (Gordiz, Moscow, Russia) [
11]. PCR products were separated via capillary electrophoresis on a genetic analyzer with laser-induced fluorescent detection (Applied Biosystems 3500×L, Waltham, MA, USA) using 3500×L Genetic Analyzer 24-Capillary Array (Applied Biosystems, Waltham, MA, USA) of 50 cm length and POP-7 polymer (Applied Biosystems, Waltham, MA, USA). STR profiles were analyzed in the GenMapper 6 software.
2.5. Quality Control of Samples
Extracellular contamination by bacteria, yeast, and protozoa was controlled through visual analysis during cell cultivation in an antibiotic-free environment for two weeks using the Leica DM1000 microscope (Wien, Austria).
Intracellular contamination by mycoplasma was controlled by using the PCR method with the MycoReport kit (Evrogen, Moscow, Russia), followed by electrophoretic separation and detection in agarose gel.
The analysis of cellular line contamination by carcinogenic viruses EBV, CMV, HHV6, and HPV was carried out using real-time PCR with the kits “Amplicen EBV/CMV/HHV6-screen-FL” and “Amplicen HPV VKR genotype-titre-FL”, according to the manufacturer’s recommendations.
2.6. Proliferation and Doubling Time
To assess the cell growth and proliferation, the automatic cell analyzer xCelligence (ACEA Bioscience Inc., Santa Clara, CA, USA) was used. In the wells of an E-Plate 16 plate (ACEA Bioscience Inc., Santa Clara, USA), containing 100 μL of growth medium, cells were seeded in triplicate in 100 μL medium, in quantities of 0.5, 1, 2.5, 4, and 8 thousand cells for mel Kas; 1, 3.125, 6.25, 12.5, and 25 thousand cells for mel Lap; 3, 6, 10, 30, and 70 thousand cells for mel Pet. The plate was set in the device and placed in a CO
2 incubator at 37 °C in a 5% CO
2 atmosphere. Every hour, changes in the values of electrical impedance were recorded in real time for at least 72 h, as previously described [
12]. The cell index (CI), reflecting impedance changes [
12], the magnitude of which depends on the number of cells in the well, was recorded. The signal of the well filled with cultural medium was used as the base level of resistance, which was subtracted from the obtained CI values. Using the RTCA Software Lite (version 2.2.5), the doubling time of the cell population and the Slope parameter, characterizing the speed of tumor cell proliferation, were automatically calculated for the phase of logarithmic growth.
2.7. Tumorigenic Potential
Female Balb/c nude mice, 6–10 weeks with a body weight of 20–25 g, obtained from the breeding facility of N.N. Blokhin NMRC Oncology, were used. Mice (5 per group) were kept in conditions with regulated humidity and lighting, food and water access ad libitum. Animal experiments were carried out in accordance with the European Convention for the Protection of Vertebrate Animals used for Experimental and Other Scientific Purposes of 1986. The experimental protocols were approved by the local ethical committee of N.N. Blokhin NMRC Oncology (the approval code is No. 11/2021. The approval date: 9 November 2021).
Cell suspensions of mel Kas and mel Lap were prepared in 199 nutrient medium (PanEco, Moscow, Russia) at a concentration of 10 million cells in 0.5 mL. Suspensions of a given concentration were subcutaneously bilaterally injected into Balb/c nude female mice, 0.5 mL per flank. The cell suspension of mel Pet in 199 nutrient medium (PanEco, Moscow, Russia) at a concentration of 10 million cells was injected subcutaneously bilaterally into Balb/c nude female mice mixed with basal membrane extract (Matrigel®, Corning, New York, NY, USA) in a 1:1 ratio, and the final volume of the injected mixture was 0.5 mL.
Animals were inspected daily, tumor measurements were performed 2–3 times a week, and tumor volumes were calculated using the formula , where L, W, and H are three mutually perpendicular measurements of the tumor node.
Samples were considered tumorigenic if the tumor growth was observed within 60 days after transplantation.
When the average tumor volume reached at least 100 mm3, the animals were euthanized via cervical dislocation and tumor material was collected. For the reproducibility assessment, the tumor node was subjected to mechanical disaggregation, a homogenate containing 30% tumor tissue in 199 nutrient medium (PanEco, Moscow, Russia) was prepared, and animals were re-inoculated. The model was considered reproducible if tumor growth dynamics were observed in at least two passages.
2.8. Phenotyping
Molecular phenotype characterization of the obtained melanoma lines was conducted via flow cytometry. The expression of each marker was evaluated based on the results of three experiments for tumor cells at 20 and 30 passages, as well as for tumor samples obtained as a result of cell transplantation to Balb/c nude mice.
In the study, primary antibodies to TUBB3 (EP1569Y, Abcam, Trumpington, UK), PD-L1 (SQab1716, Arigo Biolaboratories, Hsinchu, Taiwan), ERα (clone SP1, Abcam, Trumpington, UK), vimentin (SP20, Biocare, Pacheco, CA, USA), cytokeratins (MNF116, DAKO, Carpinteria, CA, USA), as well as secondary antibodies conjugated with DyLight650 fluorochrome (ab98729 or ab96871) and DNA dye Hoechst 33258 (Sigma-Aldrich, Saint Louis, MI, USA) were used. The protocols for single and double immunofluorescent staining have been previously described [
13].
Cell fluorescence was measured on a “Navios” flow cytometer (Beckman Coulter, Brea, CA, USA). The specific cell fluorescence was calculated by the Kolmogorov–Smirnov test using the FlowJo software (USA) version 10.0.8. Histograms and dot plots of cell distribution depending on the fluorescence intensity were constructed in WinMDI 2.9 software. The following indexes were evaluated: the level of the marker expression (%)—the number of specifically fluorescent cells relative to the control (incubation of the cells with secondary antibodies only); the level of de novo expression of cytokeratins (%)—the number of the cells co-expressing cytokeratins and vimentin relative to the number of the cells expressing only vimentin.
2.9. Mutation Analysis
To identify the mutational profile, we conducted whole-exome sequencing. Genomic DNA was isolated from the cell lines of the 20th passage using the DNeasy Blood and Tissue kit (Qiagen, Hilden, Germany) by following the manufacturer’s protocol. The quality control of the obtained genomic DNA was carried out via agarose gel electrophoresis. The DNA amount was evaluated on a Qubit 4.0 fluorometer using the dsDNA HS Assay Kit (Thermo Fisher, Waltham, MA, USA).
The preparation of libraries from genomic DNA was performed using the MGIEasy Universal DNA Library Prep Set (MGI Tech, Shenzhen, China) by following the manufacturer’s protocol. For the preparation of each library, we used 600 ng of genomic DNA per sample. To obtain DNA fragments with an average length of 250 bp, we performed mechanical fragmentation using the focused ultrasonic homogenizer S220 Covaris (Covaris, Woburn, MA, USA) according to the conditions specified in the library preparation kit guide. The quality control of the obtained DNA fragment libraries was carried out using agarose gel electrophoresis. The concentration of libraries was measured on a Qubit 4.0 fluorometer using the dsDNA HS Assay Kit (Thermo Fisher, Waltham, MA, USA) according to the manufacturer’s protocol.
The DNA libraries were pooled, and enrichment was performed using the SureSelect Human All Exon v7 probe set (Agilent Technologies, Santa Clara, CA, USA) by following the RSMU_exome protocol [
14]. The concentrations of enriched library pools were measured on a Qubit 4.0 fluorometer with a dsDNA HS Assay Kit by following the manufacturer’s protocol. The enriched library pools were circularized using the MGIEasy Universal DNA Library Prep Set by following the manufacturer’s protocol. The concentrations of enriched, circularized library pools were measured on a Qubit 4.0 fluorometer using the Qubit ssDNA Assay Kit (Thermo Fisher, Waltham, MA, USA).
The sequencing procedure of the libraries was carried out on the MGISEQ-2000 platform using the DNBSEQ-G400RS High-throughput Sequencing Set in paired-end reading mode with a length of at least 100 bp each, according to the manufacturer’s protocol (MGI Tech, Shenzhen, China).
Fastq format files were generated using the manufacturer’s software zebracall V2 (MGI Tech, Shenzhen, China).
The raw sequencing data for this study were deposited in the European Nucleotide Archive (ENA) at EMBL-EBI under accession number PRJEB64662 with the following BioSample numbers: SAMEA114221449 (mel Kas), SAMEA114221450 (mel Lap), SAMEA114221451 (mel Pet).
Bioinformatics quality control of the obtained sequencing data was carried out using FastQC v0.11.9 and Trimmomatic v0.39 software. Bioinformatics processing of sequencing data for each sample was performed, including alignment procedure to the GRCh37 reference genome using bwa-mem and SAMtools v1.9 software, obtaining quality metrics of exome enrichment using Picard v2.22.4 software, variant calling using bcftools mpileup v1.9 software.
The average coverage for samples was more than 75×, the proportion of target regions with 10× coverage was more than 95%.
Annotation and filtration of variants were carried out using the OpenCravat [
15] software v2.4.2. Filtration was conducted according to the following criteria: (1) variants with a read depth of <13 were excluded; (2) variants with an average quality score of read coverage of <50 were excluded; (3) variants (single nucleotide polymorphisms, indels) with a frequency of >1% according to the gnomAD (2.2.0) database were excluded; (4) variants from the coding region were left; (5) non-synonymous variants were left.
To calculate the mutation load, filtering was carried out via read depth, read quality, variant frequency according to the gnomAD database as described above, and also variants present in the dbSNP common (1.0.1) database were excluded.
3. Results
Three melanoma cell lines from newly diagnosed, chemotherapy-naïve patients (
Table 1) were obtained: mel Kas, mel Pet, and mel Lap. All cell lines survived for at least 40 passages with stable morphological characteristics.
The mel Kas cell line is mainly represented by mature atypical spindle-shaped cells, epithelioid-like cells are also found, the nuclei are centrally and eccentrically located, and a moderate amount of mitosis is observed. The nuclear–cytoplasmic index (NCI) is disturbed 2.5:1 (
Figure 1).
The mel Pet cell line is represented by polymorphic cells, predominantly epithelioid-like and spindle-shaped, with basophilic cytoplasm, with eccentrically or centrally located nuclei, in which one to six nucleoli are visualized; a large number of cells are in mitosis (
Figure 1).
The mel Lap cell line consists mainly of mature atypical polymorphic cells and cells of various degrees of generation. Cells contain basophilic cytoplasm, with eccentrically or centrally located nuclei, in which one to three nucleoli are visualized; a large number of cells are in mitosis (
Figure 1).
The detected expression of the MelanA melanocytic marker confirmed the melanoma origin of the cell lines (
Figure 2).
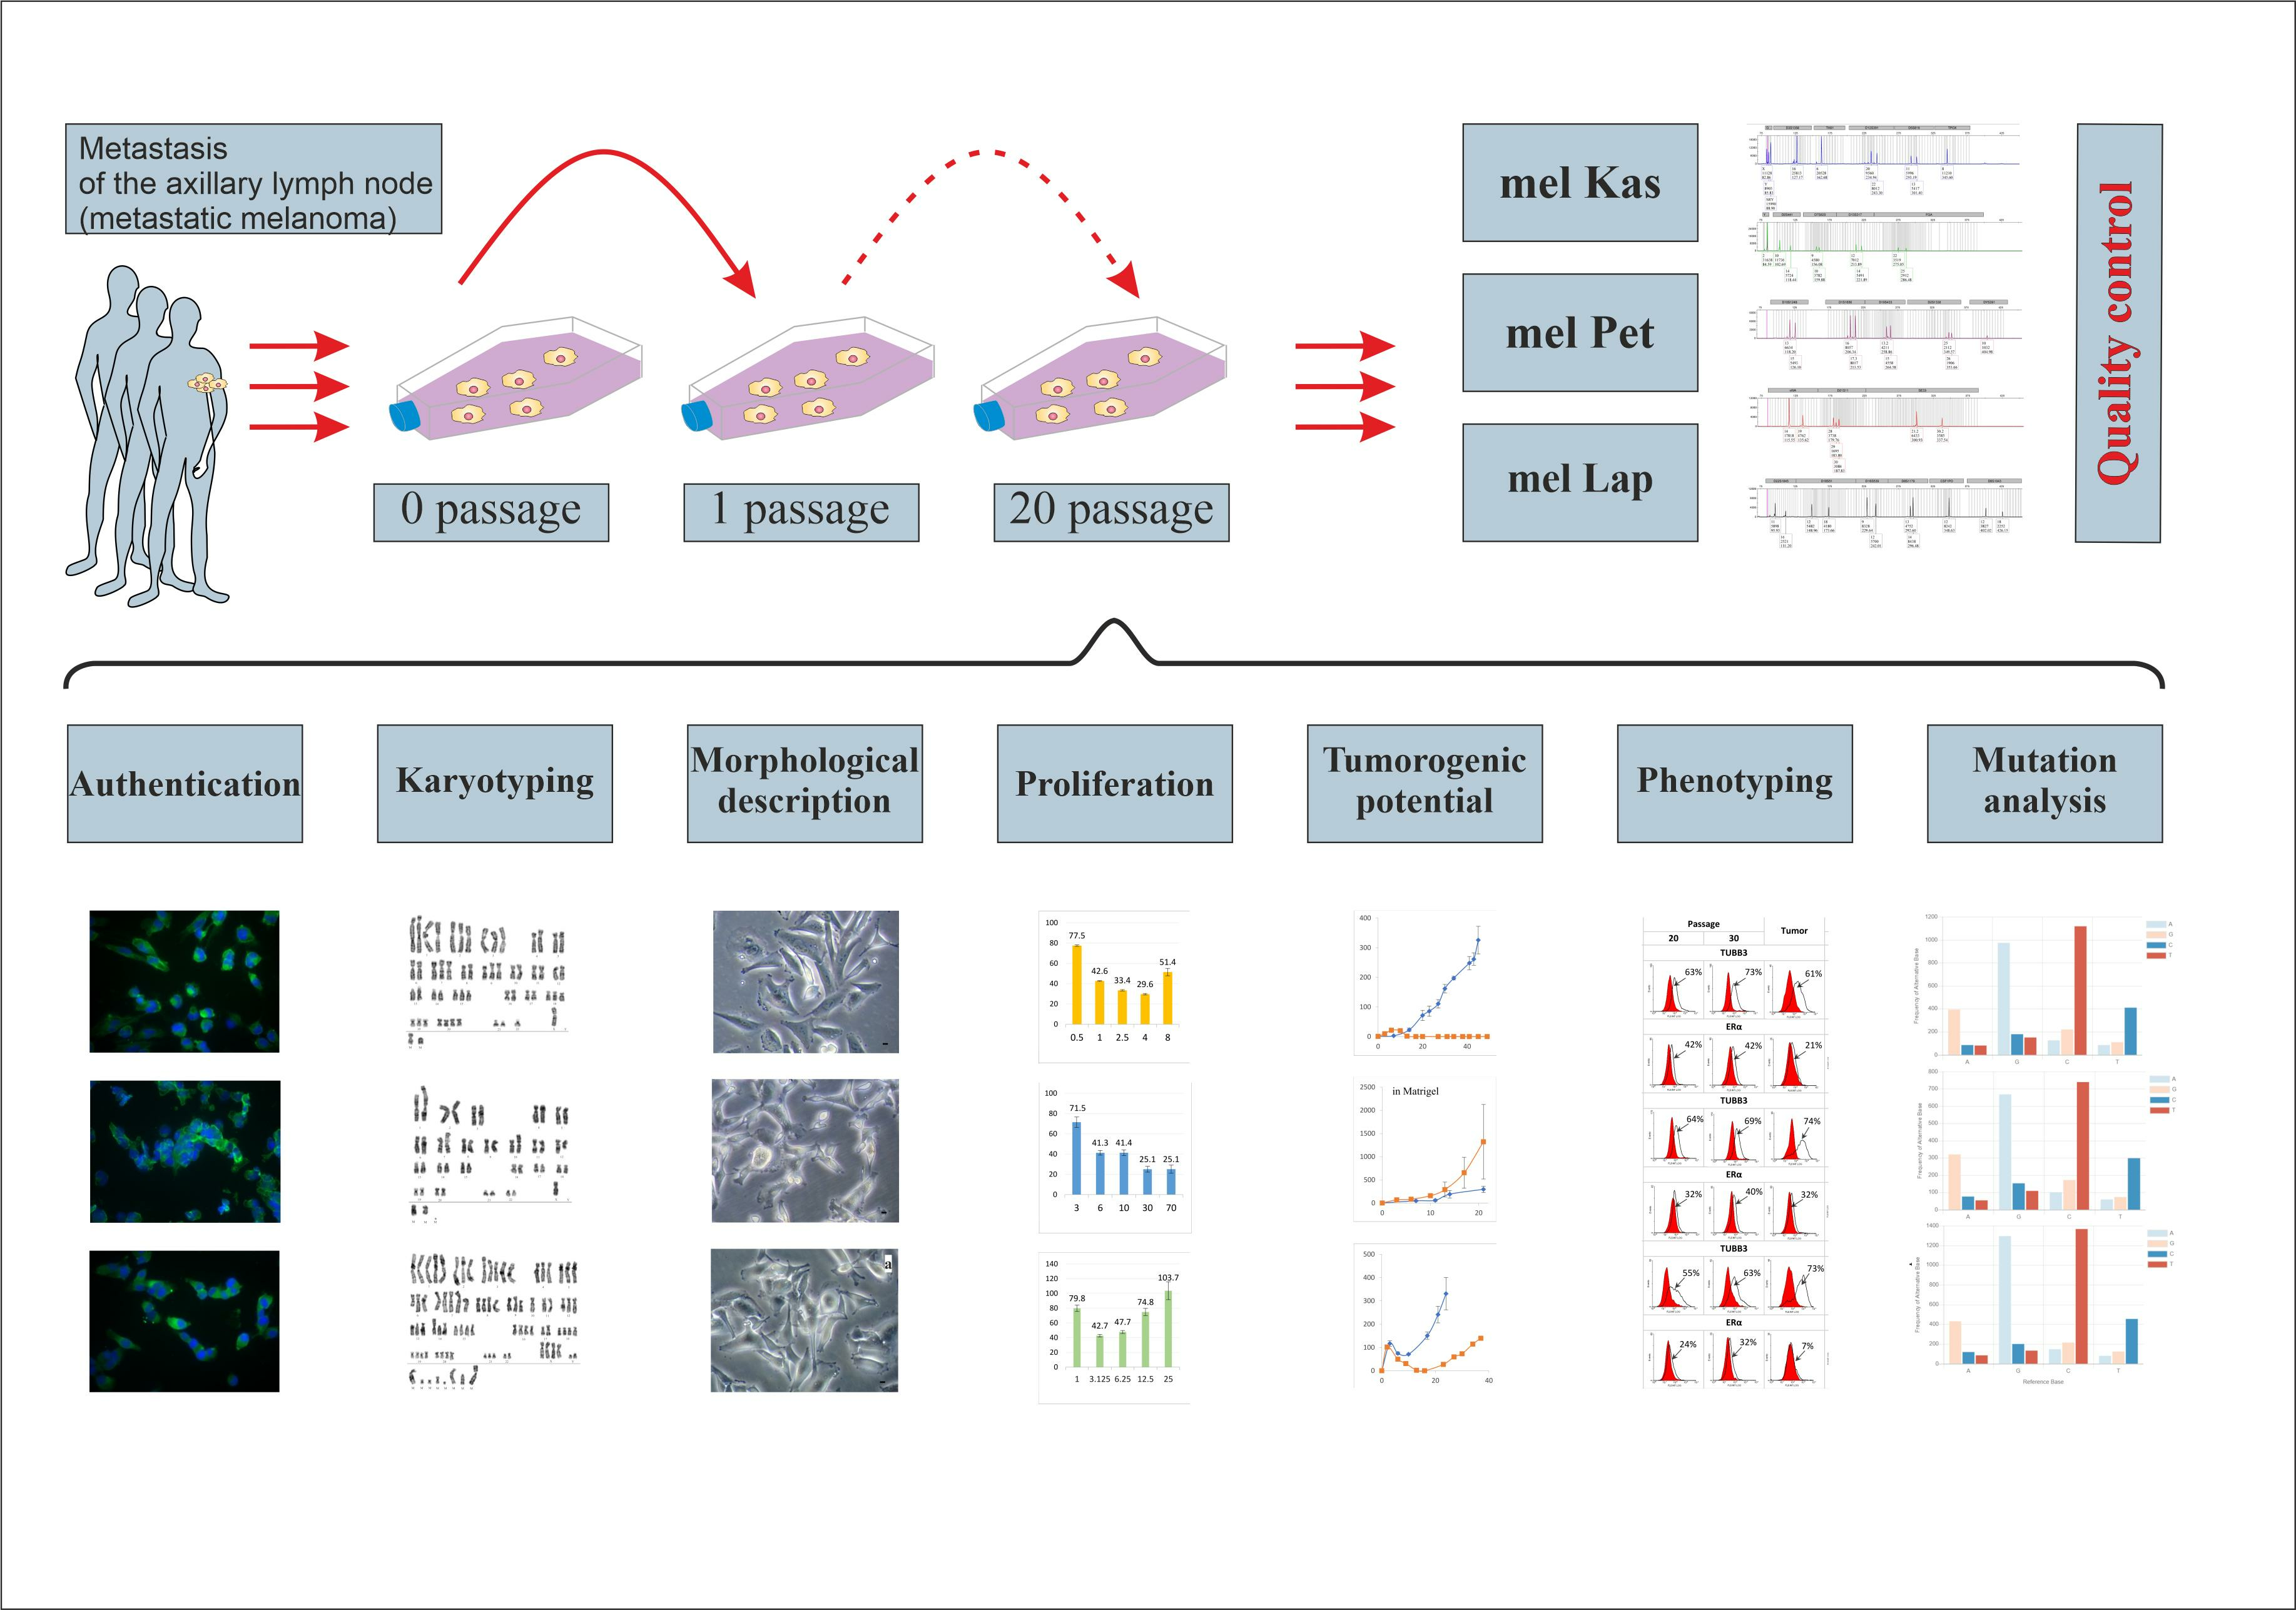
According to the results of karyotyping of the obtained melanoma cell lines, the modal number of chromosomes was determined: a hyperdiploid (2n+) for the mel Kas line; near-diploid (2n), and in part of the cells near-tetraploid (4n), and even hypo-octaploid (8n) (172–179 chromosomes) in the mel Pet cell line; and a hypotetraploid (4n−) in the mel Lap line. The main cytogenetic abnormalities for each line were identified, and marker chromosomes of unidentified origin were detected (
Figure 3).
Structural chromosome rearrangements of the mel Kas line include two derivative chromosomes 5 with additional material of chromosome 1 (1q35-qter). In some cells, a break in chromosome 1 can be observed. Trisomy of chromosomes 2, 3, 7, 9, 18, 19, and 20; monosomy of chromosome 22; and tetrasomy of chromosomes 5 (two of which are derivative) were detected. There are two recognizable marker chromosomes.
Structural chromosome rearrangements of the mel Pet line include the translocation of chromosomes 7 and 12, the translocation of two long arms of chromosome 10 with the formation of an isochromosome, and the duplication of a region of the short arm of chromosome 1. There are 1–2 small marker chromosomes.
In the karyotype of the mel Lap cell line, disomy of chromosomes Y, 10, 11, 17, and 22 (in some cells disomy of chromosomes 4 and 13); trisomy of chromosome 21; and pentasomy of chromosome 7 (in some cells hexasomy of chromosome 7) were detected. Structural chromosome rearrangements include the translocation of chromosome 14 and a chromosome that could not be identified; additional material of unknown origin in the q36 region of the long arm of chromosome 7; and deletion of the q21 region of the long arm of chromosome 6. Moreover, there is a deletion of the p21 region of the short arm of chromosome 9 (includes the tumor suppressor genes
CDKN2A,
CDKN2B, and
ARF) that is typical for primary sporadic melanomas and is not an in vitro phenomenon [
16,
17].
In the mel Pet and mel Lap lines, not all the chromosomes involved in the rearrangements, and not all break points, could be precisely identified.
A comparison of the obtained STR profiles of the primary tumor sample from the patient and the cell line at the 20th passage confirmed the authenticity of the obtained cell lines. The obtained profiles (
Table 2) have been entered into the local database of the resource collection center.
Control of inter-species (bacterial, viral, yeast) and intra-species contamination showed the purity of the obtained cell lines.
Growth curves for each cell line were obtained at different seeding density values (
Figure 4). The mel Kas cell line is classified as moderately adhesive (the maximum CI value was 4.5 units), while mel Lap and mel Pet are weakly adhesive, as the maximum CI value for them is 2.5 and 3 units, respectively [
18].
The lag phase, which is the period for cell attachment to the substrate and spreading, is approximately 3.5 h for mel Pet, 15 h for mel Kas, and between 15 and 15.5 h for mel Lap.
For the mel Pet cell line, after forming a confluent monolayer and reaching a plateau on the graph, an additional growth phase is observed (
Figure 4). Visual inspection shows no contact inhibition of proliferative activity—cells detach and continue to divide in a semi-suspension form, both as individual cells and with the formation of three-dimensional globular structures. Since the CI values reliably correlate with the number of cells on the substrate only until a monolayer is reached [
12], the time interval reflecting the log phase to the first plateau was taken to calculate growth characteristics at a seeding concentration of 70 k cells per well.
The obtained doubling time and slope values (
Figure 5) allow for adjusting the cultivation conditions according to the set task. Optimal seeding concentrations for the established cell lines, demonstrating the maximum proliferation rate with minimal doubling time, were 4 k cells/well for mel Kas and 6 k cells/well for mel Lap. For the mel Pet cell line, the recommended seeding concentration was 6–10 k cells/well, as at higher values, the cultivation conditions are not optimal due to the rapid formation of a confluent monolayer.
In tumorigenicity experiments, the mel Kas cell line showed stable tumor growth starting on day 7 after inoculation. Tumors were characterized by moderate growth over 45 days. On day 45, the tumors were collected and transferred to the second passage. During observation of the second passage, stable tumor growth was not detected (
Figure 6). The mel Kas cell line was considered tumorigenic; however, it was not reproducible in vivo.
The mel Pet demonstrated tumor growth only in the presence of Matrigel
®. From day 9 (after resorption of Matrigel
®), measurements of the tumor nodes were made. The growth of the second passage tumors was characterized by a moderate speed and intensity. By day 21, the average tumor volume was 1321.4 ± 803.6 mm
3 (
Figure 6). The mel Pet cell line was considered tumorigenic, and the tumor model in vivo was reproducible.
In the case of the mel Lap cell line, the appearance of tumor nodes was observed 3 days after the grafting. The tumor volume increased more than three times by day 24 after grafting. On day 37, the average tumor volume reached 139.6 mm
3 (
Figure 6). Thus, the mel Lap cell line caused reproducible tumors in Balb/c nude mice.
The tumor growth curve parameters of the studied xenograft models are presented in
Table S1.
The results of the assessment of the molecular phenotype of the three cell lines, as well as their xenografts, are presented in
Figure 7. Actual histograms of the cell distribution according to the fluorescence intensity after incubation with antibodies to TUBB3, PD-L1, ERα, and Vim + Cyt are shown. In the latter case, de novo Cyt expression was evaluated in melanoma cells expressing only Vim with double immunofluorescent staining. The stability of this molecular characteristic was assessed for 20 and 30 passages in melanoma cells in vitro.
First of all, the fact of a high (more than 50%) expression of TUBB3 and PD-L1 in all studied melanoma cell lines should be noted, while the level of ERα expression did not reach 50% and was minimal in the mel Pet cells (24% and 32% at 20 and 30 passages, respectively). At the same time, the level of de novo expression of Cyt (Vim + Cyt) varied significantly in different cultures and was minimal in the mel Lap cells.
Transitioning from in vitro to in vivo growth, the phenotype stability of all the studied cell lines was constant only for the TUBB3 expression level. For the other markers, a variable degree of decrease in their expression level was noted when the cells were growing in a solid xenograft in vivo.
To identify the mutational profile, we conducted whole-exome sequencing (WES). The primary processing of the sequencing data showed a satisfactory quality: the average coverage for samples was over 75×, and the proportion of target regions with 10× coverage was over 95% (
Table S2).
For each sample, more than 1100 synonymous variants and over 1900 non-synonymous variants were obtained (
Table S3). The average value of the non-synonymous to synonymous ratio (N:S ratio) was 1.6:1, which is not higher than the 2.5:1 predicted for nonselected, passenger mutations, indicating that most of the mutations are likely to be passengers rather than drivers in melanoma [
19]. The assessment of the N:S ratio via the exome analysis of 14 metastatic melanomas found a similarly low N:S ratio (2.0:1) [
20].
The analysis of the nucleotide substitution pattern in all our three melanoma cell lines reveals that the most frequent nucleotide substitutions were C > T/G > A (
Figure S1), which corresponds to the known signature of melanoma mutation associated with UV light exposure [
21]. The mutation load was on average 48 variants per Mb (
Table S3).
To characterize newly established cell lines, genes were selected where mutations are most often encountered in melanoma. We chose the top 20 genes from the COSMIC database and 19 genes from the commercial melanoma panel Oncomine™ [
22]. Mutations were found in oncogenes (
BRAF,
EZH2,
KIT,
KRAS,
NRAS,
ROS1) and tumor suppressor genes (
CDKN2A,
FAT4,
KMT2C,
LRP1B,
PTEN,
PTPRB,
TP53). In the mel Kas and mel Lap cell lines, two variants were found in the
LRP1B gene, associated with a better immunotherapy survival outcome for melanoma patients [
23]. Three variants were found in the
CDKN2A gene in the mel Kas cell line. The distribution of obtained variants across the genes is presented in
Table 3 (here and henceforth in coordinates of genome assembly GRCh37).
For the identification of mutations in genes associated with melanoma development, genes were chosen from the review of Toussi et al. [
24], the commercial panel “Hereditary Melanoma” [
25], and also the website of the National Cancer Institute of the US
https://www.cancer.gov (accessed on 27 October 2023) [
26]. The distribution of obtained variants across genes and types of nucleotide substitutions are presented in
Table 4.
The raw sequencing data for this study were deposited in the European Nucleotide Archive (ENA) at EMBL-EBI under accession number PRJEB64662 with the following BioSample numbers: SAMEA114221449 (mel Kas), SAMEA114221450 (mel Lap), and SAMEA114221451 (mel Pet).


 ,
, 


 1st passage,
  2nd passage.


