Article

The Role of Cytochrome P450 3A4-Mediated Metabolism in Sorafenib and Lapatinib Hepatotoxicity

by
Mitchell R. McGill
1,2,3,*,
Yihong Kaufmann
4,
Francesca V. LoBianco
5,
Mary A. Schleiff
6,
Nukhet Aykin-Burns
5 and
Grover P. Miller
6,*
1
Department of Environmental Health Sciences, Fay W. Boozman College of Public Health, University of Arkansas for Medical Sciences, Little Rock, AR 72205, USA
2
Department of Pharmacology & Toxicology and Pathology, College of Medicine, University of Arkansas for Medical Sciences, Little Rock, AR 72205, USA
3
Department of Pathology, College of Medicine, University of Arkansas for Medical Sciences, Little Rock, AR 72205, USA
4
Department of Pediatrics, College of Medicine, University of Arkansas for Medical Sciences, Little Rock, AR 72205, USA
5
Department of Pharmaceutical Sciences, College of Pharmacy, University of Arkansas for Medical Sciences, Little Rock, AR 72205, USA
6
Department of Biochemistry and Molecular Biology, College of Medicine, University of Arkansas for Medical Sciences, Little Rock, AR 72205, USA
*
Authors to whom correspondence should be addressed.
Livers 2023, 3(2), 310-321; https://doi.org/10.3390/livers3020022
Submission received: 8 March 2023 / Revised: 2 June 2023 / Accepted: 9 June 2023 / Published: 19 June 2023

Abstract

:
Tyrosine kinase inhibitors (TKIs) are increasingly popular drugs used to treat more than a dozen different diseases including some forms of cancer. Despite having fewer adverse effects than traditional chemotherapies, they are not without risks. Liver injury is a particular concern. Of the FDA-approved TKIs, approximately 40% cause hepatotoxicity. However, little is known about the underlying pathophysiology. The leading hypothesis is that TKIs are converted by cytochrome P450 3A4 (CYP3A4) to reactive metabolites that damage proteins. Indeed, there is strong evidence for this bioactivation of TKIs in in vitro reactions. However, the actual toxic effects are underexplored. Here, we measured the cytotoxicity of several TKIs in primary mouse hepatocytes, HepaRG cells and HepG2 cells with and without CYP3A4 modulation. To our surprise, the data indicate that CYP3A4 increases resistance to sorafenib and lapatinib hepatotoxicity. The results have implications for the mechanism of toxicity of these drugs in patients and underline the importance of selecting an appropriate experimental model.

1. Introduction

Tyrosine kinase inhibitors (TKI) are targeted cancer therapeutics which boast superior health outcomes relative to traditional chemotherapy drugs. Rather than target all dividing cells, TKIs inhibit membrane-bound receptor and cytoplasmic kinases that play key roles in cellular signaling and frequently display dysregulation in cancer [1]. In 2001, the effectiveness of this targeting strategy was made evident when imatinib was approved for the treatment of chronic myeloid leukemia by the US Food and Drug Administration (FDA) and the European Medicines Agency (EMA). Since then, this successful family of small heterocyclic drugs has been expanded to target a wide range of tyrosine kinases [2] for the treatment of blood, lung, breast, kidney, gastrointestinal, and skin cancers. These highly effective targeted cancer therapies account for about 75% of all small molecule kinase inhibitors [1]; yet, their use in the clinic poses serious health risks as well.
Hepatotoxicity is a major clinical concern for patients undergoing treatment with TKIs. During clinical trials, 25–35% of patients treated with these drugs experience low-to-moderate elevation of alanine and/or aspartate transaminases (ALT and AST, respectively), with about 2% developing severe liver injury. Overall, there is a four-fold increase in the risk of hepatotoxicity for patients dosed with TKIs compared to control patients [3]. As a result, drug labels for many TKIs mention the possibility of drug-induced liver injury (DILI) occurring in some patients and at least 15 come with a black box warning [4], underscoring the need to understand what drives the risk.
DILI mechanisms are multifactorial and often remain elusive to discovery; however, a well-established initiating event, especially for idiosyncratic DILI, is the metabolic bioactivation of drugs [5,6,7]. TKI bioactivation reactions yield a variety of reactive metabolites, including quinones, iminium ions, and epoxides [4], that are thought to alter biological pathways, manifesting in hepatocellular damage through oxidative stress, mitochondrial dysfunction, impaired glycolysis and other cytotoxic mechanisms [8,9,10,11]. Importantly, these bioactivation reactions are catalyzed primarily by cytochromes P450, especially CYP3A4 [12,13]. Thus, we hypothesized that CYP3A4-mediated metabolism is necessary for the induction of TKI toxicity.
We interrogated our hypothesis by assessing TKI toxicity while inhibiting or enhancing CYP3A4 activity in mouse and human cells. Initial studies focused on seven clinically relevant TKIs that undergo P450-mediated bioactivation, especially by CYP3A4, and induce DILI [4]. We measured the impact of inhibition of CYP3a11, the primary mouse ortholog of human CYP3A4 [14] and CYP3A4 on TKI toxicity using isolated primary mouse hepatocytes (PMH) and HepaRG cells. Surprisingly, Cyp3a11/A4 inhibition with ketoconazole (KCA) increased rather than decreased TKI toxicity based on cellular ATP levels. The findings were most significant for lapatinib (LAP) and sorafenib (SOR) and we confirmed those results by measuring lactate dehydrogenase (LDH) release as a more specific surrogate for cell death following exposure of PMH and HepaRG cells to those two TKIs. Similarly, we found that HepG2 cells, which lack P450s, were susceptible to SOR toxicity even in the absence of KCA. Finally, SOR toxicity was decreased in HepG2 cells by transgenic expression of CYP3A4. The results from these studies support the importance of CYP3A metabolism in the detoxification of SOR and possibly other TKIs, impacting the interpretation of cell culture studies on TKI toxicity risks.

2. Materials and Methods

2.1. Materials

All chemical solvents, salts, and buffers were purchased from Thermo Scientific (Waltham, MA, USA). The following TKIs were purchased from Cayman Chemical (Ann Arbor, MI, USA): erlotinib, gefitinib, imatinib, LAP, nilotinib, SOR, and sunitinib. KCA was purchased from Millipore-Sigma (St. Louis, MO, USA).

2.2. Animals

C57Bl/6J mice were acquired from The Jackson Laboratory (Bar Harbor, ME, USA). The animals were housed in a temperature-controlled facility with a 12 h light/dark cycle and ad libitum access to food and water and were used for experiments between 2 and 6 months of age. All animal protocols were reviewed and approved by the Institutional Care and Use Committee of the University of Arkansas for Medical Sciences.

2.3. Hepatocyte Isolation

PMH were isolated from liver using the collagenase perfusion technique, as previously described [15]. Only isolations yielding >40 million cells and cell viability >80% as determined by Trypan blue exclusion were used for experiments. After isolation and enrichment by Percoll gradient centrifugation, hepatocytes were seeded on either 96 or 6-well BioCoat collagen-coated plates (Corning, Corning, NY, USA) at 10,000 or 400,000 cells/well, respectively, in Gibco Williams’ Medium E with GlutaMax (Thermo Fisher, Waltham, MA, USA) containing 10% fetal bovine serum, 100 U/mL penicillin/streptomycin, and 2.5 mg/mL insulin and cultured at 37 °C with 5% CO2.

2.4. Cell Culture

For comparative purposes, we included studies with common hepatic cell lines. Human HepG2 cells expressing CYP3A4 were purchased from Hera Biolabs (Lexington, KY, USA). The HepG2 cells were generated as previously described [16]. Briefly, cDNA for CYP3A4 was cloned and ligated into the pcDNA3.1(+) with a G418 resistance gene and transfected using Lipofectamine. G418-resistant cells were then selected and subcloned in G418-containing medium. All CYP3A4 and WT HepG2 cells were grown on 96 or 6-well plates in the same medium as each other and the same as the PMH. Cells were used for experiments at approximately 70–80% confluence. HepaRG cells were acquired from Biopredic International (Saint Grégoire, France) and cultured as previously described [17]. Differentiated HepaRG cells were switched to dimethyl sulfoxide (DMSO)-free Williams’ E medium immediately before administration of experimental treatments.

2.5. Cell Viability

We measured ATP levels and lactate dehydrogenase (LDH) release as surrogate measures of cell viability. ATP was measured in cells using the CellTiter-Glo assay kit (Promega, Madison, WI, USA), according to the manufacturer’s instructions. LDH release was measured as previously described [18]. Briefly, the culture medium was removed from cells and a lysis buffer containing 25 mM HEPES, 5 mM EDTA, 0.1% CHAPS, and 1 mg/mL each of pepstatin, leupeptin, and aprotinin, pH 7.4, was added to the wells and incubated for 5 min. Cells were then scraped and transferred into a test tube. After centrifugation for 5 min at 12,000× g at 4 °C, aliquots of the cell lysate or medium were added to a reaction mixture in potassium phosphate buffer (60 mM, pH 7.5) containing 1 mM pyruvate and 216 mM NADH. Absorbance was measured at 340 nm over time with a spectrophotometer to determine LDH activity.

2.6. Cytochrome P450 Activity

Cytochrome P450 activity was measured in cell lysates using a modified Promega (Madison, WI, USA) P450-Glo assay. Briefly, cells were scraped in 25 mM HEPES buffer, pH 7.5, with 0.1% CHAPS and a mixture of several protease inhibitors (leupeptin, aprotinin, and pepstatin A). The samples were then centrifuged, and protein was measured in the supernatant using a Thermo Fisher (Waltham, MA, USA) Pierce bicinchoninic acid (BCA) protein assay kit, according to the manufacturer’s instructions. All samples were diluted in phosphate-buffered saline and used at a final concentration of 10 μg/μL protein to measure CYP3A4 activity.

2.7. Sunitinib Metabolism Study

Reactions were carried out with 0.50 mg/mL microsomal protein (HLM150) and 200 µM sunitinib in 100 mM potassium phosphate buffer (pH 7.4) with 0.1% DMSO co-solvent. Metabolic reactions were conducted with or without 20 µM KCA, which is a CYP3A4-selective enzyme inhibitor [19,20]. KCA was prepared in acetonitrile to avoid inhibitory organic solvent effects on CYP3A4 [21,22,23]. After 5 min pre-incubation with shaking at 37 °C, reactions were initiated by addition of an NADPH regenerating system (0.4 U/µL glucose-6-phosphate dehydrogenase, 3.3 mM glucose 6-phosphate, 3.3 mM MgCl2, and 1.3 mM NADP+) in 100 mM potassium phosphate buffer (pH 7.4). Reactions were quenched at 1 h with a 2-fold volume of cold methanol containing 10 µM internal standard dansylamide and incubated on ice for 10 min to optimize precipitation of proteins. After centrifugation at 2800× g at 4 °C for 15 min, supernatants were separated from the pelleted protein, transferred to a 96-well microplate, and evaporated to dryness using an Organomation Microvap Nitrogen Evaporator System (Organomation Associates, Inc., Berlin, MA, USA). Dried wells were resuspended in mobile phase (1:4 acetonitrile and water with 0.1% formic acid) for LC-MS analysis. Each set of reactions was performed in triplicate and replicated twice. Statistical analysis was performed by comparing reactions containing KCA to negative controls containing only co-solvent.
The LC-MS analysis of reactions used the previously published method by Chen et al. [24] with modifications. In this case, analytes from reactions were resolved with a 4.6 × 150 mm Waters XSelect HSS C18 3.5 μm column using a Waters Acquity UPLC and then detected with a Waters QDa mass spectrometer. Mobile phase for a gradient run consisted of solvents A (0.1% formic acid in deionized water) and B (0.1% formic acid in acetonitrile). The gradient method started with 80% solvent A, decreased to 5% over 15 min, held constant for 5 min, and returned to 80% solvent A over 3 min. The total flow rate was 1.0 mL/min. The ESI source was operated in positive-ion mode with a cone voltage of 15 V, and ion spectra was acquired in full scan mode monitoring the m/z range of 100–1000 amu targeting sunitinib (399.21 m/z) and N-desethyl sunitinib (371.18 m/z) and dansylamide (251.08 m/z). Analyte responses were normalized to the internal standard.

2.8. Statistics

The Shapiro–Wilk test was used to test normality. For normally distributed data, a comparison of two means was conducted using a t-test with Bonferroni correction for multiple comparisons. Comparison of three or more means with one independent variable was conducted using one-way analysis of variance (ANOVA) with a post hoc Student-Newman-Keul test. Two-way ANOVA was used to analyze data with two independent variables. For non-normally distributed data, the data were ranked prior to analysis. Except where indicated in figure legends, p-values < 0.05 were considered significant. All statistical analyses were performed in Prism (Graphpad Software, Boston, MA, USA).

3. Results

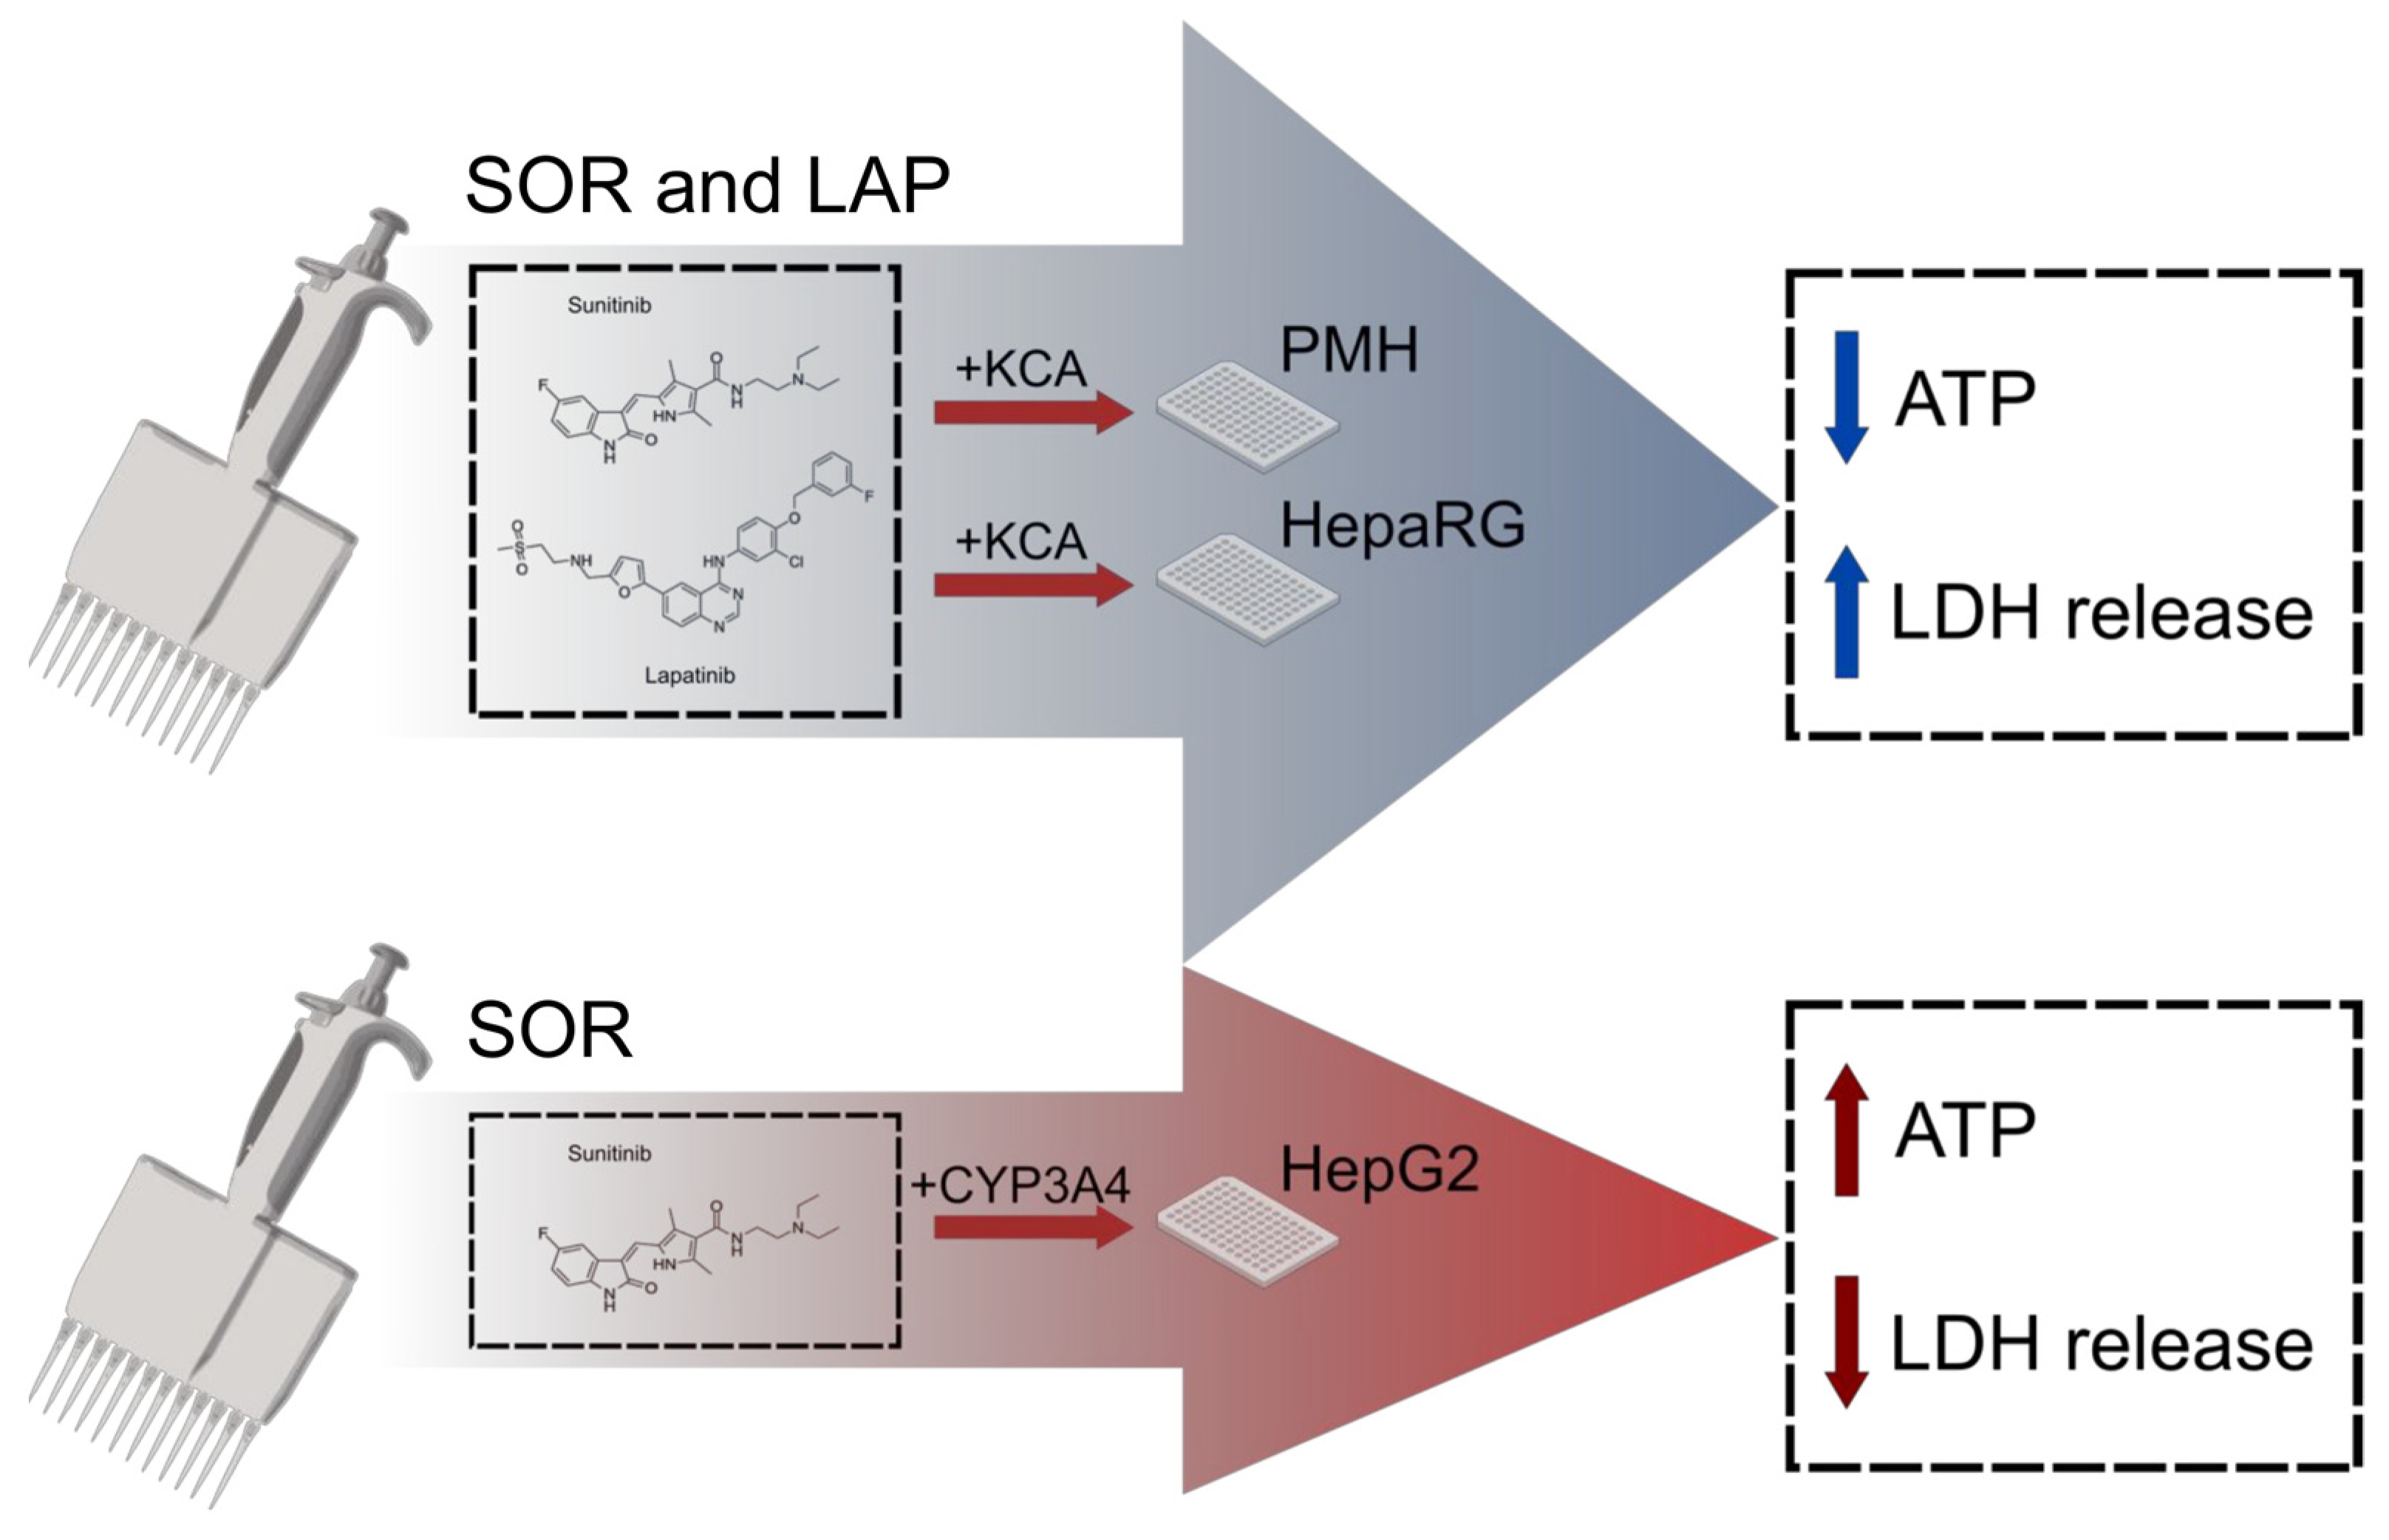
3.1. Inhibition of TKI Metabolism Increased Toxicity in Primary Mouse Hepatocytes

The paradigm in the TKI bioactivation field is that P450s such as CYP3A4 drive toxicity. Thus, we anticipated that inhibition of CYP3A activity would have a protective effect on hepatocellular viability. We tested that premise by treating PMH freshly isolated from C57Bl/6J mice with seven TKIs, namely, erlotinib (ERL), gefitinib (GEF), imatinib (IMA), LAP, nilotinib (NIL), SOR, and sunitinib (SUN) with 20 µM KCA, a CYP3A inhibitor [25], or vehicle. These TKIs were chosen because they have been adjudicated by experts to be likely causes of rare liver injury, according to the LiverTox database [26], except for NIL which was intended as a negative control. We initially confirmed that KCA blocks Cyp3A4/3a11 activity using SUN as a test case (Figure 1A). As expected, the presence of the inhibitor led to a 306 ± 5% (mean ± standard error (SE)) increase in the parent drug level and concomitant 63 ± 2% decrease in the desethyl sunitinib metabolite level. Next, we tested the effect of this concentration of KCA on TKI toxicity. The TKI test concentrations were based on reported toxic concentrations in the literature [27] and were in the μM range similar to clinical exposure levels (Table 1). Compared to vehicle control, GEF and SUN caused toxicity in PMH at those concentrations based on cellular ATP levels, while the other five TKIs did not (Figure 1B).
To our surprise, the addition of KCA increased, rather than decreased, TKI toxicity. PMH viability significantly decreased for five of the seven TKIs in the presence of the CYP3A inhibitor. GEF and SUN were the only exceptions to the trend and that was due to the aforementioned high toxicity of the drugs alone, leaving little dynamic range to assess an effect of KCA. The findings were most significant for LAP and SOR, so we first confirmed those results with the CYP3A inhibitor by measuring LDH release as a surrogate for cell death following TKI exposure in PMH. According to this assay, KCA induced its own toxicity, but the TKIs further increased overall cell death. Consistent with the ATP results, LDH release was greater in the cells co-treated with KCA and either LAP or SOR than with either vehicle, TKI, or KCA alone (Figure 2A). KCA had no effect on LDH release in PMH for the other TKIs tested (data not shown).

3.2. Inhibition of Metabolism Increased Toxicity of Sorafenib in Human HepaRG Cells

Due to observed KCA toxicity in PMH, we repeated the experiment with SOR and LAP in the human hepatocyte line HepaRG. HepaRG cells express most P450s at levels similar to PMH and liver tissue [28,29,30]. Importantly, however, they are resistant to KCA toxicity due to lower expression of the esterase required for hydrolysis of KCA to one of its reactive metabolites [31]. Thus, the concentration of KCA that we used is non-toxic [31,32,33]. Consistent with the data from PMH, KCA induced SOR, and LAP toxicity in these cells but had no effect on its own. KCA dramatically increased LDH release with SOR co-treatment and decreased ATP production with both LAP and SOR co-treatment (Figure 2B,C).

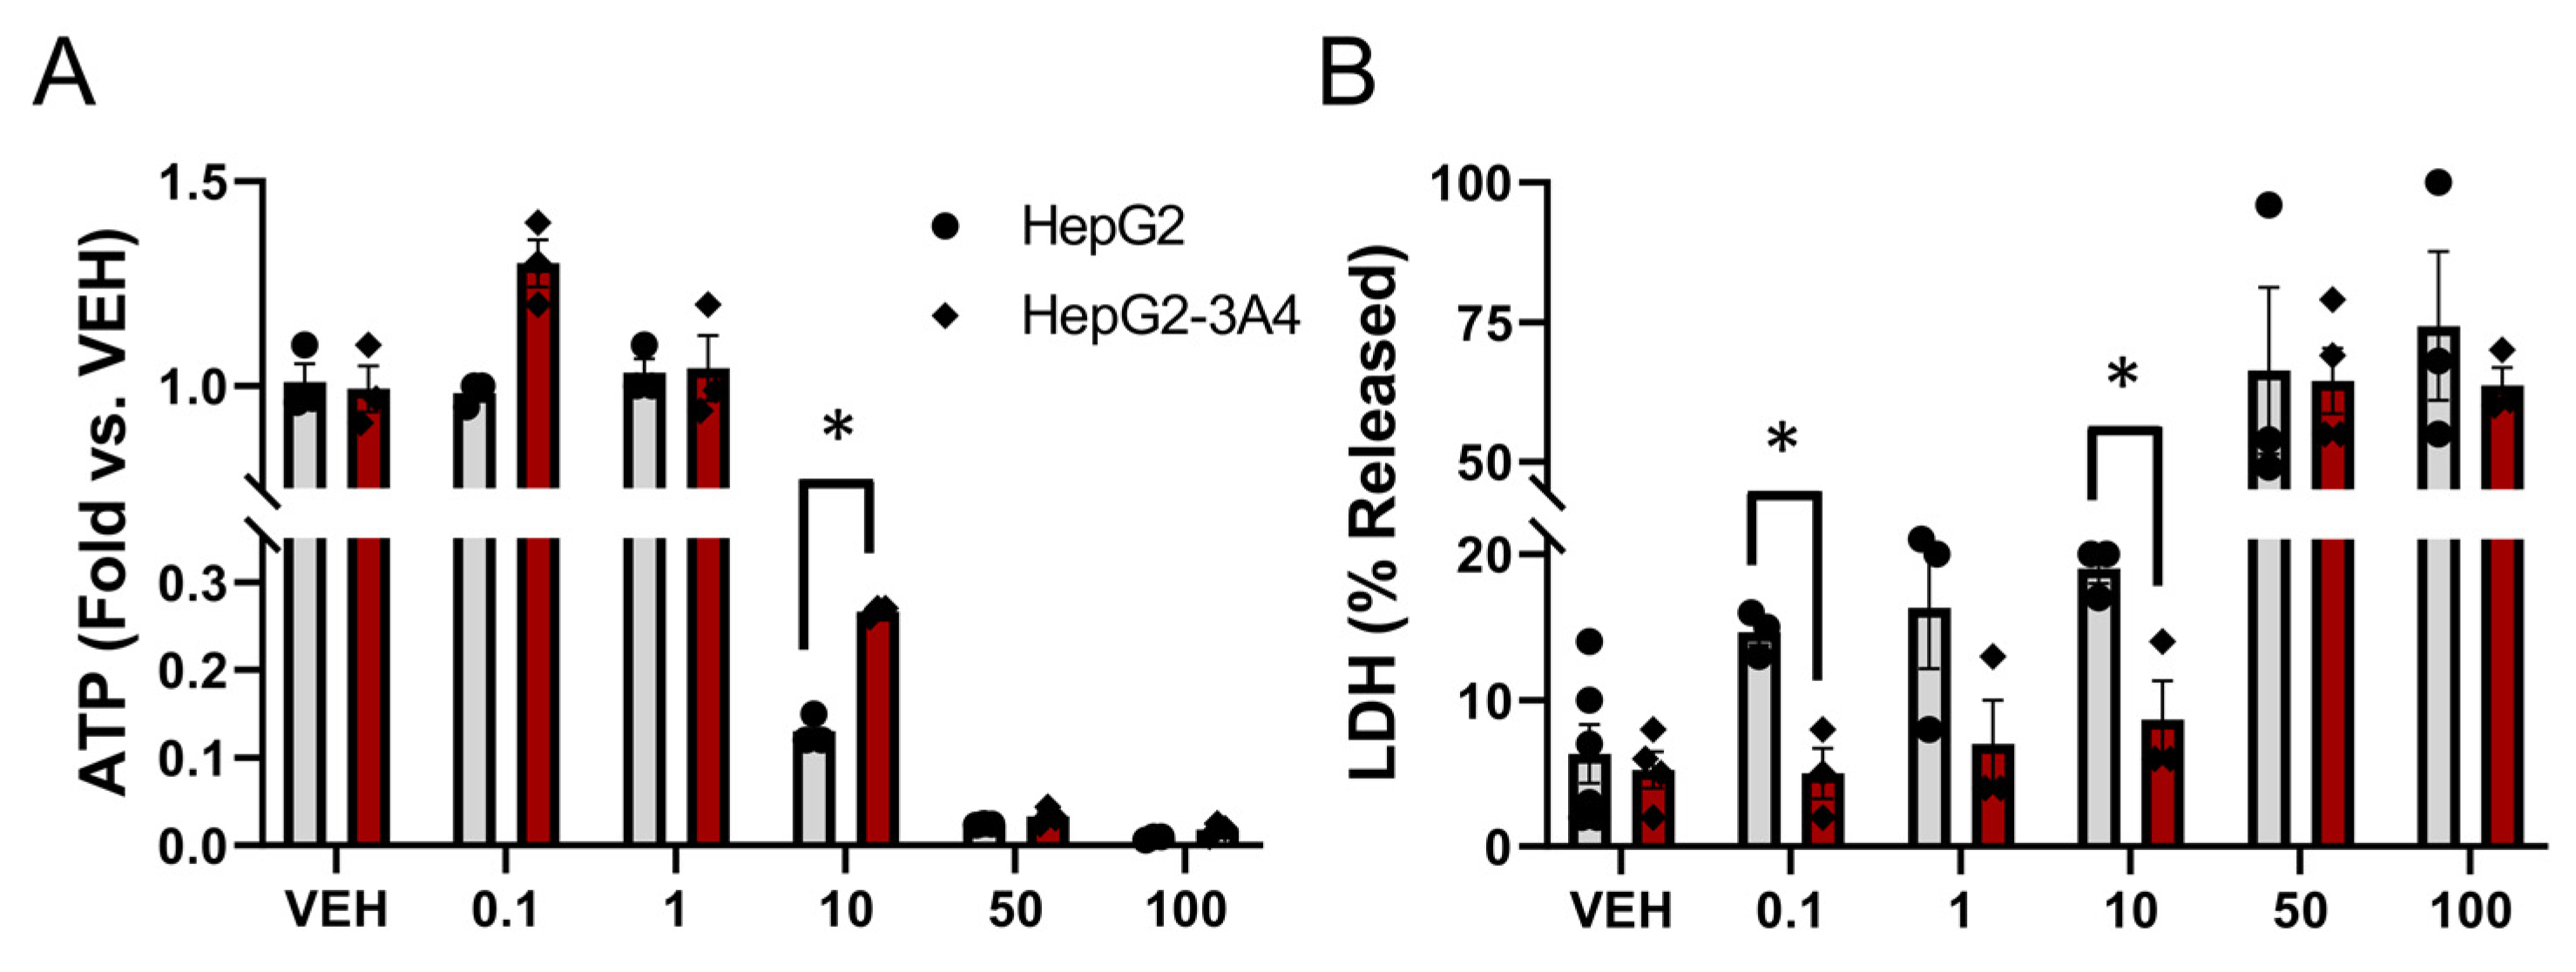
3.3. Expression of CYP3A4 Activity Decreased Sorafenib Toxicity in HepG2 Cells

If CYP3A inhibition increases cell toxicity, then we would expect an increase in CYP3A metabolism to decrease TKI toxicity. We explored this possibility using HepG2 cells. In this cell line, baseline human CYP3A4 activity is negligible [30], making it an excellent background control. We compared them with HepG2 cells transfected and selected to overexpress CYP3A4 (HepG2-3A4) as described [16]. First, we verified SOR and LAP toxicity with control HepG2 cells by monitoring phenotypic signs of cell death over the next 24 h after treatment with increasing drug concentrations. As expected, microscopic analyses revealed clear evidence of toxicity based on rounding and detachment of cells for SOR though not for LAP (Figure 3). Given those results, we focused subsequent studies only on SOR. Next, we confirmed differences in CYP3A4 activity between the HepG2 cell lines (Figure 4). CYP3A4 activity was below the limit of quantification in the control cells compared to the HepG2-3A4 cells, exhibiting 102 ± 54 (mean ± SE) relative luminescence units (LU)/min/µg protein activity. Thus, the HepG2-3A4 cells clearly expressed greater CYP3A4.
Having demonstrated the suitability of the cell models, we compared ATP levels and LDH release between the HepG2 and HepG2-3A4 cells at multiple SOR concentrations. Importantly, at 10 µM, SOR induced toxicity in control cells based on ATP levels, but viability increased 208 ± 1% in cells overexpressing CYP3A4 (Figure 5A). Similarly, based on LDH release data, HepG2-3A4 cells were significantly protected against cell death at 0.1 and 10 µM SOR when compared to controls (Figure 5B), with a trend toward reduced cell death at 1 µM as well. For both sets of viability studies, higher SOR levels eventually induced toxicity in both cell types that could not be overcome by CYP3A4 activity. Collectively, these findings agree with our results for the PMH and HepaRG cells indicating that CYP3A-mediated metabolism protects against TKI toxicity in vitro.

4. Discussion

4.1. CYP3A Enzymes Detoxify Sorafenib, Lopatinib, and Some Other TKIs

The dominant mechanistic hypothesis for idiosyncratic DILI is that the bioactivation of drugs into reactive metabolites results in their binding to proteins to form hapten-like neo-antigens [34]. Many TKIs are bioactivated by P450s, making it logical that P450-mediated metabolism plays a central, potentially detrimental role in TKI toxicity [12,35,36,37]. However, while TKI bioactivation has been extensively documented in experiments with recombinant P450s and liver microsomal preparations [12,13,36,38,39,40], the effects of this metabolism on toxicity are understudied. In this project, we attempted to prove that CYP3A bioactivation drives TKI toxicity in cultured liver cells; however, we revealed a more complex relationship between metabolism and toxicity than we expected, as highlighted by our findings for SOR and LAP. These TKIs induced no toxicity toward PMH at levels near those observed in patient plasma, indicating that reported bioactivation reactions [41] may not have yielded metabolites capable of harming normal cell function as we and others had initially hypothesized [12,35,36,37]. In contrast, inhibition of Cyp3a11 metabolism unmasked parent toxicity for several TKIs, especially SOR and LAP, leading to a sharp decline in viability based on ATP levels and LDH release. Complementary HepaRG and HepG2 studies further underscored the importance of CYP3A-mediated detoxification in human cells. As observed for PMH, HepaRG cells were resistant to SOR and LAP toxicity but could be sensitized by CYP3A4 inhibition with KCA. In contrast, HepG2 cells, which lack significant CYP3A4 expression, were sensitive to SOR and could be made somewhat resistant by CYP3A4 transduction. The results are summarized in Figure 6. These findings are consistent with an earlier study, which demonstrated that SOR, but not its major oxidative metabolites, is cytotoxic to HepG2 cells [42]. Altogether, CYP3A activity seems to suppress the toxicity of some TKIs, especially SOR, through detoxification.

4.2. Competing Toxicity Mechanisms and Detoxification Pathways May Be Common for TKIs

Interestingly, the protection with CYP4A4 was incomplete, possibly reflecting a tradeoff of decreasing parent drug toxicity while simultaneously producing toxic reactive metabolites. Like SOR, most TKIs did not produce significant cytotoxicity until we inhibited Cyp3a11 or CYP3A4 activity. GEF and SUN were the exceptions, demonstrating toxicity when administered alone. All TKIs are associated with clinical toxicities so differences in cell response may be due to variations in the actual parent drug levels in patients. While the loss of CYP3A activity induced TKI toxicity, the effect was not uniform. SOR and LAP became much more toxic, with less pronounced effects for the other TKIs. The magnitude of the effects is likely derived from the concentration dependency of toxicity and the inherent mechanisms of toxicity among the drugs. If blocking metabolism decreases toxicity, then inducing metabolism would have the opposite effect. From data reported by others, CYP3A4 induction in HepaRG cells with rifampicin increased, albeit slightly, the toxicity of IMA [8], SUN [8], and LAP [9]. Nevertheless, the same approach showed no significant effect on SOR toxicity [9] and even decreased ERL toxicity [8]. Like SOR from our studies, these varying outcomes suggest complex contributions from the innate toxicity of the drug and the balance between TKI bioactivation and detoxification pathways.

4.3. The Confounding Role of the Immune System in TKI Toxicity

A limitation of our study is that we relied on cell culture models that cannot replicate the role of the human immune system in DILI. Although several mechanisms of idiosyncratic DILI have been proposed [34,43], it is commonly thought that reactive metabolites bind to proteins to form neoantigens that elicit a damaging adaptive immune response. Thus, it is possible that the balance of detoxification and bioactivation reactions differs in humans because the detoxification mechanisms observed in our studies may generate neoantigen-forming metabolites in vivo. On the other hand, it is increasingly believed that the adaptive immune response in DILI requires an early sterile inflammation that results from the direct cytotoxicity of DILI-associated drugs and their metabolites [43]. If correct, this hypothesis means that in vitro studies such as ours could have greater relevance for human DILI than previously thought; these cell culture studies would essentially model the early injury that induces sterile inflammation and thereby promotes the downstream adaptive immune reaction.

4.4. Limitations of Our Study

These studies provide further insights into the role of metabolism in TKI toxicity, though some weaknesses beyond the lack of an immune component must be acknowledged. First, we relied on KCA as a specific CYP3A4/a11 inhibitor. Multiple studies have demonstrated that KCA is a potent and selective CYP3A4 inhibitor. Reported IC50 values for CYP3A4 inhibition by KCA are in the low nM range (10–40 nM), as opposed to the μM range for other P450 isoforms [44,45]. Although we used 20 μM KCA in our cytotoxicity studies, the IC50 values for KCA for other isoforms are near or above that concentration [19], so only partial inhibition of those enzymes would be expected in our experiments. Furthermore, SOR and LAP are almost exclusively bioactivated by CYP3A4 (with minor contributions from 3A5 for LAP) [40,41], so inhibition of other P450s is unlikely to have an effect. Nevertheless, we cannot rule out the possibility that inhibition of other isoforms contributed somewhat to our results based solely on the data in this manuscript. Second, TKIs possess innate toxicity toward cancer cells by design that could confound efforts to differentiate them from off-target toxicities. In fact, common cell lines used in these types of studies including HepG2 are derived from cancers and so they are understandably susceptible to TKI action. Moreover, TKIs cause off-target toxicities, as suggested for inhibition of ferrochelatase [46], but these mechanisms remain poorly studied and understood in the context of DILI. Third, there remain significant gaps in assessing the relative contributions of bioactivation and detoxification pathways among TKIs as well as their variability in the population. Consequently, it is not possible to accurately scale hepatotoxicity risk for TKIs. As a possible solution, recent kinetic studies with diphenylamine nonsteroidal anti-inflammatory drugs (NSAIDs) indicate a feasible strategy for weighing the relative contributions of drug bioactivation and detoxification during clearance [47,48]. Finally, we did not assess the role of bile acid transport inhibition, which has recently been proposed to mediate the toxicity of some TKIs [49].

5. Conclusions

Overall, our data indicate a more complex relationship between CYP-mediated TKI metabolism and toxicity than previously thought. Based on our results, it is possible that at least the initial, direct cytotoxicity of many TKIs is independent of CYP3A4-mediated bioactivation and in fact, CYP3A4 may be protective by preventing that initial stress, possibly even while simultaneously forming some toxic intermediates. Future studies should focus on determining the specific mechanisms by which these TKIs cause early cell death, on determining the role of both innate and adaptive immune responses downstream, and on developing interventions to prevent toxicity in the first place.

Author Contributions

Conceptualization, G.P.M., M.R.M. and N.A.-B.; methodology, G.P.M., M.R.M., N.A.-B., Y.K. and F.V.L.; formal analysis, G.P.M., M.R.M. and N.A.-B.; investigation, Y.K., F.V.L., M.A.S. and M.R.M.; resources, G.P.M., M.R.M. and N.A.-B.; data curation, Y.K. and M.R.M.; writing—M.R.M., G.P.M. and N.A.-B.; writing—review and editing, G.P.M., N.A.-B., Y.K., M.A.S. and F.V.L.; visualization, M.R.M. and G.P.M.; supervision, G.P.M., M.R.M. and N.A.-B.; funding acquisition, G.P.M., M.R.M. and N.A.-B. All authors have read and agreed to the published version of the manuscript.

Funding

These studies were funded primarily by a Pilot Award from the Winthrop P. Rockefeller Cancer Institute of the University of Arkansas for Medical Sciences (to G.P.M. and M.R.M.), by a 2018 Pinnacle Research Award from the AASLD Foundation (to MRM), by National Institutes of Health grant R01 GM140365 (to G.P.M.), P20 GM10095 (to N.A.-B.), T32 GM106999 (to F.V.L.), and by start-up funds provided in part by the Arkansas Biosciences Institute supported by the Tobacco Settlement Proceeds Act of 2000 (to M.R.M.).

Institutional Review Board Statement

Not applicable.

Informed Consent Statement

Not applicable.

Data Availability Statement

Data are available from the authors upon request.

Conflicts of Interest

M.R.M. has consulted for Alkermes, GlaxoSmithKline, and Acetaminophen Toxicity Diagnostics, LLC and has received research funding from GlaxoSmithKline/Haleon for an unrelated project. These companies had no role in the conception, design, approval, execution, or funding of this study, nor in the decision to publish. The other authors declare no competing interests.

References

  1. Wu, P.; Nielsen, T.E.; Clausen, M.H. Small-Molecule Kinase Inhibitors: An Analysis of FDA-Approved Drugs. Drug Discov. Today 2016, 21, 5–10. [Google Scholar] [CrossRef] [PubMed]
  2. Bhullar, K.S.; Lagarón, N.O.; McGowan, E.M.; Parmar, I.; Jha, A.; Hubbard, B.P.; Rupasinghe, H.P.V. Kinase-Targeted Cancer Therapies: Progress, Challenges and Future Directions. Mol. Cancer 2018, 17, 48. [Google Scholar] [CrossRef] [Green Version]
  3. Shah, R.R.; Morganroth, J.; Shah, D.R. Hepatotoxicity of Tyrosine Kinase Inhibitors: Clinical and Regulatory Perspectives. Drug Saf. 2013, 36, 491–503. [Google Scholar] [CrossRef] [PubMed]
  4. Zhao, Q.; Wu, Z.E.; Li, B.; Li, F. Recent Advances in Metabolism and Toxicity of Tyrosine Kinase Inhibitors. Pharmacol. Ther. 2022, 237, 108256. [Google Scholar] [CrossRef]
  5. Nelson, S.D. Mechanisms of the Formation and Disposition of Reactive Metabolites That Can Cause Acute Liver Injury. Drug Metab. Rev. 1995, 27, 147–177. [Google Scholar] [CrossRef]
  6. Liebler, D.C.; Guengerich, F.P. Elucidating Mechanisms of Drug-Induced Toxicity. Nat. Rev. Drug Discov. 2005, 4, 410–420. [Google Scholar] [CrossRef]
  7. Stephens, C.; Lucena, M.I.; Andrade, R.J. Genetic Risk Factors in the Development of Idiosyncratic Drug-Induced Liver Injury. Expert Opin. Drug Metab. Toxicol. 2021, 17, 153–169. [Google Scholar] [CrossRef] [PubMed]
  8. Paech, F.; Bouitbir, J.; Krähenbühl, S. Hepatocellular Toxicity Associated with Tyrosine Kinase Inhibitors: Mitochondrial Damage and Inhibition of Glycolysis. Front. Pharmacol. 2017, 8, 367. [Google Scholar] [CrossRef] [Green Version]
  9. Mingard, C.; Paech, F.; Bouitbir, J.; Krähenbühl, S. Mechanisms of Toxicity Associated with Six Tyrosine Kinase Inhibitors in Human Hepatocyte Cell Lines. J. Appl. Toxicol. 2018, 38, 418–431. [Google Scholar] [CrossRef]
  10. Paludetto, M.N.; Puisset, F.; Chatelut, E.; Arellano, C. Identifying the Reactive Metabolites of Tyrosine Kinase Inhibitors in a Comprehensive Approach: Implications for Drug-Drug Interactions and Hepatotoxicity. Med. Res. Rev. 2019, 39, 2105–2152. [Google Scholar] [CrossRef] [PubMed]
  11. Zhang, Y.; Cai, Y.; Zhang, S.R.; Li, C.Y.; Jiang, L.L.; Wei, P.; He, M.F. Mechanism of Hepatotoxicity of First-Line Tyrosine Kinase Inhibitors: Gefitinib and Afatinib. Toxicol. Lett. 2021, 343, 1–10. [Google Scholar] [CrossRef] [PubMed]
  12. Teo, Y.L.; Ho, H.K.; Chan, A. Formation of Reactive Metabolites and Management of Tyrosine Kinase Inhibitor-Induced Hepatotoxicity: A Literature Review. Expert Opin. Drug Metab. Toxicol. 2015, 11, 231–242. [Google Scholar] [CrossRef]
  13. Amaya, G.M.; Durandis, R.; Bourgeois, D.S.; Perkins, J.A.; Abouda, A.A.; Wines, K.J.; Mohamud, M.; Starks, S.A.; Daniels, R.N.; Jackson, K.D. Cytochromes P450 1A2 and 3A4 Catalyze the Metabolic Activation of Sunitinib. Chem. Res. Toxicol. 2018, 31, 570–584. [Google Scholar] [CrossRef]
  14. Martignoni, M.; Groothuis, G.; De Kanter, R. Comparison of Mouse and Rat Cytochrome P450-Mediated Metabolism in Liver and Intestine. Drug Metab. Dispos. 2006, 34, 1047–1054. [Google Scholar] [CrossRef] [PubMed] [Green Version]
  15. Burke, A.S.; MacMillan-Crow, L.A.; Hinson, J.A. Reactive Nitrogen Species in Acetaminophen-Induced Mitochondrial Damage and Toxicity in Mouse Hepatocytes. Chem. Res. Toxicol. 2010, 23, 1286–1292. [Google Scholar] [CrossRef] [PubMed] [Green Version]
  16. Yoshitomi, S.; Ikemoto, K.; Takahashi, J.; Miki, H.; Namba, M.; Asahi, S. Establishment of the transformants expressing human cytochrome P450 subtypes in HepG2, and their applications on drug metabolism and toxicology. Toxicol. In Vitro 2001, 15, 245–256. [Google Scholar] [CrossRef] [PubMed]
  17. McGill, M.R.; Yan, H.M.; Ramachandran, A.; Murray, G.J.; Rollins, D.E.; Jaeschke, H. HepaRG Cells: A Human Model to Study Mechanisms of Acetaminophen Hepatotoxicity. Hepatology 2011, 53, 974–982. [Google Scholar] [CrossRef] [Green Version]
  18. Bajt, M.L.; Knight, T.R.; Lemasters, J.J.; Jaeschke, H. Acetaminophen-Induced Oxidant Stress and Cell Injury in Cultured Mouse Hepatocytes: Protection by N-Acetyl Cycteine. Toxicol. Sci. 2004, 80, 343–349. [Google Scholar] [CrossRef] [PubMed] [Green Version]
  19. Khojasteh, S.S.; Prabhu, S.; Kenny, J.R.; Halladay, J.S.; Lu, A.Y. Chemical inhibitors for cytochrome P450 isoforms in human liver microsomes: A re-evaluation of the P450 isoform selectivity. Eur. J. Drug Metab. Pharmacokinet. 2011, 36, 1–16. [Google Scholar] [CrossRef] [PubMed]
  20. Hartmann, J.H.; Knott, K.; Miller, G.P. CYP2E1 hydroxylation of aniline involves negative cooperativity. Biochem. Pharmacol. 2014, 87, 523–533. [Google Scholar] [CrossRef]
  21. Chauret, N.; Gauthier, A.; Nicoll-Griffith, D.A. Effect of common organic solvents on in vitro cytochrome P450-mediated metabolic activities in human liver microsomes. Drug Metab. Dispos. 1998, 26, 1–4. [Google Scholar] [PubMed]
  22. Busby, W.F., Jr.; Ackermann, J.M.; Crespi, C.L. Effect of methanol, ethanol, dimethyl sulfoxide, and acetonitrile on in vitro activities of cDNA-expressed human cytochromes P-450. Drug Metab. Dispos. 1999, 27, 246–249. [Google Scholar] [PubMed]
  23. Li, D.; Han, Y.; Meng, X.; Sun, X.; Yu, Q.; Li, Y.; Wan, L.; Huo, Y.; Guo, C. Effect of regular organic solvents on cytochrome P450-mediated metabolic activities in rat liver microsomes. Drug Metab. Dispos. 2010, 38, 1922–1925. [Google Scholar] [CrossRef]
  24. Chen, X.; Wang, Z.; Liu, M.; Liao, M.; Wang, X.; Du, H.; Chen, J.; Yao, M.; Li, Q. Determination of sunitinib and its active metabolite, N-desethyl sunitinib in mouse plasma and tissues by UPLC-MS/MS: Assay development and application to pharmacokinetic and tissue distribution studies. Biomed. Chromatogr. 2015, 29, 679–688. [Google Scholar] [CrossRef] [PubMed]
  25. Maurice, M.; Pichard, L.; Daujat, M.; Fabre, I.; Joyeux, H.; Domergue, J.; Maurel, P. Effects of Imidazole Derivatives on Cytochromes P450 from Human Hepatocytes in Primary Culture. FASEB J. 1992, 6, 752–758. [Google Scholar] [CrossRef]
  26. LiverTox: Clinical and Research Information on Drug-Induced Liver Injury. Available online: Livertox.nih.gov (accessed on 9 May 2023).
  27. Zhang, J.; Ren, L.; Yang, X.; White, M.; Greenhaw, J.; Harris, T.; Wu, Q.; Bryant, M.; Papoian, T.; Mattes, W.; et al. Cytotoxicity of 34 FDA Approved Small-Molecule Kinase Inhibitors in Primary Rat and Human Hepatocytes. Toxicol. Lett. 2018, 291, 138–148. [Google Scholar] [CrossRef]
  28. Aninat, C.; Piton, A.; Glaise, D.; Le Charpentier, T.; Langouët, S.; Morel, F.; Guguen-Guillouzo, C.; Guillouzo, A. Expression of Cytochromes P450, Conjugating Enzymes and Nuclear Receptors in Human Hepatoma HepaRG Cells. Drug Metab. Dispos. 2006, 34, 75–83. [Google Scholar] [CrossRef] [Green Version]
  29. Guillouzo, A.; Corlu, A.; Aninat, C.; Glaise, D.; Morel, F.; Guguen-Guillouzo, C. The Human Hepatoma HepaRG Cells: A Highly Differentiated Model for Studies of Liver Metabolism and Toxicity of Xenobiotics. Chem. Biol. Interact. 2007, 168, 66–73. [Google Scholar] [CrossRef]
  30. Hart, S.N.; Li, Y.; Nakamoto, K.; Subileau, E.A.; Steen, D.; Zhong, X.B. A Comparison of Whole Genome Gene Expression Profiles of HepaRG Cells and HepG2 Cells to Primary Human Hepatocytes and Human Liver Tissues. Drug Metab. Dispos. 2010, 38, 988–994. [Google Scholar] [CrossRef] [Green Version]
  31. Fukami, T.; Iida, A.; Konishi, K.; Nakajima, M. Human Arylacetamide Deacetylase Hydrolyzes Ketoconazole to Trigger Hepatocellular Toxicity. Biochem. Pharmacol. 2016, 116, 153–161. [Google Scholar] [CrossRef]
  32. Haegler, P.; Joerin, L.; Krähenbühl, S.; Bouitbir, J. Hepatocellular Toxicity of Imidazole and Triazole Antimycotic Agents. Toxicol. Sci. 2017, 157, 183–195. [Google Scholar] [CrossRef] [PubMed] [Green Version]
  33. Li, D.; Knox, B.; Gong, B.; Chen, S.; Guo, L.; Liu, Z.; Tong, W.; Ning, B. Identification of Translational MicroRNA Biomarker Candidates for Ketoconazole-Induced Liver Injury Using next-Generation Sequencing. Toxicol. Sci. 2021, 179, 31–43. [Google Scholar] [CrossRef] [PubMed]
  34. Mosedale, M.; Watkins, P.B. Drug-Induced Liver Injury: Advances in Mechanistic Understanding That Will Inform Risk Management. Clin. Pharmacol. Ther. 2017, 101, 469–480. [Google Scholar] [CrossRef] [PubMed] [Green Version]
  35. Van Hootegem, A.; Verslype, C.; Van Steenbergen, W. Sorafenib-Induced Liver Failure: A Case Report and Review of the Literature. Case Rep. Hepatol. 2011, 2011, 941395. [Google Scholar] [CrossRef] [PubMed] [Green Version]
  36. Jackson, K.D.; Durandis, R.; Vergne, M.J. Role of Cytochrome P450 Enzymes in the Metabolic Activation of Tyrosine Kinase Inhibitors. Int. J. Mol. Sci. 2018, 19, 2367. [Google Scholar] [CrossRef] [Green Version]
  37. Kenny, J.R.; Mukadam, S.; Zhang, C.; Tay, S.; Collins, C.; Galetin, A.; Khojasteh, S.C. Drug-Drug Interaction Potential of Marketed Oncology Drugs: In Vitro Assessment of Time-Dependent Cytochrome P450 Inhibition, Reactive Metabolite Formation and Drug-Drug Interaction Prediction. Pharm. Res. 2012, 29, 1960–1976. [Google Scholar] [CrossRef]
  38. Teng, W.C.; Oh, J.W.; New, L.S.; Wahlin, M.D.; Nelson, S.D.; Ho, H.K.; Chan, E.C.Y. Mechanism-Based Inactivation of Cytochrome P450 3A4 by Lapatinib. Mol. Pharmacol. 2010, 78, 693–703. [Google Scholar] [CrossRef] [Green Version]
  39. Xie, C.; Zhou, J.; Guo, Z.; Diao, X.; Gao, Z.; Zhong, D.; Jiang, H.; Zhang, L.; Chen, X. Metabolism and Bioactivation of Famitinib, a Novel Inhibitor of Receptor Tyrosine Kinase, in Cancer Patients. Br. J. Pharmacol. 2013, 168, 1687–1706. [Google Scholar] [CrossRef] [Green Version]
  40. Towles, J.K.; Clark, R.N.; Wahlin, M.D.; Uttamsingh, V.; Rettie, A.E.; Jackson, K.D. Cytochrome P450 3A4 and CYP3A5-Catalyzed Bioactivation of Lapatinib. Drug Metab. Dispos. 2016, 44, 1584–1597. [Google Scholar] [CrossRef] [Green Version]
  41. Ghassabian, S.; Rawling, T.; Zhou, F.; Doddareddy, M.R.; Tattam, B.N.; Hibbs, D.E.; Edwards, R.J.; Cui, P.H.; Murray, M. Role of Human CYP3A4 in the Biotransformation of Sorafenib to Its Major Oxidized Metabolites. Biochem. Pharmacol. 2012, 84, 215–223. [Google Scholar] [CrossRef]
  42. Gillani, T.B.; Rawling, T.; Murray, M. Cytochrome P450-Mediated Biotransformation of Sorafenib and Its N-Oxide Metabolite: Implications for Cell Viability and Human Toxicity. Chem. Res. Toxicol. 2015, 28, 92–102. [Google Scholar] [CrossRef] [PubMed]
  43. Sernoskie, S.C.; Jee, A.; Uetrecht, J.P. The Emerging Role of the Innate Immune Response in Idiosyncratic Drug Reactionss. Pharmacol. Rev. 2021, 73, 861–896. [Google Scholar] [CrossRef] [PubMed]
  44. Bourrié, M.; Meunier, V.; Berger, Y.; Fabre, G. Cytochrome P450 isoform inhibitors as a tool for the investigation of metabolic reactions catalyzed by human liver microsomes. J. Pharmacol. Exp. Ther. 1996, 277, 321–332. [Google Scholar] [PubMed]
  45. Eagling, V.A.; Tjia, J.F.; Back, D.J. Differential selectivity of cytochrome P450 inhibitors against probe substrates in human and rat liver microsomes. Br. J. Clin. Pharmacol. 1998, 45, 107–114. [Google Scholar] [CrossRef] [PubMed] [Green Version]
  46. Klaeger, S.; Gohlke, B.; Perrin, J.; Gupta, V.; Heinzlmeir, S.; Helm, D.; Qiao, H.; Bergamini, G.; Handa, H.; Savitski, M.M.; et al. Chemical Proteomics Reveals Ferrochelatase as a Common Off-Target of Kinase Inhibitors. ACS Chem. Biol. 2016, 11, 1245–1254. [Google Scholar] [CrossRef]
  47. Schleiff, M.A.; Crosby, S.; Blue, M.; Schleiff, B.M.; Boysen, G.; Miller, G.P. CYP2C9 and 3A4 Play Opposing Roles in Bioactivation and Detoxification of Diphenylamine NSAIDs. Biochem. Pharmacol. 2021, 194, 114824. [Google Scholar] [CrossRef]
  48. Schleiff, M.A.; Payakachat, S.; Schleiff, B.M.; Swamidass, S.J.; Boysen, G.; Miller, G.P. Impacts of Diphenylamine NSAID Halogenation on Bioactivation Risks. Toxicology 2021, 458, 152832. [Google Scholar] [CrossRef]
  49. Saran, C.; Sundqvist, L.; Ho, H.; Niskanen, J.; Honkakoski, P.; Brouwer, K.L.R. Novel Bile Acid-Dependent Mechanisms of Hepatotoxicity Associated with Tyrosine Kinase Inhibitors. J. Pharmacol. Exp. Ther. 2022, 380, 114–125. [Google Scholar] [CrossRef]
Figure 1. Co-treatment with ketoconazole worsens TKI-induced loss of viability. (A) Sunitinib (SUN) was incubated with liver microsomes and either 20 μM ketoconazole (KCA) or vehicle control and the concentrations of SUN and desethyl SUN were measured. (B) Primary mouse hepatocytes were co-treated with the drugs listed in Table 1 and either 20 μM KCA or vehicle control for 24 h. ATP was measured as an indicator cell viability. Gray bars with circles show data from vehicle co-treatment while red bards with diamonds show data from KCA co-treatment. Data represent the mean ± SE for 3–4 independent experiments. * p < 0.05. ** p < 0.01. *** p < 0.001. **** p < 0.0001.
Livers 03 00022 g001
Figure 2. Co-treatment with ketoconazole worsens TKI-induced cell death. (A) Primary mouse hepatocytes (PMH) were co-treated with vehicle (Veh), LAP, or SOR and either 20 μM KCA or KCA vehicle control for 24 h. LDH release was measured as an indicator cell death. (B) HepaRG cells were co-treated with Veh, LAP, or SOR and either 20 μM KCA or KCA vehicle control for 24 h. LDH release was measured as an indicator cell death. (C) HepaRG cells were co-treated with LAP and Veh, LAP and KCA, SOR and Veh, or SOR and KCA, and ATP was measured as an indicator of viability 24 h later. Data represent mean ± SE for 3–4 independent experiments from different days for each drug. * p < 0.05. ** p < 0.01. *** p < 0.001. **** p < 0.0001.
Livers 03 00022 g002
Figure 3. SOR is toxic in HepG2 cells. HepG2 cells were grown at 70–80% confluence and treated with the indicated concentrations of SOR or with vehicle control (Veh). Cells were observed by phase contrast imaging. Dashed lines outline clear space left by dead cells.
Livers 03 00022 g003
Figure 4. CYP3A4-transfected HepG2 cells have increased CYP3A4 activity. CYP3A4-expressing (HepG2-3A4) and control HepG2 cells were lysed and CYP3A4 activity was measured. Total liver homogenates from control mice were included as a positive control group. Data represent mean ± SE of 3 independent preparations from different days.
Livers 03 00022 g004
Figure 5. CYP3A4-transfected HepG2 cells have reduced cytotoxicity with TKI treatment. CYP3A4-transfected (HepG2-3A4) and control HepG2 cells were grown to 70–80% confluence and treated with the indicated concentrations of SOR. (A) Cellular ATP levels at 24 h. (B) LDH release into the culture medium at 24 h. Data represent mean ± SE for 3 independent experiments from different days. * p < 0.05.
Livers 03 00022 g005
Figure 6. Summary of results. SOR and LAP had minimal toxicity in primary mouse hepatocytes (PMH) and human HepaRG cells, but addition of KCA increased cell death based on ATP and LDH release. In contrast, SOR was toxic to HepG2 cells, but the toxicity was reduced by overexpression of CYP3A4. Altogether, the results suggest that CYP3A metabolism may actually be protective against SOR and LAP hepatotoxicity.
Livers 03 00022 g006
Table 1. Tyrosine kinase inhibitors used in the initial treatments in this study.
DrugConcentration (µM) a
Erolotinib (ERL)17.2
Gefitinib (GEF)27
Imatinib (IMA)20
Lapatinib (LAP)10.45
Nilotinib (NIL)21.35
Sorafenib (SOR)8.6
Sunitinib (SUN)12
a Cells were treated with these concentrations (in µmol/L) of these drugs for the durations indicated in the text.
Disclaimer/Publisher’s Note: The statements, opinions and data contained in all publications are solely those of the individual author(s) and contributor(s) and not of MDPI and/or the editor(s). MDPI and/or the editor(s) disclaim responsibility for any injury to people or property resulting from any ideas, methods, instructions or products referred to in the content.

