Article

Neutronic Characteristics of ENDF/B-VIII.0 Compared to ENDF/B-VII.1 for Light-Water Reactor Analysis

by
Kang-Seog Kim
* and
William A. Wieselquist
Nuclear Energy and Fuel Cycle Division, Oak Ridge National Laboratory, One Bethel Valley Road, P.O. Box 2008, MS-6172, Oak Ridge, TN 37831, USA
*
Author to whom correspondence should be addressed.
J. Nucl. Eng. 2021, 2(4), 318-335; https://doi.org/10.3390/jne2040026
Submission received: 12 August 2021 / Revised: 8 September 2021 / Accepted: 13 September 2021 / Published: 23 September 2021

Abstract

:
The Evaluated Nuclear Data File (ENDF)/B-VIII.0 data library was released in 2018. To assess the new data during development and shortly after release, many validation calculations were performed with static, room-temperature benchmarks. Recently, when performing validation of ENDF/B-VIII.0 for pressurized water reactor depletion calculations, a regression in performance compared to ENDF/B-VII.1 was observed. This paper documents extensive benchmark calculations for light-water reactors performed using continuous energy Monte Carlo code with ENDF/B-VII.1 and -VIII.0 and neutronic characteristics of ENDF/B-VIII.0 are discussed and compared to those of ENDF/B-VII.1. It is our recommendation that ENDF/B data library assessment should include reactor-specific benchmark assessments, including depletion cases, such that these types of regressions may be caught earlier in the data development cycle.

1. Introduction

The Virtual Environment for Reactor Applications (VERA) [1], developed by the Consortium for Advanced Simulation of Light Water Reactors (CASL) [2], was very successful in simulating high-fidelity multiphysics for pressurized water reactor (PWR) physics analysis. VERA development continues through the Nuclear Energy Advanced Modeling and Simulation (NEAMS) project [3] for the boiling water reactor (BWR) analysis. The PWR simulation results using VERA with the Evaluated Nuclear Data File (ENDF)/B-VII.1 nuclear evaluated data [4] were very consistent with the PWR measured data [5], which were processed to generate the 51-group neutron cross-section library [6,7] for the primary VERA neutronics simulator MPACT [8]. The ENDF/B-VII.1 MPACT 51-group library supports both non-epithermal and epithermal upscattering for 238U, which has been known to improve the Doppler temperature coefficient [9]. However, the benchmark calculations in the paper by Mangham et al. [5] were performed without considering epithermal upscattering, because epithermal upscattering would result in about a 200 pcm reactivity underestimation. It was expected that the ENDF/B-VIII.0 data library [10] would resolve the reactivity bias issue by considering epithermal upscattering for the PWR analysis. Extensive benchmark calculations were performed using ENDF/B-VIII.0 to identify neutronic characteristics of ENDF/B-VIII.0 and results are compared to ENDF/B-VII.1.
ENDF/B-VIII.0 was released in 2018. Identifying potential issues in new ENDF/B libraries for power plant simulations can be challenging because most validation calculations for new versions are performed for static and room-temperature benchmark problems. Depletion benchmark calculations have been performed to investigate the differences between ENDF/B-VII.1 and -VIII.0 [11] and results have shown that ENDF/B-VIII.0 significantly underestimated reactivity compared to ENDF/B-VII.1 with respect to depletion. Park et al. [12] compared both libraries in the VERA benchmark progression problems and a similar trend to that discussed in the paper by Kim and Wieselquist [11] was indicated. However, the most influential nuclides were not identified and insufficient information was included for the neutronic behavior of ENDF/B-VIII.0 in terms of light-water reactor (LWR) physics analysis. Bostelmann et al. also demonstrated the impact of ENDF/B-VIII.0 on advanced reactor simulation [13], but the investigation concerned only its basic impact on various advanced reactor analysis.
CASL and NEAMS developed the PWR and BWR benchmark problems to verify the MPACT multigroup (MG) library for VERA, covering most neutronic characteristics for the PWR and BWR physics analysis. The reference solutions were obtained using the continuous-energy (CE) Monte Carlo (MC) codes SCALE/KENO [14], Serpent [15] and Monte Carlo N-Particle (MCNP) Transport [16] with ENDF/B-VII.1. In addition to the depletion comparison between ENDF/B-VII.1 and -VIII.0 [11], benchmark calculations were performed using the CE MC codes to identify the neutronic characteristics of ENDF/B-VIII.0 compared to those of ENDF/B-VII.1 for LWR physics analysis.
This study focuses on comparisons between ENDF/B-VIII.0 and -VII.1 for extensive PWR and BWR benchmark problems to clearly identify the impact of ENDF/B-VIII.0 on LWR analysis. A full investigation will be completed during the development of new versions of ENDF/B through a collaboration with nuclear data evaluators within the Cross Section Evaluation Working Group and it is expected to significantly shorten the ENDF/B development period and minimize potential issues.

2. LWR Benchmark Problems

2.1. PWR Benchmark Problems

The PWR benchmark problems were taken from Kim et al. [7], which verified the ENDF/B-VII.1 MPACT 51-group library for the VERA MPACT. Only a brief overview of the problems is included herein; detailed descriptions can be found in the aforementioned paper [7]. These benchmark problems were used in the comparison of neutronic characteristics between ENDF/B-VII.1 and -VIII.0. Table 1 provides a summary of the PWR benchmark suite.
The VERA core physics benchmark progression problems were created to provide a method for developing and demonstrating new reactor physics methods and software capabilities [17]. The progression problems range from a simple 2D pin cell to the full-cycle depletion and refueling of a 3D reactor core configuration with control rods and burnable poisons consistent with actual nuclear power plant designs. Most of the data are based on fuel and plant data from the initial core loading of Watts Bar Nuclear Unit 1, a Westinghouse Electric Company-designed 17 × 17 PWR.
Because the VERA core physics benchmark progression problems do not include various 235U enrichment and burnup compositions, additional benchmark problems were developed to analyze the cross-section library’s sensitivities to 235U enrichment, burnup and a number of radial fuel rings. These benchmark problems were developed based on the VERA progression problems 1B and 1C.
The VERA depletion benchmark problems [7,18] were developed based on the VERA progression problems. The depletion benchmark suite includes 8 single-pin problems and 16 fuel-assembly problems with various fuel temperatures, 235U enrichments, control rods and burnable poisons.
The extensive benchmark problems for PWR fuel pins and assemblies were developed to determine how well the MPACT MG library agrees with CE MC results [19,20]. The PWR fuel pin cases consist of three 235U enrichments, four rod sizes, three hot coolant densities, three hot fuel temperatures, cold cases at room temperature and three boron concentrations. There is a total of 360 cases, 324 hot cases and 36 cold cases. The PWR pin cells were modeled as three concentric rings of fuel, helium gap and zirconium, surrounded by a square region of coolant. Additional benchmark problems were developed for 14 PWR assembly types, including 15 × 15, 16 × 16 and 17 × 17 designs by different fuel vendors and these benchmarks account for many state-point conditions encountered in a reactor. Each assembly type includes 90 state points with three 235U enrichments, three hot coolant densities, three hot fuel temperatures, one cold case at standard room temperature and density and three boron concentrations. There is a total of 81 hot cases and 9 cold cases per assembly, for a total of 1260 cases.
Seoul National University developed a benchmark suite for the intrapellet nonuniform temperature distribution cases [21]. The geometrical specifications include five equi-volume subzones in the fuel pellet, gap, cladding and moderator. Nonuniform temperature profiles as a function of power and average fuel temperatures were introduced. Benchmark calculations were performed using both nonuniform and uniform temperature profiles.
The Mosteller benchmark [22] was originally developed to measure the Doppler temperature reactivity coefficient and has also been used for validation of software. The original benchmarks did not include the 1200 K cases; those cases were added to these benchmark calculations.

2.2. BWR Benchmark Problems

2.2.1. VERA BWR Depletion Benchmark Problems

The VERA BWR depletion problems were developed for single-pin fuels only. Single-pin benchmarks (shown in Table 2) were developed with fuel pins of a Peach Bottom 2 (PB2) 7 × 7 design with a large fuel pellet radius. Additionally, 50% and 70% voids were considered to observe the trend of reactivity difference for various void fractions.

2.2.2. Extensive BWR Pin and Assembly Benchmark Problems

Single-pin benchmark problems were developed using four BWR fuel types [23], as shown in Table 3. The benchmark problems include four fuel pellet sizes, four moderator/fuel temperatures, three 235U enrichments, four void fractions and four burnups. The analysis used a total of 220 benchmark cases.
Extensive BWR assembly benchmark problems were developed based on the VERA BWR progression problems [23], with four fuel pellet sizes, four 235U enrichments, four moderator and fuel temperatures, three void fractions and control rod in and out. Table 4 provides variations of nuclear state parameters for these benchmark problems. The total number of cases is 320.

3. Results

3.1. PWR Benchmark Results

3.1.1. VERA PWR Benchmark Progression Problems

Table 5 compares the multiplication factors between ENDF/B-VII.1 and -VIII.0 with and without Doppler broadening rejection correction (DBRC) [24], which is used to consider epithermal upscattering. The benchmark calculations were performed using SCALE/KENO with ENDF/B-VII.1 and -VIII.0. The ENDF/B-VIII.0 library overestimates reactivity for the following cases that include 10B and Gd isotopes: (a) 1E, 2L, 2M and 2N with the integral fuel burnable absorber (IFBA) burnable poisons; (b) 2E, 2F and 2H with the Pyrex burnable poisons; (c) 2G with the AgInCd control rod insertion; (d) 2O and 2P with the gadolinia rods. The reactivity differences between ENDF/B-VII.1 and -VIII.0 with DBRC and without DBRC are similar. Cross sections of 10B and Gd isotopes that cause positive reactivity in ENDF/B-VIII.0 are discussed in Section 4.

3.1.2. VERA PWR Extended Benchmark Progression Problems

The VERA PWR extended benchmark suite was used to discern the trend of the multiplication factors with various 235U enrichments and various snapshot burnups in which atomic number densities of depleted isotopic inventories were taken from single fuel-pin depletion calculation. The benchmark calculations were performed using SCALE/KENO with ENDF/B-VII.1 and VIII.0 of which the multiplication factors are compared in Table 6. ENDF/B-VIII.0 overestimated reactivity at 2.1 wt % of 235U. However, as 235U enrichment increased, ENDF/B-VIII.0 underestimated reactivity, resulting in a Δρ bias of about 300 pcm between 2.1 and 4.6 wt % of 235U. When all heavy and fission product yield nuclides were included, reactivity differences between ENDF/B-VII.1 and VIII.0 were negligible. There were significant error cancelations among 235U, 238U, 16O and 239Pu, which are discussed in Section 4. The burnup history effect is discussed in Section 3.1.3.

3.1.3. VERA PWR Depletion Benchmark Problems

Kim and Wieselquist [11] discussed the reactivity underestimation of ENDF/B-VIII.0 compared to that of ENDF/B-VII.1 for the VERA PWR depletion benchmark problems. Depletion benchmark calculations were performed using Serpent with ENDF/B-VII.1 and -VIII.0 ACE format libraries for the VERA depletion benchmark problems. The ENDF/B-VII.1 ACE format libraries were from MCNP6.1 [16] and the ENDF/B-VIII.0 ACE format libraries were processed using NJOY-2016 [25]. Figure 1a compares the multiplication factors (keff) between the two ENDF/B versions without considering epithermal upscattering as a function of burnup, of which standard deviations were about 20 pcm. ENDF/B-VIII.0 significantly underestimated the multiplication factors at high burnup points compared to ENDF/B-VII.1. Figure 1b compares the multiplication factors (keff) between ENDF/B-VIII.0 with DBRC and ENDF/B-VII.1 without DBRC. As might be expected, considering epithermal upscattering resulted in an additional negative reactivity bias of 150–200 pcm for the PWR hot full-power calculations. However, reactivities with epithermal upscattering were increased because of depletion history which is to follow up individual isotopes through isotopic depletion calculation with decays and neutron–nuclide reactions. Therefore, once the ENDF/B library is improved to ensure better reactivity at the beginning of burnup, low reactivity at high burnups may not be an issue.
The most influential nuclides in terms of impact on the reactivity difference between ENDF/B-VII.1 and VIII.0 were identified by Kim and Wieselquist [11]. Figure 2 shows the keff differences as a function of burnup caused by the ENDF/B-VII.1 cross sections of all nuclides, 235U, 238U, 239Pu and 16O. There were error cancelations at zero burnup between 238U (+230 pcm), 235U (−210 pcm) and 16O (−120 pcm). As burnup increased and the 239Pu influence became more negative and then more saturated, the 238U influence decreased and became more negative above 40 MWD/kgU. The 235U influence decreased and became saturated at −100 pcm. The total keff difference at 60 MWD/kgU was about 400 pcm, which was 650 pcm in Δρ. More detailed reaction rate analysis was performed to demonstrate energy and reaction dependent reaction rate differences to impact the overall reactivities. This analysis is discussed in Section 4.

3.1.4. Extensive PWR Pin and Assembly Benchmark Problems

The extensive PWR pin and assembly benchmark calculations were performed using SCALE/KENO with ENDF/B-VII.1 and -VIII.0, with and without considering epithermal upscattering. The histogram of the reactivity differences for the pin benchmark problems is shown in Figure 3a. ENDF/B-VIII.0 mostly underestimated reactivities, except for the 235U 2.1 wt % cases. The same benchmark calculations used for the extensive PWR pin benchmark problems were performed using MCNP. Although MCNP slightly overestimated reactivity, compared to KENO, MCNP’s overall trend was very similar to KENO’s. Table 7 and Table 8 provide the benchmark results categorized for 235U enrichment, soluble boron concentration, moderator density and fuel temperature for fuel pins and assemblies, respectively. A trend of reactivity bias can be clearly observed in 235U enrichment and soluble boron concentration. Under hot conditions, the boron worth of ENDF/B-VII.1 was larger than that of ENDF/B-VIII.0 by 0.093 pcm/ppm. There was no trend for moderator density and fuel temperature that would provide very consistent moderator and fuel temperature reactivity coefficients.
Figure 3b provides the distribution of the reactivity differences between ENDF/B-VIII.0 and -VII.1 for the extensive PWR assembly benchmark problems. Although ENDF/B-VIII.0 underestimated reactivity for the assemblies without any absorbers, it mostly overestimated reactivity for the assemblies with various burnable absorbers, such as IFBA, Pyrex and Gadolinia. Δρ differences of more than 500 pcm were observed in the WB2M fuel assemblies with 2.1 wt % 235U enrichment, including 128 IFBAs. Similar reactivity bias trends were observed for 235U enrichment and soluble boron concentration. The effect of 10B and Gd isotopes in increasing reactivity is discussed in Section 4. Because those nuclides would burn very quickly as a burnable absorber to control reactivity, they would not impact cycle length.

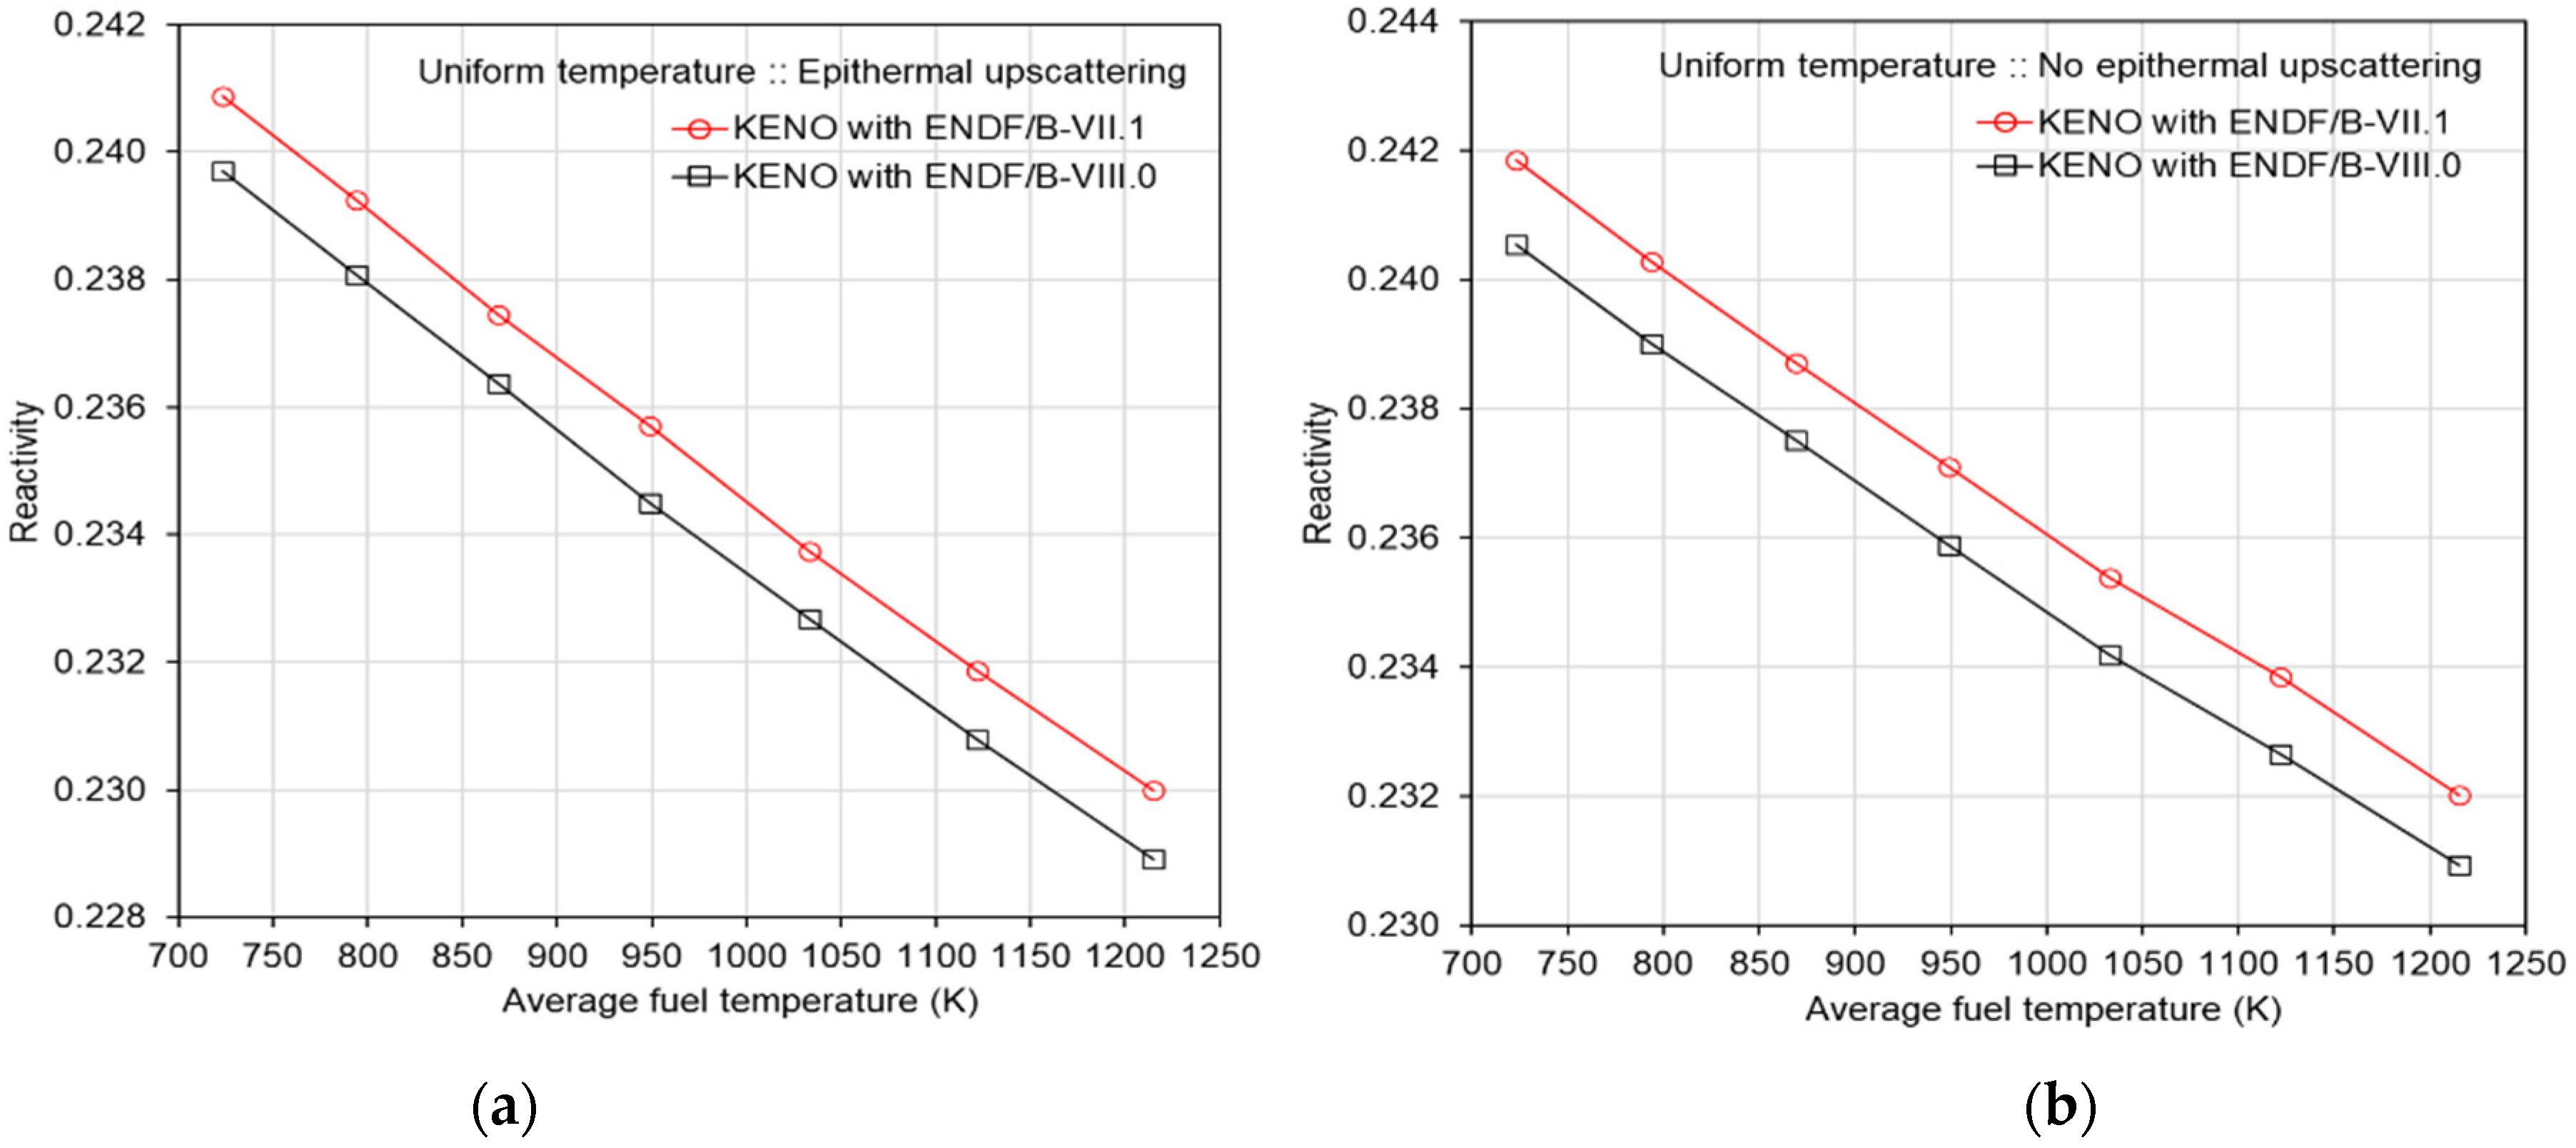
3.1.5. Seoul National University PWR Nonuniform Fuel Temperature Problems

Figure 4 and Figure 5 compare temperature-dependent reactivities between ENDF/B-VII.1 and-VIII.0 for the Seoul National University benchmark problems with uniform and nonuniform temperature distributions, respectively, in fuel pellets with and without considering epithermal upscattering. The benchmark calculations were performed using KENO with the on-the-fly temperature interpolation capability. ENDF/B-VIII.0 always underestimated reactivities by about 150 pcm above hot full power conditions. However, because the slopes of ENDF/B-VII.1 and VIII.0 seem to be similar, fuel temperature reactivity coefficients would be expected to be similar with each other.

3.1.6. PWR Mosteller Benchmark Problems

Figure 6 provides the results for the Mosteller benchmark problems. These results compare the Doppler temperature coefficients between ENDF/B-VII.1 and -VIII.0 for various 235U enrichments with and without considering epithermal upscattering. The benchmark calculations were performed using SCALE/KENO and MCNP. Good consistency was shown in the Doppler temperature coefficients between ENDF/B-VII.1 and -VIII.0, regardless of 235U enrichment. It has been shown that Doppler temperature coefficients considering epithermal upscattering are lower than those that do not consider epithermal upscattering by about 10–15%, which would ensure much better agreement with the measured plant data [9].

3.2. BWR Benchmark Results

3.2.1. BWR Depletion Benchmark Problems

The depletion trend of BWR fuels was expected to be similar to that of PWR fuels because their compositions and operation conditions are very similar, except for soluble boron in PWRs and void in BWRs. Therefore, single-pin investigation alone with various void fractions may be sufficient to identify the depletion characteristics for BWR fuel. Figure 7 provides the reactivity differences between ENDF/B-VIII.0 and -VII.1 for the BWR depletion benchmark problems. The selected BWR fuel pins included a much larger fuel pellet radius, which was 0.60579 cm; the PWR pellet radius was 0.4025 cm. The overall depletion trend for the BWR pins, 1A–1F, without void was very similar to the PWR depletion trend. The 1G and 1H cases are 50% and 70% voids, respectively; the reactivity differences at high burnups were significantly less than the reactivity differences with zero voids.

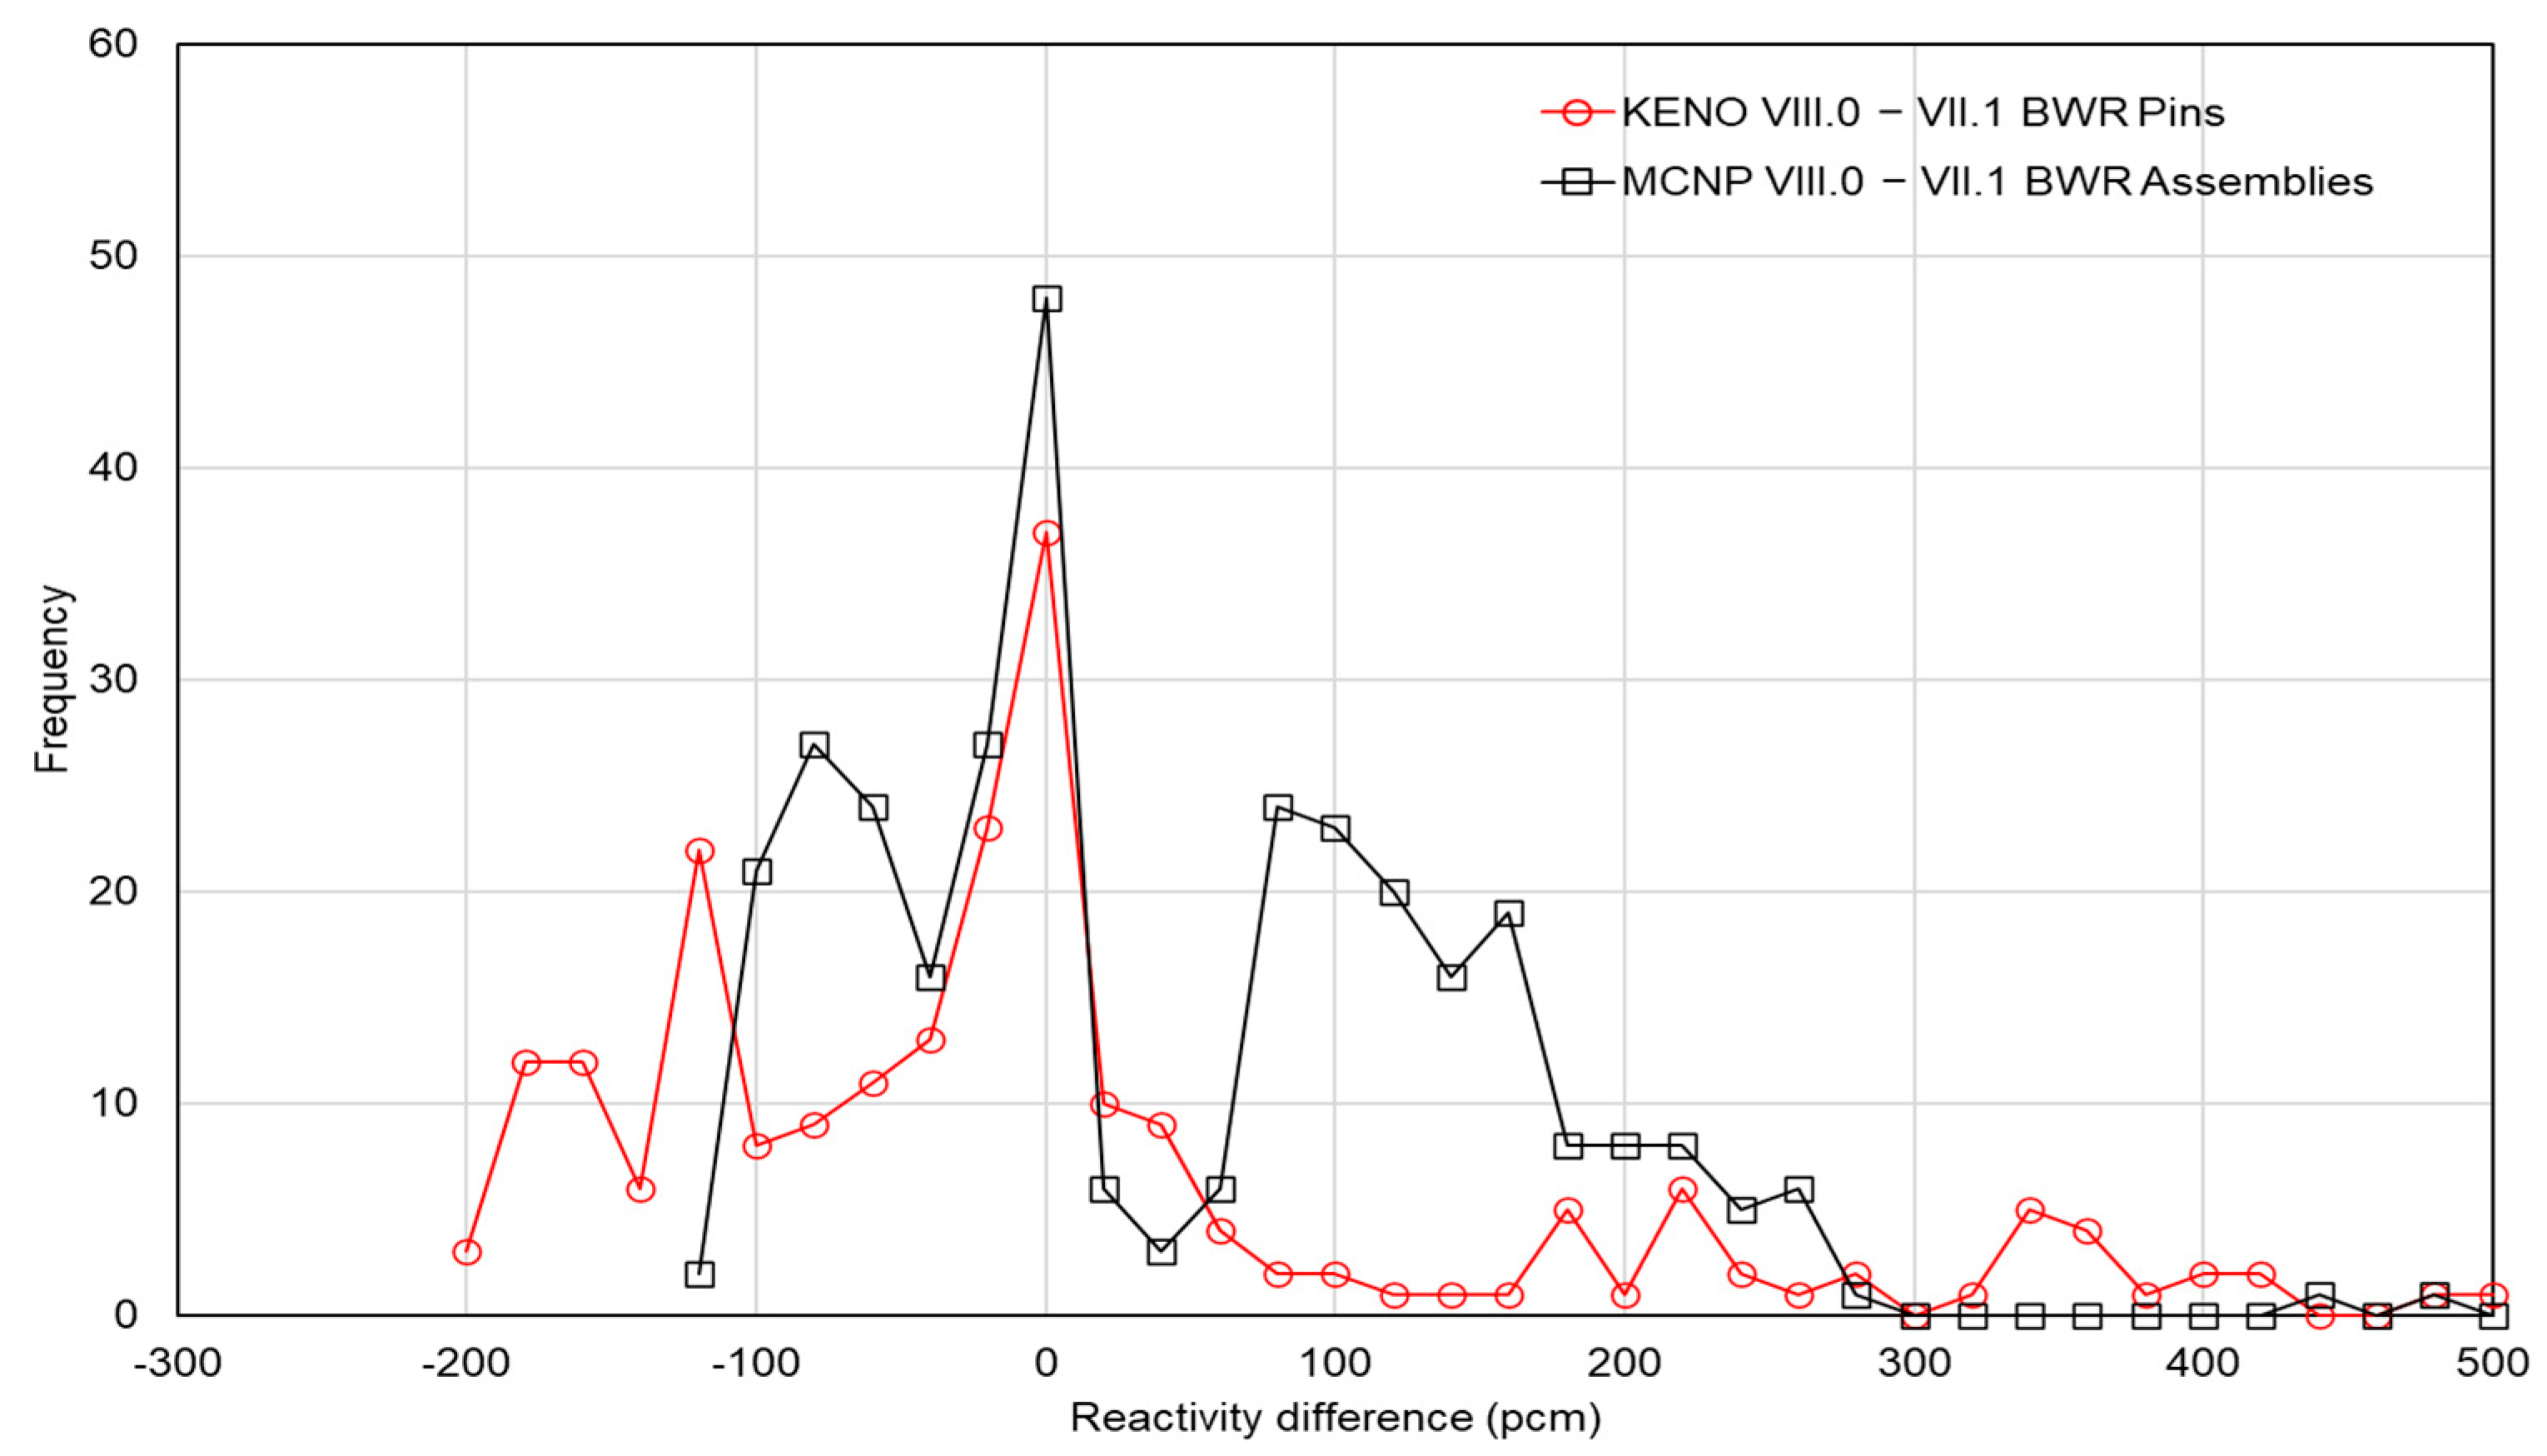
3.2.2. Extensive BWR Pin and Assembly Benchmark Problems

Extensive VERA BWR pin and assembly benchmark calculations were performed using SCALE/KENO and MCNP with ENDF/B-VII.1 and -VIII.0 only, without considering epithermal upscattering. The reactivity differences for the pin and assembly benchmark problems are shown in Figure 8. ENDF/B-VIII.0 mostly underestimated reactivities for the pin benchmark problems, but some reactivity overestimations were observed in the selected cases. Many more cases with reactivity overestimations were observed for the assembly benchmark problems, which were likely caused by the gadolinia burnable poisons.
Table 9 provides the benchmark results categorized for 235U enrichment, void fraction, burnup, control rod and fuel temperature. A trend of reactivity bias can be seen in the 235U enrichment and void fraction. Δρ differences of more than 400 pcm were observed in the 2.1 wt % 235U enriched pin with 90% void, a fuel temperature of 1200 K and zero burnup, as well as the mixed enriched BWR assemblies with 80% void and control rods inserted at 600 and 900 K fuel temperatures.

4. Discussion

Extensive benchmark calculations were performed using various CE MC codes, such as SCALE/KENO, Serpent and MCNP, with the ENDF/B-VII.1 and VIII.0 libraries to identify the neutronic characteristics of ENDF/B-VIII.0 compared to those of ENDF/B-VII.1 for LWR analysis. The underlined neutronic characteristics of ENDF/B-VIII.0 are summarized below.
235U enrichment reactivity bias. Figure 3 shows that the 235U and 16O reactivity differences at zero burnup were −180 and −170 pcm, respectively, but the 238U reactivity difference was +260 pcm. Because the 10B reactivity difference was positive, effective reactivity differences were canceled out between them, so no significant excess reactivity differences were observed. Figure 9a provides the energy- and reaction-dependent reactivity differences for 16O, 235U and 238U, which were obtained by converting the reaction rate differences into the reactivity differences with the same neutron spectra. Because the excess reactivity of 235U absorption and production was negative, the difference of absorption was larger than that of production. Therefore, as 235U enrichment increased, the excess reactivity differences of both 235U and 238U was more negative, resulting in reactivity underestimation in ENDF/B-VIII.0.
Positive reactivity of Gd isotopes. Figure 10a compares the flux-averaged cross sections of 155Gd and 157Gd in a single gadolinia rod between ENDF/B-VII.1 and -VIII.0 in the 51-group structure. Even though there was no change in the pointwise cross sections of 155Gd and 157Gd, there were some differences in the flux-averaged MG cross sections due to different neutron spectra. The effective ENDF/B-VIII.0 MG cross sections at very thermal energy were smaller than those of ENDF/B-VII.1, which would result in positive reactivity, as observed in the PWR progression cases 2O and 2P.
Positive reactivity of 10B. Figure 10b compares the 10B absorption cross sections, including (n, γ) and (n, α) reactions, between ENDF/B-VII.1 and -VIII.0 in the 51-group structure. The cross sections were flux-weighted using typical PWR pointwise spectra. The 10B capture cross sections of ENDF/B-VIII.0 were almost identical to those of ENDF/B-VII.1 at all energy ranges, which may not impact eigenvalues. However, the ENDF/B-VIII.0 10B would result in less reactivity worth, which is common for soluble boron, IFBA, Pyrex and B4C control rods—quite different from the positive cross-section difference. Figure 11a compares the ENDF/B-VII.1 and VIII.0 neutron spectra for a single pin with IFBA. ENDF/B-VIII.0 underestimated thermal and very fast neutron fluxes and it overestimated epithermal flux. The difference would result in significant reactivity increases for 235U, 238U and 10B, as shown in Figure 11b.
Depletion history effect [11]. This effect is perhaps the most challenging issue in ENDF/B-VIII.0. When performing static and snapshot burnup calculations, no significant reactivity differences were observed. However, when considering depletion history, there was a significant reactivity underestimation in ENDF/B-VIII.0 that may limit its use in LWR analysis. The most influential nuclides included 239Pu, 235U, 16O and 238U.
Positive reactivity of voids. There was a relatively large trend for the BWR single pins with various voids. However, there was almost no trend for the BWR fuel assemblies, which may have been caused by error cancelation. Even though there was a large positive reactivity at 90% void, it may not impact BWR analysis.
Epithermal upscattering. Theoretically, epithermal upscattering is much more physical than no epithermal upscattering and it would introduce better agreement with the measured Doppler temperature coefficient. However, epithermal upscattering has not been considered properly in LWR analysis because of concerns about its reactivity underestimation. The ENDF/B-VII.1 PWR hot zero power results without considering epithermal upscattering were very consistent with the measured plant data. Considering epithermal upscattering may cause some reactivity differences in the measured-to-calculated comparison. However, the investigation in this study indicates that epithermal upscattering may not cause any issues in fuel cycle length, as shown in Figure 1b.
Moderator and fuel temperature coefficients. Because no sensitivity to the moderator density as provided in Table 7 and Table 8 was observed, there was no impact on moderator temperature coefficients in ENDF/B-VIII.0. As shown in Figure 5 and Figure 6, there was also no sensitivity to fuel temperature.
Fission product nuclides. ENDF/B-VIII.0 cross-section differences in fission product yield nuclides had almost no impact on reactivity.
Decay and fission product yielddata [11]. The ENDF/B-VIII.0 decay and fission product yield data would not impact the multiplication factors. It is noted that the fission product yield data were adopted from ENDF/B-VII.1, which came from England and Ryder’s seminal work from around 1990 with some modest updates for Plutonium fast neutron fission product yield data for ENDF/B-VII.1 [10].
Thermal scattering data for 1H in H2O. Figure 12 compares neutron spectra and group-wise reactivities for a typical PWR fuel pin between the ENDF/B-VIII.0 and VII.1 1H S(α,β) thermal scattering data in which the ENDF/B-VIII.0 data were used for other nuclides. Eigenvalue was underestimated with the ENDF/B-VII.1 1H S(α,β) data by about 60 pcm. There was some change in thermal neutron spectrum in fuel as shown in Figure 12a which would result in reactivity differences in the 235U absorption and fission reactions. Figure 12b shows error cancellations between the absorption and fission reactions, but there was overall positive reactivity with the ENDF/B-VIII.0 1H S(α,β) thermal scattering data.

5. Conclusions

Neutronic characteristics of ENDF/B-VIII.0 neutron cross-section data were investigated through a comparison with ENDF/B-VII.1. This type of investigation may need to be completed during evaluation of new ENDF/B data and there should be a collaborative iteration between the nuclear data evaluators and reactor physicists. The authors propose that the most important issues to resolve for ENDF/B-VIII.1 are as follows:
  • The depletion history effect should be eliminated, where ENDF/B-VIII.0 data have shown a significant increase in burnup-dependent reactivity bias compared to ENDF/B-VII.1. Six nuclides were responsible for a bias that essentially starts at 0 pcm for fresh fuel (due to cancellation of errors among the six nuclides) and decreases linearly to -800 pcm Δρ at a burnup of 60 GWd/MTU. This underprediction of reactivity with ENDF/B-VIII.0 is noticeable in comparisons with power plant data and essentially prevents ENDF/B-VIII.0 from being endorsed for LWR simulations.
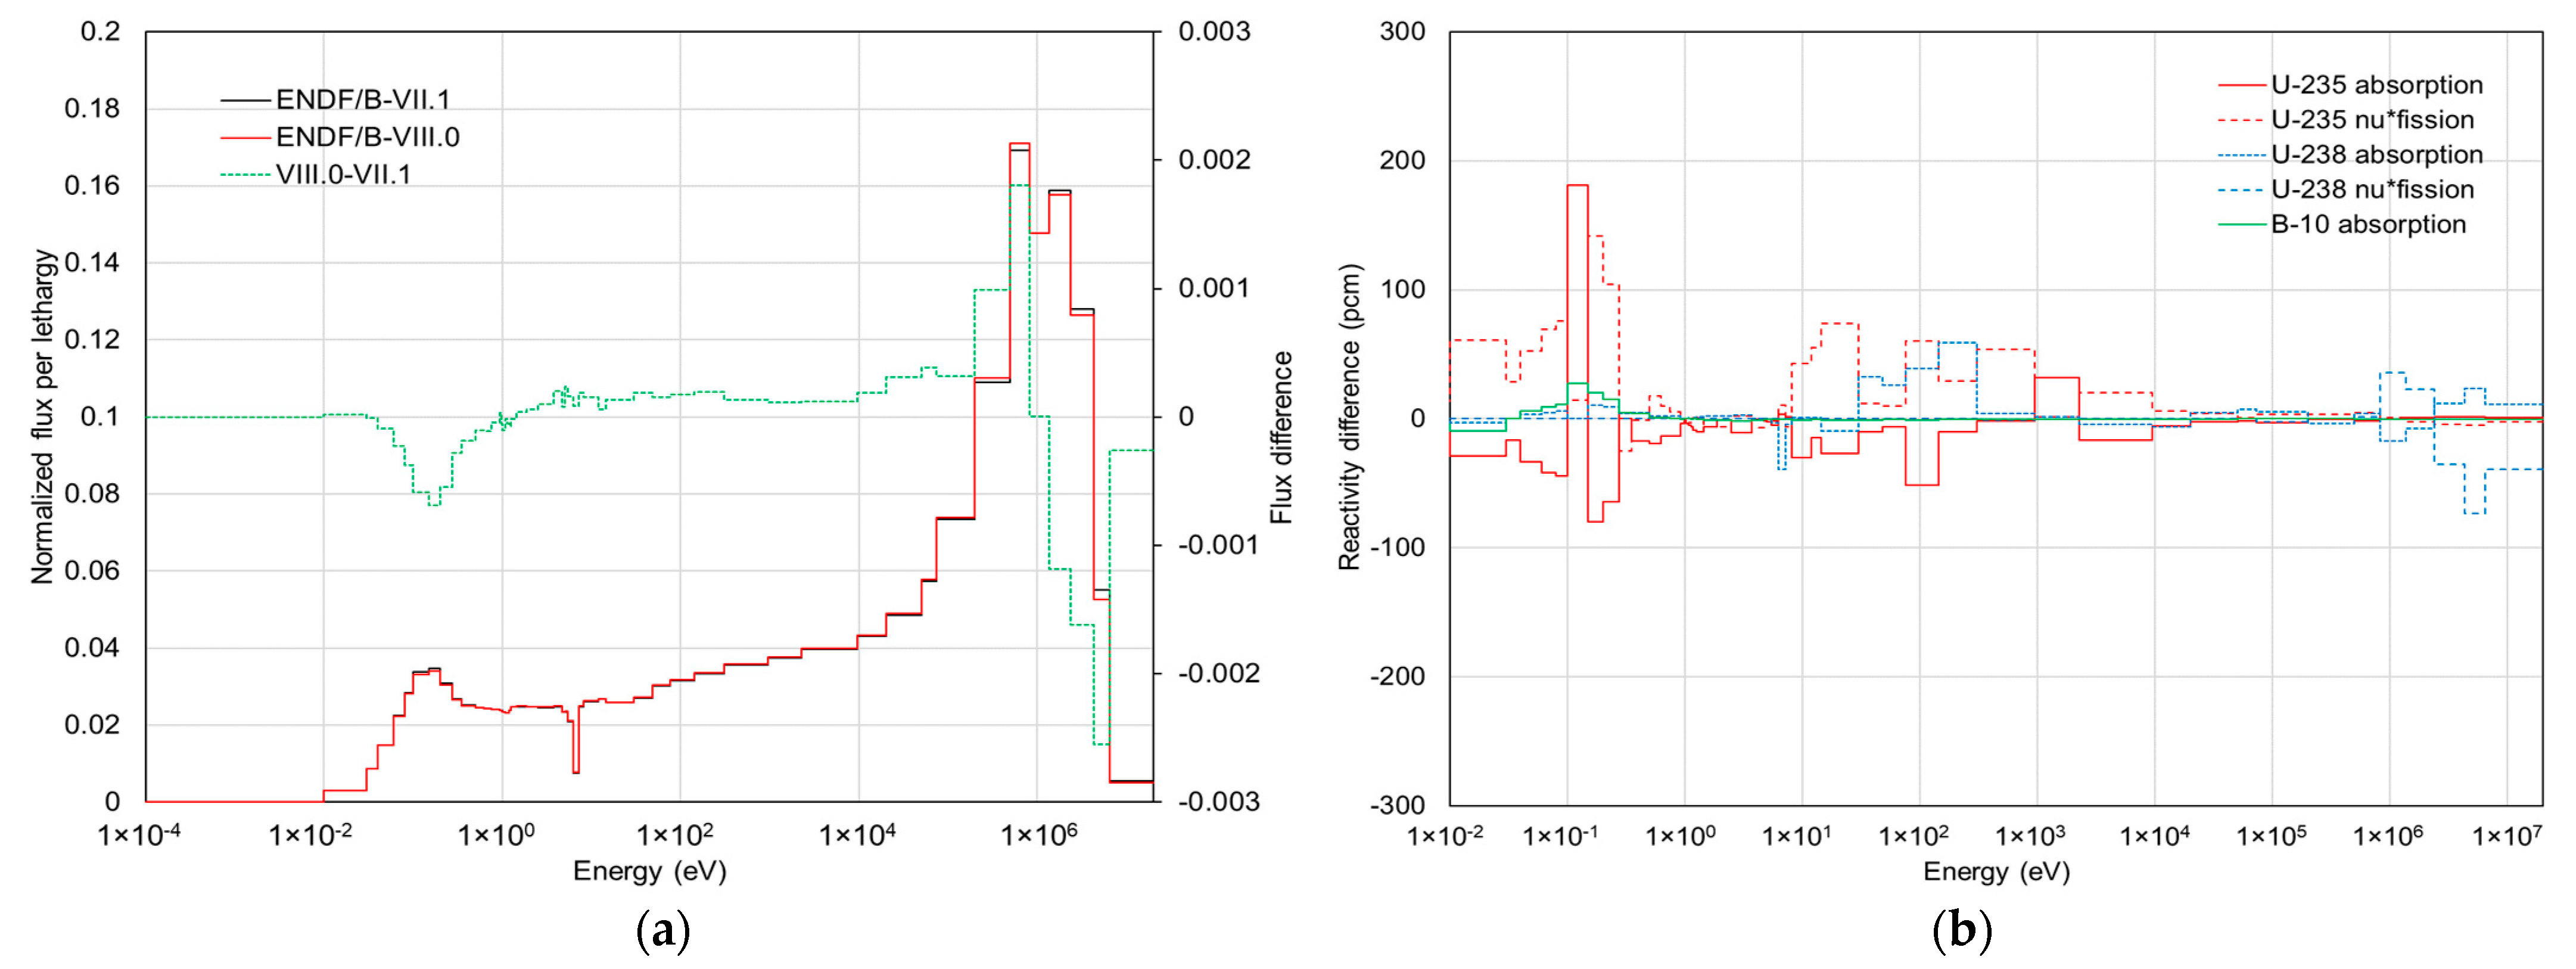
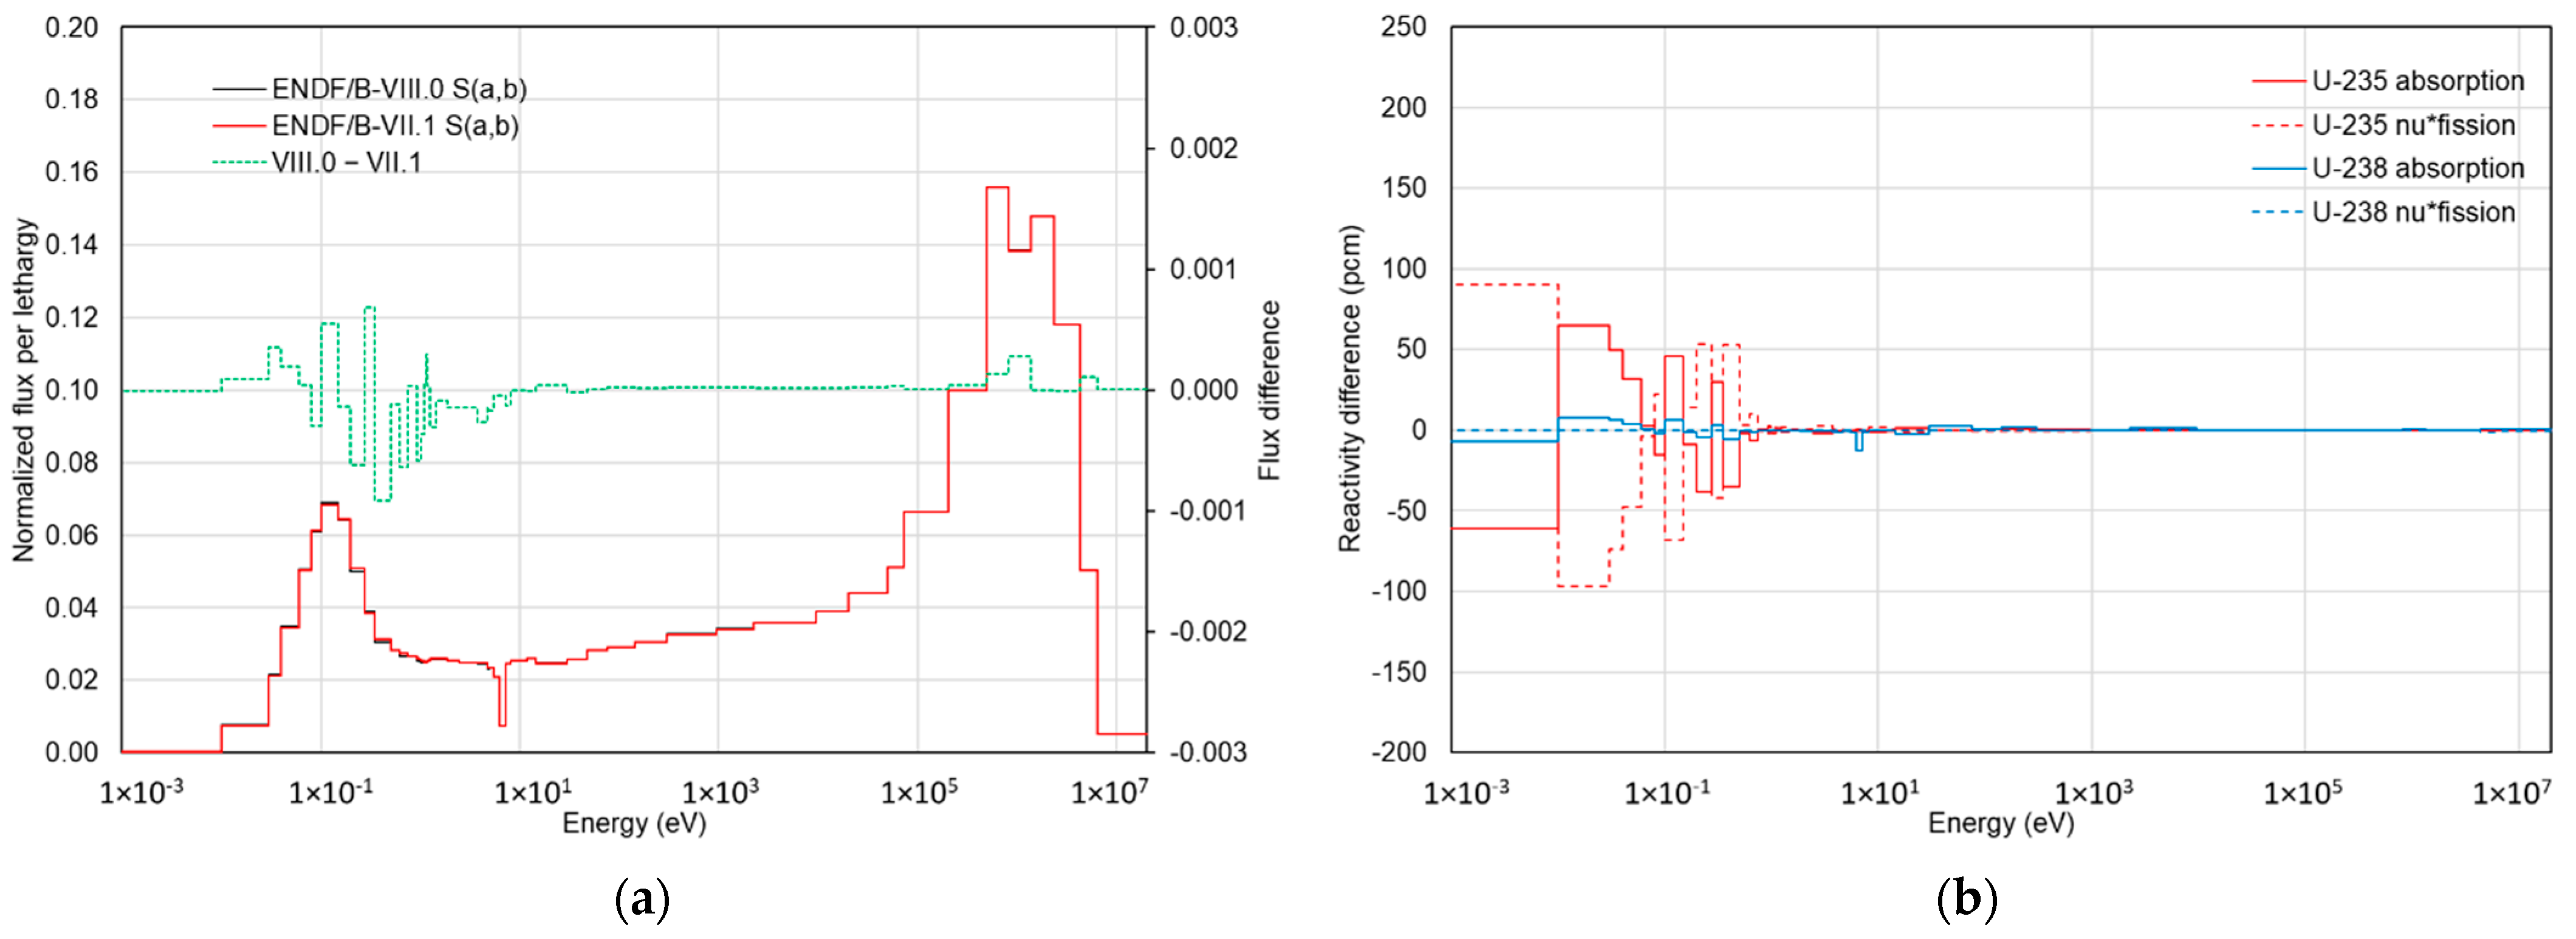
  • The epithermal scattering issue should be revisited, which exists in both ENDF/B-VII.1 as well as VIII.0. A higher-fidelity physics model is not used in practice because it introduces additional bias when comparing with measured data. Although, due to compensating effects, such an occurrence is not a surprise, this particular effect should be understood better. It may be that a new high-precision measurement is required to prove unequivocally the value of the higher-fidelity epithermal scattering treatment, at which point it could be used as the default in simulations and we can turn our attention to reducing the compensating errors.
Even though new ENDF/B data are developed through validation with the experiment data, data availability is very limited, so nuclear data issues in reactor physics analysis may not be effectively addressed in finalizing new ENDF/B libraries.
Many measured data from power plants across various advanced reactor systems exist. However, those measured data cannot be effectively used in evaluating ENDF/B libraries. The authors suggest that extensive benchmark calculations be performed to evaluate expected behavior and impacts for new ENDF/B versions under development through comparisons between other versions of ENDF/B libraries. The authors also suggest developing a systematic strategy and procedure to ensure that power plant measured data are engaged in nuclear data evaluation. This would shorten the development period for new ENDF/B versions and minimize potential issues in new ENDF/B releases.

Author Contributions

Conceptualization, K.-S.K.; formal analysis, K.-S.K.; investigation, K.-S.K.; writing—original draft preparation, K.-S.K.; writing—review and editing, W.A.W.; supervision, W.A.W.; project administration, W.A.W.; funding acquisition, W.A.W. All authors have read and agreed to the published version of the manuscript.

Funding

This research was funded by the US Nuclear Regulatory Commission Office of Research with the agreement number 31310019N0008 for the SCALE code development, assessment and maintenance.

Institutional Review Board Statement

Not applicable.

Informed Consent Statement

Not applicable.

Data Availability Statement

The data presented in this study are available on request from the corresponding author.

Acknowledgments

This research was supported by the US Nuclear Regulatory Commission Office of Research and the US Department of Energy NEAMS project.

Conflicts of Interest

The authors declare no conflict of interest.

References

  1. Turner, J.A.; Clarno, K.; Sieger, M.; Bartlett, R.; Collins, B.; Pawlowski, R.; Schmidt, R.; Summers, R. The Virtual Environment for Reactor Applications (VERA): Design and Architecture. J. Comput. Phys. 2016, 326, 544. [Google Scholar] [CrossRef] [Green Version]
  2. Consortium for Advanced Simulation of Light Water Reactors. Available online: http://www.casl.gov (accessed on 1 July 2021).
  3. NEAMS. NEET—Nuclear Energy Advanced Modeling & Simulation. Available online: https://www.energy.gov/ne/nuclear-reactor-technologies/advanced-modeling-simulation (accessed on 1 July 2021).
  4. Chadwick, M.; Herman, M.; Obložinský, P.; Dunn, M.; Danon, Y.; Kahler, A.; Smith, D.; Pritychenko, B.; Arbanas, G.; Arcilla, R.; et al. ENDF/B-VII.1: Nuclear Data for Science and Technology: Cross Sections, Covariances, Fission Product Yields and Decay Data. Nucl. Data Sheet 2018, 112, 2887–2996. [Google Scholar]
  5. Mangham, G.; Godfrey, A.; Eller, J. VERA Benchmarking of PWR Startup and Steady State Operation. In Proceedings of the CASL Technical Symposium, ANS 2020 Winter Meeting, Chicago, IL, USA, 15–19 November 2020. [Google Scholar]
  6. Kim, K.S.; Williams, M.L.; Wiarda, D.; Clarno, K.T. Development of the Multigroup Cross Section Library for the CASL Neutronics Simulator MPACT: Method and Procedure. Ann. Nucl. Energy 2019, 133, 46–58. [Google Scholar] [CrossRef]
  7. Kim, K.; Gentry, C.; Godfrey, A.; Liu, Y.; Palmtag, S. Development of the Multigroup Cross Section Library for the CASL Neutronics Simulator MPACT: Verification. Ann. Nucl. Energy 2019, 132, 1–23. [Google Scholar] [CrossRef] [Green Version]
  8. Kochunas, B.; Collins, B.; Stimpson, S.; Salko, R.; Jabaay, D.; Graham, A.; Liu, Y.; Kim, K.S.; Wieselquist, W.; Godfrey, A.; et al. VERA Core Simulator Methodology for Pressurized Water Reactor Cycle Depletion. Nucl. Sci. Eng. 2017, 185, 217–231. [Google Scholar] [CrossRef]
  9. Lee, D.; Smith, K.; Rhodes, J. The impact of 238U resonance elastic scattering approximations on thermal reactor Doppler reactivity. Ann. Nucl. Engr. 2009, 36, 274–280. [Google Scholar] [CrossRef]
  10. Brown, D.A.; Chadwick, M.B.; Capote, R.; Kahler, A.C.; Trkov, A.; Herman, M.W.; Sonzognia, A.A.; Danond, Y.; Carlsone, A.D.; Dunn, M.; et al. ENDF/B-VIII.0: The 8th Major Release of the Nuclear Reaction Data Library with CIELO-project Cross Sections. New Standards and Thermal Scattering Data. Nucl. Data Sheet 2018, 148, 1–142. [Google Scholar]
  11. Kim, K.S.; Wieselquist, W.A. Reactivity Underestimation of ENDF/B-VIII.0 Compared with ENDF/B-VII.1 for the Pressurized Water Reactor Depletion Analysis. Trans. Am. Nucl. Soc. 2021, 124, 520–523. [Google Scholar]
  12. Park, H.J.; Kang, H.; Lee, H.C.; Cho, J.Y. Comparison of ENDF/B-VIII.0 and ENDF/B-VII.1 in criticality, depletion benchmark, and uncertainty analyses by McCARD. Ann. Nucl. Energy 2019, 131, 443. [Google Scholar] [CrossRef]
  13. Bostelmann, F.; Holcomb, A.M.; Marshall, W.B.; Sobes, V.; Rearden, B.T. Impact of the ENDF/B-VIII.0 Library on Advanced Reactor Simulations. Trans. Am. Nucl. Soc. 2019, 121, 1369–1372. [Google Scholar]
  14. Wieselquist, W.A.; Lefebvre, R.A.; Jessee, M.A. (Eds.) SCALE Code System; ORNL/TM-2005/39, Version 6.2.4; Oak Ridge National Laboratory: Oak Ridge, TN, USA, 2020.
  15. Leppänen, J.; Pusa, M.; Viitanen, T.; Valtavirta, V.; Kaltiaisenaho, T. The Serpent Monte Carlo Code: Status, Development and Applications in 2013. Ann. Nucl. Energy 2015, 82, 142–150. [Google Scholar] [CrossRef]
  16. Goorley, T.; James, M.; Booth, T.; Brown, F.; Bull, J.; Cox, L.J.; Durkee, J.; Elson, J.; Fensin, M.; Forster, R.A.; et al. Initial MCNP6 Release Overview. Nucl. Tech. 2012, 180, 298–315. [Google Scholar] [CrossRef]
  17. Godfrey, A. VERA Core Physics Benchmark Progression Problem Specifications; CASL Report, CASL-U-2012-0131-004; Oak Ridge National Laboratory: Oak Ridge, TN, USA, 2014.
  18. Kim, K.S. Specifications for the VERA Depletion Benchmark Suite; CASL-X-2015-1014-000; Oak Ridge National Laboratory: Oak Ridge, TN, USA, 2015. Available online: https://info.ornl.gov/sites/publications/files/Pub61302.pdf (accessed on 1 July 2021).
  19. Palmtag, S. MPACT Library Verification by Comparison of Pincell Calculations to Monte Carlo Results; CASL Report, CASL-U-2016-0281-002; Oak Ridge National Lab. (ORNL): Oak Ridge, TN, USA, 2017.
  20. Palmtag, S. MPACT Library Verification by Comparison of Assembly Calculations to Monte Carlo Results; CASL Report, CASL-U-2016-1052-001; Oak Ridge National Lab. (ORNL): Oak Ridge, TN, USA, 2017.
  21. Joo, H.G.; Han, B.S.; Kim, C.H.; Kim, K.S. Implementation of Subgroup Method in Direct Whole Core Transport Calculation Involving Nonuniform Temperature Distribution. In Proceedings of the M&C 2005, Avignon, France, 12–15 September 2005. [Google Scholar]
  22. Mosteller, R.D. The Doppler-Defect Benchmark: Overview and Summary of Results. In Proceedings of the M&C+SNA 2007, Monterey, CA, USA, 15–19 April 2007. [Google Scholar]
  23. Lawing, C.; Palmtag, S.; Asgari, M. The VERA BWR Progression Problems; ORNL Technical Memo: Oak Ridge National Lab. (ORNL): Oak Ridge, TN, USA, in preparation.
  24. Becker, B. On the Influence of the Resonance Scattering Treatment in Monte Carlo Codes on High Temperature Reactor Characteristics. Ph.D. Thesis, University Stuttgart, Stuttgart, Germany, 2010. [Google Scholar]
  25. Macfarlane, R.; Muir, D.W.; Boicourt, R.M.; Kahler, A.C., III; Conlin, J.L. The NJOY Nuclear Data Processing System, Version 2016; LA-UR-17-20093; Los Alasmos National Lab. (LANL): Los Alamos, NM, USA, 2017.
Figure 1. Comparison of the multiplication factors as a function of burnup: (a) the reactivity difference between ENDF/B-VIII.0 without DBRC and ENDF/B-VII.1 without DBRC; (b) the reactivity difference between ENDF/B-VIII.0 with DBRC and ENDF/B-VII.1 without DBRC.
Jne 02 00026 g001
Figure 2. Most influential nuclides in ENDF/B-VIII.0.
Jne 02 00026 g002
Figure 3. Histogram of the extensive PWR (a) pin and (b) assembly benchmark results.
Jne 02 00026 g003
Figure 4. Comparison of reactivities with uniform fuel temperature distribution: (a) epithermal upscattering; (b) no epithermal upscattering.
Jne 02 00026 g004
Figure 5. Comparison of reactivities with nonuniform fuel temperature distribution: (a) epithermal upscattering; (b) no epithermal upscattering.
Jne 02 00026 g005
Figure 6. Comparison of Doppler temperature coefficients with various 235U enrichments: (a) epithermal upscattering; (b) no epithermal upscattering.
Jne 02 00026 g006
Figure 7. Comparison of the multiplication factors as a function of burnup for the BWR depletion benchmark problems without considering epithermal upscattering.
Jne 02 00026 g007
Figure 8. BWR extensive pin and assembly benchmark results.
Jne 02 00026 g008
Figure 9. Reaction-dependent groupwise reactivity differences caused by the reaction rate differences for the typical PWR fuel pin: (a) zero burnup; (b) 60 MWD/kgU burnup.
Jne 02 00026 g009
Figure 10. Comparison of the flux-weighted capture cross sections between ENDF/B-VII.1 and -VIII.0 in the 51-group structure: (a) 155Gd and 157Gd; (b) 10B.
Jne 02 00026 g010
Figure 11. Comparison of the flux and reactivity for IFBA between ENDF/B-VII.1 and -VIII.0 in the 51-group structure: (a) neutron spectra; (b) reactivity differences.
Jne 02 00026 g011
Figure 12. Comparison of the flux and reactivity between the ENDF/B-VIII.0 and VII.1 1H S (a,b) thermal scattering data in the 51-group structure: (a) neutron spectra; (b) reactivity differences.
Jne 02 00026 g012
Table 1. The PWR benchmark suite.
CaseDescriptionNumber of CasesReference
AVERA core physics progression problems26[7,17]
BExtended VERA progression problems15[7]
CVERA depletion problems24[7,18]
DExtensive PWR pin and assembly problems1620[7,19,20]
ENonuniform fuel temperature problems14[21]
FMosteller benchmark problems21[22]
Table 2. Benchmark cases for the BWR VERA depletion benchmarks.
No.FuelTypePellet Radius
(cm)
235U
wt %
Temperature (K)Void
(%)
Power
Density
(w/gU)
FuelCladMod.
1APinPB2_7×70.605793.1600600600040
1BPinPB2_7×70.605793.1900600600040
1CPinPB2_7×70.605793.11200600600040
1DPinPB2_7×70.605792.1900600600040
1EPinPB2_7×70.605793.6900600600040
1FPinPB2_7×70.605794.6900600600040
1GPinPB2_7×70.605793.19006006005040
1HPinPB2_7×70.605793.19006006007040
Table 3. Benchmark cases for the BWR single pins.
CategoryCaseSpecificationCasesTotalRemarks
Fuel types,
fuel radius/pitch
(cm)
PB Type-60.52070/1.625604156-
GE90.53213/1.62560
GE140.43800/1.30000
PB2 7 × 70.60579/1.87452
Moderator/fuel
temperatures
(K)
CZP a293/2934Zero burnup
HZP b600/600
HFP c-1600/900
HFP-2600/1200
235U
enrichment (wt %)
-2.1/3.1/4.13-
Void fraction
(%)
-0/50/70/9040% void only
for CZP
Burnup
(MWD/kgU)
-10/20/40/604643.1 wt%, HFP-1,
all voids and
all fuel types
All---220-
a CZP, cold zero power; b HZP, hot zero power; c HFP, hot full power.
Table 4. Benchmark cases for the BWR single assemblies.
CategoryCaseSpecificationCasesTotalRemarks
Fuel types,
fuel radius/pitch
(cm)
PB-T60.52070/1.625604320-
GE-090.53213/1.62560
GE-140.43800/1.30000
GE-14v0.60579/1.87452
235U
enrichment (wt %)
-Mixed/2.1/3.1/4.14-
Control rods-Out/In2-
Moderator/fuel
temperatures
(K)
CZP a293/2934-
HZP b600/600
HFP c-1600/900
HFP-2600/1200
Void fraction
(%)
-0/40/8030% void only
for CZP
All---320-
a CZP, cold zero power; b HZP, hot zero power; c HFP, hot full power.
Table 5. Results of the VERA PWR benchmark progression problems.
CaseKENO with DBRCKENO without DBRC
keff *(2–1)
Δρ (pcm)
keff *(2–1)
Δρ (pcm)
VII.1 (1)VIII.0 (2)VII.1 (1)VIII.0 (2)
1A1.185691.18521−341.187001.18667−24
1B1.180651.18002−451.182141.18126−63
1C1.168951.16853−311.171441.17116−21
1D1.158851.15866−141.162581.16249−7
1E0.770820.773594650.771270.77437519
2A1.180811.18076−31.181871.18167−14
2B1.181901.18177−91.183231.18302−15
2C1.171251.17143131.173621.17354−6
2D1.161891.16222241.165561.165678
2E1.068291.06901631.069531.0700142
2F0.974620.975791230.975690.97670107
2G0.846740.848091880.847660.84896181
2H0.787050.788001530.787930.7885295
2I1.178651.1786401.179621.17951−8
2J0.973780.975131420.974960.97630141
2K1.018641.01930641.019771.0202950
2L1.017601.019121471.018681.02017143
2M0.937780.940032550.938550.94090266
2N0.868400.870432680.869440.87133250
2O1.046131.047381141.047171.0482296
2P0.925660.927712390.926700.92862223
* Maximum standard deviation = 0.00013.
Table 6. Results of VERA PWR extended benchmark progression problems.
CaseKENO with DBRCKENO without DBRC
keff(2–1)
Δρ (pcm)
keff(2–1)
Δρ (pcm)
VII.1 (1)VIII.0 (2)VII.1 (1)VIII.0 (2)
1B-211.068711.069941081.070021.07163140
1B-261.133851.13415231.135481.135609
1B-311.180481.18019−211.182111.18170−29
1B-361.219511.21855−651.220961.21980−78
1B-411.251251.24909−1381.252441.25044−128
1B-461.277121.27472−1471.278711.27595−169
1C-00-3a1.244351.24341−611.247201.24587−86
1C-10-3a1.084841.08479−41.087381.08699−33
1C-20-3a1.000591.00113541.002971.00292−5
1C-40-3a0.881120.88135300.882970.8831827
1C-60-3a0.807110.80721150.808690.8088626
1C-10-1h1.171281.17082−341.173941.17320−54
1C-20-1h1.114171.11401−131.116471.116578
1C-40-1h1.033821.03463761.036141.0368263
1C-60-1h0.986250.987251030.988490.9894194
Table 7. Results of the extensive PWR pin benchmark problems.
Reactivity Differences between ENDF/B-VIII.0 and VII.1 (pcm)
KENO with DBRCKENO without DBRCCounts
AverageS. Dev.Min.Max.AverageS. Dev.Min.Max.
TotalAll−56114−206194−66119−215206360
Hot−51113−206194−62118−215206324
Cold−105122−19935−108126−2095036
Hot
235U
(wt %)
2.16194−471945086−60206108
3.1−6985−14938−8195−15713108
4.1−145149−2060−154158−2150108
Boron
PPM
0−111131−2067−122140−2150108
600−53100−165101−63106−17980108
130011105−1321941103−145206108
Density
(g/cm3)
0.7408−46113−205194−57118−212172108
0.7032−50111−198177−62117−203206108
0.6560−56114−206188−66119−215164108
Fuel
temp.
(K)
600−60115−206162−69121−212172108
900−52113−194185−60115−205164108
1200−41110−200194−55117−215206108
Cold
235U
(wt %)
2.1−4465−10235−4570−1155012
3.1−112118−1600−116121−173012
4.1−160164−1990−164167−209012
Boron
PPM
0−150155−1990−156161−209012
600−108119−1710−108118−171012
1300−5782−15035−6087−1365012
Table 8. Results of the extensive PWR assembly benchmark problems.
Reactivity Differences between ENDF/B-VIII.0 and VII.1 (pcm)
KENO with DBRCKENO without DBRCCounts
AverageS. Dev.Min.Max.AverageS. Dev.Min.Max.
TotalAll32154−19855418150−2145451260
Hot43158−19855428154−2145451134
Cold−65104−196183−72107−201239126
Hot
235U
(wt %)
2.1178227−39554160213−52545378
3.121108−1353017106−161297378
4.1−71109−198190−84119−214132378
Boron
PPM
0−24134−198407−38137−214372378
60040148−15448826142−181469378
1300111188−12555496179−134545378
Density
(g/cm3)
0.740846159−19753632154−209545378
0.703243158−19855427153−213519378
0.656039158−19852425154−214508378
Fuel
temp.
(K)
60030149−19850719148−209520378
90044160−19055428153−214545378
120054165−19855036159−209510378
Cold
235U
(wt %)
2.1−175−109183−1078−11623942
3.1−7195−161154−7897−1735942
4.1−124134−19638−128137−2011642
Boron
PPM
0−118132−19659−126138−2017342
600−6794−160117−7495−16710242
1300−1180−111183−1679−12423942
Table 9. Results of the BWR extensive pin and assembly problems.
Reactivity Differences between ENDF/B-VIII.0 and VII.1 (pcm)
Single pins Assemblies
AverageS. Dev.Min.Max.Counts AverageS. Dev.Min.Max.Counts
TotalAll−10157−215509220TotalAll35119−132474320
235U (wt %) 235U (wt %)Mixed166187−5847480
2.179188−113509522.194103−2418780
3.1−20119−1744111163.1−2333−717880
4.1−78192−215363524.1−9698−132−1580
Void (%)0−65100−21174112Void (%)000000
50−106130−2153436404040404040
70−4491−16011836808080808080
9029130613450936------
Burnup (MWD/kgU)0−8184−215509156Control rodOut23105−132239160
10−5963−102016In48131−127474160
20−924−523116------
401238−437416------
60−839−705816------
Fuel temp. (K)293−92112−2043528Fuel temp. (K)293−2756−11212232
600−6155−2114226460036123−13047496
9003165−2154796490044125−13243996
12009166−20350964120047123−12927696
Publisher’s Note: MDPI stays neutral with regard to jurisdictional claims in published maps and institutional affiliations.

