Article

Effect of Dissolution Time on the Development of All-Cellulose Composites Using the NaOH/Urea Solvent System

by
Juan Francisco Delgado
1,2,*,
Andrés Gerardo Salvay
3,
Silvana Arroyo
1,4,
Celina Raquel Bernal
1,2 and
María Laura Foresti
1,2
1
Facultad de Ingeniería, Universidad de Buenos Aires, Av. Las Heras 2214, Ciudad de Buenos Aires C1127, Argentina
2
Instituto de Tecnología en Polímeros y Nanotecnología (ITPN), CONICET—Universidad de Buenos Aires, Av. Las Heras 2214, Ciudad de Buenos Aires C1127, Argentina
3
Departamento de Ciencia y Tecnología, Universidad Nacional de Quilmes, Roque Sáenz Peña 352, Bernal B1876, Argentina
4
Instituto de Tecnologías y Ciencias de la Ingeniería “Hilario Fernández Long” (INTECIN), CONICET—Universidad de Buenos Aires, Av. Paseo Colón 850, Ciudad de Buenos Aires C1063, Argentina
*
Author to whom correspondence should be addressed.
Polysaccharides 2023, 4(1), 65-77; https://doi.org/10.3390/polysaccharides4010005
Submission received: 19 December 2022 / Revised: 15 February 2023 / Accepted: 16 February 2023 / Published: 18 February 2023
(This article belongs to the Topic Cellulose and Cellulose Derivatives)

Abstract

:
Innovative and sustainable all-cellulose composites (ACCs) can be obtained by partial dissolution of cellulosic fibers and regeneration of the dissolved fraction. Among cellulose solvents, sodium hydroxide/urea solutions are recognized as promising low-environmental impact systems. In this work, filter paper (FP) was dissolved with a 7 wt% NaOH/12 wt% urea aqueous solution, kept at −18 °C for different time intervals, regenerated with distilled water and finally dried under different conditions. The developed films were characterized in terms of morphology, porosity, optical properties, crystalline structure, hydration and mechanical properties. The porosity of the composites decreased with dissolution time due to the progressive filling of voids as the cellulosic fibers’ surface skin layer was dissolved and regenerated. Samples treated for 4 h showed the minimum values of porosity and opacity, high hydration and a substantial change from cellulose I to cellulose II. Hot pressing during drying led to relevant improvements in ACCs stiffness and strength values.

1. Introduction

Single-polymer composites are a special kind of composites in which the reinforcement and the matrix have the same chemical identity [1]. This concept was first introduced by Capiati and Porter who obtained single HDPE-polymer composites by melt processing [2]. Since the same polymer is used for both the reinforcement and the matrix, excellent compatibility between components is expected and composite recycling is more straightforward [3].
Cellulose is the most abundant biopolymer in nature, and it is widely recognized for its outstanding mechanical properties which have triggered its use as a reinforcement of different polymeric matrices. Although cellulose is insoluble in most common solvents, dissolution in certain low-environmental-impact solvent systems such as ionic liquids and cold alkaline solutions has proved possible [4]. In particular, NaOH/urea aqueous solutions are effective in dissolving cellulose at low temperatures (less than 0 °C), at concentrations in the range of 7 to 10 wt% for NaOH and up to 24 wt% for urea [5,6]. The role of urea in the solvent system is crucial. While under certain conditions NaOH solutions are able to dissolve low-DP cellulose [4,7], the addition of urea enhances the performance by interacting with OH- through hydrogen bonds, stabilizing Na+ cations and promoting the formation of inclusion complexes cellulose-NaOH-urea-H2O [8]. Although it is claimed that there is no direct interaction between urea and cellulose, the formation of inclusion complexes enables cellulose with a higher degree of polymerization to be dissolved [8]. The NaOH/urea solvent system has also been proposed to dissolve other polysaccharides such as chitin [9].
The preparation of “all-cellulose composites” (ACCs) can be carried out by two methods called “partial dissolution” and “impregnation”. In the partial dissolution method, the surface of cellulose fibers is dissolved and regenerated to constitute the matrix of the composite, while the cores of the fibers act as the reinforcement [10]. On the other hand, in the impregnation method, cellulose fibers (reinforcement) are introduced into a previously prepared cellulose solution that, once regenerated, will form the matrix of the composites trapping the fibers [11].
In the current contribution, the effects of the treatment time of filter paper (FP) with 7 wt% NaOH/12 wt% urea aqueous solution on certain properties of ACCs obtained by the partial dissolution method were studied. Based on previous articles dealing with the characterization of ACCs obtained using filter paper and the NaOH/urea solvent system [10,12], the current investigation is particularly focused on the effect of treatment time on the final characteristics of the ACCs [10,13,14]. Special attention was given to the morphology, porosity, water-holding capacity, crystalline structure, optical properties, hydration and mechanical properties of the ACCs.

2. Materials and Methods

2.1. Materials

Composites were prepared using qualitative slow-filtering filter paper (Grade 103, Hangzhou Fuyang Xinxing Co., Zhejiang, China) in the form of cotton cellulose circular samples. Paper discs with 110 mm of diameter, 80 ± 4 g m−2 of grammage, 10–15 µm maximum pore diameter and an ash content lower than 0.15% were employed (data provided by the supplier). Analytical grade NaOH and urea (Anedra, Research AG, Buenos Aires, Argentina) were used in the solvent system. The degree of polymerization (DP) of the filter paper was 505, as determined by the ISO 5351 method [15] using Kes and Christensen parameters [16]. This value falls within the adequate DP range (i.e., 500–900) for cellulose dissolution in the 7 wt% NaOH/12 wt% urea solvent system used [5].

2.2. Preparation of All-Cellulose Composites

Filter paper sheets were pretreated first with distilled water (20 min) and then with a 3 wt% NaOH aqueous solution (20 min) at room temperature [13]. Once the time of the pretreatment was over, the liquid was discarded and 13.6 g of the 7 wt% NaOH/12 wt% urea aqueous solution was incorporated. Samples were immediately placed at −18 °C for 1, 2, 3 and 4 h. After these periods, samples were removed from the freezer and kept at room temperature, and the solvent in excess was discarded and replaced by distilled water. This process was repeated several times to wash the samples until a neutral pH was reached. The water holding capacity (WHC) was measured in wet samples according to Equation (1), after the careful removal of excess water using a cloth without applying any pressure [17]; wwet and wo are the weights of the treated sample and the initial dry weight of the filter paper, respectively.
W H C   ( % ) = ( w w e t w o ) w o × 100
Finally, the samples from the different treatment times were dried in hot air (50–55 °C) until they achieved a constant weight. In addition, aiming to evaluate the benefits derived from drying under hot pressing (HP), some samples treated with 7 wt% NaOH/12 wt% urea aqueous solution for 4 h were dried under pressure (105 °C, 100 kPa, 30 min) in a heated Carver hydraulic press (model 3925, United States). Both drying methods required prior extensive sample washing in order to avoid alkaline degradation during heating (usually evidenced as a color change in samples from white to yellow or brown).

2.3. Morphological and Structural Characterization of All-Cellulose Composites

2.3.1. Determination of Porosity and Size Reduction

ACC porosity was determined using Equation (2) [18], and the density value of pure cellulose (1592 kg m−3) given by Mwaikambo & Ansell [19]. The density of the sample (ρsample) was calculated using Equation (3), where m is the weight of the ACC (±0.01 g), and L is the thickness (n = 12 ± 0.01 mm). A is the area measured using photographs (±0.05 mm) taken as detailed later on (Section 2.4) and processed with ImageJ (v1.53e, National Institutes of Health, Bethesda, MD, USA) [20].
φ = 1 ρ s a m p l e ρ c e l l u l o s e × 100
ρ s a m p l e = m ( L × A )
Sample size reduction (%) was determined from the images of the composites according to Equation (4). Ao corresponds to the area of the filter paper before treatment and A is the area of the composite after drying.
Reduction   ( % ) = ( A o A ) A o × 100

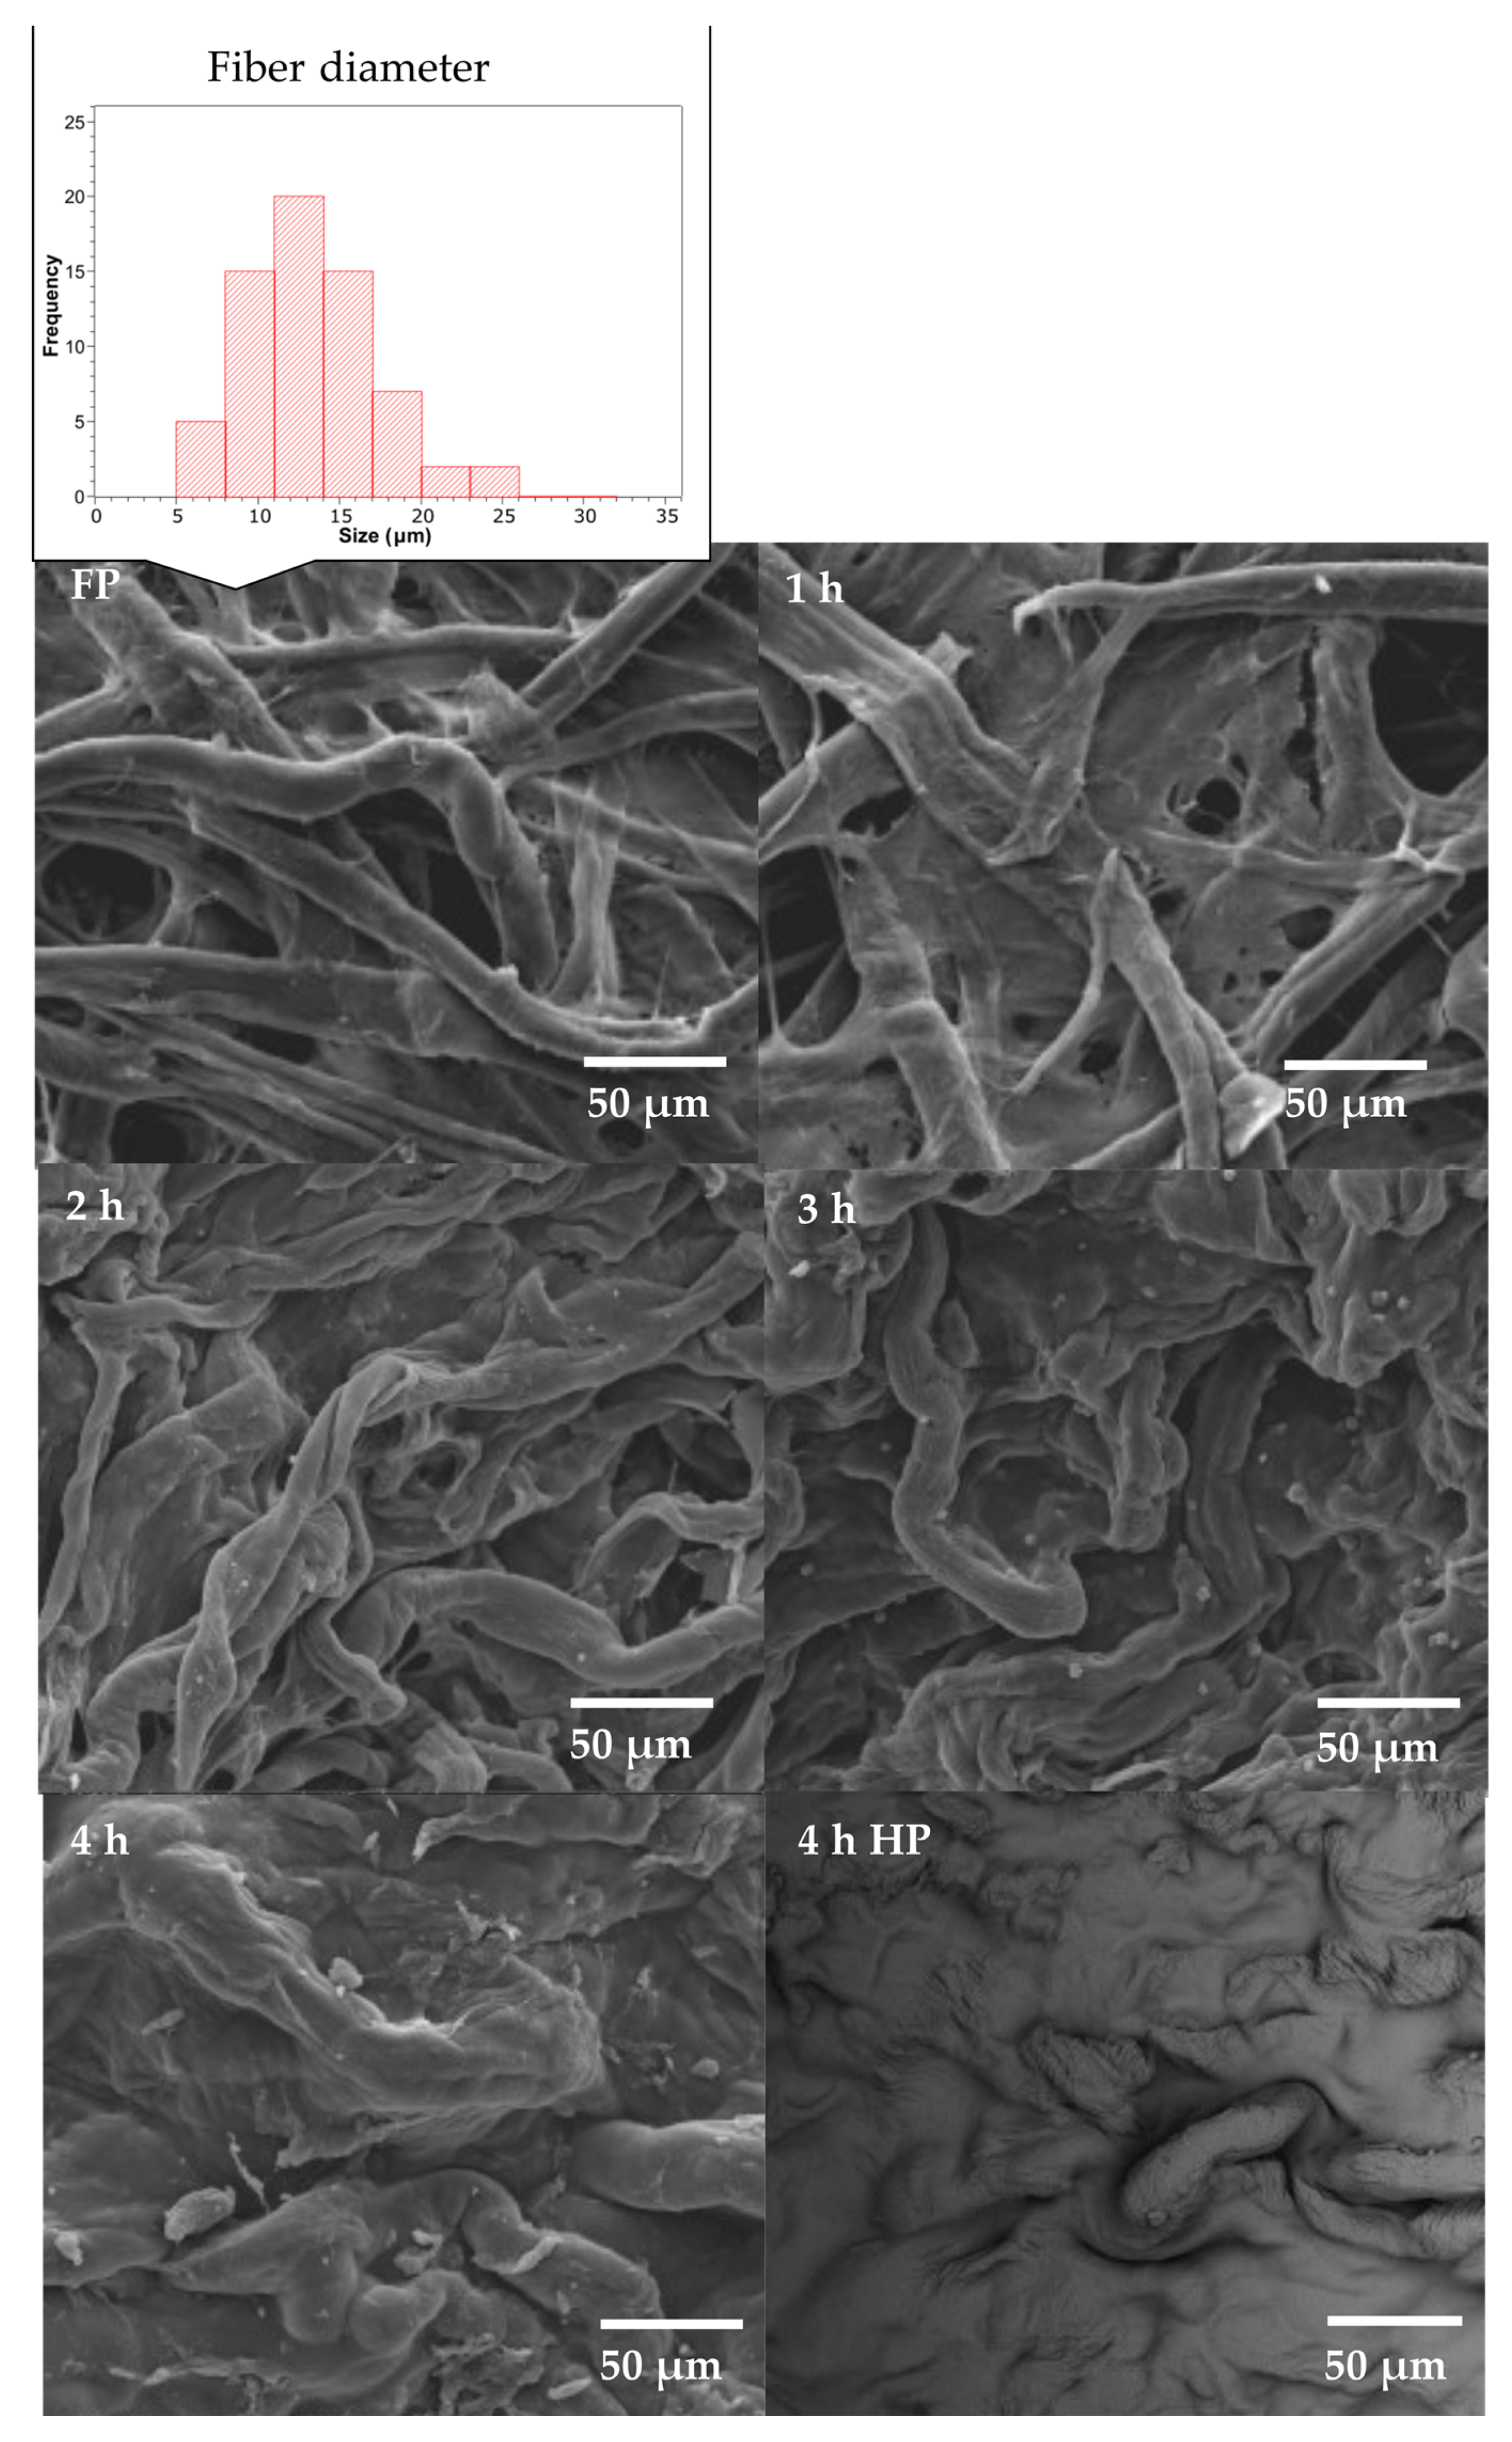
2.3.2. Scanning Electron Microscopy (SEM) Analysis

The surface of the samples was observed by scanning electron microscopy (Quanta 200, FEI Co., Hillsboro, OR, USA) at 20 kV. Samples were coated with a thin layer of gold before SEM observation. The diameter of the fibers in filter paper was measured from the SEM images using ImageJ software and reported as a histogram.

2.3.3. Brunauer-Emmett-Teller (BET) Surface Area Determination

The specific surface area of previously degassed samples (10 µm Hg, 0.5 h) was determined by nitrogen adsorption-desorption measurements using liquid nitrogen (77.5 K) in a Micromeritics ASAP 2020 equipment. The weight of each sample assayed was approximately 1 g and the complete measurement interval was 120 min.

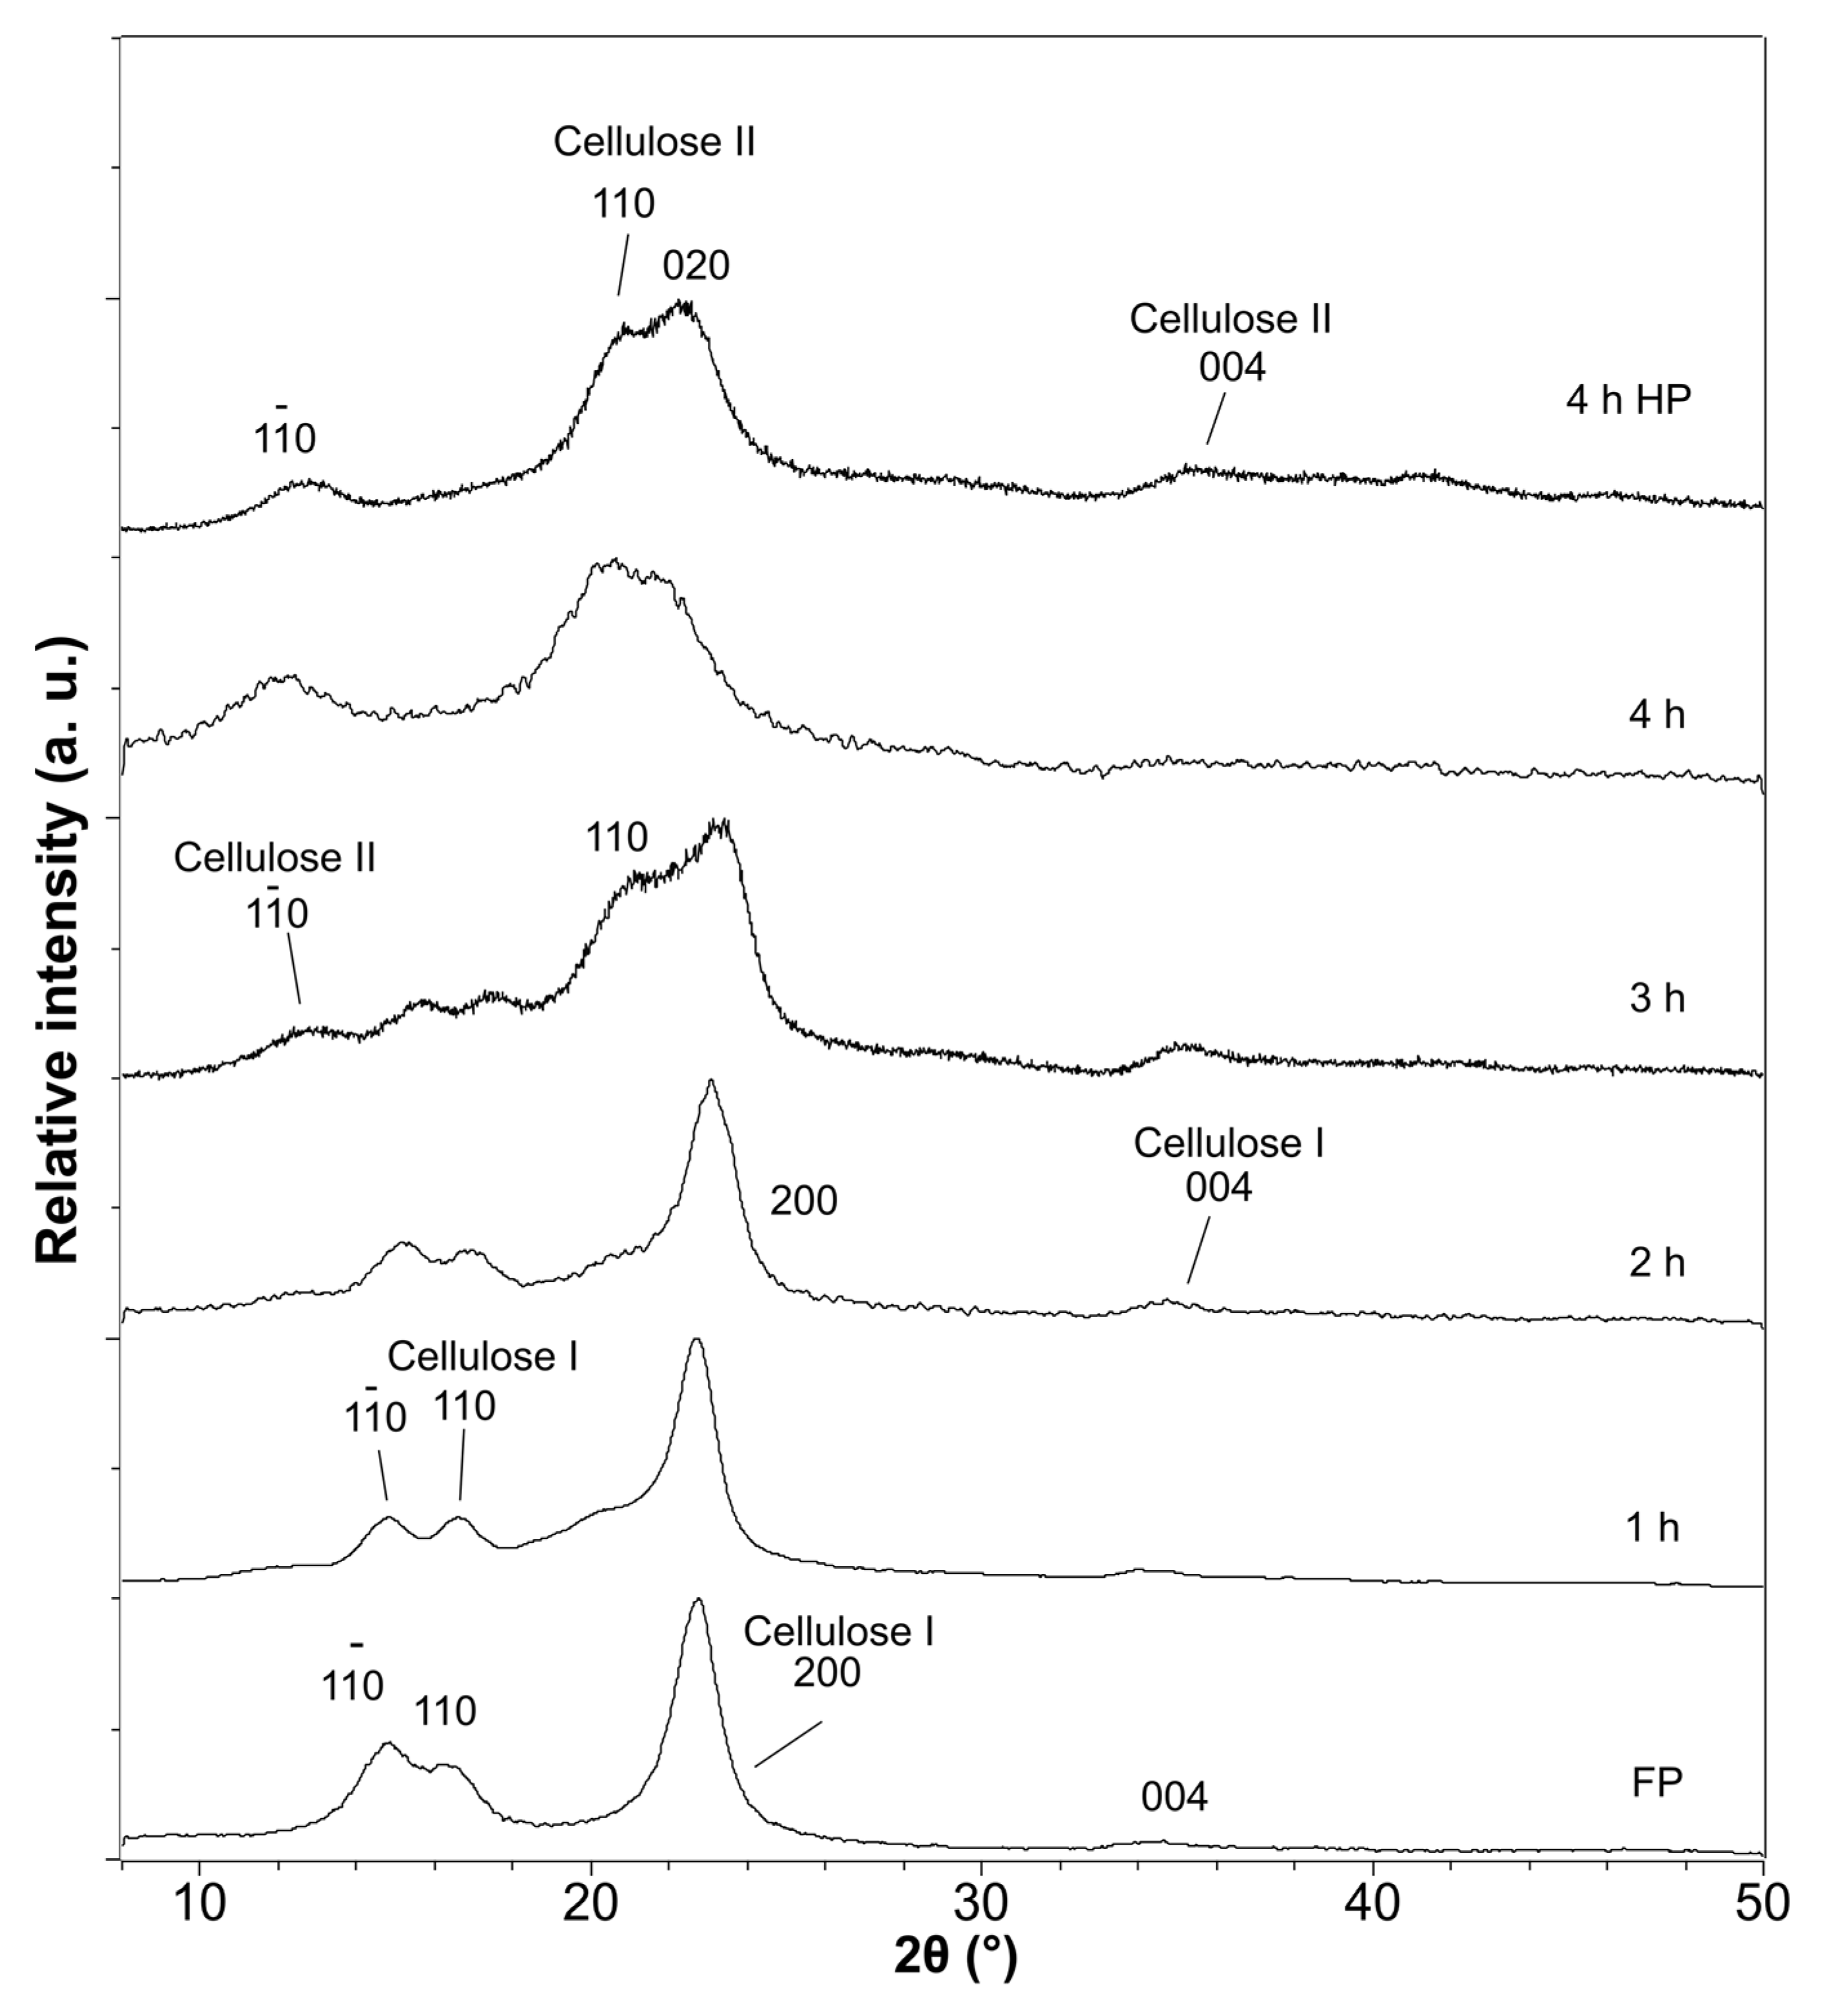
2.3.4. X-ray Diffraction (XRD) Analysis

Samples were analyzed in an X-ray diffractometer (D/Max-C, Rigaku) operated in reflection mode with a Cu Kα radiation source filtered by nickel, a potential difference of 40 kV and a current intensity of 50 mA. The range of 2θ analyzed was 8.00–50.00° with a step of 0.02°.

2.4. Optical Characterization of All-Cellulose Composites

The opacity of the composites was analyzed by taking photographs of the samples under controlled conditions. A photographic black chamber was built following the procedure reported by Yam and Papadakis with some modifications [21]. This chamber allows taking photographs under controlled conditions with a defined illumination. LED lights with a color temperature of 6 500 K (12 W, 450 lumens, LT5, Interelec S.A., Argentina) to accomplish the CIELab 1976 standard were placed inside the chamber on the inner surface of the roof, separated by 175 mm. Samples were placed at the same distance from the roof.
Samples were placed over black (L*: 6.65 ± 0.28, a*: −3.81 ± 0.44 and b*: 0.19 ± 0.74) and white (L*: 88.21 ± 0.05, a*: 2.16 ± 0.03 and b*: −4.54 ± 0.04) backgrounds and photographed according to the procedure of Riquelme et al. [22] to determine their opacity. A digital Camera (Sony IMX 230, Kanagawa, Japan) with 21 MP resolution was used. Photographs were taken in the sRGB color space using the following conditions: f/2.0 mm (aperture), ISO 100, cloudy-daylight white balance (according to the lighting used) and total exposure value equal to 11. Photographs were analyzed with ImageJ software, and were converted to CIELab 1976 space using the incorporated function for D65 illumination. In this way, histograms for L* values were obtained. The mode of population for each parameter was taken and the opacity was calculated from Equation (5).
O p a c i t y = L B l a c k b a c k g r o u n d * L W h i t e b a c k g r o u n d *
Sample luminosity (L*) was determined with a hand-held colorimeter (CR 400, Konica-Minolta), calibrated using a pattern provided by the manufacturer (L*: 84.0, a*: 0.3160 and b*: 0.3220). Samples were placed over black and white backgrounds (the same used in photographs) and L* was measured at five random points. Opacity was also obtained with the colorimeter using Equation (5). Opacity values from both methods used were compared.

2.5. Water Vapor Sorption of All-Cellulose Composites

ACCs previously dried in silica gel for 7 days were placed in sorption containers of 7 liters and kept at 22 °C and 90% r.h. (relative humidity), generated by a saturated solution of BaCl2. Samples were weighed (±0.0001 g) at different times to obtain the kinetics of water vapor sorption. Experiments were performed in triplicate. The water content h (in g H2O per g of dry mass, d. m.) as a function of time t was fitted using a first-order kinetics biexponential function that considers two rates for the water uptake [23], as shown in Equation (6).
h t = h 0 + h 1 1 exp t τ 1 + h 2 1 exp t τ 2
where h0 is the water content at the beginning (h0 = 0), Δh1 and Δh2 are the water contents related to the contribution of processes 1 and 2, respectively, and τ 1 and τ 2 are time constants for the water uptake of each process. The water content at equilibrium h was calculated as h = Δh1 + Δh2, and the mean time constant τ for the full water uptake process was obtained as τ = (Δh1/h) τ 1 + (Δh1/h) τ 2, where Δh1/h and Δh2/h are the fractions of the contribution to the total hydration of processes 1 and 2, respectively.
In addition, sorption isotherms were determined by weighing samples periodically in an analytical balance (±10−4 g) until they reached the equilibrium at selected r.h. Samples of ACCs previously dried in silica gel for 7 days (≈0% r.h.) were placed in containers of 1.5 liters and equilibrated at different r.h. (11%, 33%, 43%, 57%, 75% and 90%) by exposing them to saturated solutions of LiCl, MgCl2, K2CO3, NaBr, NaCl and BaCl2 at 22 °C, respectively [24,25]. The water content, or hydration h, given in units of g of water per g of dry matter (d. m.), was evaluated as a function of aw (equilibrium r.h./100). Experiments were performed three times. Isotherms were fitted using the Guggenheim-Anderson-DeBoer (GAB) model [26], according to Equation (7):
h a w = N × c × k × a w [ 1 + c 1 × k × a w × 1 k × a w ]
where N is a parameter related to the primary binding sites of water molecules at the monolayer (g of water per g of d. m.), c is a parameter related to the difference of chemical potential in water molecules strongly (monolayer) and weakly (upper layers) bound to the sample and k is associated to the difference of enthalpy of the pure liquid water and water bound to the upper layers of hydration in the sample [27].

2.6. Mechanical Properties of All-Cellulose Composites

Uniaxial tensile tests were performed in an Instron dynamometer (model 5985) at 1 mm min−1 at room temperature. Samples were obtained according to ASTM D1708-13 [28] with 22 mm of effective length and 5 mm of width. Nominal stress(σ)-strain(ε) curves were obtained and Young’s modulus (E), tensile strength (σUTS) and strain at break (εb) values were determined from these curves. At least 6 samples were tested for each system, and the average values and their deviations were reported.

2.7. Statistical Analysis

Infostat software (v2020I, Grupo Infostat, Argentina, South America), R (v4.0.2, Cran Software) and Jamovi (v2.3, The jamovi project) were used to perform the analysis of variance (ANOVA) and Games-Howell contrast tests.

3. Results

3.1. Morphology

Table 1 shows the porosity values determined for the ACCs produced. A strong decrease in sample porosity was observed with an increase in treatment time, with average porosity values of 3–4% for the highest treatment time assayed, irrespective of the drying conditions used. In the partial dissolution method employed in this work to produce the ACCs, when the dissolved surface skin layer of the cellulosic fibers in FP is regenerated to constitute the matrix of the composite, voids are progressively filled, and porosity is reduced. A similar behavior was observed by Adak and Mukhodpadhyay in ACCs made from lyocell fabrics and 1-butyl-3-methyl imidazolium chloride ([C4mim]+Cl). Porosity was reduced from almost 40% to less than 5% after 4 h of treatment [29]. Using the same method, other authors observed an increase in the apparent density, from 465 kg m−3 to 1032 kg m−3 after the treatment of wood pulp with 7 wt% NaOH/12 wt% urea for 4 h [10]. Hot pressing of the sample pretreated for 4 h did not induce noticeable changes in the final porosity of the corresponding ACC.
Simultaneously, with an increase in treatment time a sustained size reduction of the ACCs films was observed (Table 1), which reached a value close to 80% after 4 h of treatment, irrespective of the drying conditions used. In the same way, the results of BET specific surface area measurement also evidenced a drastic reduction of the accessible area of solid surface per unit mass in samples treated for 4 h, with respect to the filter paper (FP: 1.04 ± 0.03 m2 g−1, 4 h: 0.17 ± 0.03 and 4 h HP: 0.18 ± 0.02—83% of reduction). Similar specific surface area values (0.10 m2 g−1, 50% of reduction) were reported by Khakalo et al. for all-wood composites, after treatment of delignified wood with the ionic liquid (IL) 1-ethyl-3-methylimidazolium acetate for 30 min [30]. The reduction in the specific surface area of the ACCs is in accordance with the progressive coverage of FP voids already mentioned.
In Figure 1 SEM micrographs of filter paper and ACCs are shown. In the case of the original filter paper, randomly arranged microfibers with an average diameter value of 13.3 ± 4.2 µm are shown (the corresponding histogram is also included in Figure 1). As dissolution time increased, the progressive coverage of the voids of FP structure was observed. Indeed, in the micrographs corresponding to the samples of 4 h of treatment, the original pores are no longer distinguishable.
Overall, the results collected in Table 1 and micrographs shown in Figure 1 show the determining effect of dissolution time on the sample architecture, with a remarkable increase in compactness as longer treatment times were used.

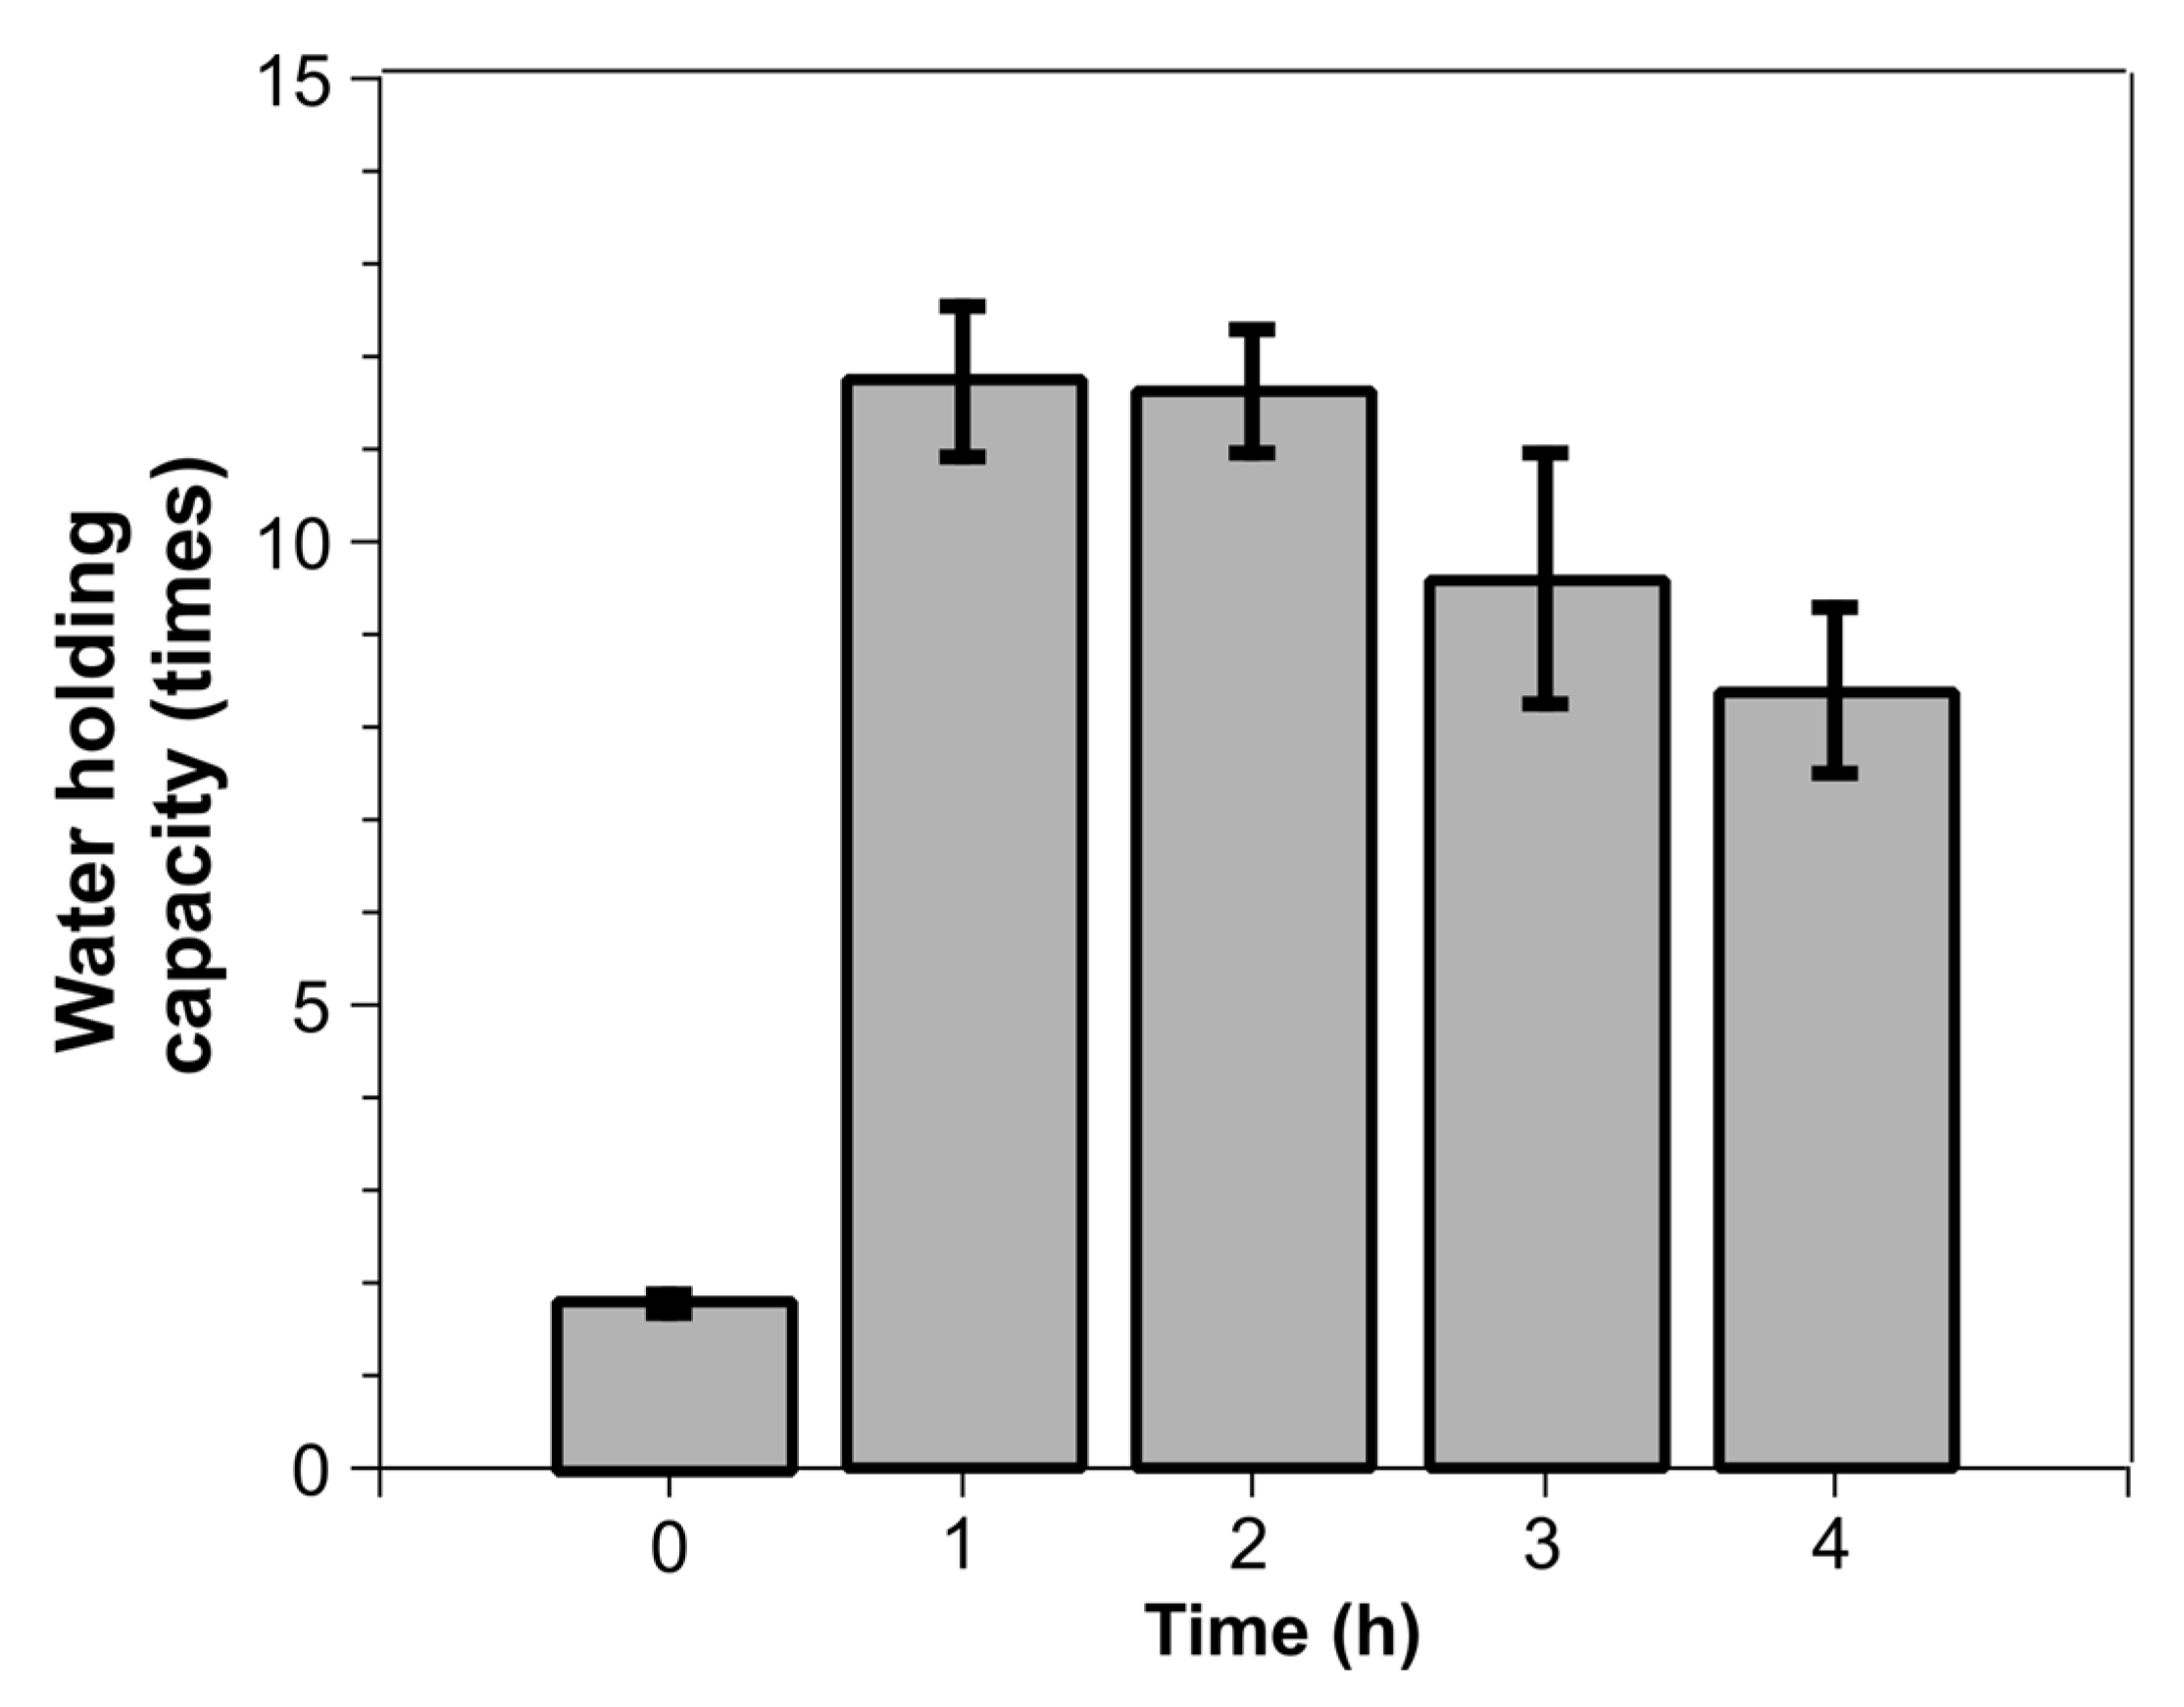
3.2. Water Holding Capacity

The water holding capacity (WHC) of FP increased drastically upon treatment with the NaOH/urea system, which may be attributed to the entry of the solvent and the subsequent opening of the paper structure. As shown in Figure 2, all samples studied had a WHC higher than that of the original filter paper (up to seven times). The maximum WHC value was reached after 1 h of treatment, whereas longer periods resulted in a progressive reduction in the sample WHC. Longer dissolution times promote larger amounts of dissolved and then regenerated cellulose, which may lead to a decrease in WHC due to the promotion of cellulose–cellulose interactions. Massive regeneration has been claimed to lead to an expulsion of the water trapped between chains and the reduction of total size [31], due to the removal of the Na+ and the decrease in the osmotic pressure inside the hydrogel [32].

3.3. Crystalline Structure

Figure 3 shows the X-ray diffractograms of the filter paper and ACC samples. The filter paper diffractogram showed peaks characteristic of cellulose I (i.e., 2θ: 14.7°, 16.4°, 22.6°) [33], as previously reported for similar filter paper samples [13,34]. With the progression of treatment with the NaOH/urea solution, the X-ray diffractograms of ACCs significantly changed, and signals characteristic of cellulose II (12.4°, 20.1°, 21.9°) [33,35] appeared with varying intensity. Under the assayed conditions, a notorious change took place between 2 h and 3 h of treatment; in the samples treated for 4 h, only peaks typical of cellulose II were observed, suggesting an allomorphic transition from cellulose I to cellulose II [33,36,37]. Other authors have also reported a transition from cellulose I to cellulose II for other cellulose sources regenerated from a NaOH/urea solution [38]. While cellulose I is packed in parallel form, cellulose II is organized in an antiparallel form, making the change irreversible [39,40]. Cellulose II is characterized by a complex network of hydrogen bonds that results in a crystalline form that is more difficult to dissolve and more stable than cellulose I [41]. Some authors proposed that the mobility in the paracrystalline and amorphous zones could promote the change of the crystalline form in the whole sample [13].

3.4. Opacity

The solubilization of cellulose and its subsequent regeneration may result in visual changes associated with the evolution of the treatment [42]. Table 2 shows the progress in the opacity of the ACCs measured using two different devices. The results showed that while filter paper and samples of 1 h and 2 h of treatment show similar opacity values, close to 0.95, a noticeable reduction in sample opacity took place at 3 h (Photographs method) and 4 h of treatment. This behavior has been previously attributed to the change of cellulose I to cellulose II, as well as to the covering of voids by the regenerated cellulose which acts as the matrix of the composite [43]. Significant reductions in ACC opacity and/or increments in ACC transmittance have been previously reported by other authors using filter paper and other solvent systems [13,14,44].

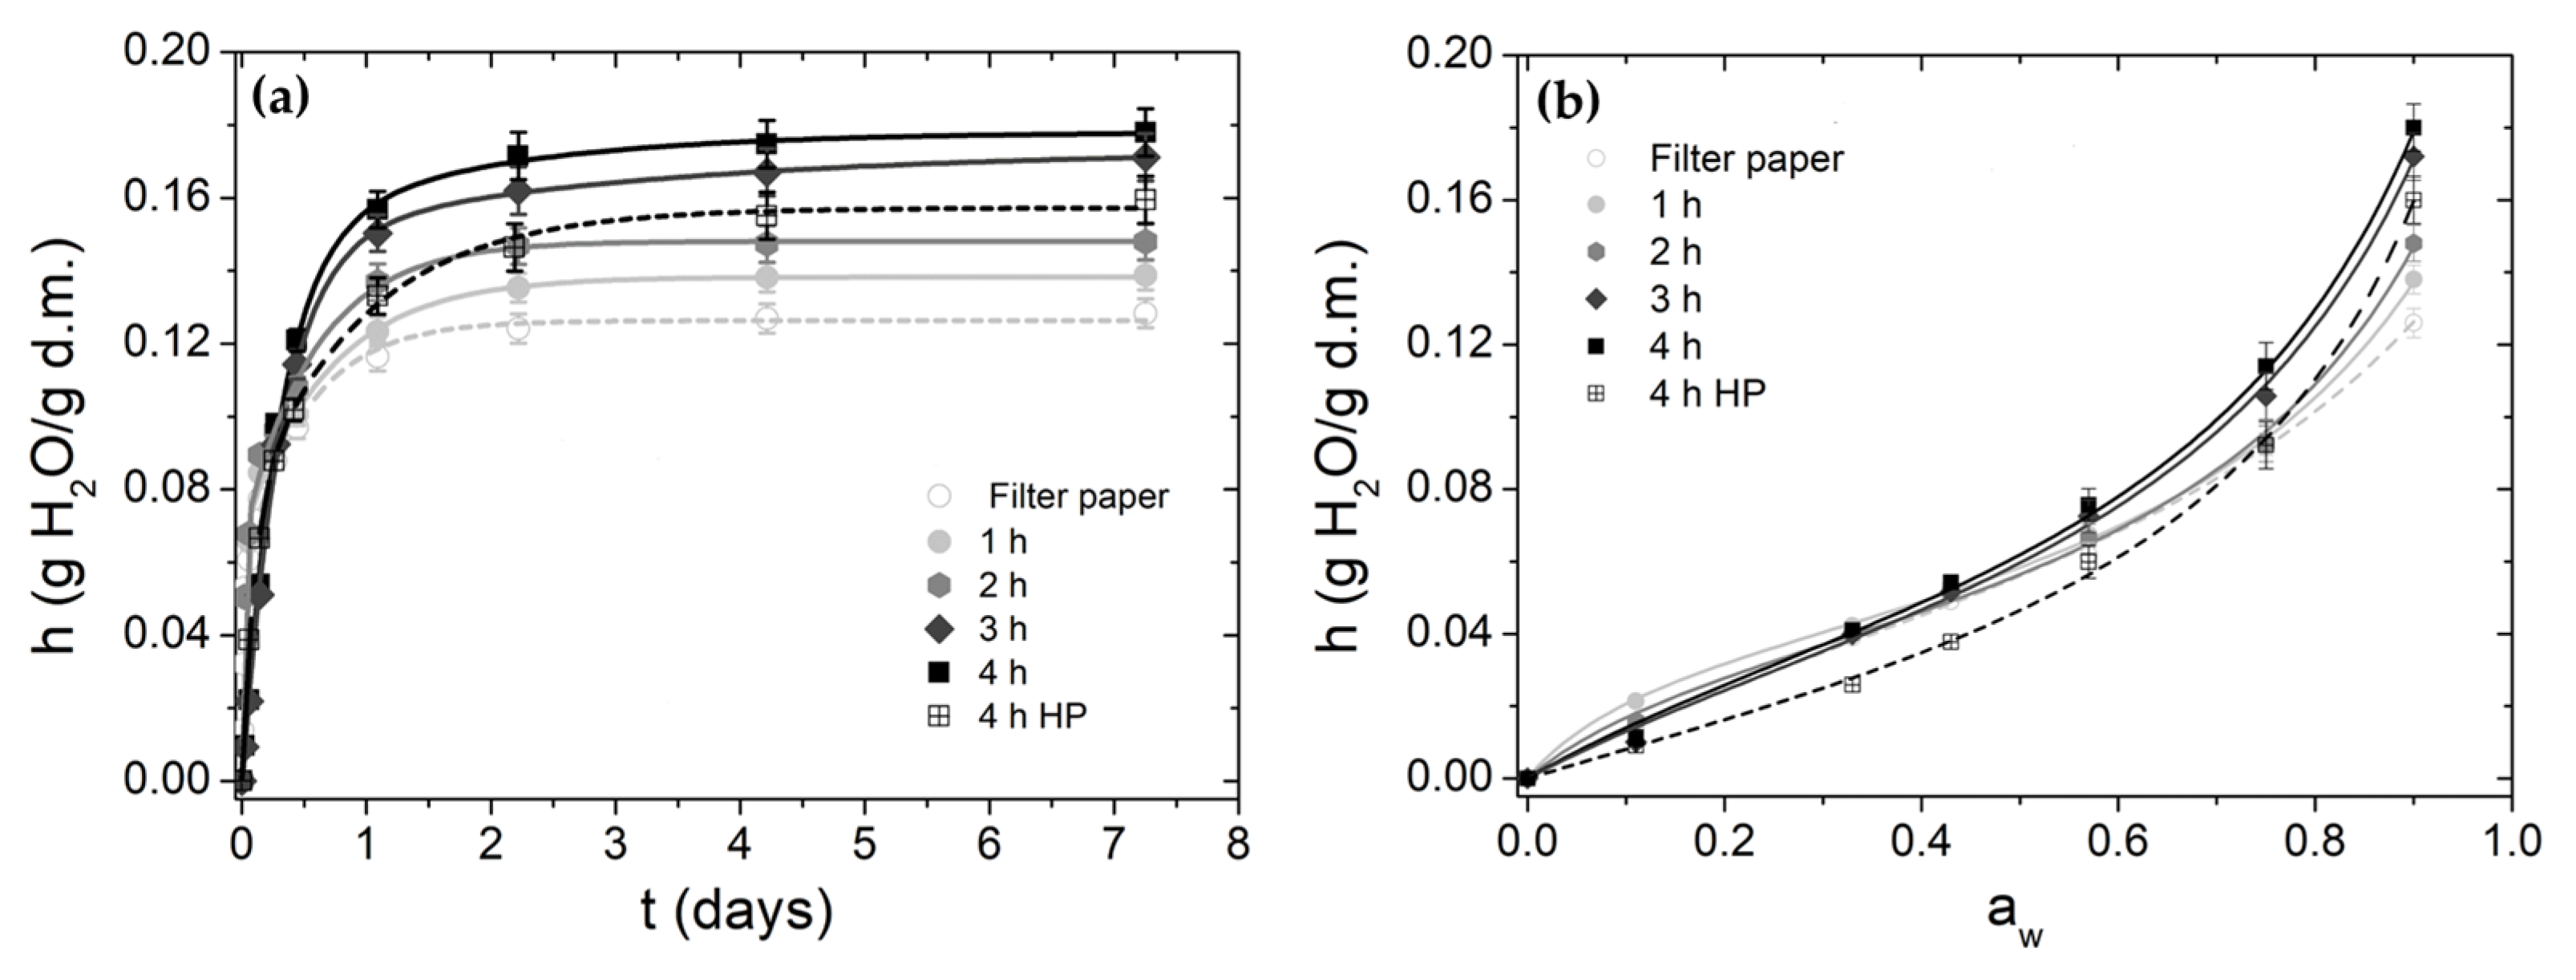
3.5. Water Vapor Sorption

The kinetics of water vapor sorption displayed in Figure 4a illustrate the effect of the NaOH/urea treatment time. Hydration increased with treatment time, with the most relevant changes observed after 3 h of treatment. The highest hydration was found in samples treated for 4 h, with a total hydration value exceeding that of filter paper by 50%.
Sorption kinetics were fitted with a bi-exponential model considering two hydration processes, one of them faster (process 1) and the other slower (process 2) (Table 3). The relevance of the faster process in the total hydration (h) increased with the treatment time, and therefore the growth in h was mainly due to the increase in Δh1. For the two processes, time constants τ 1 and τ 2 increased, and consequently the mean time τ of the total hydration was augmented with the treatment time. Regarding the 4 h hot pressed sample, the contributions of processes 1 and 2 were modified with respect to those of the 4 h sample and parameters τ 1 y τ 2 were reduced. The described differences in parameters related to kinetic experiments are probably due to the modification of the internal capillary and micropore network, resulting from hot pressing and/or varying the NaOH/urea treatment time. This could be due to the higher amount of amorphous cellulose and coverage of the pores, because of the formation of the matrix and the composite. Amorphous cellulose is completely permeable to water molecules, while crystalline cellulose is not; water molecules can only access the surface areas of the crystalline zones [46].
Water sorption isotherms displayed in Figure 4b reveal an important hydration in the monolayer. The value of the parameter N, related to the hydration in the monolayer, decreased in samples treated for 1 and 2 h; then, in those treated for 3 and 4 h, values increased until they reached the value measured for filter paper. On the other hand, the value of c was higher in samples treated for 1 h with respect to that of filter paper, and then in treatments applied for 2 h or longer time this value decreased. The opening of the filter paper structure induced by the treatment with NaOH/urea for 1 h might have favored the increase in the value of c, but the amount of regenerated cellulose produced in treatments applied for longer times might have contributed to increasing cellulose–cellulose interactions and decreasing the affinity of cellulose functional groups directly bound to water. The k parameters showed a minimal difference between the samples and their values (appreciably lower than 1) indicate the formation of a non-massive multilayer.
Regarding the isotherms of the 4 h HP sample, as compared with those of the other samples, some differences in their shape were observed, particularly for aw < 0.6 which corresponds to the hydration water directly bound to the polymeric matrix forming the monolayer. The convexity or concavity of isotherms in that region is linked to the value of parameter c of Equation (7), which is related to the force of the water binding to the monolayer. As parameter c increases, the isotherms at aw < 0.6 become more concave. Particularly, the isotherm of the 4 h HP sample presented the smallest value of c and exhibited more convexity in that region. Hot temperature and pressure drying produces an exhaustive dehydration that results in a greater number of direct interactions between the polar (hydrophilic) groups of the cellulose. Some of these interacting groups then become unavailable for hydration, reducing the number of primary hydration sites.

3.6. Mechanical Properties

As shown in the previous sections, among all studied samples, and irrespective of the drying treatment applied, samples treated with NaOH/urea for 4 h exhibited the lowest values of porosity and opacity and the highest conversion from cellulose I to cellulose II. Hence, these ACCs were those chosen to be mechanically characterized.
Table 4 summarizes the results obtained for the samples assayed in tension mode (FP, 4 h, 4 h HP). While the 4 h sample exhibited a lower value of stiffness and similar strength value than filter paper, the 4 h hot pressed sample presented significantly higher values of Young’s modulus and strength (Table 4). In fact, the stiffness and strength of the 4 h HP ACC were respectively 65% and 163% higher than those of the original filter paper. On the other hand, strain at break values were quite similar for all samples assayed.
In spite of the significant void coverage and the highest compactness of the 4 h sample, higher values of tensile properties with respect to those of the filter paper were not found. However, improvements in stiffness and strength upon hot pressing of the 4 h sample were attained, which may be attributed to the exhaustive dehydration resulting from the hot temperature and pressure, and the subsequent greater number of direct interactions between the polar groups of the cellulose.
The results herein obtained were generally in the same range of values reported in the literature for other ACCs prepared from filter paper treated with alkaline solvents [12,13]. Particularly, in comparison with the values obtained by Duchemin et al. using shorter treatment times [13], slightly higher Young’s modulus and quite similar tensile strength and strain at break values were observed (HP samples). Wei et al. reached Young’s modulus values of 4.8 GPa in ACCs made with cotton linters and processed at −10 °C with NaOH/urea solvent for 5 min [12]. However, it is worth noting that mechanical properties of ACCs developed with alkaline solvents are generally lower than those for composites prepared with DMAc/LiCl [47]. For example, in comparison with the results of Wei et al., Nishino and Arimoto obtained significantly higher values of stiffness and tensile strength using filter paper and DMAc/LiCl to prepare ACCs [14].

4. Conclusions

ACCs with promising properties were obtained by the dissolution of filter paper with 7 wt% NaOH/12 wt% urea and regeneration in distilled water. Results showed that the treatment time with the NaOH/urea solvent system played a determinant role in the resulting ACC characteristics, as evidenced from the morphology, porosity, crystalline structure, opacity, water vapor sorption and mechanical property analyses performed. In the ACCs obtained from the longest treatment time assayed (4 h), a substantial change from cellulose I to cellulose II was achieved, which was accompanied by the lowest porosity and opacity, and the highest values of total hydration. In addition, hot pressing of these samples was required to significantly improve their mechanical properties. Indeed, hot pressing of 4 h ACCs resulted in materials with stiffness and strength values 65% and 163% higher than those of the original filter paper.
The mechanical and optical properties of ACCs obtained by partial dissolution of filter paper using a relatively low-environmental impact solvent system such as NaOH/urea aqueous solution, suggest them as promising candidates for the development of sustainable biobased and biodegradable composite materials.

Author Contributions

Conceptualization, M.L.F., C.R.B. and J.F.D.; methodology, J.F.D.; formal analysis, A.G.S. and J.F.D.; investigation, A.G.S., S.A. and J.F.D.; writing—original draft preparation, M.L.F., C.R.B., A.G.S. and J.F.D.; writing—review and editing, M.L.F. and C.R.B.; visualization, A.G.S. and J.F.D.; funding acquisition, M.L.F. and C.R.B. All authors have read and agreed to the published version of the manuscript.

Funding

This research was funded by Agencia Nacional de Promoción de la Investigación, el Desarrollo Tecnológico y la Innovación (PICT 2016-0843 and PICT 2018-4217) and CONICET. J. F. Delgado holds a postdoctoral fellowship from CONICET (Res. 134/2020).

Institutional Review Board Statement

Not applicable.

Informed Consent Statement

Not applicable.

Data Availability Statement

The data presented in this study are available on request from the corresponding author.

Conflicts of Interest

The authors declare no conflict of interest.

References

  1. Mukhopadhyay, S.; Adak, B. Single-Polymer Composites; Chapman and Hall/CRC: Milton, UK, 2018; ISBN 9781351272230. [Google Scholar]
  2. Capiati, N.J.; Porter, R.S. The Concept of One Polymer Composites Modelled with High Density Polyethylene. J. Mater. Sci. 1975, 10, 1671–1677. [Google Scholar] [CrossRef]
  3. Matabola, K.P.; De Vries, A.R.; Moolman, F.S.; Luyt, A.S. Single Polymer Composites: A Review. J. Mater. Sci. 2009, 44, 6213–6222. [Google Scholar] [CrossRef]
  4. Heinze, T.; Koschella, A. Solvents Applied in the Field of Cellulose Chemistry: A Mini Review. Polímeros 2005, 15, 84–90. [Google Scholar] [CrossRef]
  5. Qi, H.; Yang, Q.; Zhang, L.; Liebert, T.; Heinze, T. The Dissolution of Cellulose in NaOH-Based Aqueous System by Two-Step Process. Cellulose 2011, 18, 237–245. [Google Scholar] [CrossRef]
  6. Xiong, B.; Zhao, P.; Hu, K.; Zhang, L.; Cheng, G. Dissolution of Cellulose in Aqueous NaOH/Urea Solution: Role of Urea. Cellulose 2014, 21, 1183–1192. [Google Scholar] [CrossRef]
  7. Budtova, T.; Navard, P. Cellulose in NaOH—Water Based Solvents: A Review. Cellulose 2017, 23, 6–7. [Google Scholar] [CrossRef] [Green Version]
  8. Jiang, Z.; Fang, Y.; Xiang, J.; Ma, Y.; Lu, A.; Kang, H.; Huang, Y.; Guo, H.; Liu, R.; Zhang, L. Intermolecular Interactions and 3D Structure in Cellulose-NaOH-Urea Aqueous System. J. Phys. Chem. B 2014, 118, 10250–10257. [Google Scholar] [CrossRef]
  9. Li, F.; You, X.; Li, Q.; Qin, D.; Wang, M.; Yuan, S.; Chen, X.; Bi, S. Homogeneous Deacetylation and Degradation of Chitin in NaOH/Urea Dissolution System. Int. J. Biol. Macromol. 2021, 189, 391–397. [Google Scholar] [CrossRef]
  10. Piltonen, P.; Hildebrandt, N.C.; Westerlind, B.; Valkama, J.P.; Tervahartiala, T.; Illikainen, M. Green and Efficient Method for Preparing All-Cellulose Composites with NaOH/Urea Solvent. Compos. Sci. Technol. 2016, 135, 153–158. [Google Scholar] [CrossRef]
  11. Labidi, K.; Korhonen, O.; Zrida, M.; Hamzaoui, A.H.; Budtova, T. All-Cellulose Composites from Alfa and Wood Fibers. Ind. Crops Prod. 2019, 127, 135–141. [Google Scholar] [CrossRef]
  12. Wei, Q.Y.; Lin, H.; Yang, B.; Li, L.; Zhang, L.Q.; Huang, H.D.; Zhong, G.J.; Xu, L.; Li, Z.M. Structure and Properties of All-Cellulose Composites Prepared by Controlling the Dissolution Temperature of a NaOH/Urea Solvent. Ind. Eng. Chem. Res. 2020, 59, 10428–10435. [Google Scholar] [CrossRef]
  13. Duchemin, B.; Le Corre, D.; Leray, N.; Dufresne, A.; Staiger, M.P. All-Cellulose Composites Based on Microfibrillated Cellulose and Filter Paper via a NaOH-Urea Solvent System. Cellulose 2016, 23, 593–609. [Google Scholar] [CrossRef]
  14. Nishino, T.; Arimoto, N. All-Cellulose Composite Prepared by Selective Dissolving of Fiber Surface. Biomacromolecules 2007, 8, 2712–2716. [Google Scholar] [CrossRef] [PubMed]
  15. ISO 5351:2010; Pulps—Determination of Limiting Viscosity Number in Cupri-Ethylenediamine (CED) Solution. ISO: Geneva, Switzerland, 2010.
  16. Kes, M.; Christensen, B.E. A Re-Investigation of the Mark-Houwink-Sakurada Parameters for Cellulose in Cuen: A Study Based on Size-Exclusion Chromatography Combined with Multi-Angle Light Scattering and Viscometry. J. Chromatogr. A 2013, 1281, 32–37. [Google Scholar] [CrossRef] [PubMed]
  17. Cottet, C.; Salvay, A.G.; Peltzer, M.A.; Fernández-García, M. Incorporation of Poly(Itaconic Acid) with Quaternized Thiazole Groups on Gelatin-Based Films for Antimicrobial-Active Food Packaging. Polymers 2021, 13, 200. [Google Scholar] [CrossRef]
  18. Alcalá, M.; González, I.; Boufi, S.; Vilaseca, F.; Mutjé, P. All-Cellulose Composites from Unbleached Hardwood Kraft Pulp Reinforced with Nanofibrillated Cellulose. Cellulose 2013, 20, 2909–2921. [Google Scholar] [CrossRef]
  19. Mwaikambo, L.Y.; Ansell, M.P. The Determination of Porosity and Cellulose Content of Plant Fibers by Density Methods. J. Mater. Sci. Lett. 2001, 20, 2095–2096. [Google Scholar] [CrossRef]
  20. Schneider, C.A.; Rasband, W.S.; Eliceiri, K.W. NIH Image to ImageJ: 25 Years of Image Analysis. Nat. Methods 2012, 9, 671–675. [Google Scholar] [CrossRef]
  21. Yam, K.L.; Papadakis, S.E. A Simple Digital Imaging Method for Measuring and Analyzing Color of Food Surfaces. J. Food Eng. 2004, 61, 137–142. [Google Scholar] [CrossRef]
  22. Riquelme, N.; Díaz-Calderón, P.; Enrione, J.; Matiacevich, S. Effect of Physical State of Gelatin-Plasticizer Based Films on to the Occurrence of Maillard Reactions. Food Chem. 2015, 175, 478–484. [Google Scholar] [CrossRef]
  23. Delgado, J.F.; Sceni, P.; Peltzer, M.A.; Salvay, A.G.; de la Osa, O.; Wagner, J.R. Development of Innovative Biodegradable Films Based on Biomass of Saccharomyces Cerevisiae. Innov. Food Sci. Emerg. Technol. 2016, 36, 83–91. [Google Scholar] [CrossRef]
  24. Roos, Y.H.; Drusch, S. Phase Transitions in Foods, 2nd ed.; Academic Press: Cambridge, MA, USA, 2015; 367p. [Google Scholar] [CrossRef]
  25. Spiess, W.E.L.; Wolf, W.R. Results of the COST 90 Project on Water Activity. Phys. Prop. Foods 1983, 2013, 65–91. [Google Scholar]
  26. Bedane, A.H.; Eić, M.; Farmahini-Farahani, M.; Xiao, H. Water Vapor Transport Properties of Regenerated Cellulose and Nanofibrillated Cellulose Films. J. Memb. Sci. 2015, 493, 46–57. [Google Scholar] [CrossRef]
  27. Stępień, A.; Witczak, M.; Witczak, T. Moisture Sorption Characteristics of Food Powders Containing Freeze Dried Avocado, Maltodextrin and Inulin. Int. J. Biol. Macromol. 2020, 149, 256–261. [Google Scholar] [CrossRef]
  28. ASTM D1708; Standard Test Method for Tensile Properties of Plastics by Use of Microtensile Specimens. ASTM International: West Conshohocken, PA, USA, 2018.
  29. Adak, B.; Mukhopadhyay, S. All-Cellulose Composite Laminates with Low Moisture and Water Sensitivity. Polymer 2018, 141, 79–85. [Google Scholar] [CrossRef]
  30. Khakalo, A.; Tanaka, A.; Korpela, A.; Hauru, L.K.J.; Orelma, H. All-Wood Composite Material by Partial Fiber Surface Dissolution with an Ionic Liquid. ACS Sustain. Chem. Eng. 2019, 7, 3195–3202. [Google Scholar] [CrossRef] [Green Version]
  31. Geng, H.; Yuan, Z.; Fan, Q.; Dai, X.; Zhao, Y.; Wang, Z.; Qin, M. Characterisation of Cellulose Films Regenerated from Acetone/Water Coagulants. Carbohydr. Polym. 2014, 102, 438–444. [Google Scholar] [CrossRef] [PubMed]
  32. Kabir, S.M.F.; Sikdar, P.P.; Haque, B.; Bhuiyan, M.A.R.; Ali, A.; Islam, M.N. Cellulose-Based Hydrogel Materials: Chemistry, Properties and Their Prospective Applications. Prog. Biomater. 2018, 7, 153–174. [Google Scholar] [CrossRef] [PubMed] [Green Version]
  33. French, A.D. Idealized Powder Diffraction Patterns for Cellulose Polymorphs. Cellulose 2014, 21, 885–896. [Google Scholar] [CrossRef]
  34. Nam, S.; French, A.D.; Condon, B.D.; Concha, M. Segal Crystallinity Index Revisited by the Simulation of X-Ray Diffraction Patterns of Cotton Cellulose Iβ and Cellulose II. Carbohydr. Polym. 2016, 135, 1–9. [Google Scholar] [CrossRef]
  35. Johnson Ford, E.N.; Mendon, S.K.; Thames, S.F.; Rawlins, J.W. X-ray Diffraction of Cotton Treated with Neutralized Vegetable Oil-Based Macromolecular Crosslinkers. J. Eng. Fiber. Fabr. 2010, 5, 10–20. [Google Scholar] [CrossRef] [Green Version]
  36. Cai, J.; Zhang, L. Rapid Dissolution of Cellulose in LiOH/Urea and NaOH/Urea Aqueous Solutions. Macromol. Biosci. 2005, 5, 539–548. [Google Scholar] [CrossRef]
  37. Huang, Z.; Liu, C.; Feng, X.; Wu, M.; Tang, Y.; Li, B. Effect of Regeneration Solvent on the Characteristics of Regenerated Cellulose from Lithium Bromide Trihydrate Molten Salt. Cellulose 2020, 27, 9243–9256. [Google Scholar] [CrossRef]
  38. Li, R.; Wang, S.; Lu, A.; Zhang, L. Dissolution of Cellulose from Different Sources in an NaOH/Urea Aqueous System at Low Temperature. Cellulose 2015, 22, 339–349. [Google Scholar] [CrossRef]
  39. Nomura, S.; Kugo, Y.; Erata, T. 13C NMR and XRD Studies on the Enhancement of Cellulose II Crystallinity with Low Concentration NaOH Post-Treatments. Cellulose 2020, 27, 3553–3563. [Google Scholar] [CrossRef]
  40. Rana, A.K.; Frollini, E.; Thakur, V.K. Cellulose Nanocrystals: Pretreatments, Preparation Strategies, and Surface Functionalization. Int. J. Biol. Macromol. 2021, 182, 1554–1581. [Google Scholar] [CrossRef] [PubMed]
  41. Goldberg, R.N.; Schliesser, J.; Mittal, A.; Decker, S.R.; Santos, A.F.L.O.M.; Freitas, V.L.S.; Urbas, A.; Lang, B.E.; Heiss, C.; Ribeiro Da Silva, M.D.M.C.; et al. A Thermodynamic Investigation of the Cellulose Allomorphs: Cellulose(Am), Cellulose Iβ(Cr), Cellulose II(Cr), and Cellulose III(Cr). J. Chem. Thermodyn. 2015, 81, 184–226. [Google Scholar] [CrossRef] [Green Version]
  42. Hu, W.; Chen, G.; Liu, Y.; Liu, Y.; Li, B.; Fang, Z. Transparent and Hazy All-Cellulose Composite Films with Superior Mechanical Properties. ACS Sustain. Chem. Eng. 2018, 6, 6974–6980. [Google Scholar] [CrossRef]
  43. Retegi, A.; Algar, I.; Martin, L.; Altuna, F.; Stefani, P.; Zuluaga, R.; Gañán, P.; Mondragon, I. Sustainable Optically Transparent Composites Based on Epoxidized Soy-Bean Oil (ESO) Matrix and High Contents of Bacterial Cellulose (BC). Cellulose 2012, 19, 103–109. [Google Scholar] [CrossRef]
  44. Chen, F.; Bouvard, J.L.; Sawada, D.; Pradille, C.; Hummel, M.; Sixta, H.; Budtova, T. Exploring Digital Image Correlation Technique for the Analysis of the Tensile Properties of All-Cellulose Composites. Cellulose 2021, 28, 4165–4178. [Google Scholar] [CrossRef]
  45. Pedreschi, F.; León, J.; Mery, D.; Moyano, P. Development of a Computer Vision System to Measure the Color of Potato Chips. Food Res. Int. 2006, 39, 1092–1098. [Google Scholar] [CrossRef]
  46. Mazeau, K. The Hygroscopic Power of Amorphous Cellulose: A Modeling Study. Carbohydr. Polym. 2015, 117, 585–591. [Google Scholar] [CrossRef] [PubMed]
  47. Delgado, J.F.; Bovi, J.; Foresti, M.L.; Bernal, C. All-Cellulose Composites Derived from Natural Plant Fibers. In Sustainable Natural Fiber Composites; Khan, A., Manikandan, A., Ramesh, M., Khan, I., Asiri, A.M.A., Eds.; Materials Research Forum LLC: Millersville, PA, USA, 2022. [Google Scholar]
Figure 1. SEM micrographs of filter paper (FP) and ACCs samples treated with 7 wt% NaOH/12 wt% urea for 1, 2, 3, 4 h and 4 h hot pressed (HP).
Polysaccharides 04 00005 g001
Figure 2. Water holding capacity of filter paper (FP) and samples treated with 7 wt% NaOH/12 wt% urea for 1, 2, 3 and 4 h.
Polysaccharides 04 00005 g002
Figure 3. XRD diffractograms of filter paper (FP) and ACC samples treated with 7 wt% NaOH/12 wt% urea for 1, 2, 3, 4 h and 4 h HP (hot pressed). Miller indices are according to French [32].
Polysaccharides 04 00005 g003
Figure 4. (a) Kinetics of water sorption at 90% r.h. (b) Water sorption isotherms. Kinetics were fitted with biexponential model (Equation (6)) and sorption isotherms were fitted with the GAB (Equation (7)) model.
Polysaccharides 04 00005 g004
Table 1. Effect of treatment time on samples’ porosity and corresponding size reduction.
SamplePorosity (%)Size Reduction (%)
FP65 ± 1---
1 h63 ± 47 ± 5
2 h46 ± 553 ± 10
3 h28 ± 174 ± 6
4 h3 ± 679 ± 4
4 h HP4 ± 379 ± 5
Table 2. Effect of treatment time on samples’ opacity.
SampleOpacity
(Photographs) *
Opacity (Colorimeter)
FP0.94 ± 0.010.95 ± 0.01
1 h0.95 ± 0.010.96 ± 0.01
2 h0.94 ± 0.030.94 ± 0.03
3 h0.78 ± 0.070.86 ± 0.08
4 h0.71 ± 0.040.82 ± 0.04
4 h HP0.76 ± 0.060.74 ± 0.03
* This lower-cost device allows analysis of the entire surface of the sample which could be particularly relevant in samples of irregular and/or non-flat surfaces [45] such as certain ACCs.
Table 3. Hydration kinetics and GAB parameters fitted for the water sorption kinetics curves and water sorption isotherms of Figure 4a,b. The reported values of the statistical parameter R2 indicate the goodness of fitting.
SampleHydration Kinetics ParametersWater Sorption Isotherms Parameters
h (g/g)τ1 (days)Δh1/hτ2 (days)Δh2/hτ (days)R2N (g/g)ckR2
FP0.126 ± 0.0070.010 ± 0.0020.44 ± 0.030.50 ± 0.050.56 ± 0.040.28 ± 0.020.9960.052 ± 0.0064.1 ± 0.80.70 ± 0.030.998
1 h0.138 ± 0.0070.018 ± 0.0030.49 ± 0.030.68 ± 0.080.51 ± 0.030.36 ± 0.040.9960.040 ± 0.00210.3 ± 1.20.80 ± 0.010.999
2 h0.148 ± 0.0070.019 ± 0.0030.51 ± 0.030.75 ± 0.070.49 ± 0.030.38 ± 0.040.9960.040 ± 0.0037.0 ± 1.30.82 ± 0.020.997
3 h0.175 ± 0.0130.31 ± 0.030.83 ± 0.051.87 ± 0.310.17 ± 0.020.57 ± 0.070.9980.048 ± 0.0063.8 ± 1.00.82 ± 0.020.997
4 h0.180 ± 0.0140.33 ± 0.050.85 ± 0.062.03 ± 0.200.15 ± 0.020.59 ± 0.070.9980.049 ± 0.0053.8 ± 1.20.83 ± 0.020.997
4 h HP0.162 ± 0.0120.10 ± 0.010.47 ± 0.040.93 ± 0.080.53 ± 0.0040.54 ± 0.080.9980.043 ± 0.0052.2 ± 0.60.85 ± 0.020.998
Table 4. Tensile parameters values for filter paper and samples treated for 4 h.
SampleYoung’s Modulus (GPa)Tensile Strength (MPa)Strain at Break (mm/mm)
FP1.30 ± 0.13 a17.8 ± 2.1 a0.07 ± 0.01 a
4 h0.53 ± 0.07 b14.5 ± 2.7 a0.09 ± 0.04 a
4 h HP2.14 ± 0.33 c46.9 ± 5.4 b0.06 ± 0.02 a
Different letters in the same group indicate a statistically significant difference (p < 0.05).
Disclaimer/Publisher’s Note: The statements, opinions and data contained in all publications are solely those of the individual author(s) and contributor(s) and not of MDPI and/or the editor(s). MDPI and/or the editor(s) disclaim responsibility for any injury to people or property resulting from any ideas, methods, instructions or products referred to in the content.

