Article

Utilisation of Pectins Extracted from Orange Peels by Non Conventional Methods in the Formation of Edible Films in the Presence of Herbal Infusions

Department of Food Science and Human Nutrition, Agricultural University of Athens, 75 Iera Odosi, 11855 Athens, Greece
*
Author to whom correspondence should be addressed.
Polysaccharides 2022, 3(3), 574-588; https://doi.org/10.3390/polysaccharides3030034
Submission received: 23 May 2022 / Revised: 21 July 2022 / Accepted: 10 August 2022 / Published: 14 August 2022

Abstract

:
Edible films of three high methoxy pectins (DE: 70–75%) in the presence of dittany and anise infusions were studied. Apart from a commercial one, two more pectins, selected by their yield and DE from preliminary experiments on pectin extraction from orange peels using ultrasound- and microwave-assisted extraction or a combination of both, were used. Extracted pectins were darker, less surface active and had lower [η] and absolute zeta values. All three pectin solutions were Newtonian. Furthermore, all films had statistically the same thickness (~40 μm) and moisture content (~25.2%). For the same herbal infusion, all pectins resulted in films with the same density (~1.01 and ~1.19 g/cm3 for dittany and anise films, respectively). Values of 2–4.65 N and 76.62–191.80 kPa, for maximum force and modulus, respectively, were reported. The commercial pectin film with anise was the stronger, whereas that with dittany, the stiffer. Total phenolics content (TPC) and antioxidant activity (SA) were also measured for films and film-forming solutions (FFS). TPC values ranged from 0.035 to 0.157 mg GAE/0.5 mL and SA from ~62 to 91%. Films had greater TPC but lower SA than their FFS. The presence of both pectin and herbal infusions were significant for our observations.

1. Introduction

Pectin is a complex anionic heteropolysaccharide. Its main feature is a linear homogalacturonan backbone (HG) consisting of about 200 to 1000 (1 → 4)-linked α-D-galacturonic acid units (GalA), interrupted by rhamnogalacturonate regions [1]. Side chains of neutral sugars, particularly D-galactose, L-arabinose and D-xylose, are also present [2]. Some of the acid units are esterified with methanol [3]. The percentage of esterified galacturonate residues is called “degree of esterification” (DE). According to their DE, pectins can be classified as high methoxy (HM) for DE > 50% and low methoxy (LM) for DE < 50% [4].
Pectin is a natural structuring polysaccharide extracted from edible plant material, mainly citrus peels and apple pomace. Both of these sources are by-products of the juice industry, have a high content of pectic substances (apple pomace contains 10–15% pectin, on a dry-weight basis, whereas citrus peel contains 20–30%) and they are available from concentrated geographical areas [5].
Commercially, pectin is extracted by acidified hot water. Apart from the wastewater causing environmental problems, the acidic extraction is connected to low yields and lower pectin quality as its long duration can lead to thermal degradation by beta-elimination of the HG backbone and debranching [6]. As a result, new techniques should be used as efficient ecofriendlier extraction technologies, such as, for example, ultrasound-assisted extraction (UAE) and microwave-assisted extraction (MAE). Despite their environmentally friendly character, their energy and water consumption, the resulting cost as well as their difficulty in scalability limit their application [7].
UAE is a nonthermal method where ultrasonic waves with a frequency of 20–100 KHz pass through the liquid medium resulting in a process known as “cavitation”, i.e., the creation, growth and collapse of bubbles. For phytochemical materials, cavitation bubbles are formed near the surface of the tissue. As a result, cell walls are broken down and the solvent entrance in the cell is increased, leading to a greater extraction efficiency [8,9,10]. MAE, on the other hand, is a thermal method in which a small amount of polar solvent absorbs microwave energy generating heat inside the plant tissue. The extraction efficiency is increased as heat results in greater temperatures and thus, a greater diffusion rate [11,12]. As the temperature distribution within the solvent is homogeneous, the extracted pectin has a uniform quality [13]. A combination of both ultrasound- and microwave-assisted extraction (UMAE) utilises both the high energy produced by the microwave apparatus as well as the cavitation generated by the ultrasound device. It can result in greater extraction yields and a better pectin quality.
Pectins are commonly used as gelling, thickening and emulsifying agents. Moreover, health-related activities of pectins are also reported. Its use as dietary fibre is an example of the latter [14,15]. Other applications include their use in the formation of environmentally friendly, low-cost, biodegradable edible films as alternatives to plastic packaging [16]. These films can impart further protection when they are fortified with natural antioxidants, i.e., substances coming from fruits, vegetables, grains and herbs, used to prevent the destructive oxidant activity of free radicals [17]. Thus, the formation of edible pectin films in the presence of extracts rich in natural antioxidants are becoming popular as they can impart preserving effects and can affect their physicochemical and mechanical properties.
The vast majority of literature has reported findings for films with plants’ essential oils. To the best of our knowledge, reports on pectin–herbal infusion films are scarce. In the present study, films with pectin dissolved in infusions of dittany (D) or anise (A) were prepared. Several properties of the films were then studied, i.e., thickness, moisture content, colour, mechanical strength, turbidity and density. Their total phenolics content and antioxidant activity were also measured and compared to those of the film-forming solutions (FFS). As the extraction conditions are affecting the pectin’s properties, films were prepared with three high-methoxy pectins (DE: 70–75%), one commercial and two more extracted using non conventional methods.
The selection of the latter was based on preliminary experiments where pectins were extracted from orange peels’ albedos using UAE, MAE or UMAE. The extraction yield and the DE were the criteria for our selection. Prior to film formation, the three pectins were studied in terms of their intrinsic viscosity, molecular weight, z-potential, surface tension and emulsifying ability.

2. Materials and Methods

2.1. Materials and Chemicals

Orange peels were provided by a local market. Their albedos were removed and finely cut with a sharp knife and then dried in an oven at 50 °C until constant weight. The dried albedos were pulverised and screened by a sieve to obtain particles smaller than 1 mm. The powder was stored in air-tight containers and kept in a dark and dry environment prior to use.
Sunflower oil (SANOLA, Kore, Koropi, Greece) was purchased from a local supermarket. Dittany and anise were obtained from Evripos Herbs and Spices P.C., respectively (Athens, Greece). A commercial high-methoxy pectin (70−75% esterification; 76282), was obtained from Sigma-Aldrich (Steinheim, Germany). Sodium chloride (NaCl) was from Panreac Quimica S.A. (Barcelona, Spain), glycerol from Merck (Darmstadt, Germany), whereas all the remaining reagents were from Sigma-Aldrich (Steinheim, Germany). Distilled water was used throughout.

2.2. Pectin Extraction

Pectin was extracted from the albedos powder produced in Section 2.1 by MAE, UAE and UMAE. MAE was performed using a household microwave oven (KOG-3767, edition II, Daewoo Electronics Co., Ltd., Seoul, Korea) operating at 2450 MHz. The albedos powder was added to acidified distilled water adjusted to pH 1.5 (by 0.1 N HCl), with a solid-to-liquid ratio (SLR) ranging from1:15 to 1:30 (w/v). The solution was then subjected to irradiation of 620, 750 or 850 W for 3 or 6 min. Ultrasound waves were applied by an ultrasonic homogeniser (SONOPULS HD 3200, Bandelin Electronic GmbH & Co. KG, Berlin, Germany) with a probe system operated at 20 kHz. The albedos powder was added to acidified distilled water adjusted to pH 1.5 (by 0.1 N HCl) with an SLR of 1:20 (w/v). The ultrasonic emitter was immersed 15 mm into the solution. The duty cycle of the ultrasound pulse was set at 50% (2 s on, 2 s off). Sonication was conducted at 50 or 100 W for 15 or 30 min. For UMAE, the samples were ultrasonicated at 50 W for 30 min and then subjected to microwave irradiation of 850 W for 3 min, as described earlier.
Following centrifugation (8000 rpm, 15 min), the supernatants were collected, mixed with ethanol (1:1 v/v) and allowed to stand for 24 h at room temperature. Pectin was collected via filtration and dried at 40 °C in an oven until constant weight. The yield of each procedure was calculated as follows [18]:
%   Yield = Weight   of   dried   pectin   g Weight   of   dried   albedos   powder   g × 100  
The dried pectin was grounded and stored in air-tight containers in a dark and dry environment prior to analysis. The extraction conditions, yield and degree of esterification (DE) of the derived pectins are presented in Table 1.

2.3. Determination of Pectin Characteristics

Based on the yield and DE of the extracted pectins (Table 1), two of them were selected for further studying. A commercial HM pectin was also studied as a control. They were named A, B and C, respectively.

2.3.1. Pectin Solution Preparation

For the performed experiments, solutions of pectins A–C of various concentrations (i.e., 0.1, 0.5 and 1.0 wt.%) were prepared by dissolving the appropriate amount of pectin in distilled water at 90 °C under gentle agitation. For the intrinsic viscosity measurements, a 1% wt stock solution of each of the A–C pectins was prepared by dissolving pectin in 0.10 M NaCl solution at 90 °C under gentle agitation. The stock solution was diluted with a 0.10 M NaCl solution for preparing pectin solutions with lower concentrations (0.7–0.125 wt. %) and the same ionic strength.

2.3.2. Degree of Esterification

The degree of esterification (DE, %) of the pectins was determined by the titrimetric method proposed by Hosseini et al. [18]. Briefly, 100 mg of dried pectin was hydrated in 2 mL of ethanol and then solubilised in 20 mL of distilled water (free of CO2) at 40 °C. The solution was titrated with 0.1 M NaOH (V1) in the presence of phenolphthalein as an indicator. Pectin was saponified by the addition of 10 mL of 0.5 M NaOH under vigorous stirring. Following standing for 20 min, 10 mL of 0.5 M HCl was added to the solution which was then stirred until the pink colour disappeared. Finally, phenolphthalein was added, and the solution was titrated with 0.5 M NaOH (V2). The DE was calculated as follows:
DE = V 2 V 1 + V 2 * 100
The values reported here are the mean of three measurements.

2.3.3. Intrinsic Viscosity

Solutions of pectins A–C were characterised with intrinsic viscosity measurements ([η], dL/g) on the basis of the Huggins and Kraemer derivations using the method of Jiang et al. [19] with some modifications. Viscosity measurements were made on an Ubbelohde capillary viscometer with a constant (K) equal to 0.3062 cSt/s, at 25 °C. For each pectin concentration (1–0.125 wt. % ), the flow time through the viscometer was measured three times, and its average value was used for the calculations. Intrinsic viscosity [η] was determined experimentally by the extrapolation of Huggins (ηsp/c versus c) and Kraemer (ln (ηrel)/c versus c) plots to “zero” concentration (c = 0) where both plots converged to [η].
Relative viscosity (ηrel) and specific viscosity (ηsp) were calculated using the equations:
η rel = η η s  
η sp = η rel 1  
η and ηs are the absolute viscosity of the solutions and the solvent, respectively. The absolute viscosity was calculated as follows:
absolute   viscosity = t × K × ρ  
t is the mean flow time (s) of each sample and ρ its density (g/mL).

2.3.4. Molecular Weight
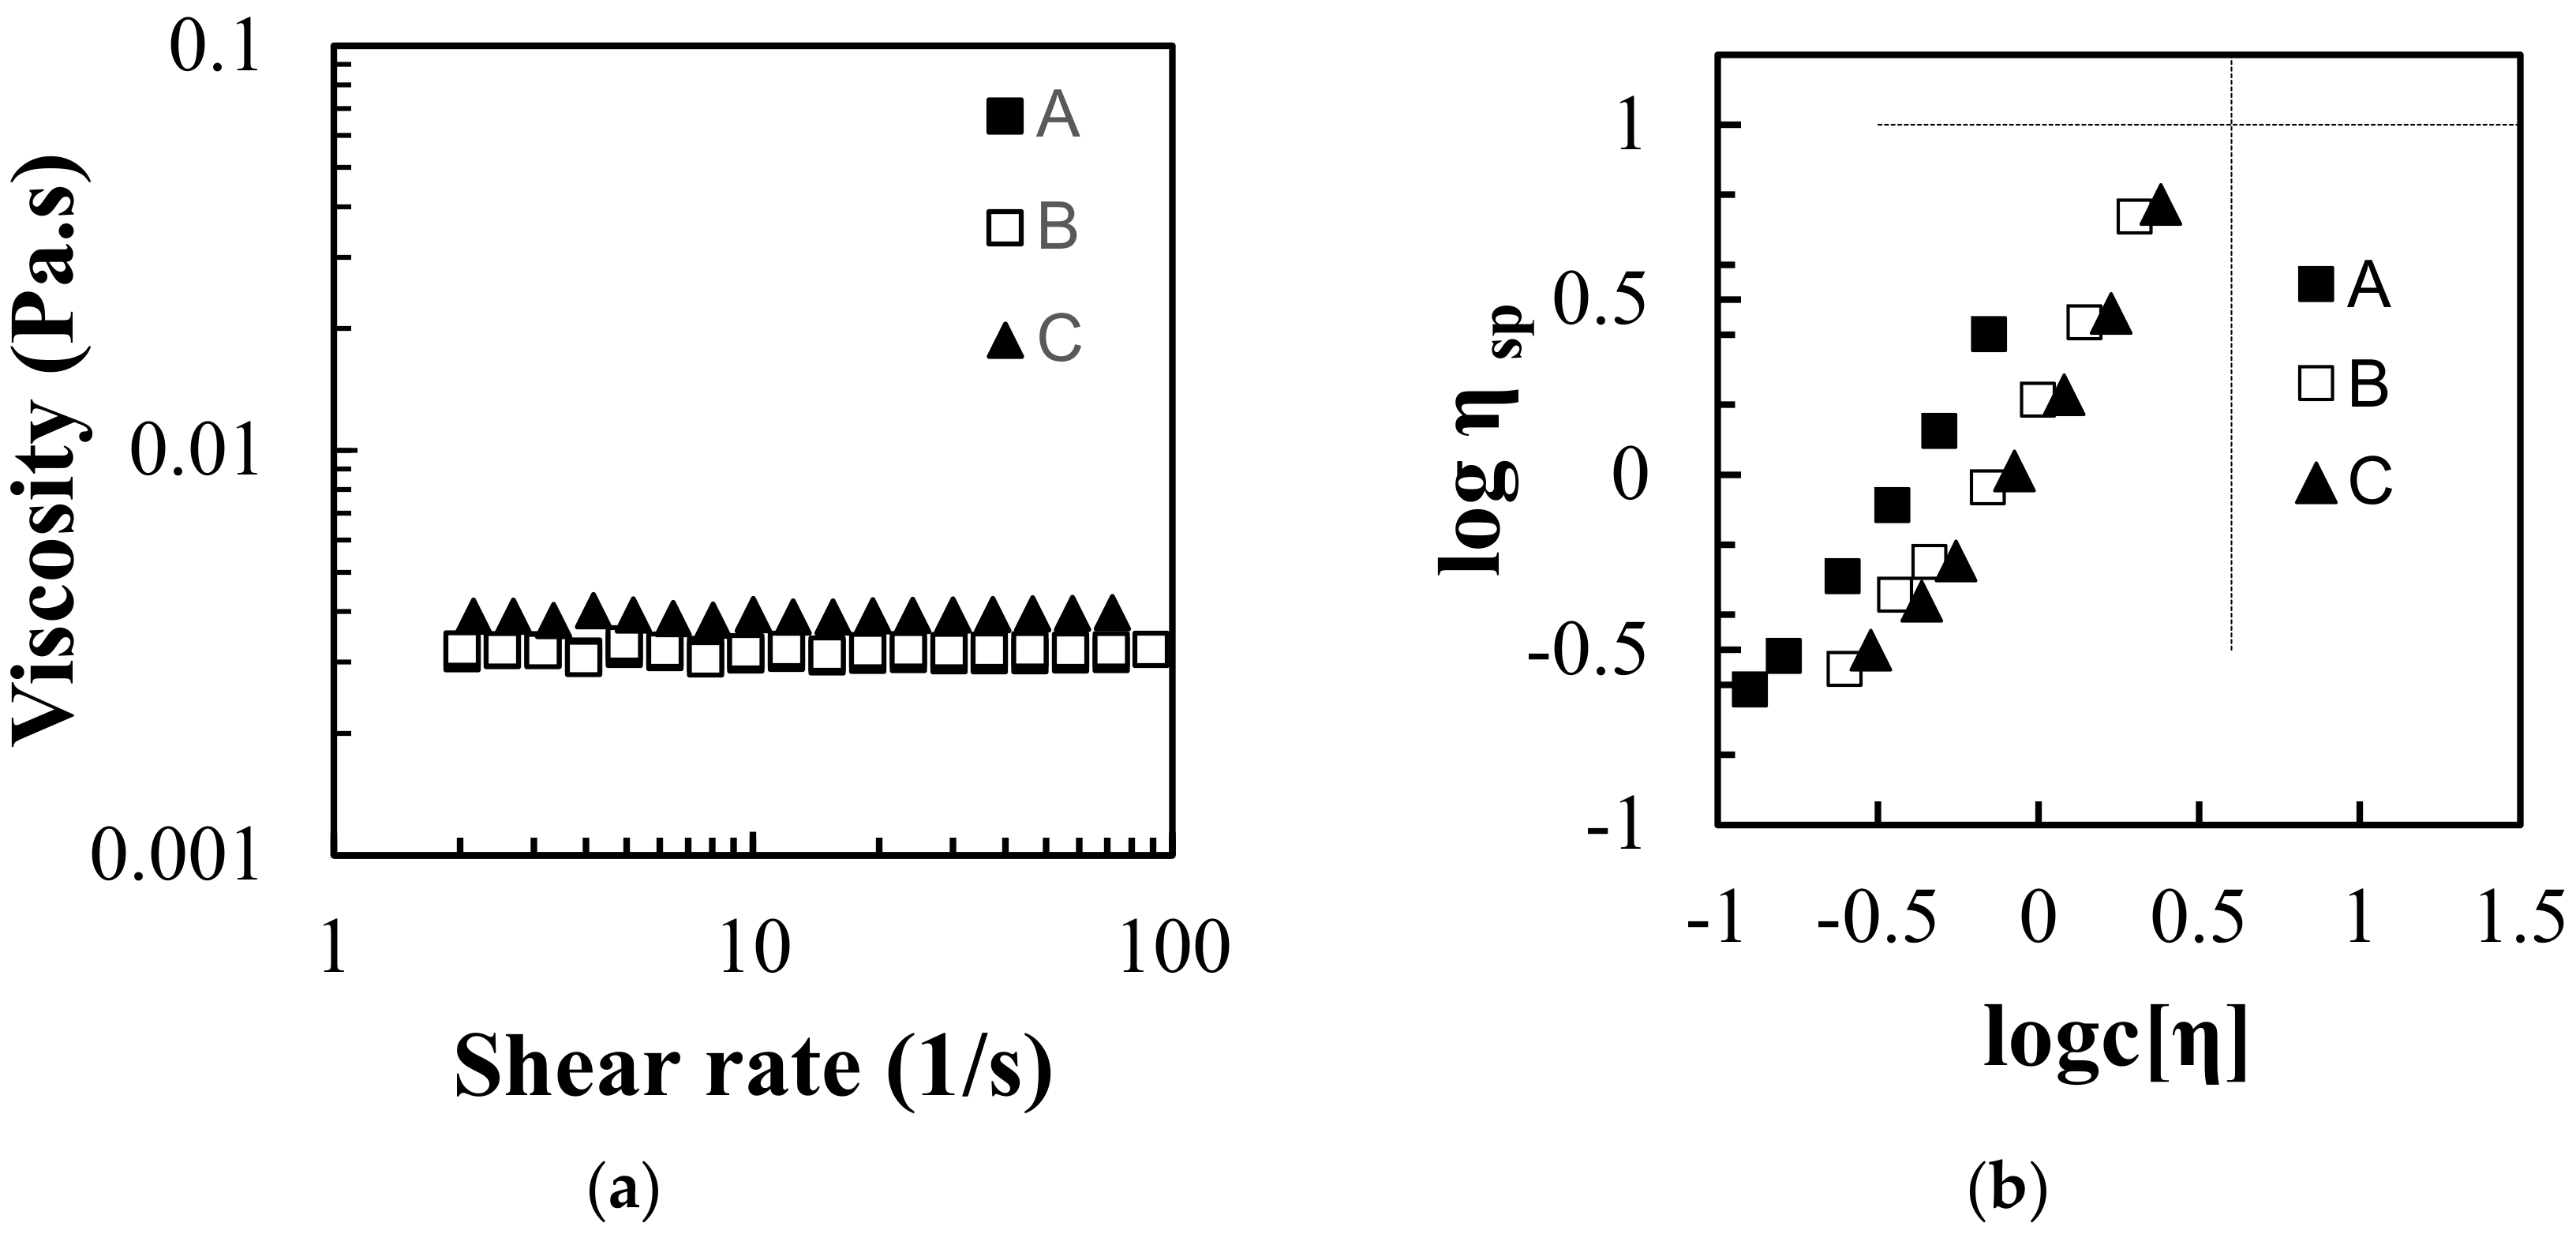
The Mark–Houwink–Sakurada equation was used to estimate the molecular weight (M, kg/mol) of the pectins [20]:
[ η ] = K × M a  
Constants K and α for the pectin solution in 0.1 M NaCl at pH 7 were assumed to be to 4.36 × 10⁻³ L/g and 0.78, respectively [21].

2.3.5. Flow Curves

Steady flow curves of 0.5 wt. % pectin solutions were obtained at 25 °C with a Discovery HR3 hybrid rheometer (TA Instruments, New Castle, DE, USA) equipped with a concentric cylinder geometry (30 mm cup diameter, 28 mm bob diameter) at shear rates from 1 to 100 (1/s).

2.3.6. Zeta Potential

The zeta potential of 0.1 wt. % solutions of pectins A–C was measured in triplicate, at 25 °C, with a Zetasizer Nano ZS90 instrument (Malvern Instruments Ltd., Worcestershire, UK).

2.3.7. Surface Tension

Surface tension measurements were performed on 1.0 wt. % solutions of pectins A–C with the Du Nouy ring method using a KSV Sigma 701 tensiometer (KSV Instruments Ltd., Helsinki, Finland). Measurements were performed three times and mean values were considered.

2.3.8. Emulsion Stability

Oil-in-water (O/W) emulsions with an oil-to-water ratio of 40:60 were prepared by adding sunflower oil to solutions of pectins A–C (0.5 wt. %). Mixing was performed at ambient temperature by means of a high-energy dispersing unit (CAT X 120, M. Zipperer GmbH, Germany) at 18,000 rpm for 2 min. The stability of the prepared emulsions was estimated by storage assessment [21]. The phase separation of the emulsions is possible over time and, as a result, a transparent layer at the bottom and an opaque layer at the top can be observed. Each emulsion was sealed tightly and stored at 4 °C for 7 days. The initial height of the emulsions before storage (H0) and the heights of the remaining emulsified layer volumes after storage for 7 days (Hstorage) were recorded. The emulsion stability (ES, %) was calculated using the following equation:
ES   % = H storage H 0 × 100  

2.3.9. Colour

The colour parameters [L*] ([L*] = 100 stands for white; [L*] = 0 stands for black), [α*] (+ [α*] values correspond to redness; − [α*] correspond to greenness) and [b*] (+ [b*] values correspond to yellow; − [b*] correspond to blue) of the CIELAB system were measured using a spectrocolorimeter (LC 100, Lovibond, Dortmund, Germany). Measurements were conducted on the pectin powder at room temperature. Each measurement was repeated three times.

2.4. Films Based on Herbal Infusions and Pectin

2.4.1. Film Formation

Herbal infusions of dittany (Origanum dictamnus) or anise (Pimpinella anisum) were prepared by steeping 1 g of each herb in 100 g of boiling water for 10 min, under gentle agitation. The infusions were then filtered and brought to the correct weight by addition of water.
Film-forming solutions (FFS) were prepared by dissolving 0.5 g pectin (A, B or C) in 100 g of each herbal infusion at 90 °C under magnetic stirring. Then, glycerol (0.15 wt. %) was added, as a plasticiser. Following complete dissolution and cooling to room temperature, the mixture was brought to the correct total weight by addition of water. Then, 30 g of each FFS was poured onto sterile glass Petri dishes (diameter 9 cm) and dried in a hot-air oven (Memmert, Schwabach, Germany) at 50 °C for 20 h. The dried films were peeled off and kept in a desiccator with silica gel until analysis. Three Petri dishes were studied per formulation.

2.4.2. Film Characterisation

Thickness

The thickness was measured with a micrometer (Holex, Munich, Germany) with accuracy of 0.01 mm. Three films per formulation were measured. For each film, the thickness at five random positions on its surface was noted [22].

Density and Moisture Content

Films were cut into squares with an area (A) of 4 cm2 and weighed (m1). Then, they were dried in a hot-air oven (Memmert, Schwabach, Germany) at 105 °C for 18 h and weighed again (m2). The film density was calculated as the ratio between the film’s weight and volume (V); x is the film’s thickness [23]:
Film   Density = m 1 V = m 1 x × A  
Moisture content was calculated according to the following equation [22]:
Moisture   Content   % = m 1 m 2 m 1 × 100    
Three films per formulation were measured.

Colour

The colour parameters of the CIELAB system were measured as described in Section 2.3.9. Measurements were carried out at five random positions of each film. Three films per formulation were measured [22].

Opacity

The opacity was determined using a double-beam UV–vis spectrophotometer (UV1800, Shimadzu Europa GmbH, Duisburg, Germany) by the method described by Drakos et al. [22]. Briefly, a 1 cm × 4 cm film strip was placed in a spectrophotometer cell and the spectrum (400–800 nm) of transmittance (%) was recorded, using an empty cell as reference. Opacity was related to the area below the spectrum curve, as the greater the area, the lower the opacity. Three films per formulation were measured.

Mechanical Properties

The maximum force and elastic modulus were measured using an Instron Universal machine (Instron 1011, Norwood, Massachusetts, USA) equipped with a 50 N load cell and a cylindrical probe (3 mm diameter). The probe had a constant speed of 1 mm/s while it moved perpendicular to the film’s surface. Measurements were conducted at the fifth day of storage at nine random points of each film. Three films per formulation were measured [22].

Total Phenolics Content and Antioxidant Activity

Initially, 0.125 g of each film was extracted by 15 mL of distilled water. Extraction took place at room temperature and lasted 24 h. Total phenolics content (TPC) was determined by the colorimetric Folin–Ciocalteu method, as described by Drakos et al. [22]. Briefly, 0.5 mL of each film extract was mixed with 2.25 mL of distilled water and 0.25 mL of the Folin–Ciocalteu reagent. Following stirring for 1 min using a vortex mixer, the mixture was left for 8 min in darkness. Then, 2 mL of Na2CO3 (7.5% w/v) was added to the mixture which was stirred again with a vortex mixer and kept in darkness for 60 min. Absorbance was measured in a double-beam UV–vis spectrophotometer (UV1800, Shimadzu Europa GmbH, Duisburg, Germany) at 765 nm against a blank solution. The determination of total phenolics content was achieved by comparison to a calibration curve constructed by gallic acid. The results were expressed as milligrams of gallic acid equivalents (GAE) per 0.5 mL of the extract. Measurements were carried out in triplicate.
The antioxidant activity was evaluated by determining the DPPH radical scavenging ability (SA) of the films by the method of Drakos et al. [24] with slight modifications. Briefly, the extracts (0.5 mL) were mixed with 1.5 mL of distilled water and 2 mL of 0.1 mM DPPH in 80% aqueous ethanol solution. The resulting solutions and a blank solution (containing 2 mL of water and 2 mL of DPPH solution) were kept at room temperature for 30 min and then absorbance was measured at 517 nm using a double-beam UV–vis spectrophotometer (UV1800, Shimadzu Europa GmbH, Duisburg, Germany). The percentage scavenging activity of DPPH (SA) was calculated as follows:
SA   % = ( A blanck A extract ) A blank × 100  
Total phenolics content (TPC) and antioxidant activity (SA) were measured for both FFS and films.

2.5. Statistical Analysis

Data were analysed with the one way and multifactor ANOVA method. The level of confidence was 95%. Significant differences between means were identified by the least significant difference (LSD) procedure with the statistical software package Statistica v.8.0 for Windows.

3. Results and Discussion

3.1. Pectin Recovery and Characterisation

3.1.1. Pectin Extraction, Yield and DE of the Extracted Pectins

Pectins were extracted from orange peels albedos using microwave-assisted extraction (MAE), ultrasound-assisted extraction (UAE) or a combination of both (UMAE) under varying experimental conditions. Overall, 14 different procedures were performed, and their extraction conditions and yield are presented in Table 1 along with the DE of the extracted pectins. Regarding the yield, for MAE it varied from 10.33 to 19.30%, for UAE from 9.67 to 19.30% and UMAE from 11.60 to 18.47%. DE varied from 50.63 to 74.91% for MAE, 66.3 to 73.40% for UAE and 45.30 to 72.41% for UMAE.
Table 1. Extraction conditions, yield (%) and degree of esterification (DE, %) for pectins extracted using ultrasound-assisted extraction (UAE), microwave-assisted extraction (MAE) or a combination of both ultrasound- and microwave-assisted extraction (UMAE).
SampleMethodpHPower
(W)
SLRDuration (min)Yield
(%)
DE
(%)
1MAE1.56201:15310.3363.29
2MAE1.56201:20313.0050.63
3MAE1.56201:25319.3074.10
4MAE1.56201:30319.3056.00
5MAE1.56201:20610.3360.81
6MAE1.57501:20314.6753.06
7MAE1.58501:20316.5074.91
8UAE1.5501:20159.6773.40
9UAE1.5501:203016.0067.80
10UAE1.51001:201517.6066.30
11UAE1.51001:203019.3067.30
12UMAE1.550/6201:2030/311.6045.30
13UMAE1.550/7501:2030/315.6047.54
14UMAE1.550/8501:2030/318.4772.41
For MAE, the effect of the microwave power, solid-to-liquid ratio (SLR) and time on the yield and DE was investigated. When samples at the same SLR and pH conditions (1:20 w/v and 1.5, respectively) were irradiated for 3 min at either 620, 750 or 850 W, the increase in microwave power resulted in increased yield. Greater yield values were also observed when the SLR increased from 1:15 to 1:30 (620 W, 3 min) (10–19.30%). The opposite was observed when the extraction time increased from 3 to 6 min (620 W, SLR 1:20 w/v).
The positive correlation between microwave power and yield has already been reported for various plant food wastes or by-products [25]. A greater microwave power softens the plant tissue and thus, facilitates the pectin transfer to the extract [26]. Moreover, a greater power is related to increased dipole rotations, and thus, heat is generated inside the reaction mixture leading to bond breaking and a better extraction [27]. The SLR is another key factor for the extraction of pectin. According to various works, up to a certain ratio the yield increases and then decreases. In high ratios, great amounts of solvents absorb more energy and consequently, the microwave adsorption of solid material is decreased. That decreases the pectin mass transfer rate and as a result, the pectin extraction yield is reduced [28,29]. Furthermore, pectin recovery by alcohol precipitation is complicated due to dilution effects [26]. Thus, there is an optimum ratio for greater yields. In our case, an increase in yield is seen when the SLR was increased from 1:15 to 1:25, with the latter leading to the same yield as that of an SLR of 1:30. Another parameter is the extraction time. Time saving is MAE’s greatest advantage. Nevertheless, extraction time has to be selected carefully in order for a significant extraction to occur. For short extraction times, components that link between pectin (e.g., cellulose, hemicelluloses) might not be adequately removed. On the other hand, a longer time allows for more heat to be created [30]. However, there are studies reporting lower pectin yields for longer extraction times (e.g., [31]). A possible reason for this observation could be the formation of a pectic acid by-product instead of pectin [32]. In the present study, 6 min seem to be too long for the extraction process. Regarding the DE, it increased with microwave power and extraction time, as expected from the literature [12]. However, a clear trend could not be detected for the extractions with varying SLRs. DE values were greater than 50% and thus all pectins were classified as high-methoxy pectins (HMP).
The effect of various parameters of UAE were also studied. The extraction was performed at 50 and 100 W and lasted 15 or 30 min. The SLR and pH were fixed for all experiments, i.e., 1:20 w/v and 1.5, respectively. The doubling of treatment time for both powers led to an increased yield. The same was observed when the power was doubled. This is due to the greater energy provided to the reaction by the larger active bubbles during cavitation at higher power [33]. A greater energy is also provided by longer treatments. All pectins from UAE were HMP (DE > 50%). The effect of ultrasound power and time on DE was not clear. According to the literature, an intense ultrasound treatment leads to a DE reduction as the ester functional group is more susceptible to sonochemical effects [6]. This was found in the present study for pectins extracted at 50 W for 15 and 30 min (73 and 67%, respectively), and those extracted for 15 min at 50 and 100 W (73.4 and 66.3%, respectively).
For the UMAE extraction all parameters were fixed, apart from the microwave power. As it increased from 620 to 750 and 850 W, both yield and DE increased. Thus, the positive effect of microwave power is reported again. The DE of the extracted pectins for UMAE at 620 and 750 W was 45.3 and 47.5%, respectively. Only the extraction at 850 W led to HMP (DE: 72.4%). Regarding the DE, the literature has reported that pectin extracted from pomelo peel using UMAE had a lower DE (59.8%) compared to UAE (64.4%) and MAE (64.1%) [30]. For the yield, the literature has reported that a combination of extraction techniques leads to higher values, though that was not reported in the present work [34].
Based on our findings of Table 1, two pectins were selected in terms of yield and DE (nos. 3 and 14). The first pectin was extracted using MAE (620 W, 1:25 w/v, 3 min) and the second using UMAE (50/850 W, 1:20 w/v, 30/3 min). From now on, these pectins will be named pectins A and B, respectively. Pectins A and B along with a commercial pectin (named pectin C) were studied further in terms of some physicochemical characteristics and used for the formation of edible films by dissolving them in dittany and anise herbal infusions. The DE of all pectins (A–C) was in the range of 70–75%.

3.1.2. Physicochemical Properties of Pectins A–C

Initially, the colour of the pectin powders was evaluated and the values of [L*], [α*] and [b*] for the three pectins are presented in Table 2. A first observation is that pectins A and B showed statistically the same value for all colour parameters, i.e., [L*] ~43, [α*] ~11.5 and [b*] ~3.5. In comparison with the commercial pectin C, they were darker ([L*] for C was 57). Moreover, they had greater [α*] and lower [b*] values. It is obvious that the extraction treatment played a significant role in pectin’s colour.
The next property measured was intrinsic viscosity [η], which characterises the polymer’s degree of space occupancy [35]. Our measurements yielded [η] values of 0.7, 2.0 and 2.4 dL/g, for pectins A, B and C, respectively (Table 2). Thus, the commercial pectin C molecule, in isolation, occupied a greater volume than the molecules of the extracted orange pectins. As expected, the same stood for their molecular weight, which ranged from 13.7–69.9 kg/mol (Table 2). The lower molecular weight of pectins A and B was expected as both MAE and UAE are known to lead to pectins with a lower molecular weight and intrinsic viscosity [36,37].
Viscosity is another basic property of pectins, and it is affected by DE, charge and molecular weight [38]. The flow curves of 0.5 wt. % solutions of all pectins were constructed and presented in Figure 1a. Viscosity values were small, and all solutions presented Newtonian behaviour. The pectin C solution was the more viscous one, whereas viscosity values for the remaining solutions were similar. The higher molecular weight of the commercial pectin can explain that observation.
The concentration (c) of a solution greatly affects its behaviour, as its increase leads to molecules overlapping and interpenetrating one another; eventually resulting in an entangled network [39]. The extent of overlap between the polymer molecules is described by the dimensionless “coil-overlap” parameter c[η]. Critical concentration c* is the concentration at which a dilute solution’s behaviour transforms into that of the semidilute region and it is indicated by a change in slope of ηsp vs. c[η]. These plots for most of the disordered linear polysaccharides fall into two linear regions with a sharp change in slope from ~1.4 to 3.3 at ηsp ~10 and c[η] ~4 [40]. Figure 1b presents the corresponding plots for pectins A–C. It is clear that for all pectins, the studied concentrations (0.125–1 wt. %) were in the dilute region. The slope in the first linear region was 1.33 (r2 = 0.9937), 1.40 (r2 = 0.9891) and 1.41 (r2 = 0.9865) for pectins A, B and C, respectively. As the concentration of 0.5 wt. % was within the studied concentration range, the Newtonian behaviour of the corresponding flow curves was expected.
Zeta potential describes the magnitude of the charge present on a colloidal particle and it is an index of its stability [41]. According to Table 2, all three pectins exhibited negative zeta potential values, which is expected as pectin is an anionic polysaccharide [42]. Pectin C had the highest absolute value (30.2 mV), followed by B (19.4 mV) and A (17.3 mV). Thus, C had a higher stability in aqueous dispersion followed by B and A. The zeta potential for pectins is related to the presence of carboxyl groups and thus, their negative charges. As such, its absolute value is expected to increase with a decreasing DE. In our case, all pectins had similar DEs. Their different zeta potential values can be attributed to their different molecular weight and chain length, which relates to the number of carboxyl groups [38]. Furthermore, for greater molecular weights and longer chains, the carboxyl groups might be more exposed and distributed throughout the chain, leading to a more negative zeta potential [43].
The surface tension was also measured and all pectins presented values (53.3–53.8 mN/m) lower than that of water. Pectin C was more surface active than A, whereas B shared statistically the same surface tension with both A and C. The surface activity of pectin is due to its hydrophobicity and thus the presence of certain hydrophobic moieties such as proteins, acetyl groups, ferulic acids, etc. [44]. Moreover, its surface tension is affected by the pectin’s molecular weight and DE. In the present study, where all pectins shared similar DEs, the surface tension increased with the decreasing molecular weight. This can be attributed to the easier dispersion and diffusion towards the interface of the smaller pectin molecules [45].
Emulsion stability was then evaluated (Table 2) and its values ranged from 41.4 to 51.3%. A greater emulsion stability was observed, as expected by the surface tension values, for pectin C. Accordingly, pectins A and B presented statistically the same stability. Regarding the emulsion formation and stability, although pectins are usually acting as stabilisers, their contribution as emulsifiers has also been reported in the literature (e.g., [46]). Their emulsifying ability is affected by various factors such as their DE, structure, branching, protein content, molecular weight, concentration, ionic strength and pH [47]. A high protein content, extensive branching and increased DE lead to an enhanced emulsifying ability [48]. The ionic strength and the pH affect the interactions between the pectin chains and thus, their conformation [47]. For the molecular weight, literature reported that pectins with very low or very high molecular weight did not perform well as emulsifiers as the molecule was too short or too long to be effective (e.g., [49]). In the present study, all pectins had similar DEs but differed in their molecular weight, which seems to be the critical factor. However, in order to fully clarify the observed behaviour, the correlation between structure and emulsifying ability should also be investigated by performing experiments for structure determination.

3.2. Films Based on Herbal Infusions and Pectin

Following their characterisation, the selected pectins A and B along with the commercial pectin C were used for the formation of films with infusions of dittany (D) or anise (A). The presence of phenolics in the herb infusions is positively affecting the total antioxidant activity of a pectin-based packaging, thus improving the nutritional properties of a food product in case the film is consumed. Moreover, they can have antimicrobial activity [46]. The films formed in the present step were studied and several physicochemical properties were measured. Table 3 presents the values for the thickness, density, moisture content, colour, opacity, maximum force and modulus of the produced films.

3.2.1. Thickness, Density and Moisture Content of the Films

All films had statistically the same thickness (~40 μm) and moisture content (~25.2%) (Table 3). As water binding is mainly affected by the density and the regularity of packing of the polysaccharide chains [47], the facilitation of water removal to a similar degree for all film formulations incorporating small pectin molecules can be explained. That can also explain the lower values of moisture content in the present study compared to those from the literature (e.g., [48]).
For the same herbal infusion, all pectins resulted in films with the same density, i.e., ~1.01 and ~1.19 g/cm3 for dittany and anise films, respectively. Within the same pectin, only the films with pectin A had statistically different densities for the two herbal infusions (0.95 g/cm3 and 1.27 g/cm3 for DA and AA, respectively). A higher density relates to more compact structures, which in turn result from pectin–phenolics interactions becoming stronger leading to tighter binding [49]. Thus, the concentration of phenolics present is significant [50,51]. In our case, the role of the phenolics in the density was evident as the two infusions led to a film with the same density regardless of the pectin used.

3.2.2. Colour and Opacity of the Films

Colour was evaluated next. The brightness ([L*]) ranged from 75.7 to 84.8, with the AC film being the brighter. For dittany films, DC shared statistically the same brightness with both DB and DA. AA and AB anise films had statistically the same [L*] (~79), which was lower than that of AC. The [α*] and [b*] values ranged from 0.16 to 5.05 and 9.27 to 31.50, respectively. For the same pectin, anise films had lower values than dittany films, with AC having the lowest values of all films. Bearing in mind our observation on pectin powder colour, the incorporation of herbal infusions and the dilution they impart seems to be the dominant factor for colour. As expected by their [b*] values, in good agreement with what has been reported in the literature (e.g., [50,52]), the films were quite yellowish.
Regarding opacity, the films with pectins A and C had statistically the same opacity regardless of the herbal infusion (~26500 and ~28190, for pectins A and C, respectively). DB was the more opaque film of all. Biopolymer films with added phenolics are reported to be more opaque than the films with just the biopolymers. Apart from having two phases with different refractive indexes, the embedment of the phenolics in the intermolecular spaces of the film-forming matrix can lead to a reduced light transmittance [51,53]. However, in the present study, the pectin component was critical for opacity probably due to its structural and physicochemical features affecting the film-forming matrix.

3.2.3. Mechanical Properties of the Films

The mechanical properties of the films were evaluated next. The maximum force and modulus, which are related to the film’s strength and stiffness, respectively, were determined and presented in Table 3. The pectin A–dittany film had handling problems and it could not be tested. The remaining films showed values of 2–4.65 N and 76.62–191.80 kPa, for maximum force and modulus, respectively. AC was the stronger film whereas DC was the stiffer one. DB was stronger and stiffer than AB. AA was not as strong and stiff as the remaining films.
Generally, the mechanical behaviour of a film depends on the type and concentration of added compounds [54] and it is affected by the film-forming network. Phenolic compounds are reported to have a positive effect on the mechanical properties of pectin-based edible films (e.g., [49,51]). This effect was attributed to a strong hydrogen bond interaction between the hydroxyl and carboxyl groups of pectin molecules and phenolic hydroxyl group [51]. However, the chain–chain associations between the pectin molecules can also contribute to the observed mechanical properties. In the present study, the commercial pectin, once again, behaved differently than the extracted pectins, suggesting differences in structure.

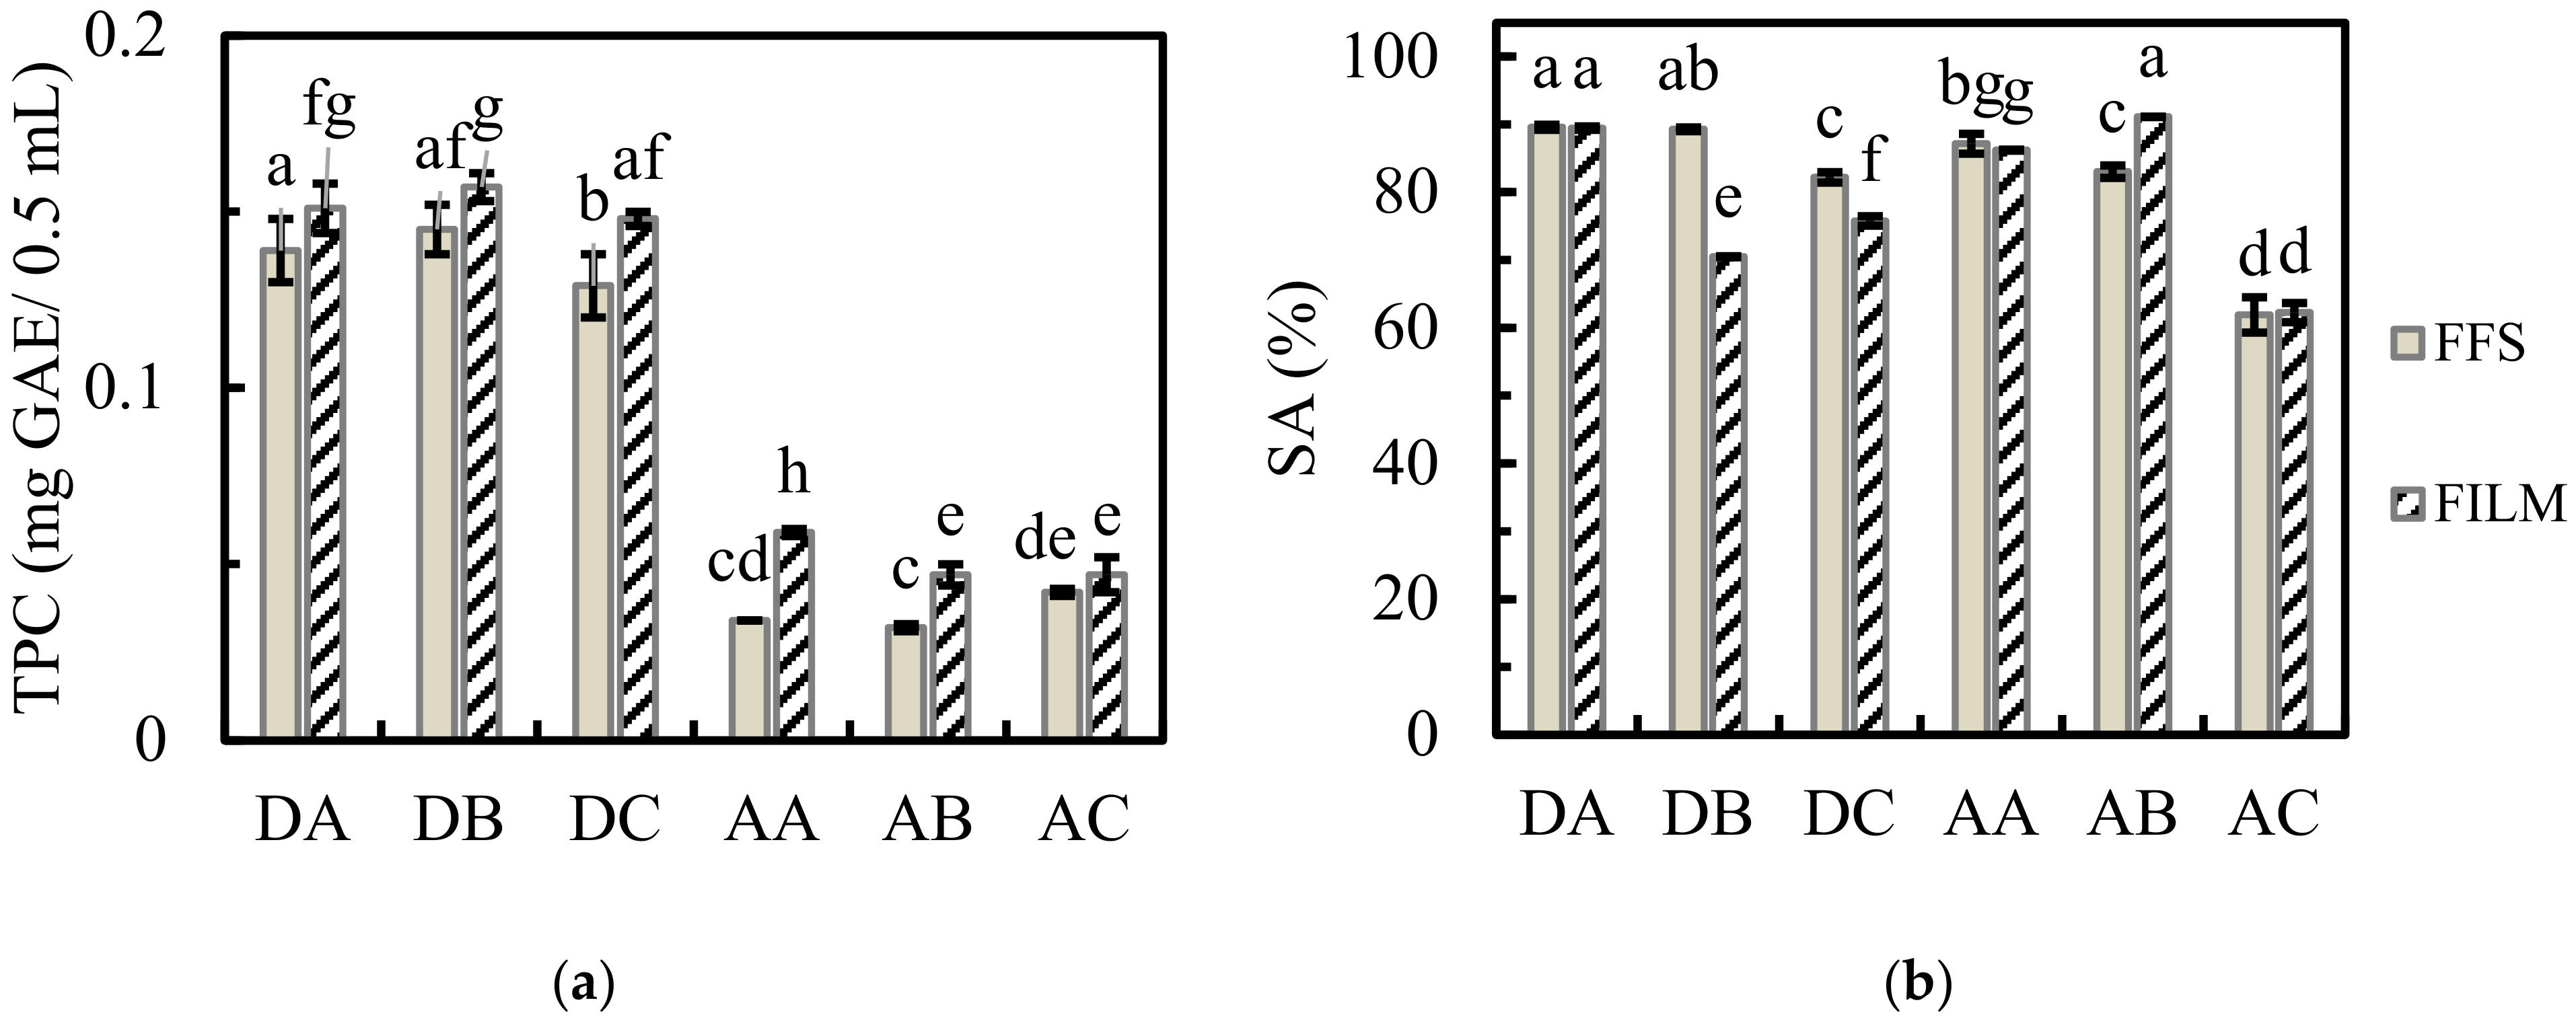
3.2.4. Total Phenolics Content (TPC) and Antioxidant Activity (SA) of FFS and Films

The total phenolics content (TPC) and antioxidant activity (SA) of both FFS and films were measured and presented in Figure 2. The TPC varied from 0.035 to 0.157 mg GAE/0.5 mL (Figure 2a). For all samples, the films had a greater TPC than the corresponding FFS. Moreover, for both FFS and films, the presence of anise led to a lower TPC for all pectins. All FFS with anise had statistically the same TPC, i.e., 0.036 mg GAE/0.5 mL. The corresponding films had a value of 0.047 mg GAE/0.5 mL for pectins B and C and 0.059 mg GAE/0.5 mL for A. For dittany, DC had the lower TPC among the FFS, whereas the DA film shared statistically the same TPC with the remaining films.
In regard to antioxidant activity (SA), values of ~62–91% were reported (Figure 2b). With the exception of pectin A, FFS with anise had lower SA values than those with dittany. Pectin A had statistically the same SA for both herbal infusions (~88%). Pectin C had the lower SA among the FFS for both infusions (82.20 and 61.93% for dittany and anise films, respectively). The corresponding values for pectin B were 89.58 and 83.05%. In the case of films, AA and AC had lower SA values than DA and DC, respectively, whereas B was the opposite. Overall, with the exception of AB, films had a lower SA than their FFS.
The antioxidant activity of phenolic compounds by suppressing the action of free radicals is well documented and also reported in the present work. The source of the phenolics compounds affected the measurements, as anise FFS and films had a lower TPC than those with dittany. As polyphenols are widely distributed among herbs, the TPC and SA are expected to differ among them [55]. Moreover, due to the possible pectin–phenolics interactions, the properties of the used pectins, e.g., the groups present in their molecule and the various chemical reactions that can participate, were significant. This can explain the low SA of the samples with the commercial pectin C. Furthermore, our study did not report an expected linear positive relationship between TPC and SA. A possible explanation is the different antioxidant activity of individual phenolic compounds depending on the donor-proton capacity [56]. Furthermore, the drying of FFS for film formation had a positive effect on the TPC, suggesting that the applied conditions were not harsh for the compounds.

4. Conclusions

The present work studied (a) the extraction of pectin from orange peels albedos using green technologies and (b) the subsequent exploitation of the extracted pectins in an edible film formation in the presence of dittany and anise infusions. For comparison reasons, a commercial pectin was also studied. According to our findings, the extracted pectins led to films that, for most of the properties, did not differ significantly from those with the commercial pectin. Furthermore, all films had a significant antioxidant activity (>60%). Overall, the extracted pectins are good candidates for the formation of pectin-based edible packaging material with improved antioxidant and nutritional properties.

Author Contributions

Conceptualisation, V.E.; methodology, M.Z. and V.E.; software, M.Z. and V.E.; validation, A.C. and M.Z.; formal analysis, M.Z. and V.E.; investigation, A.C. and M.Z.; resources, V.E.; data curation, M.Z. and V.E.; writing—original draft preparation, V.E.; writing—review and editing, V.E.; visualization, V.E.; supervision, V.E.; project administration, M.Z.; funding acquisition, V.E. All authors have read and agreed to the published version of the manuscript.

Funding

This research received no external funding.

Institutional Review Board Statement

Not applicable.

Informed Consent Statement

Not applicable.

Data Availability Statement

Not applicable.

Acknowledgments

The authors would like to thank Pr. I. Mandala (Agricultural University of Athens, Greece) for generous access to her laboratory instruments.

Conflicts of Interest

The authors declare no conflict of interest.

References

  1. Yoo, S.-H.; Fishman, M.L.; Hotchkiss, A.T.; Lee, H.G. Viscometric behavior of high-methoxy and low-methoxy pectin solutions. Food Hydrocoll. 2006, 20, 62–67. [Google Scholar] [CrossRef]
  2. do Nascimento Oliveira, A.; de Almeida Paula, D.; Basílio de Oliveira, E.; Henriques Saraiva, S.; Stringheta, P.C.; Mota Ramos, A. Optimization of pectin extraction from Ubá mango peel through surface response methodology. Int. J. Biol. Macromol. 2018, 113, 395–402. [Google Scholar] [CrossRef]
  3. Petkowicz, C.L.O.; Vriesmann, L.C.; Williams, P.A. Pectins from food waste: Extraction, characterization and properties of watermelon rind pectin. Food Hydrocoll. 2017, 65, 57–67. [Google Scholar] [CrossRef]
  4. Gharibzahedi, S.M.T.; Smith, B.; Guo, Y. Pectin extraction from common fig skin by different methods: The physicochemical, rheological, functional, and structural evaluations. Int. J. Biol. Macromol. 2019, 136, 275–283. [Google Scholar] [CrossRef]
  5. Chen, T.-T.; Zhang, Z.-H.; Wang, Z.-W.; Chen, Z.-L.; Ma, H.; Yan, J.-K. Effects of ultrasound modification at different frequency modes on physicochemical, structural, functional, and biological properties of citrus pectin. Food Hydrocoll. 2021, 113, 106484. [Google Scholar] [CrossRef]
  6. Mao, G.; Wu, D.; Wei, C.; Tao, W.; Ye, X.; Linhardt, R.J.; Orfila, C.; Chen, S. Reconsidering conventional and innovative methods for pectin extraction from fruit and vegetable waste: Targeting rhamnogalacturonan I. Trends Food Sci. Technol. 2019, 94, 65–78. [Google Scholar] [CrossRef]
  7. Zeeb, B.; Roth, M.; Endreß, H.-U. Commercial Pectins. In Handbook of Hydrocolloids, 3rd ed.; Phillips, G.O., Williams, P.A., Eds.; Elsevier Ltd.: Oxford, UK, 2021; pp. 295–315. [Google Scholar] [CrossRef]
  8. Wang, W.; Ma, X.; Xu, Y.; Cao, Y.; Jiang, Z.; Ding, T.; Ye, X.; Liu, D. Ultrasound-assisted heating extraction of pectin from grapefruit peel: Optimization and comparison with the conventional method. Food Chem. 2015, 178, 106–114. [Google Scholar] [CrossRef]
  9. Wang, W.; Chen, W.; Zou, M.; Lv, R.; Wang, D.; Hou, F.; Feng, H.; Ma, X.; Zhong, J.; Ding, T.; et al. Applications of power ultrasound in oriented modification and degradation of pectin: A review. J. Food Eng. 2018, 234, 98–107. [Google Scholar] [CrossRef]
  10. Cravotto, G.; Cintas, P. Power ultrasound in organic synthesis: Moving cavitational chemistry from academia to innovative and large-scale applications. Chem. Soc. Rev. 2006, 35, 180–196. [Google Scholar] [CrossRef]
  11. Fishman, M.L.; Chau, H.K.; Hoagland, P.D.; Hotchkiss, A.T. Microwave-assisted extraction of lime pectin. Food Hydrocoll. 2006, 20, 1170–1177. [Google Scholar] [CrossRef]
  12. Picot-Allain, M.C.N.; Ramasawmy, B.; Emmambux, M.N. Extraction, Characterisation, and Application of Pectin from Tropical and Sub-Tropical Fruits: A Review. Food Rev. Int. 2022, 38, 282–312. [Google Scholar] [CrossRef]
  13. Bagherian, H.; Zokaee Ashtiani, F.; Fouladitajar, A.; Mohtashamy, M. Comparisons between conventional, microwave- and ultrasound-assisted methods for extraction of pectin from grapefruit. Chem. Eng. Process. 2011, 50, 1237–1243. [Google Scholar] [CrossRef]
  14. Belkheiri, A.; Forouhar, A.; Ursu, A.V.; Dubessay, P.; Pierre, G.; Delattre, C.; Djelveh, G.; Abdelkafi, S.; Hamdami, N.; Michaud, P. Extraction, Characterization, and Applications of Pectins from Plant By-Products. Appl. Sci. 2021, 11, 6596. [Google Scholar] [CrossRef]
  15. Thibault, J.-F.; Ralet, M.-C. Pectins, their Origin, Structure and Functions. In Advanced Dietary Fibre Technology; McCleary, B.V., Prosky, L., Eds.; Blackwell Science Ltd: Oxford, UK, 2001; pp. 367–378. [Google Scholar] [CrossRef]
  16. Espitia, P.J.P.; Du, W.-X.; de Jesús Avena-Bustillos, R.; de Fátima Ferreira Soares, N.; McHugh, T.H. Edible films from pectin: Physical-mechanical and antimicrobial properties—A review. Food Hydrocoll. 2014, 35, 287–296. [Google Scholar] [CrossRef]
  17. Blasa, M.; Gennari, L.; Angelino, D.; Ninfali, P. Fruit and Vegetable Antioxidants in Health. In Bioactive Foods in Promoting Health, Fruits and vegetables; Watson, R.R., Preedy, V.R., Eds.; Elsevier: San Diego, CA, USA, 2010; pp. 37–58. [Google Scholar] [CrossRef]
  18. Hosseini, S.S.; Khodaiyan, F.; Yarmand, M.S. Optimization of microwave assisted extraction of pectin from sour orange peel and its physicochemical properties. Carbohydr. Polym. 2016, 140, 59–65. [Google Scholar] [CrossRef]
  19. Jiang, W.; Qi, J.-R.; Huang, Y.; Zhang, Y.; Yang, X.-Q. Emulsifying properties of high methoxyl pectins in binary systems of water-ethanol. Carbohydr. Polym. 2020, 229, 115420. [Google Scholar] [CrossRef]
  20. Arslan, N. Extraction of pectin from sugar-beet pulp and intrinsic viscosity–molecular weight relationship of pectin solutions. J. Food Sci. Technol. 1995, 32, 381–385. [Google Scholar]
  21. Garnier, C.; Axelos, M.A.V.; Thibault, J.-F. Phase diagrams of pectin-calcium systems: Influence of pH, ionic strength, and temperature on the gelation of pectins with different degrees of methylation. Carbohydr. Res. 1993, 240, 219–232. [Google Scholar] [CrossRef]
  22. Drakos, A.; Pelava, E.; Evageliou, V. Properties of flour films as affected by the flour’s source and particle size. Food Res. Int. 2018, 107, 551–558. [Google Scholar] [CrossRef]
  23. Sartori, T.; Feltre, G.; do Amaral Sobral, P.J.; Lopes da Cunha, R.; Menegalli, F.C. Properties of films produced from blends of pectin and gluten. Food Packag. Shelf Life. 2018, 18, 221–229. [Google Scholar] [CrossRef]
  24. Drakos, A.; Kyriakakis, G.; Evageliou, V.; Protonotariou, S.; Mandala, I.; Ritzoulis, C. Influence of jet milling and particle size on the composition, physicochemical and mechanical properties of barley and rye flours. Food Chem. 2017, 215, 326–332. [Google Scholar] [CrossRef] [PubMed]
  25. Marić, M.; Grassino, A.N.; Zhu, Z.; Barba, F.J.; Brnčić, M.; Rimac Brnčić, S. An overview of the traditional and innovative approaches for pectin extraction from plant food wastes and by-products: Ultrasound-, microwaves-, and enzyme-assisted extraction. Trends Food Sci. Technol. 2018, 76, 28–37. [Google Scholar] [CrossRef]
  26. Lefsih, K.; Giacomazza, D.; Dahmoune, F.; Mangione, M.R.; Bulone, D.; San Biagio, P.L.; Passantino, R.; Costa, M.A.; Guarrasi, V.; Madani, K. Pectin from Opuntia ficus indica: Optimization of microwave-assisted extraction and preliminary characterization. Food Chem. 2017, 221, 91–99. [Google Scholar] [CrossRef]
  27. Ahmad, M.M.; Iqbal, Z.; Anjum, F.; Sultan, J. Genetic variability to essential oil composition in four citrus fruit species. Pak. J. Bot. 2006, 38, 319–324. [Google Scholar]
  28. Li, J.; Zu, Y.-G.; Fu, Y.-J.; Yang, Y.-C.; Li, S.-M.; Li, Z.-N.; Wink, M. Optimization of microwave-assisted extraction of triterpene saponins from defatted residue of yellow horn (Xanthoceras sorbifolia Bunge.) kernel and evaluation of its antioxidant activity. Innov. Food Sci. Emerg. Technol. 2010, 11, 637–643. [Google Scholar] [CrossRef]
  29. Prakash Maran, J.; Sivakumar, V.; Thirugnanasambandham, K.; Sridhar, R. Optimization of microwave assisted extraction of pectin from orange peel. Carbohydr. Polym. 2013, 97, 703–709. [Google Scholar] [CrossRef]
  30. Liew, S.Q.; Ngoh, G.C.; Yusoff, R.; Teoh, W.H. Sequential ultrasound-microwave assisted acid extraction (UMAE) of pectin from pomelo peels. Int. J. Biol. Macromol. 2016, 93, 426–435. [Google Scholar] [CrossRef]
  31. Thirugnanasambandham, K.; Sivakumar, V. Application of D-optimal design to extract the pectin from lime bagasse using microwave green irradiation. Int. J. Biol. Macromol. 2015, 72, 1351–1357. [Google Scholar] [CrossRef]
  32. Quoc, L.P.T.; Huyen, V.T.N.; Hue, L.T.N.; Hue, N.T.H.; Thuan, N.H.D.; Tam, N.T.T.; Thuan, N.N.; Duy, T.H. Extraction of pectin from pomelo (Citrus maxima) peels with the assistance of microwave and tartaric acid. Int. Food Res. J. 2015, 22, 1637–1641. [Google Scholar]
  33. Patience, N.A.; Schieppati, D.; Boffito, D.C. Continuous and pulsed ultrasound pectin extraction from navel orange peels. Ultrason. Sonochem. 2021, 73, 105480. [Google Scholar] [CrossRef]
  34. Gharibzahedi, S.M.T.; Smith, B.; Guo, Y. Ultrasound-microwave assisted extraction of pectin from fig (Ficus carica L.) skin: Optimization, characterization and bioactivity. Carbohydr. Polym. 2019, 222, 114992. [Google Scholar] [CrossRef] [PubMed]
  35. Evageliou, V.; Ptitchkina, N.M.; Morris, E.R. Solution viscosity and structural modification of pumpkin biopectin. Food Hydrocoll. 2005, 19, 1032–1036. [Google Scholar] [CrossRef]
  36. Ilghami, A.; Ghanbarzadeh, S.; Hamishehkar, H. Optimization of the Ultrasonic-Assisted Extraction of Phenolic Compounds, Ferric Reducing Activity and Antioxidant Activity of the Beta vulgaris Using Response Surface Methodology. Pharm. Sci. 2015, 21, 46–50. [Google Scholar] [CrossRef]
  37. Li, D.; Jia, X.; Wei, Z.; Liu, Z. Box–Behnken experimental design for investigation of microwave-assisted extracted sugar beet pulp pectin. Carbohydr. Polym. 2012, 88, 342–346. [Google Scholar] [CrossRef]
  38. Liang, W.; Liao, J.; Qi, J.-R.; Jiang, W.; Yang, X. Physicochemical characteristics and functional properties of high methoxyl pectin with different degree of esterification. Food Chem. 2022, 375, 131806. [Google Scholar] [CrossRef]
  39. Evageliou, V.; Papastamopoulou, K.; Frantzeskaki, D.; Christodoulidou, C.-C. Retention of esters by gellan and pectin solutions or their mixtures. Food Hydrocoll. 2015, 51, 54–59. [Google Scholar] [CrossRef]
  40. Morris, E.R.; Cutler, A.N.; Ross-Murphy, S.B.; Rees, D.A.; Price, J. Concentration and shear rate dependence of viscosity in random coil polysaccharide solutions. Carbohydr. Polym. 1981, 1, 5–21. [Google Scholar] [CrossRef]
  41. Muñoz-Almagro, N.; Vendrell-Calatayud, M.; Méndez-Albiñana, P.; Moreno, R.; Cano, M.P.; Villamiel, M. Extraction optimization and structural characterization of pectin from persimmon fruit (Diospyros kaki Thunb. var. Rojo brillante). Carbohydr. Polym. 2021, 272, 118411. [Google Scholar] [CrossRef]
  42. Nep, E.I.; Conway, B.R. Physicochemical characterization of grewia polysaccharide gum: Effect of drying method. Carbohydr. Polym. 2011, 84, 446–453. [Google Scholar] [CrossRef]
  43. Arias, D.; Rodríguez, J.; López, B.; Méndez, P. Evaluation of the physicochemical properties of pectin extracted from Musa paradisiaca banana peels at different pH conditions in the formation of nanoparticles. Heliyon 2021, 7, e06059. [Google Scholar] [CrossRef]
  44. Lin, J.; Yu, S.; Ai, C.; Zhang, T.; Guo, X. Emulsion stability of sugar beet pectin increased by genipin crosslinking. Food Hydrocoll. 2020, 101, 105459. [Google Scholar] [CrossRef]
  45. Hua, X.; Liu, J.; Guan, S.; Tan, J.; Wang, M.; Yang, R. Surface activity of ultrahigh methoxylated pectin of different size. Food Hydrocoll. 2021, 113, 106495. [Google Scholar] [CrossRef]
  46. Weerakkody, N.S.; Caffin, N.; Turner, M.S.; Dykes, G.A. In vitro antimicrobial activity of less-utilized spice and herb extracts against selected food-borne bacteria. Food Control. 2010, 21, 1408–1414. [Google Scholar] [CrossRef]
  47. Psomiadou, E.; Arvanitoyannis, I.; Yamamoto, N. Edible films made from natural resources; microcrystalline cellulose (MCC), methylcellulose (MC) and corn starch and polyols—Part 2. Carbohydr. Polym. 1996, 31, 193–204. [Google Scholar] [CrossRef]
  48. Ribeiro, A.C.B.; Cunha, A.P.; da Silva, L.M.R.; Mattos, A.L.A.; de Brito, E.S.; de Souza Filho, M.d.S.M.; de Azeredo, H.M.C.; Ricardo, N.M.P.S. From mango by-product to food packaging: Pectin-phenolic antioxidant films from mango peels. Int. J. Biol. Macromol. 2021, 193, 1138–1150. [Google Scholar] [CrossRef] [PubMed]
  49. Shivangi, S.; Dorairaj, D.; Negi, P.S.; Shetty, N.P. Development and characterisation of a pectin-based edible film that contains mulberry leaf extract and its bio-active components. Food Hydrocoll. 2021, 121, 107046. [Google Scholar] [CrossRef]
  50. Lei, Y.; Wu, H.; Jiao, C.; Jiang, Y.; Liu, R.; Xiao, D.; Lu, J.; Zhang, Z.; Shen, G.; Li, S. Investigation of the structural and physical properties, antioxidant and antimicrobial activity of pectin-konjac glucomannan composite edible films incorporated with tea polyphenol. Food Hydrocoll. 2019, 94, 128–135. [Google Scholar] [CrossRef]
  51. Sun, L.; Sun, J.; Chen, L.; Niu, P.; Yang, X.; Guo, Y. Preparation and characterization of chitosan film incorporated with thinned young apple polyphenols as an active packaging material. Carbohydr. Polym. 2017, 163, 81–91. [Google Scholar] [CrossRef]
  52. Dou, L.; Li, B.; Zhang, K.; Chu, X.; Hou, H. Physical properties and antioxidant activity of gelatin-sodium alginate edible films with tea polyphenols. Int. J. Biol. Macromol. 2018, 118, 1377–1383. [Google Scholar] [CrossRef]
  53. Wang, L.; Dong, Y.; Men, H.; Tong, J.; Zhou, J. Preparation and characterization of active films based on chitosan incorporated tea polyphenols. Food Hydrocoll. 2013, 32, 35–41. [Google Scholar] [CrossRef]
  54. Talón, E.; Trifkovic, K.T.; Nedovic, V.A.; Bugarski, B.M.; Vargas, M.; Chiralt, A.; González-Martínez, C. Antioxidant edible films based on chitosan and starch containing polyphenols from thyme extracts. Carbohydr. Polym. 2017, 157, 1153–1161. [Google Scholar] [CrossRef] [PubMed]
  55. Katalinic, V.; Milos, M.; Kulisic, T.; Jukic, M. Screening of 70 medicinal plant extracts for antioxidant capacity and total phenols. Food Chem. 2006, 94, 550–557. [Google Scholar] [CrossRef]
  56. Rice-Evans, C.A.; Miller, N.J.; Paganga, G. Structure-antioxidant activity relationships of flavonoids and phenolic acids. Free Radic. Bio. Med. 1996, 20, 933–956. [Google Scholar] [CrossRef]
Figure 1. (a) Flow curves of 0.5 wt. % solutions and (b) ηsp vs. c[η] plots of pectins A, B and C. Pectins A and B were extracted from orange peels using MAE (620 W, 1:25 w/v, 3 min) and UMAE (50/850 W, 1:20 w/v, 30/3 min), respectively. Pectin C was a commercial sample.
Polysaccharides 03 00034 g001
Figure 2. (a) Total phenolic content (TPC) and (b) antioxidant activity (SA) of film forming solutions (FFS) and films based on dittany (D) or anise (A) infusions and pectins A, B or C. Pectins A and B were extracted from orange peels using MAE (620 W, 1:25 w/v, 3 min) and UMAE (50/850 W, 1:20 w/v, 30/3 min), respectively. Pectin C was a commercial sample.
Polysaccharides 03 00034 g002
Table 2. Physicochemical properties of pectins A, B and C. Pectins A and B were extracted from orange peels using MAE (620 W, 1:25 w/v, 3 min) and UMAE (50/850 W, 1:20 w/v, 30/3 min), respectively. Pectin C was a commercial sample.
PectinDE
(%)
[η]
(dL/g)
M
(kg/mol)
Zeta Potential (mV)Surface Tension (mN/m)ES
(%)
Colour
L*a*b*
A74.10.713.7−17.3 ᵃ ± 0.353.8 ᵃ ± 0.141.4 ᵃ ± 2.310.9 a ± 0.93.3 a ± 0.23.8 a ± 0.4
B72.42.049.0−19.4 ᵇ ± 0.553.5 ᵃᵇ ± 0.244.1 ᵃ ± 0.612.2 a ± 0.63.8 a ± 0.34.1 a ± 0.4
C70–752.469.9−30.2 ᶜ ± 0.353.3 ᵇ ± 0.151.3 ᵇ ± 1.357.2 b ± 0.910.0 b ± 0.418.7 b ± 0.4
*: Values with different superscripts within the same parameter are significantly different (p < 0.05).
Table 3. Physicochemical properties of films based on dittany (D) or anise (A) and pectins (A, B, C). Pectins A and B were extracted from orange peels using MAE (620 W, 1:25 w/v, 3 min) and UMAE (50/850 W, 1:20 w/v, 30/3 min), respectively. Pectin C was a commercial sample.
SamplesThickness (μm)Density (g/cm³)Moisture Content (%)ColourOpacityMaximum Force (N)Young′s Modulus (kPa)
L*a*b*
DA41 ᵃ ± 50.95 ᵃ ± 0.0424.74 ᵃ ± 1.9478.85 ᵃᵇ ± 4.013.90 ᵃᵇ ± 0.8031.50 ᵃ ± 1.4526,761 ᵃ ± 1353
DB40 ᵃ ± 71.10 ᵃᵇ ± 0.1325.50 ᵃ ± 0.9675.67 c ± 2.155.05 ᵃ± 1.6329.43 ᵃᵇ ± 3.6124,495 ᵇ ± 873.80 ᵃ ± 0.0891.30 ᵃ ± 2.75
DC39 ᵃ ± 70.97 ᵃᵇ ± 0.0924.78 ᵃ ± 0.0776.74 bc ± 0.841.06 ᶜ ± 0.3027.42 ᵇᶜ ± 0.9128,246 ᶜ ± 2682.04 ᵇ ± 0.33191.80 ᵇ ± 4.96
AA40 ᵃ ± 41.29 ᵇ ± 0.0225.09 ᵃ ± 0.0879.70 ᵇ ± 1.832.65 ᵈ ± 0.3525.70 ᶜ ± 1.2826,327 ᵃ ± 1182.00 ᵇ ± 0.0678.38 ᵃᶜ ± 4.08
AB39 ᵃ ± 71.27 ᵃᵇ ± 0.2025.54 ᵃ ± 2.3878.20 abc ± 0.952.96 ᵇᵈ ± 0.4626.18 ᶜ ± 1.3425,900 ᵃ ± 2563.00 ᶜ ± 0.2876.62 ᶜ ± 1.77
AC40 ᵃ ± 61.00 ᵃᵇ ± 0.2225.30 ᵃ ± 0.0184.82 d ± 0.44 −0.16 ᵉ ± 0.059.27 ᵈ ± 0.5528,133 ᶜ ± 6334.65ᵈ ± 0.20155.09ᵈ ± 14.45
*: Values with different superscripts within the same parameter are significantly different (p < 0.05).
Publisher’s Note: MDPI stays neutral with regard to jurisdictional claims in published maps and institutional affiliations.

