Article

Effects of Sulforaphane and Chlorophyl a in a Western Diet-Induced Obesity Model

by
Tânia Martins
1,2,*,
Ana Filipa Matos
3,
Joana Soares
3,
Rúben Leite
3,
Maria João Pires
1,2,4,
Maria de Lurdes Pinto
4,5,
Maria João Neuparth
6,7,8,
Sandra Mariza Monteiro
1,2,
Ana Rita Sequeira
3,
Luís Félix
1,2,
Carlos Venâncio
1,2,9,
Eduardo Rosa
1,2,
Paula Alexandra Oliveira
1,2,4 and
Luís Miguel Antunes
1,2,4
1
Centre for the Research and Technology of Agro-Environmental and Biological Sciences (CITAB), University of Trás-os-Montes and Alto Douro (UTAD), 5000-801 Vila Real, Portugal
2
Inov4Agro—Institute for Innovation, Capacity Building and Sustainability of Agri-Food Production, University of Trás-os-Montes and Alto Douro (UTAD), 5000-801 Vila Real, Portugal
3
Department of Biology and Environment, School of Life and Environmental Sciences, University of Trás-os-Montes and Alto Douro (UTAD), 5000-801 Vila Real, Portugal
4
Department of Veterinary Sciences, School of Agrarian and Veterinary Sciences, University of Trás-os-Montes and Alto Douro (UTAD), 5000-801 Vila Real, Portugal
5
Animal and Veterinary Research Center (CECAV), University of Trás-os-Montes and Alto Douro (UTAD), 5000-801 Vila Real, Portugal
6
Research Center in Physical Activity, Health and Leisure (CIAFEL), Faculty of Sports, University of Porto (FADEUP), 4200-450 Porto, Portugal
7
Laboratory for Integrative and Translational Research in Population Health (ITR), 4050-600 Porto, Portugal
8
Toxicology Research Unit (TOXRUN), University Institute of Health Sciences, Cooperativa de Ensino Superior Politécnico e Universitário (CESPU), CRL, 4585-116 Gandra PRD, Portugal
9
Department of Animal Sciences, School of Agrarian and Veterinary Sciences, University of Trás-os-Montes and Alto Douro (UTAD), 5000-801 Vila Real, Portugal
*
Author to whom correspondence should be addressed.
Obesities 2023, 3(4), 265-286; https://doi.org/10.3390/obesities3040022
Submission received: 28 September 2023 / Revised: 27 October 2023 / Accepted: 15 November 2023 / Published: 17 November 2023

Abstract

:
The global rise in obesity and its co-morbidities raises worldwide health, social and economic concerns, especially in developed countries. Compounds derived from natural sources are now in the focus of pharmacological therapies. In recent years, sulforaphane (SFN) has been the subject of studies due to its anti-cancer, anti-inflammatory, antioxidant and potential anti-obesity effects. Lately, some studies have also reported the anti-obesogenic potential of chlorophyll. In this study, we evaluated the anti-obesity effects of SFN and chlorophyll a (Chlo.a) in C57BL/6J mice fed with a Western diet, rich in sugar and fat. The study lasted 14 weeks, and for the last 4 weeks SFN (0.25 or 0.5 mg/kg/day) or Chlo.a (0.2 or 0.5 mg/kg/day) was administered orally. The results showed that supplementation with SFN or Chlo.a resulted in an increase in body temperature and a reduction in the size of adipocytes. However, the administration of SFN or Chlo.a for 4 weeks did not decrease the body weight gain or hepatic steatosis, and increased hepatic ROS counterbalancing with an increase in SOD activity. In conclusion, in the animal model used, treatment with SFN or Chlo.a did not show strong anti-obesity effects; however, slight improvements were observed with the supplementation of these compounds.

1. Introduction

Obesity is a multifactorial disease whose incidence has been increasing in recent years, creating a worldwide health concern and entailing costs at a social and economic level [1]. Obese patients are often predisposed to potential co-morbidities such as type 2 diabetes, hypertension, dyslipidaemia, cardiovascular diseases, non-alcoholic fatty liver disease, chronic kidney disease, certain types of cancer, mental disorders, among others [2,3,4,5,6]. The development of obesity is usually due to an imbalance between calories ingested and calories expended through metabolism and physical activity [7,8], although other causes such as genetics, environmental and socio-economic conditions can also contribute to obesity [9,10,11]. The consumption of high-calorie diets such as the so-called Western diet, rich in saturated fats and sugars, is a trigger for the development of obesity, especially when associated with a sedentary lifestyle [7,8]. A healthy lifestyle with a balanced diet and physical exercise is essential to reduce obesity and its associated co-morbidities. The use of natural compounds that help in the treatment or prevention of obesity are of great interest and the subject of many studies [12]. Natural compounds generally offer lower side effects than synthetic ones and are of great interest in pharmacological therapies [12,13,14]. In addition, consumers also give preference to compounds of natural origin [15].
Brassicaceae plants, such as cabbage, broccoli, cauliflower and Brussels sprouts, are rich in glucosinolates, which give rise to isothiocyanates with health benefits after hydrolysis, such as sulforaphane (SFN) [16]. In recent years, SFN has emerged as a promising agent against obesity [17,18]. In vitro studies demonstrated that SFN treatment significantly reduced both lipid accumulation and triglyceride content in adipocytes [19] and induced lipophagy through the activation of AMPK-mTOR-ULK1 pathway signalling [20]. Recently, SFN has been shown to attenuate neutrophil reactive oxygen species (ROS) production, myeloperoxidase degranulation, and phagocytosis, as well as decrease the release of pro-inflammatory cytokines and ROS production in whole blood [21]. Studies addressing the anti-obesogenic effects of SFN in diet-induced obese rodents have reported that SFN administration was able to significantly reduce body weight gain and liver weight, and improved insulin resistance, glucose tolerance, plasma lipid profile and liver steatosis [17,22,23,24]. In a recent study, a web-based integrative transcriptome analysis was used to evaluate the pharmacological actions of SFN in vitro and in vivo [25]. The analysis revealed that SFN-induced transcriptomic changes were cell/tissue type dependent. The study shows that SFN upregulated the ATF6-mediated unfolded protein response (UPR) in a NRF2-independent manner, and that SFN-induced UPR occurred in the liver, but not in the skeletal muscle, brown adipose tissue or the epididymal and inguinal white adipose tissue of HFD-induced obese mice. In turn, SFN induced a NRF2-mediated antioxidant response in the skeletal muscle [25], and the SFN treatment was also shown to be downregulated the expression of collagen and circadian rhythm-associated genes involved in fibrosis and lipid metabolism, respectively [25].
Chlorophyll is a green pigment involved in the photosynthetic process, and is present in plants, algae and some bacteria. There are different forms of chlorophyll, including a, b, c, d and e [26]. Chlorophyll compounds have been reported to present some bioactive activities such as, anti-oxidant, anti-cancer, anti-inflammatory, neuroprotective effects, among others [27]. Furthermore, it has been reported that chlorophyll a (Chlo.a), the most abundant photosynthetic pigment, together with its derivatives, has potential anti-obesogenic actions in both in vitro and in vivo studies [28,29,30,31,32]. Wang and colleagues [32] demonstrated that the addition of chlorophyll extracts decreased the release rate of free fatty acids and changed the fatty acid composition of soybean oil emulsions at the gastrointestinal system level using an in vitro simulation. In addition, the study reported that pheophytin, a Chlo.a derivative formed after gastric digestion, inhibited pancreatic lipase activity during intestinal digestion by binding to pancreatic lipase [32]. Seo and colleagues [31] investigated the anti-obesity and browning effects of Spirulina maxima extract, a microalga rich in Chlo.a. They demonstrated that the spirulina extract suppressed lipid accumulation by reducing the expression of adipogenic and lipogenic proteins in vitro. In the same study, Chlo.a treatment alone was also able to inhibit adipogenesis and lipogenesis in vitro [31]. In addition, supplementation with spirulina extract was reported to decrease body-weight gain, fat mass and triglyceride and total cholesterol serum levels. It was also reported to decrease the expression of adipogenic proteins and increase thermogenic factors in mice fed with a high-fat diet (HFD) [31]. Other studies reported that chlorophyll-rich spinach extract supplementation significantly reduced body-weight gain, adipose tissue accumulation and low-grade inflammation and improved dyslipidaemia and glucose tolerance in mice that were fed a HFD [33,34]. In addition, this chlorophyll-rich extract supplementation was able to reduce gut microbiota dysbiosis induced by the HFD [33,34]. The gut microbiota composition is known to be related to a healthy or unhealthy state and may play a role in the development or maintenance of obesity [35].
Despite this evidence, studies addressing the anti-obesogenic effects of SFN and especially Chlo.a are still scarce and vary between treatment protocols. The use of rodents fed hypercaloric diets is one of the most used animal models of induced obesity [36,37], and the Western diet is used as a robust model of human obesity [38]. Thus, the aim of this study was to evaluate the potential anti-obesogenic effects of SFN and Chlo.a in mice fed with a Western diet rich in sugar and cholesterol using a voluntary ingestion treatment protocol.

2. Materials and Methods

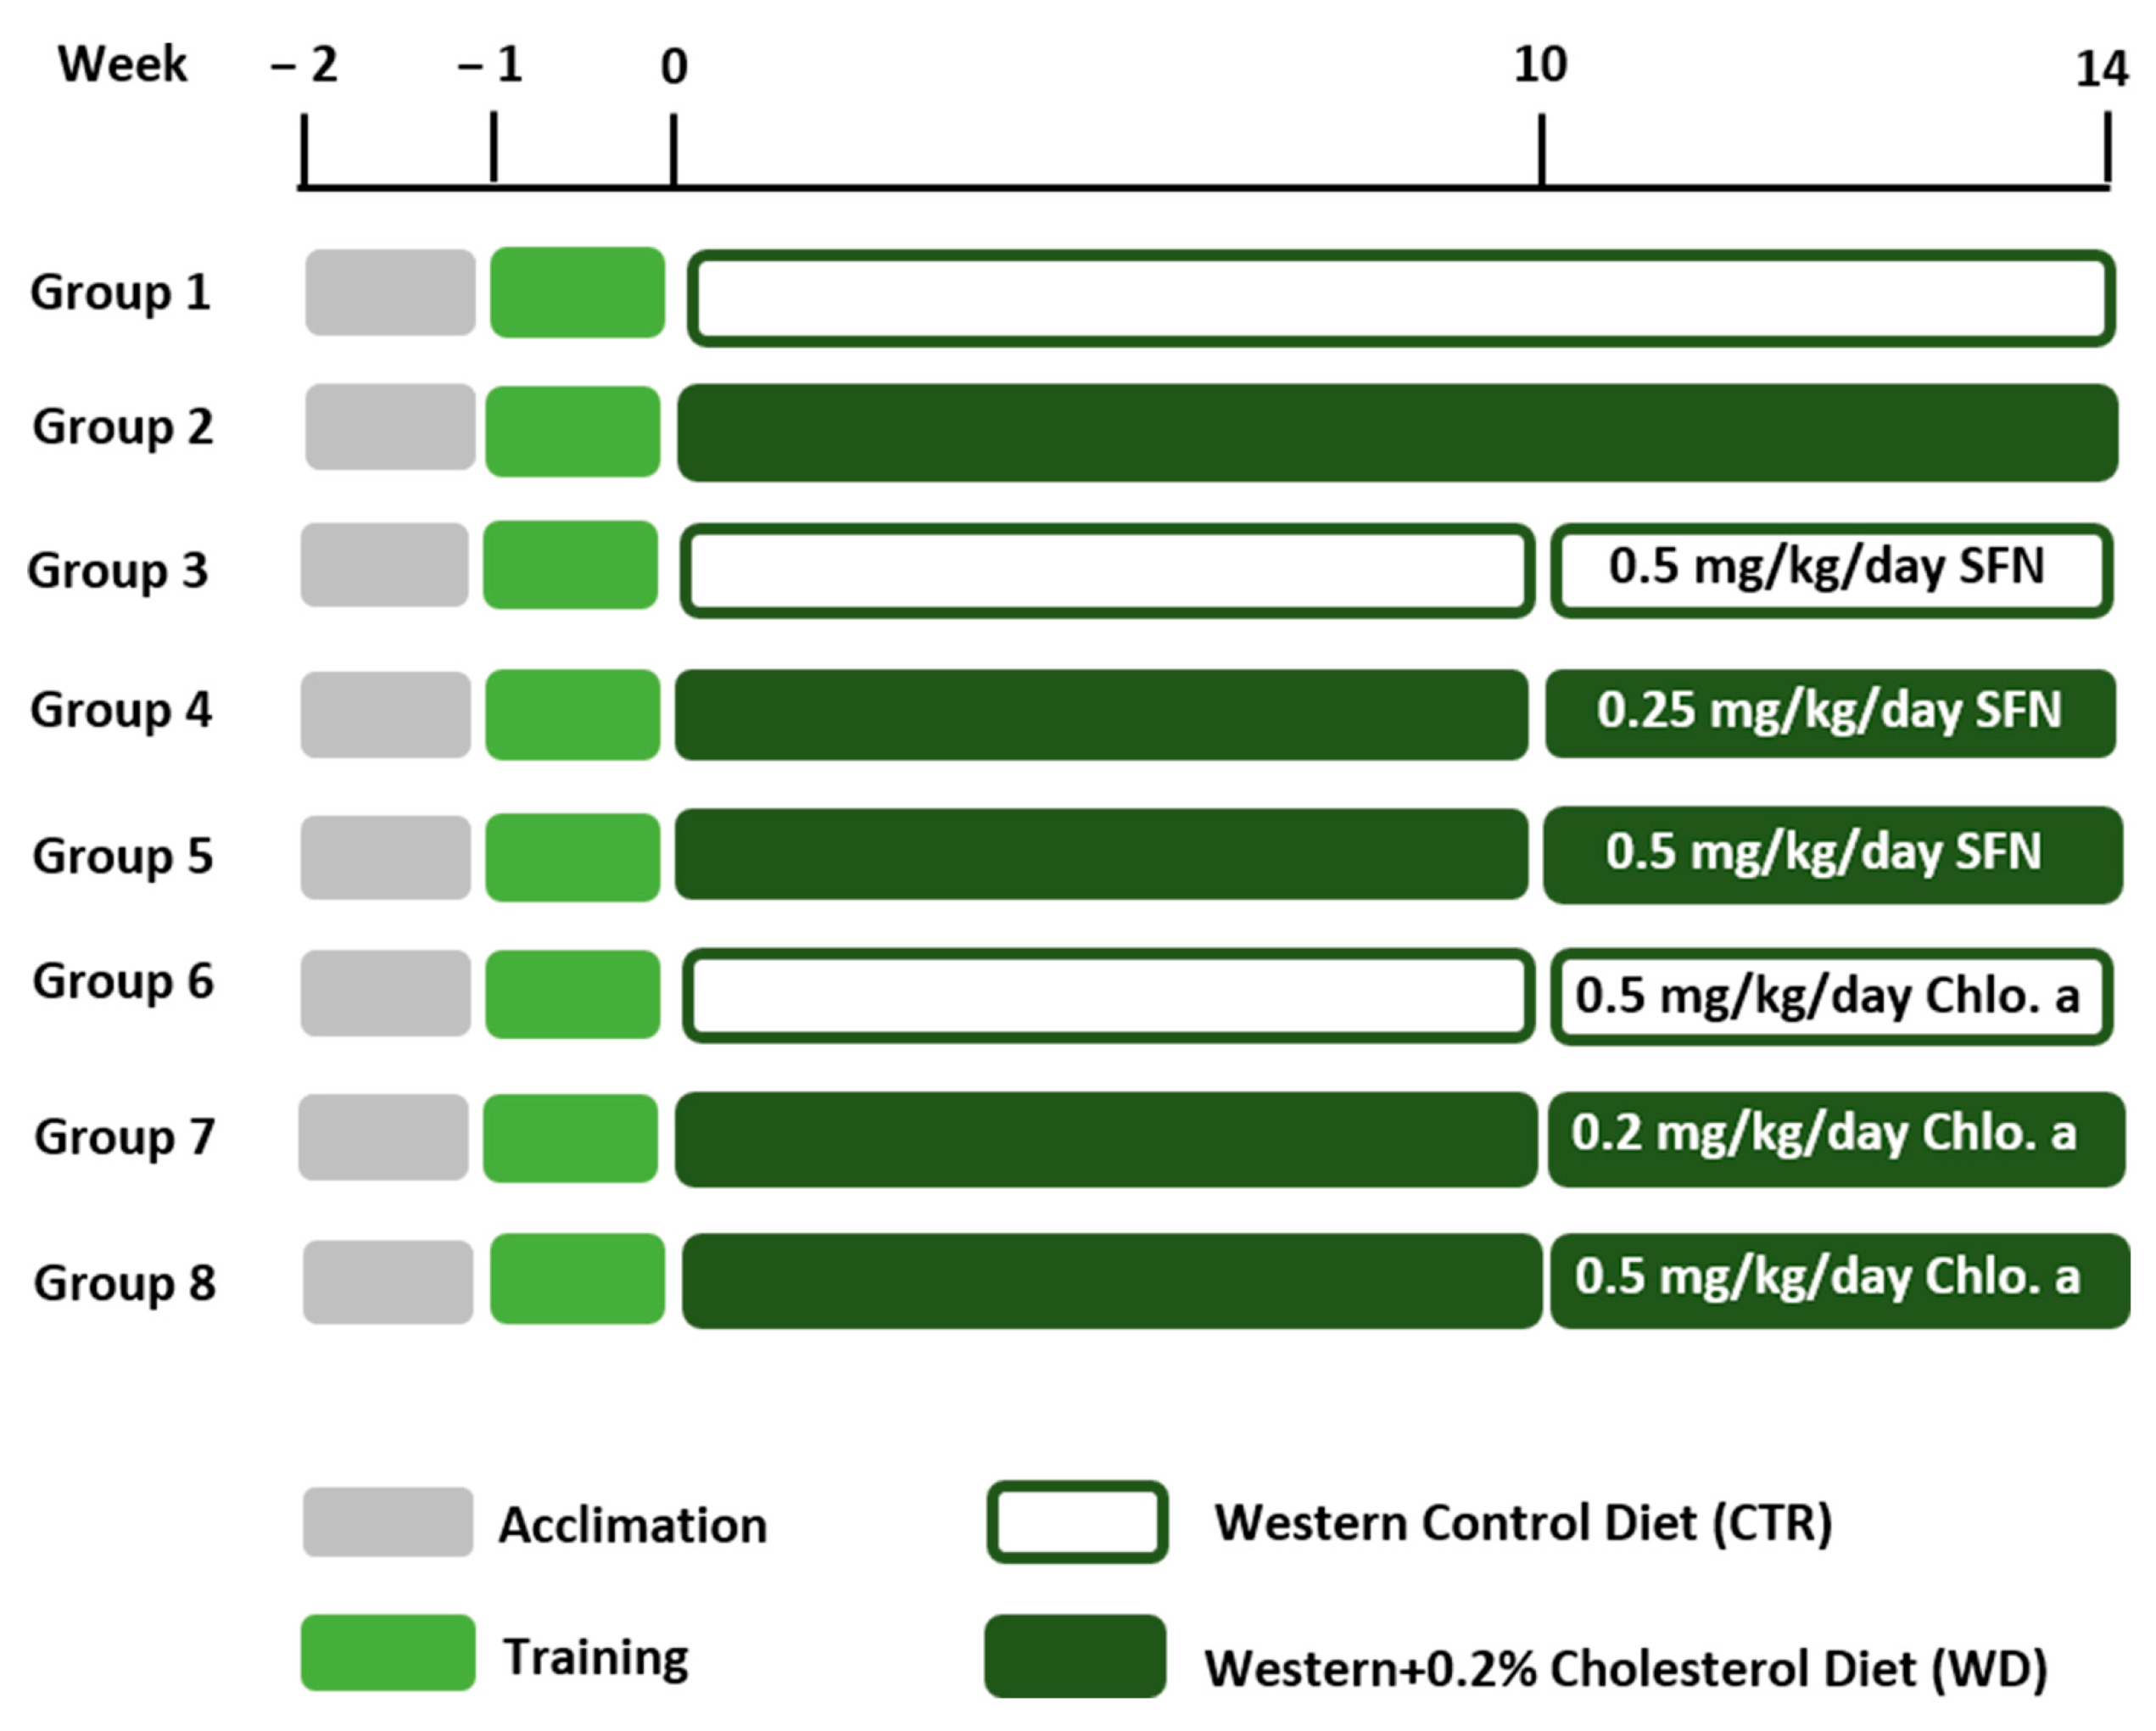
2.1. Animals and Experimental Design

All the animal experiments were previously approved by the local Animal Welfare and Ethical Review Body at University of Trás-os-Montes and Alto Douro (UTAD) followed by the national competent authority Direção-Geral de Alimentação e Veterinária (DGAV, Lisbon, Portugal; license nº 8776), and were conducted in accordance with the Portuguese Law (DL nº 113/2003) and the European Directive 2010/63/EU on the protection of animals used for scientific purposes.
Six-week-old male C57BL/6J mice (n = 56) (Charles River Laboratories, Saint Germain Nuelles, France) were used in the present work since females are more resistant to the obesogenic effects of fat diets [39,40,41]. Mice were kept in an animal facility under controlled temperature (21 ± 2 °C), relative humidity (50 ± 10%) and a 12 h/12 h light–dark cycle. Mice were group-housed in open polycarbonate cages with corn cob bedding and with cardboard rolls and paper as environmental enrichment. The animals were left to acclimate for 1 week and had ad libitum access to tap water and a standard diet for 2 weeks. The use of gelatine pellets for voluntary drug ingestion is an alternative to more stressful administration methods in animals, such as intragastric gavage, while also providing reliable drug delivery [42,43,44,45]. This method requires a period of training for the animals to get used to ingesting the gelatine pellet. The mice were trained to voluntarily ingest gelatine pellets during the week before the start of the experiments. The animals fasted for 12 h only on the first day of contact with gelatine pellets to encourage them to overcome neophobia [46]. Over the next few days, the animals ate the pellets very quickly. During this training period, the animals had ad libitum access to food and water. The animals were placed in separate cages to eat the gelatine pellets only once during the day, immediately returning to the group cage after ingestion. The gelatine pellets were diet-flavoured, and the selection of this flavour was based on a comparison between different gelatine flavours for oral dosing in the mice developed by our group [47]. The animals were randomly assigned to eight groups (n = 7/group) and were fasted for 12 h before the start of exposure to the new diets. The new diets were the Western control (CTR; Western 1635 Control; 17.9% fat- and 50.2% carbohydrate-derived calories; SAFE®, Augy, France) and the Western + 0.20% cholesterol (WD; Western 1635 + 0.20% cholesterol; 18.1% fat- and 50.1% carbohydrate-derived calories; SAFE®, Augy, France). To guarantee an increase in the animals’ body mass, the diet should be simultaneously hypercaloric and hyperlipidemic [48]. A hypercaloric diet based on carbohydrates has low palatability, so the animals may reduce their body mass instead of increasing it, since animals in nature, once satiated, do not ingest more. On the contrary, a hyperlipidemic diet has better palatability and animals consume it better, thus increasing their body mass [49,50]. Due to the soft texture of the new diets used in this study, wooden blocks were placed in the cages so that the teeth of the mice would wear out and the animals could express their appropriate behaviour. The study had a duration of 14 weeks, and for a therapeutic approach, D,L-sulforaphane (SFN; EMD Millipore Corp., Burlington, MA, USA) or chlorophyll a (Chlo.a; Sigma-Aldrich, St. Louis, MO, USA) were given in the last 4 weeks of the study (Figure 1). SFN and Chlo.a were resuspended in sunflower oil, obtaining a stock solution of 25 mg/mL and 10 mg/mL, respectively. On each day, the volumes of the solutions, with a corresponding daily dose of 0.25 or 0.5 mg/kg body weight (bw) for SFN [23] and 0.2 or 0.5 mg/kg bw for Chlo.a [51], were put in the top of a gelatine pellet, and then ingested voluntarily (per os) by the animals on five days per week. The animals were monitored during their daily intake of gelatine pellets to ensure the pellets were completely ingested. The chosen doses were based on literature [23,51]. The experimental groups were as follows: (1) Western control (CTR); (2) Western + 0.20% cholesterol (WD); (3) CTR + 0.5 mg/kg/day SFN (CTR + 0.5 SFN); (4) WD + 0.25 mg/kg/day SFN (WD + 0.25 SFN); and (5) WD + 0.5 mg/kg/day SFN (WD + 0.5 SFN); (6) CTR + 0.5 mg/kg/day Chlo.a (CTR + 0.5 Chlo.a); (7) WD + 0.2 mg/kg/day Chlo.a (WD + 0.2 Chlo.a); and (8) WD + 0.5 mg/kg/day Chlo.a (WD + 0.5 Chlo.a). The control groups were given the highest dose of the respective compound on the principle that if the substance alone at that dose had no effect, the lower dose would not either.
Food intake was recorded weekly, while body weights were monitored monthly. The relative weight gain for each mouse and the average food intake for each group was calculated using the following equations:
R e l a t i v e   w e i g h t   g a i n % = F i n a l   w e i g h t I n i t i a l   w e i g h t F i n a l   w e i g h t × 100
A v e r a g e   d a i l y   f o o d   i n t a k e g = I n i t i a l   f o o d   w e i g h t F i n a l   f o o d   w e i g h t N º   d a y s
Mice are social animals that should be grouped together [52,53]; however, the exact individual food intake is difficult to determine for house-grouped animals. Also, food that falls into the cage and is wasted is not taken into account, so food consumption calculations end up reflecting an estimate.

2.2. Body Temperature Assessment by Infrared Imaging

The body temperature of each mouse was assessed at the beginning of the study and at week 14. For this process, images were acquired using the FLIR E8 Wifi (FLIR Systems UK, Kings Hill, Kent, UK) thermographic camera in a dark room to avoid light interference. The plane of the infrared camera’s lens was positioned at a distance of 50 cm and parallel to the plane of the mouse’s back. Thermographic images [infrared resolution 76,800 (320 × 240) pixel] were analysed with FLIR Tools software version 5.13.18031.2002, and body surface temperature was then assessed using data collected at a mid-back measurement point.

2.3. Liver and White Adipose Tissue Histology

At the end of the week 14, mice were fasted for 24 h and then killed with an overdose of ketamine (75 m/kg, i.p.) and xylazine (45 mg/kg, i.p.) followed by cardiac puncture. The liver and the epididymal and retroperitoneal white adipose tissues were collected and weighed. Tissues were fixed by immersion in 10% neutral buffered formalin, dehydrated through graded alcohols and embedded in paraffin wax. Tissue sections (2 μm thick) were stained with haematoxylin and eosin (H&E), and then analysed under a light microscope by a blinded pathologist. All of the microscopic changes were registered. In the liver, the distribution (focal or diffuse) of liver fatty changes (micro- and macrovacuolar) and the presence of inflammatory infiltrate was recorded.

2.4. Adipocyte Morphology Analysis

The morphometric analysis of the epididymal adipose tissue was performed in histological sections (2 µm thickness) [54] using an optical microscope (IX 51, Olympus, Tokyo, Japan) equipped with a CCD camera (Color View III, Olympus, Hamburg, Germany). The number of adipocytes was determined in 5 fields/sections (×200 magnification) and the average number per group was calculated. The number of adipocytes was also determined in a fixed area (569 638 μm2), in 5 fields/section (×100 magnification), and the mean number calculated per sampled animal. Adipocyte volume was calculated using the formula π/6 × [3σ2 × d + d5], where d is the mean diameter of 100 measured cells in the field, and σ is the standard deviation of the diameter. The area (µm2) of 100 adipocytes was determined in 5 fields/section, using the Olympus CellˆA software for image analysis (Version 2.6; Build 1210). The average size of the adipocytes was calculated, and three different area classes were determined (<500, 500–1000, ≥1000 µm2) in which the cell size distribution was expressed in percentage [55].

2.5. Intraperitoneal Glucose Tolerance Test (IPGTT)

The glucose tolerance test was performed at week 14. The mice were fasted overnight, and then injected intraperitoneally with a 50% glucose solution (2 g/kg, i.p.). Blood was collected immediately before and 30, 60 and 120 min after the injection, through a small puncture in the tail inflicted on the animals. An OGCare glucometer (BSI Diagnostics, Arezzo, Italy) was used to measure blood glucose, whose concentration was then expressed as a function of time and the area under the curve (AUC) calculated.

2.6. Plasma Glucose and Lipid Profile

After 24 h of fasting, blood was collected into lithium-heparin tubes when mice were killed, and then centrifuged at 1500× g for 15 min at 4 °C. The plasma obtained was collected and stored at −20 °C for a posterior analysis of its biochemical parameters, namely, glucose, total cholesterol (TC), triglyceride (TG) and high-density lipoprotein-cholesterol (HDL-c), determined by spectrophotometric methods using an autoanalyzer (Prestige 24i, Cormay PZ). Low-density lipoprotein-cholesterol (LDL-c) was calculated using the Friedewald formula [LDL = TC − HDL − (TG/5)].

2.7. Hepatic Oxidative Stress

The liver samples were homogenized in a cold buffer solution (0.32 mM of sucrose, 20 mM of HEPES, 1 mM of MgCl2 and 0.5 mM of phenylmethylsulfonylfluoride, pH 7.4), and then centrifuged at 15,000× g for 20 min at 4 °C. The supernatants were collected and analysed for the assessment of oxidative stress and antioxidant response. The oxidative-stress index (OSI) was determined as the ratio between the reduced glutathione (GSH) and oxidized glutathione (GSSG). The levels of GSH and GSSG were assessed at 320 nm and 420 nm by derivatization with ortho-phthalaldehyde [56]. The 2,7-dichlorofluorescein diacetate (DCFDA) probe, with excitation at 485 nm and emission at 530 nm, was used to estimate the reactive oxygen species (ROS) synthesis, as previously reported [57]. The malondealdehyde (MDA), an indicator of lipid peroxidation (LPO), was determined by the thiobarbituric acid (TBA)-based method at 530 nm [58]. The activity of the superoxide dismutase (SOD) was determined at 560 nm, while the activity of catalase was assessed at 240 nm, as previously described [59]. The glutathione peroxidase (GPx) activity was evaluated at 340 nm by the oxidation of NADPH [60]. The gluthathione S-Transferase (GST) activity was measured through the reaction of the thiol group of glutathione with 1-chloro-2,4-dinitrobenzene (CDNB) at 340 nm, and a molar extinction coefficient of 9.60 mM−1 cm−1 was used. The analyses were carried out using a PowerWave XS2 microplate scanning spectrophotometer (Bio-Tek Instruments, Santa Clara, CA, USA) or Varian Cary Eclipse (Varian; Palo Alto, CA, USA) spectrofluorometer equipped with a microplate reader.

2.8. Statistics

Data are expressed as mean ± standard error of the mean (SEM). Statistical analysis was carried out using GraphPad Prism version 7.0 (GraphPad Software, Inc., San Diego, CA, USA), and p < 0.05 was considered statistically significant. Data was analysed for normality by the Shapiro–Wilk normality test. The one-way ANOVA statistical analysis was performed followed by Dunnett’s multiple comparison test. Statistical analysis for blood glucose was calculated using the area under the curve (AUC). The data from the histological liver lesions are expressed in numbers of animals and percentages and were analysed using the Chi-square test.

3. Results

3.1. Effect of SFN and Chlo.a on Body Weight and Body Temperature

The body weight changes and the weight gain of each experimental group are shown on Table 1. Mice were randomly assigned to the experimental groups, and the WD + 0.5 SFN and WD + 0.2 Chlo.a groups had the lowest body weights at the beginning of the study, with significant differences (p < 0.05) in the WD group. After 14 weeks of ingesting the experimental diets, the WD and WD + 0.5 Chlo.a groups registered the highest body weights (p < 0.05) compared to the CTR mice. The relative weight gain of the WD mice was 22.9% higher than that of the CTR mice; however, the difference in relative weight gain between the WD and CTR groups was not statistically significant. Differences in relative weight gain were only significant (p < 0.05) for the CTR + 0.5 Chlo.a and WD + 0.5 Chlo.a groups compared to the CTR mice. In fact, the CTR + 0.5 Chlo.a group was the second group with the highest average daily food intake (Table 1), which may have contributed to the high weight gain. In contrast, the WD + 0.25 SFN group consumed the highest amount of food daily, but this was not reflected in their weight gain. Concerning body temperature (Table 1), the WD group had the lowest value, being significantly different (p < 0.05) from the CTR group. In turn, supplementation with SFN or Chlo.a significantly increased (p < 0.05) the body temperature of mice that were fed a Western diet compared to the WD group. A baseline measurement of body temperature was made at the beginning of the study, but no differences were found between groups.

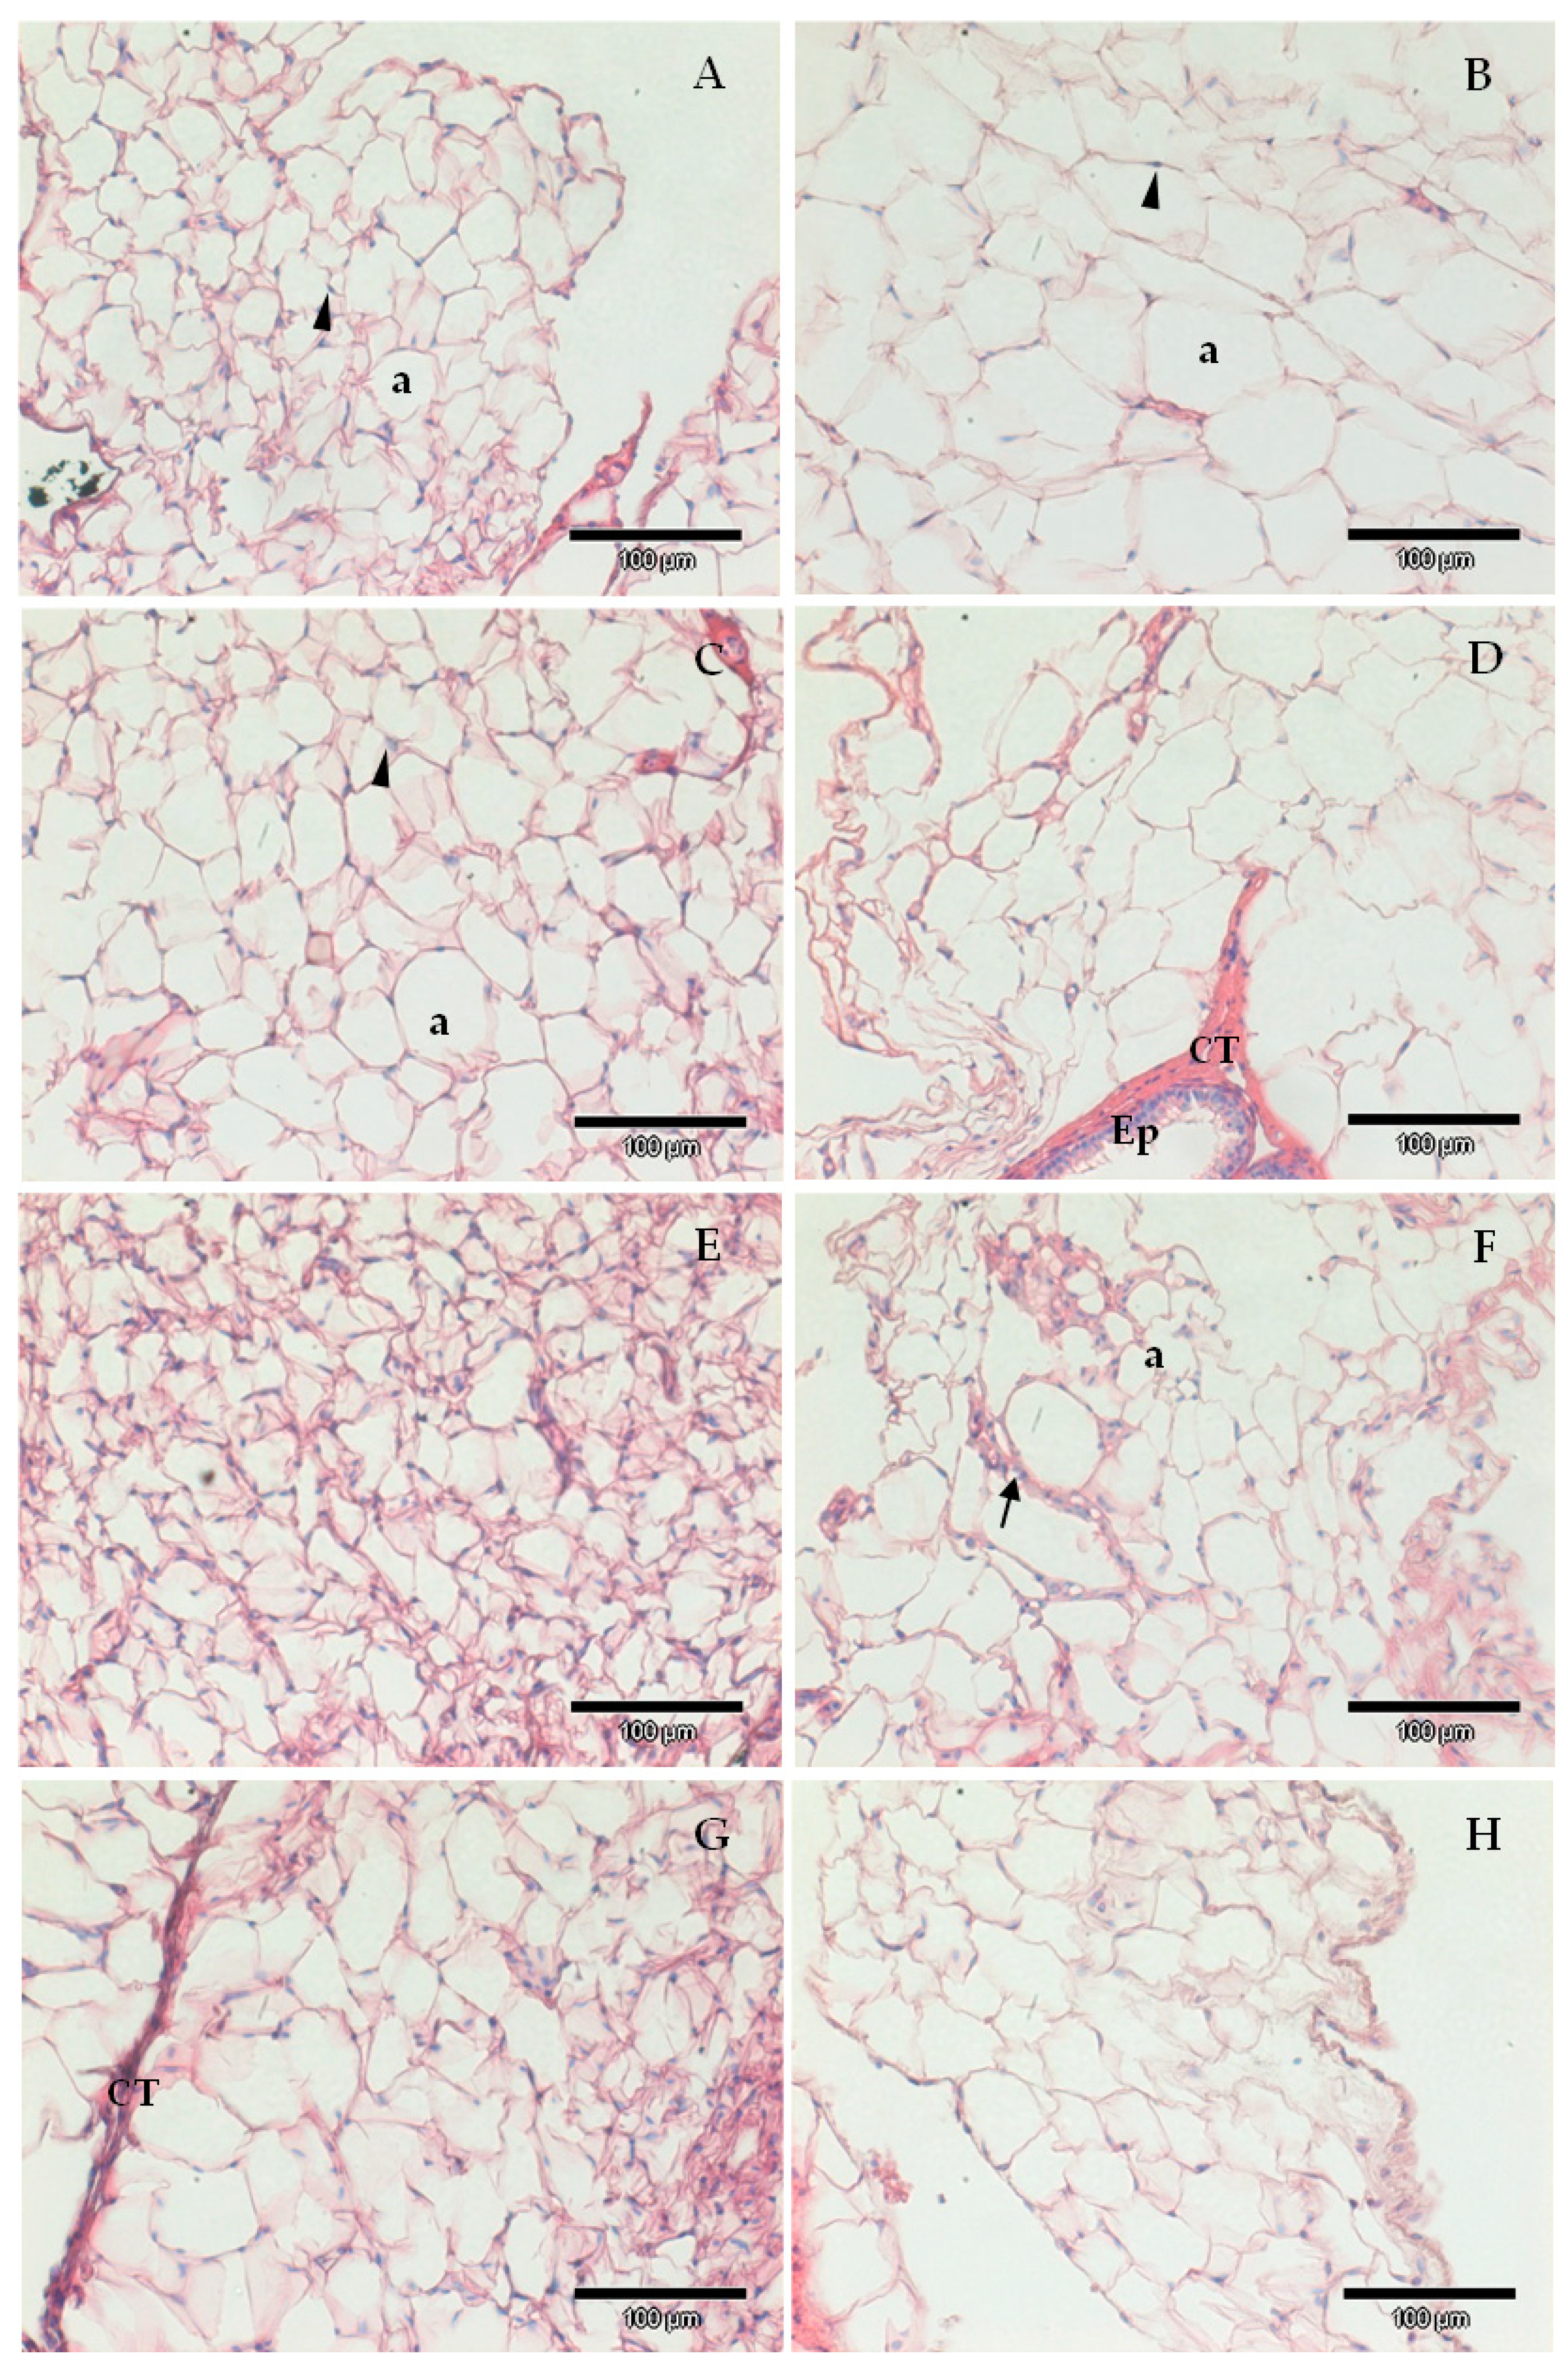
3.2. SFN and Chlo.a Improve Adipose Tissue Hypertrophy

Regarding the relative adipose tissue weight, the WD group showed the highest epididymal (Figure 2A) and retroperitoneal fat weight (Figure 2B), although it was only significantly different (p < 0.05) from the CTR group for the epididymal fat. Supplementation with SFN or Chlo.a showed a downward trend in the accumulation of epididymal and retroperitoneal fat induced by the Western diet compared to the WD group, however it only reached a significant difference (p < 0.05) in group WD + 0.2 Chlo.a (Figure 2A,B). Globally, the number of adipocytes in groups fed the Western diet tended to be lower than in the CTR group, being statistically significant (p < 0.05) for only the WD and WD + 0.5 SFN groups (Figure 2C). As for the adipocyte volume and area (Figure 2D and 2E, respectively), the supplementation with SFN or Chlo.a decreased (p < 0.0001) the adipocyte size in the Western diet-fed mice. Accordingly, in the WD group, adipocytes with areas greater than 1000 µm2 represented the highest percentage, while in the other groups adipocytes with areas between 500–1000 µm2 (Figure 2F) were the most frequent. Representative images of adipose tissue are shown in Figure 3.

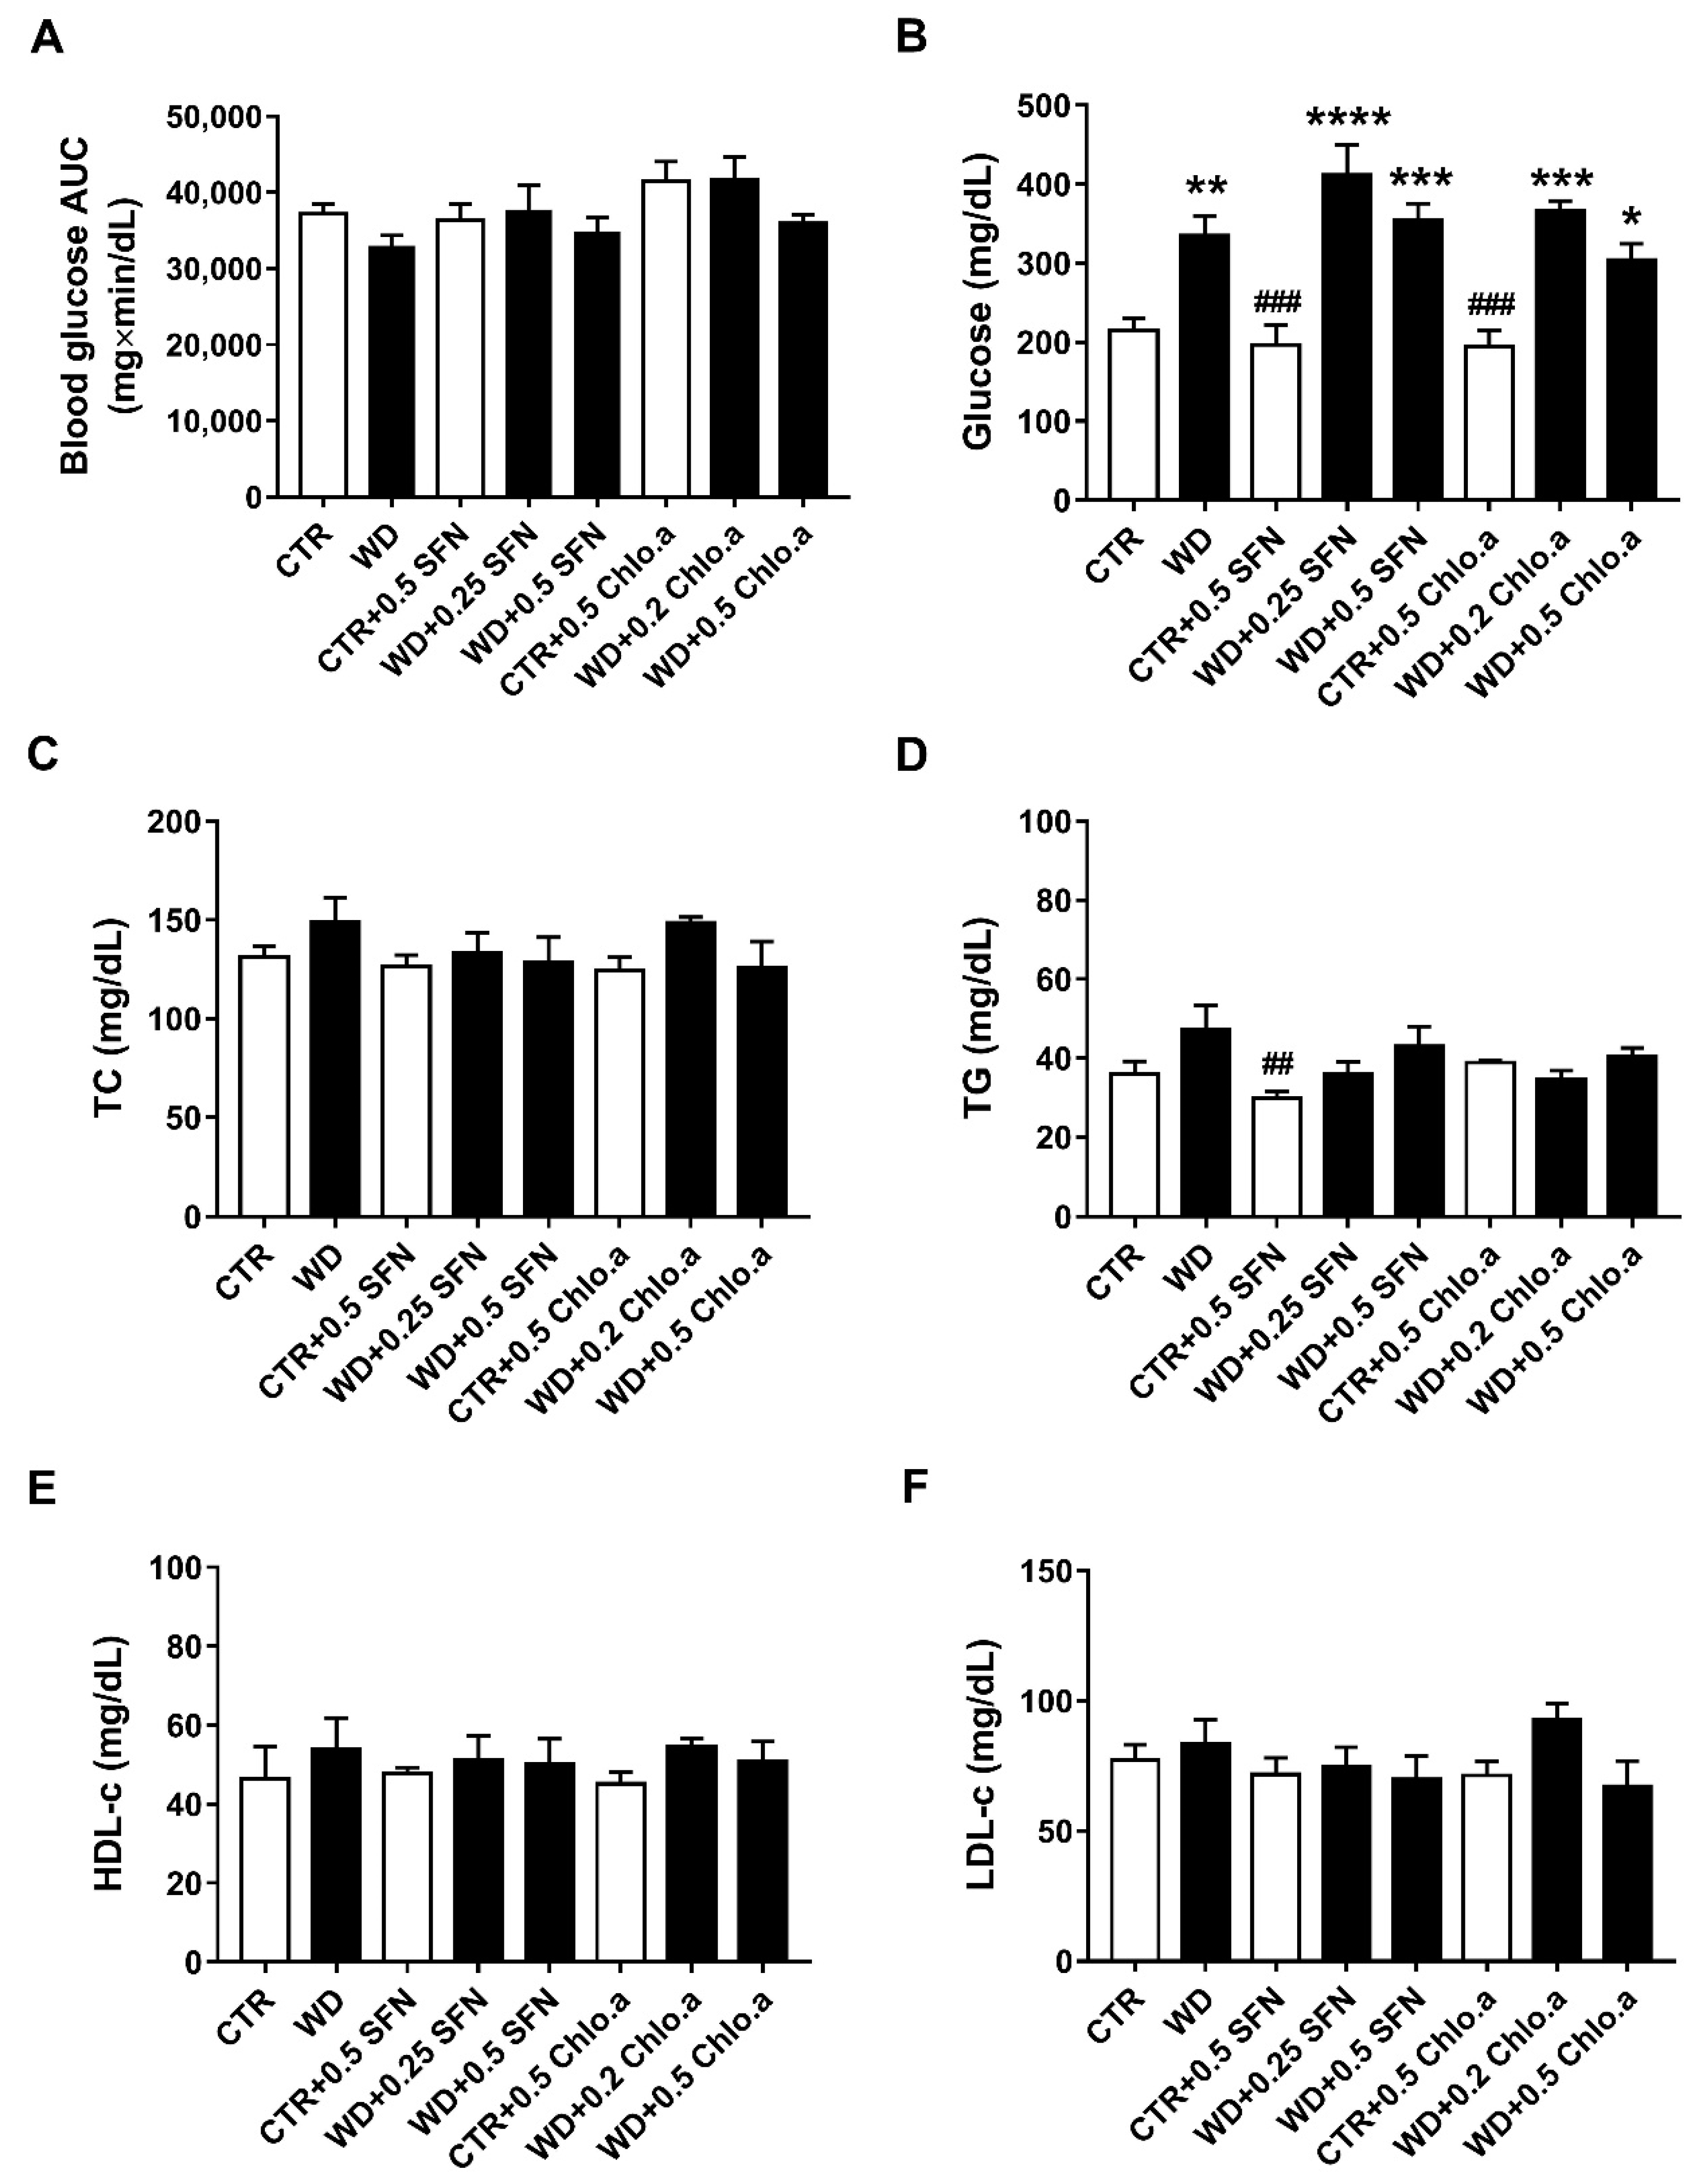
3.3. Glucose Tolerance and Lipid Profile

The intraperitoneal glucose tolerance test (IPGTT) was performed as there is a correlation between obesity and glucose tolerance. The IPGTT was conducted in the last week of the study. The blood glucose AUC analysis (Figure 4A) revealed no differences between the various experimental groups, indicating that there was no development of glucose intolerance in this animal model. Nevertheless, at the end of the study, regardless of SFN or Chlo.a supplementation, all groups fed a Western diet showed the highest glycaemic levels (Figure 4B), which were statistically different (p < 0.05) from CTR, showing no influence of SFN or Chlo.a treatment in plasmatic glucose levels. However, concerning the plasma levels of TG, TC, HDL-c and estimated levels of LDL-c (Figure 4C–F), in general, no significant differences were found between the experimental groups in our study, showing no alterations induced by the diet or treatment.

3.4. Effects of SFN on Liver Fatty Changes and Hepatic Oxidative Stress

In general, the groups fed with a Western diet, regardless of SFN or Chlo.a supplementation, had the highest relative liver weights, differing (p < 0.05) from the CTR group, that showed the lowest value (Table 2). Also, all of the mice from the CTR and CTR + 0.5 SFN groups presented a normal liver, while six animals in the WD and WD + 0.5 SFN groups showed hepatic steatosis, differing statistically (p < 0.05) from the CTR group (Table 2). The other groups supplemented with SFN or Chlo.a also showed liver alterations in some of the animals but did not differ significantly from the CTR or WD groups. Nonetheless, no statistical differences were observed among the groups regarding liver fat changes, distribution of lesions and multifocal hepatitis (Table 2).
In our work, the oxidative stress was evaluated by the levels of OSI, ROS and LPO (Figure 5A, Figure 5B and Figure 5C, respectively). Concerning OSI, expressed as the GSH/GSSG ratio, in general, no differences among groups were found, with the only significant increase being verified in the CTR + 0.5 Chlo.a group compared to the WD group. Also, no significant differences were found between the experimental groups for the LPO, indicated by the levels of MDA. In turn, the supplementation with SFN or Chlo.a, independently of the diet increased (p < 0.05) the levels of hepatic ROS compared to the CTR or WD groups. With regard to the hepatic antioxidant response, this was assessed by the levels of some antioxidant enzymes, namely, SOD, catalase, GPx and GST. In the present work, liver SOD activity was increased (p < 0.01) in the WD group and in all groups supplemented with SFN or Chlo.a, independently of the diet, compared to the CTR group (Figure 6A). Contrary, the levels of catalase, GPx and GST (Figure 6B, 6C and 6D, respectively) did not differ significantly among the groups.

4. Discussion

The present work evaluated the potential benefits of oral supplementation with SFN or Chlo.a for 4 weeks, in animals fed a Western diet. The results obtained showed that both compounds increased body temperature and reduced the size of adipocytes in obese mice, nevertheless, failed in the prevention of body weight gain and hepatic steatosis. Furthermore, both SFN and Chlo.a supplementation increased liver oxidative stress but counterbalanced this with an increase in SOD activity. Although some studies have reported the anti-obesogenic potential of SFN [17,22,23,24] or Chlo.a [28,29,30,31,32], in the present study, these effects are not as evident.
A mouse obesity model can be considered successful when the weight of the obese mice is more than 20% higher than that of control mice [61]. In our study, although the difference in weight gain between the WD and CTR groups was not statistically significant, the weight gain of WD mice was 22.9% higher than that of the CTR mice. The CTR + 0.5 Chlo.a group had the greatest weight gain, which may have been due to the high average daily food intake. On the other hand, WD + 0.5 Chlo.a group did not have a significant increase in weight gain compared to CTR, despite consuming the largest amount of food daily. Random assignment was used to avoid selection bias, however, it can result in unequal allocation [62]. In our work, mice were randomly assigned, but this resulted in significant initial body weight differences between the WD + 0.5 SFN and WD + 0.2 Chlo.a groups compared to the WD group. These differences between the groups may have influenced results such as food intake or weight gain.
In general, in the present work, neither SFN nor Chlo.a effectively reduced diet-induced weight gain. In the study of Huo and co-workers [63], SFN (5, 10 and 20 mg/kg/day) was administered daily by gavage for 6 weeks to C57BL/6 male mice after 8 weeks of being fed a HFD. In that study, and in accordance with our results, the treatment with SFN did not decrease the body weight of mice [63]. Also, in another study, after 8 weeks of HFD feeding, the oral administration of SFN (100 μmol/kg; three times per week for 6 weeks) did not reduce the body weight of the HFD-obese C57BL/6J male mice [64]. On the other hand, using a mouse model of Western diet-induced obesity, Shawky and collaborators [23] demonstrated that daily subcutaneous injections of SFN (0.5 mg/kg/day; for 3 weeks) significantly decreased weight gain by around 52% in C57BL/6J male mice after 5 weeks of Western diet feeding. In the work of Liu and colleagues [22], the daily intraperitoneal injections of SFN (10 mg/kg/day; for 36 days) attenuated HFD-induced weight gain in female C57BL/6J mice. Similarly, Tian and colleagues [24], using male C57BL/6J mice fed with a HFD, showed that the daily gavage of SFN (10 mg/kg/day; for 8 weeks) was able to attenuate weight gain, without differences in the food intake. Also, Ashmawy and co-workers [65] recently demonstrated that, after 6 weeks of HFD feeding, the daily oral supplementation with SFN (0.5 or 1 mg/kg/day; for 6 weeks) significantly decreased the HFD-induced weight gain in male Wistar rats. The work of Çakir and collaborators [66] also demonstrated that HFD-fed C57BL/6J mice daily injected with SFN (10 mg/kg) for 8 consecutive weeks, showed a reduction in the weight gain induced by the HFD. Recently, Zhang and colleagues [67], demonstrated that subcutaneous injections of SFN (0.5 mg/kg; 5 times a week and for 8 weeks) significantly decreased weight gain in male ICR mice after 8 weeks of HFD feeding, without changes in food intake. Concerning Chlo.a data, contrary to our results, Li and colleagues [33] demonstrated that supplementation with chlorophyll extract from spinach (18 mg/kg/day; daily gavage for 13 weeks), in early life male C57BL/6J mice can effectively retard body weight gain induced by a HFD. In another study, the same authors also showed that oral supplementation with a chlorophyll-rich spinach extract (18 mg/kg/day; daily gavage for 13 weeks) in male C57BL/6J mice that were fed a HFD significantly attenuated the weight gain induced by HFD [34].
We report that the supplementation with SFN or Chlo.a significantly elevated the body temperature of mice fed the Western diet compared to WD group. In the study of Nagata and co-workers [68], male C57BL/6JSlc mice fed with a HFD containing 0.3% glucoraphanin, the precursor of SFN, for 14 weeks, had an increase in core body temperature by approximately 0.5 °C. This was consistent with the increase in energy expenditure and a similar respiratory exchange ratio compared to the HFD group, leading the authors to suggest that glucoraphanin supplementation enhanced sugar and fat use under HFD conditions [68]. The supplementation with ginseng had also been shown to induce an increase in body temperature in mice fed a HFD, however, energy expenditure, respiration rate, and locomotive activity were not significantly altered [69]. Body temperature is usually lower in obese individuals than in non-obese individuals [70,71,72]. Individuals with more efficient metabolic characteristics have a lower capacity to dissipate energy and store a greater proportion of excess calories in the form of fat, being prone to obesity, while, conversely, those whose metabolism is less efficient dissipate more calories in the form of heat [73]. Under starvation, one of the physiological responses to conserve energy is a decrease in metabolic rate, leading to more efficient storage of calories as fat, however, this characteristic would predispose to obesity in the face of excess food [73]. During starvation, body temperature also declines, contributing to the decrease in metabolic rate observed in this state [74]. Also, during torpor in mammals, the decrease in metabolic rate is caused by the decrease in temperature [75,76]. On the other hand, an increase of 1 °C in core temperature is associated with a 10 to 13% increase in metabolic rate [77,78].
In our work, supplementation with SFN or Chlo.a for 4 weeks did not significantly reduce Western diet-induced epididymal and retroperitoneal fat accumulation, although both compounds were able to mitigate adipose tissue hypertrophy. In accordance, the study from Shawky and co-workers [23] demonstrated that Western diet-induced obese mice supplemented with SFN showed a decrease in epididymal fat weight by around 19.8% but without reaching statistical significance. Nevertheless, SFN treatment was able to significantly reduce the adipocyte area by around 19.3% compared with the Western diet group [23]. The work of Liu and colleagues [22] with HFD-fed mice demonstrated that SFN supplementation reduced the weight of the inguinal fat pad, as well as the cell sizes of inguinal and visceral fat adipose tissues. Other recent studies also showed that SFN prevented the accumulation of adipose tissue, reduced the adipocyte size and increased the adipocyte number in mice fed a HFD [24,66,67]. In the study of Li and co-workers [33], chlorophyll supplementation in the early lives of HFD-fed mice ameliorated the weight gain of the epididymal, perirenal and inguinal white adipose tissue. Also, HFD-fed mice supplemented with a chlorophyll-rich spinach extract showed a significant decrease in the accumulation of epididymal, perirenal and inguinal adipose tissues [34]. Obesity-mediated inflammation in adipose tissue was not addressed in our work. Nevertheless, previous studies demonstrated that obesity is linked to higher levels of pro-inflammatory cytokines in adipose tissue and liver, leading to insulin resistance and non-alcoholic fatty liver disease (NAFLD) [79,80]. Glucoraphanin supplementation was reported to markedly reduced the increase of pro-inflammatory cytokines in the liver, suppress inflammatory pathways, and decrease hepatic expression of macrophage markers induced by HFD [68]. Glucoraphanin treatment also decreased the mRNA expression of Tnf-α and NADPH oxidase and the number of M1-like macrophages in the epididymal adipose tissue of HFD-fed mice [68]. Recently, another ex vivo and in vitro work demonstrated that SFN reduced the release of the pro-inflammatory cytokines TNF-α and IL-6, and myeloperoxidase from azurophilic granules in whole blood, and was able to suppress the phagocytic activity of neutrophils, as well as the production of ROS in whole blood and neutrophils [21]. In turn, chlorophyll supplementation significantly decreased the serum levels of LPS and TNF-α in HFD-fed mice [33,34].
In our work, IGTT was only measured at week 14 at the end of the experiment, as in similar studies [22,24,33,34,67]. The objective was to compare only the differences between treatments at the end of the study. However, an initial measurement at week 10, before the start of supplementation, could have provided additional information, as well as taking into account phenotypic differences in the blood glucose concentrations of each mouse. In our animal model, glucose intolerance did not develop. Furthermore, SFN or Chlo.a supplementation was not able to reduce glycemia in animals fed a Western diet. Also, in general, no changes were observed in the lipid profile of the experimental groups, despite Western diets having been reported to induce dyslipidaemia [23,81]. Other studies demonstrated that supplementation with SFN successfully ameliorated glucose intolerance and the plasma lipid profile of obese mice [19,22,23,24,64,65,66]. The work of Shawky and colleagues [23] demonstrated that in diet-induced obese mice, SFN significantly improved the metabolic parameters, including glucose tolerance, with a reduction in the AUC GTT by around 24%, and plasma lipid profile. Although SFN treatment did not affect TC levels, it significantly decreased TG and very low-density lipoprotein cholesterol (VLDL-C) levels by around 31.1%. SFN also decreased the levels of LDL-c (by 16.3%), LDL-c/HDL-c ratio (by 23.4%), non-HDL-c (by 18.6%) and free fatty acids (by 49.1%) and increased HDL-c levels (by 1.1-fold); however, these changes were not statistically significant compared with the obese group [23]. Also, in another study with HFD-fed mice, the oral administration of SFN improved glucose tolerance and reduced significantly the serum concentration of glucose, TC and LDL-c [24]. In the work of Zhang and co-workers [67], the treatment with SFN in HFD-fed mice significantly improved glucose homeostasis, and lowered the serum levels of TC, TG, LDL-c and FFA as well as the hepatic levels of TC and TG. The work of Ranaweera and co-workers [19] demonstrated that the daily administration of SFN (0.5 mg/kg) in drinking water for 6 weeks significantly reduced the content of TG, LDL-c, TC, and glucose in the serum of male ob/ob mice. Also, chlorophyll supplementation in early life was shown to improve glucose tolerance in HFD-fed mice [33]. Likewise, the treatment with chlorophyll-rich spinach extract significantly decreased fasting blood glucose, improved glucose tolerance, and significantly decreased plasma TC and TG, and increased HDL in HFD-fed mice [34]. However, in the work of Freitas and colleagues [29], in the zebrafish Nile red fat metabolism assay, after 48 h of zebrafish larvae water exposure to chlorophyll a and b (0.3125 to 10 µg/mL), the results showed that both compounds have no lipid-reducing activity, in contrast to chlorophyll a derivatives 132-hydroxy-pheophytin a and 132-hydroxy-pheofarnesin a (0.3125 to 10 µg/mL) which had an effect [29].
The development of fatty changes in the liver, also known as hepatic steatosis, is common in diet-induced obese mice [22,24,68,82]. In the present work, the supplementation with SFN or Chlo.a failed to reduce the increase in liver weight and hepatic steatosis induced by the Western diet. In a study by Li and collaborators [33], chlorophyll supplementation in early life of HFD-fed mice also had no beneficial effect on reducing liver weight. Other studies reported that the treatment with SFN was able to mitigate the liver steatosis caused by a HFD in mice [22,24]. Also, glucoraphanin supplementation was reported to attenuate the increase in liver weight and hepatic steatosis induced by HFD [68]. Previous work also showed that SFN supplementation improved hepatic steatosis in ob/ob mice [19]. To our knowledge, the effects of chlorophyll on liver fat changes caused by obesity have not yet been reported. Concerning hepatic oxidative stress, in our study, the Western diet per se seemed to have no effect, while SFN or Chlo.a appeared to exacerbate it. The pharmacological actions of SFN in vitro and in vivo are cell/tissue type dependent [25]. In fact, SFN is an indirect antioxidant and inducer of antioxidant response element (ARE) genes, however, SFN may have a pro-oxidant action. In cancer cell lines, exposure to SFN has been shown to induce an increase in ROS levels leading to cell death [83,84,85]. Contrariwise, in obesity studies, SFN administration in mice has been shown to prevent increased levels of hepatic MDA by HFD [24,63,67]. To our knowledge, no study has reported the ability of Chlo.a to increase ROS levels. In fact, chlorophyll has been shown to attenuate oxidative stress [27,51,86]; however, research on the potential antioxidant activity of natural chlorophylls is still scarce. Since the levels of alanine aminotransferase (ALT) and aspartate aminotransferase (AST) were not evaluated in the present study, it is not possible to draw conclusions about the hepatotoxic potential of SFN or Chlo.a. In fact, SFN or glucoraphanin supplementation have been shown to significantly attenuate the HFD-induced increase in serum ALT and AST [67,68]. Regarding the hepatic antioxidant response, SFN or Chlo.a supplementation increased SOD activity in almost all groups, having no effect on the remaining antioxidant enzymes analysed. Accordingly, in the work of Huo and co-workers [63], the administration of SFN in HFD-fed mice also augmented the levels of SOD activity, but catalase levels remained similar between the experimental groups. In the study of Tian and collaborators [24], SOD activity was also increased in HFD-fed mice administered with SFN. Although no studies with chlorophyll effects in liver oxidative stress has been reported, an in vitro study showed that the incubation of Aβ1-42-treated PC12 cells with chlorophyll a resulted in the reduction of oxidative stress and increased the expression of antioxidant enzymes, namely GSH, SOD2 and glutathione reductase [87]. In general, in our study, the administration of SFN or Chlo.a stimulated hepatic ROS production and SOD activity, suggesting that both compounds may exert pro-oxidant actions at the doses administered, but counteract with an antioxidant response.
Some results presented in our work were not consistent with those reported in previous studies. Differences between experimental designs may contribute to this. The lack of standardization in terms of the composition of diets and feeding protocols between studies is one limitation of these type of research. This usually results in inconsistent and irreproducible data, thus leading to differences in experimental results obtained between similar studies [88]. In fact, a recent systematic review shows that hypercaloric diets per se can inflict changes in oxidative stress markers, depending on their composition and duration of feeding protocols [89]. Furthermore, the heterogeneity may depend on the type of obesity model, strains or rodent species, and the treatment (dosage, route of administration, and duration). Although, in a recent systematic review and meta-analysis concerning the benefits of SFN in animal models of obesity, the authors stated that the variability among studies are not explained by the differences in disease models, species, SFN dosage, administration route and time of treatment [17]. In our animal model, some obesogenic effects were not so prominent, which could also mask the potential beneficial effects that SFN or Chlo.a could exert. Actually, some animals may be obesity-resistant [64,90], which accounts to a limitation of the present work. Stress is interrelated with obesity, but there are interindividual variations in this complex relationship [91]. It is known that stress influences eating behaviours and energy homeostasis in both humans and rodents, and these changes can range from an increase in food intake to a decrease in calorie consumption and body weight loss [92]. The route of administration of experimental compounds is one of many external sources of stress inflicted on animals, and it is not clear whether in some obesity studies the stress induced by the administration is not altering the final observation. Potentially, some research animal models, namely those that require immobilization, for example the injectable and gavage routes of administration, may induce higher levels of stress compared to techniques that use less animal restraint. Although oral gavage increases heart rate, blood pressure and corticosterone levels, it has been reported that mice and rats can adapt to this method within a few days by habituation to restraint and gavage, or by using a soft gavage tube or coating the gavage needle with sucrose solution [93]. However, the risks of oesophageal and gastric rupture, gastric distention, aspiration pneumonia and death should not be ignored [93,94,95,96]. In this study, as in similar studies [22,24,33,34,67], animals were group-housed, making it difficult to determine the exact individual food intake, thus ignoring phenotypic differences in the food intake of each mouse. Furthermore, there is always some food that falls into the cage and is wasted. More accurate individual food intake could have been achieved with individually housed animals. However, mice are social animals that should be grouped together, especially in long studies, to avoid compromising animal welfare [52,53]. However, all groups are in the same conditions and food consumption calculations end up reflecting an estimate. Furthermore, stress and behaviour-induced bias are reduced with this design. Another limitation of the preclinical models themselves is that the results cannot be directly interpolated to humans, from the complexity of human diseases that cannot be expressed exactly, to the metabolic differences between species that influence the effective doses [97].

5. Conclusions

In the present study, supplementation with SFN or Chlo.a had slight improvements against obesity by rising body temperature and reducing the area and volume of adipocytes. Although, neither SFN nor Chlo.a was able to prevent Western diet-induced hepatic steatosis. In addition, SFN or Chlo.a may also exert pro-oxidant actions in the liver at the doses administered. Further analyses are needed to clarify the potential benefits of both compounds in this animal model of obesity. Similar to other works that tested these compounds after the development of obesity, in the present work we also tested a therapeutic approach which mimics human behaviour in the sense that many people tend to act only after becoming aware of the problem they face. Future research should focus on a preventive approach by administering the SFN or Chlo.a from the start of the experimental diets, or testing higher doses, which may reveal more pronounced anti-obesity effects of these compounds than those reported in this work.

Author Contributions

Conceptualization, T.M., C.V., P.A.O. and L.M.A.; methodology, T.M., C.V., P.A.O. and L.M.A.; formal analysis, T.M.; investigation, T.M., A.F.M., J.S., R.L., M.J.P., M.d.L.P., M.J.N., S.M.M., A.R.S., L.F. and P.A.O.; resources, M.d.L.P., M.J.N. and S.M.M.; data curation, T.M.; writing—original draft preparation, T.M.; writing—review and editing, T.M. and L.M.A.; visualization, T.M.; funding acquisition, E.R. All authors have read and agreed to the published version of the manuscript.

Funding

This work was funded by the Portuguese Foundation for Science and Technology (FCT) and co-financed by the European Regional Development Fund (FEDER) through COMPETE 2020—Operational Competitiveness and Internationalization Programme (POCI), grant PTDC/ASP-HOR/29152/2017, POCI-01-0145-FEDER-029152 (VALORIZEBYPRODUCTS). This work was also supported by National Funds by FCT—Portuguese Foundation for Science and Technology, under the project UIDB/04033/2020.

Institutional Review Board Statement

The animal study protocol was approved by the Animal Welfare and Ethical Review Body of University of Trás-os-Montes and Alto Douro (UTAD) and by the national competent authority Direção-Geral de Alimentação e Veterinária (DGAV, Lisbon, Portugal; license nº 8776; 1 June 2020).

Informed Consent Statement

Not applicable.

Data Availability Statement

Dataset will be provided upon reasonable request.

Conflicts of Interest

The authors declare that they have no competing interest.

References

  1. Tremmel, M.; Gerdtham, U.G.; Nilsson, P.M.; Saha, S. Economic Burden of Obesity: A Systematic Literature Review. Int. J. Environ. Res. Public Health 2017, 14, 435. [Google Scholar] [CrossRef] [PubMed]
  2. Avgerinos, K.I.; Spyrou, N.; Mantzoros, C.S.; Dalamaga, M. Obesity and cancer risk: Emerging biological mechanisms and perspectives. Metabolism 2019, 92, 121–135. [Google Scholar] [CrossRef] [PubMed]
  3. Bremner, J.D.; Moazzami, K.; Wittbrodt, M.T.; Nye, J.A.; Lima, B.B.; Gillespie, C.F.; Rapaport, M.H.; Pearce, B.D.; Shah, A.J.; Vaccarino, V. Diet, Stress and Mental Health. Nutrients 2020, 12, 2428. [Google Scholar] [CrossRef] [PubMed]
  4. Kramer, H. Diet and Chronic Kidney Disease. Adv. Nutr. 2019, 10, S367–S379. [Google Scholar] [CrossRef]
  5. Piché, M.E.; Tchernof, A.; Després, J.P. Obesity Phenotypes, Diabetes, and Cardiovascular Diseases. Circ. Res. 2020, 126, 1477–1500. [Google Scholar] [CrossRef]
  6. Stefan, N.; Häring, H.-U.; Cusi, K. Non-alcoholic fatty liver disease: Causes, diagnosis, cardiometabolic consequences, and treatment strategies. Lancet Diabetes Endocrinol. 2019, 7, 313–324. [Google Scholar] [CrossRef]
  7. Visscher, T.L.S.; Snijder, M.B.; Seidell, J.C. Epidemiology: Definition and classification of obesity. In Clinical Obesity in Adults and Children, 3rd ed.; Kopelman, P.G., Caterson, I.D., Dietz, W.H., Eds.; Wiley-Blackwell: Hoboken, NJ, USA, 2010; pp. 3–14. [Google Scholar]
  8. WHO. Obesity and Overweight. Available online: https://www.who.int/news-room/fact-sheets/detail/obesity-and-overweight (accessed on 28 June 2023).
  9. Caballero, B. Humans against Obesity: Who Will Win? Adv. Nutr. 2019, 10, S4–S9. [Google Scholar] [CrossRef]
  10. Goodarzi, M.O. Genetics of obesity: What genetic association studies have taught us about the biology of obesity and its complications. Lancet Diabetes Endocrinol. 2018, 6, 223–236. [Google Scholar] [CrossRef]
  11. Wright, S.M.; Aronne, L.J. Causes of obesity. Abdom. Imaging 2012, 37, 730–732. [Google Scholar] [CrossRef]
  12. Bhardwaj, M.; Yadav, P.; Vashishth, D.; Sharma, K.; Kumar, A.; Chahal, J.; Dalal, S.; Kataria, S.K. A Review on Obesity Management through Natural Compounds and a Green Nanomedicine-Based Approach. Molecules 2021, 26, 3278. [Google Scholar] [CrossRef]
  13. Patra, J.K.; Das, G.; Fraceto, L.F.; Campos, E.V.R.; Rodriguez-Torres, M.d.P.; Acosta-Torres, L.S.; Diaz-Torres, L.A.; Grillo, R.; Swamy, M.K.; Sharma, S.; et al. Nano based drug delivery systems: Recent developments and future prospects. J. Nanobiotechnol. 2018, 16, 71. [Google Scholar] [CrossRef] [PubMed]
  14. Vaou, N.; Stavropoulou, E.; Voidarou, C.; Tsigalou, C.; Bezirtzoglou, E. Towards Advances in Medicinal Plant Antimicrobial Activity: A Review Study on Challenges and Future Perspectives. Microorganisms 2021, 9, 2041. [Google Scholar] [CrossRef] [PubMed]
  15. Scott, S.E.; Rozin, P.; Small, D.A. Consumers Prefer “Natural” More for Preventatives Than for Curatives. J. Consum. Res. 2020, 47, 454–471. [Google Scholar] [CrossRef]
  16. Aranaz, P.; Navarro-Herrera, D.; Romo-Hualde, A.; Zabala, M.; López-Yoldi, M.; González-Ferrero, C.; Gil, A.G.; Alfredo Martinez, J.; Vizmanos, J.L.; Milagro, F.I.; et al. Broccoli extract improves high fat diet-induced obesity, hepatic steatosis and glucose intolerance in Wistar rats. J. Funct. Foods 2019, 59, 319–328. [Google Scholar] [CrossRef]
  17. Du, K.; Fan, Y.; Li, D. Sulforaphane ameliorates lipid profile in rodents: An updated systematic review and meta-analysis. Sci. Rep. 2021, 11, 7804. [Google Scholar] [CrossRef]
  18. Martins, T.; Colaco, B.; Venancio, C.; Pires, M.J.; Oliveira, P.A.; Rosa, E.; Antunes, L.M. Potential Effects of Sulforaphane to Fight Obesity. J. Sci. Food Agric. 2018, 98, 2837–2844. [Google Scholar] [CrossRef]
  19. Ranaweera, S.S.; Natraj, P.; Rajan, P.; Dayarathne, L.A.; Mihindukulasooriya, S.P.; Dinh, D.T.T.; Jee, Y.; Han, C.H. Anti-obesity effect of sulforaphane in broccoli leaf extract on 3T3-L1 adipocytes and ob/ob mice. J. Nutr. Biochem. 2022, 100, 108885. [Google Scholar] [CrossRef]
  20. Masuda, M.; Yoshida-Shimizu, R.; Mori, Y.; Ohnishi, K.; Adachi, Y.; Sakai, M.; Kabutoya, S.; Ohminami, H.; Yamanaka-Okumura, H.; Yamamoto, H.; et al. Sulforaphane induces lipophagy through the activation of AMPK-mTOR-ULK1 pathway signaling in adipocytes. J. Nutr. Biochem. 2022, 106, 109017. [Google Scholar] [CrossRef]
  21. Wakasugi-Onogi, S.; Ma, S.; Ruhee, R.T.; Tong, Y.; Seki, Y.; Suzuki, K. Sulforaphane Attenuates Neutrophil ROS Production, MPO Degranulation and Phagocytosis, but Does Not Affect NET Formation Ex Vivo and In Vitro. Int. J. Mol. Sci. 2023, 24, 8479. [Google Scholar] [CrossRef]
  22. Liu, Y.; Fu, X.; Chen, Z.; Luo, T.; Zhu, C.; Ji, Y.; Bian, Z. The Protective Effects of Sulforaphane on High-Fat Diet-Induced Obesity in Mice Through Browning of White Fat. Front. Pharmacol. 2021, 12, 665894. [Google Scholar] [CrossRef]
  23. Shawky, N.M.; Pichavaram, P.; Shehatou, G.S.; Suddek, G.M.; Gameil, N.M.; Jun, J.Y.; Segar, L. Sulforaphane improves dysregulated metabolic profile and inhibits leptin-induced VSMC proliferation: Implications toward suppression of neointima formation after arterial injury in western diet-fed obese mice. J. Nutr. Biochem. 2016, 32, 73–84. [Google Scholar] [CrossRef] [PubMed]
  24. Tian, S.; Wang, Y.; Li, X.; Liu, J.; Wang, J.; Lu, Y. Sulforaphane Regulates Glucose and Lipid Metabolisms in Obese Mice by Restraining JNK and Activating Insulin and FGF21 Signal Pathways. J. Agri. Food Chem. 2021, 69, 13066–13079. [Google Scholar] [CrossRef] [PubMed]
  25. Etoh, K.; Nakao, M. A web-based integrative transcriptome analysis, RNAseqChef, uncovers the cell/tissue type-dependent action of sulforaphane. J. Biol. Chem. 2023, 299, 104810. [Google Scholar] [CrossRef]
  26. Björn, L.O.; Papageorgiou, G.C.; Blankenship, R.E.; Govindjee. A viewpoint: Why chlorophyll a? Photosynth. Res. 2009, 99, 85–98. [Google Scholar] [CrossRef]
  27. Martins, T.; Barros, A.N.; Rosa, E.; Antunes, L. Enhancing Health Benefits through Chlorophylls and Chlorophyll-Rich Agro-Food: A Comprehensive Review. Molecules 2023, 28, 5344. [Google Scholar] [CrossRef]
  28. Costa, M.; Rosa, F.; Ribeiro, T.; Hernandez-Bautista, R.; Bonaldo, M.; Gonçalves Silva, N.; Eiríksson, F.; Thorsteinsdóttir, M.; Ussar, S.; Urbatzka, R. Identification of Cyanobacterial Strains with Potential for the Treatment of Obesity-Related Co-Morbidities by Bioactivity, Toxicity Evaluation and Metabolite Profiling. Mar. Drugs 2019, 17, 280. [Google Scholar] [CrossRef]
  29. Freitas, S.; Silva, N.G.; Sousa, M.L.; Ribeiro, T.; Rosa, F.; Leão, P.N.; Vasconcelos, V.; Reis, M.A.; Urbatzka, R. Chlorophyll Derivatives from Marine Cyanobacteria with Lipid-Reducing Activities. Mar. Drugs 2019, 17, 229. [Google Scholar] [CrossRef] [PubMed]
  30. Liu, Y.H.; Lu, Y.L.; Chang, Y.C.; Chyuan, J.H.; Lee, T.H.; Hou, W.C. Anti-adipogenic activities of pheophorbide a and pyropheophorbide a isolated from wild bitter gourd (Momordica charantia L. var. abbreviata Seringe) in vitro. J. Sci. Food Agric. 2022, 102, 6771–6779. [Google Scholar] [CrossRef]
  31. Seo, Y.J.; Kim, K.J.; Choi, J.; Koh, E.J.; Lee, B.Y. Spirulina maxima Extract Reduces Obesity through Suppression of Adipogenesis and Activation of Browning in 3T3-L1 Cells and High-Fat Diet-Induced Obese Mice. Nutrients 2018, 10, 712. [Google Scholar] [CrossRef]
  32. Wang, X.; Li, Y.; Shen, S.; Yang, Z.; Zhang, H.; Zhang, Y. Chlorophyll Inhibits the Digestion of Soybean Oil in Simulated Human Gastrointestinal System. Nutrients 2022, 14, 1749. [Google Scholar] [CrossRef]
  33. Li, Y.; Cui, Y.; Hu, X.; Liao, X.; Zhang, Y. Chlorophyll Supplementation in Early Life Prevents Diet-Induced Obesity and Modulates Gut Microbiota in Mice. Mol. Nutr. Food Res. 2019, 63, e1801219. [Google Scholar] [CrossRef]
  34. Li, Y.; Cui, Y.; Lu, F.; Wang, X.; Liao, X.; Hu, X.; Zhang, Y. Beneficial effects of a chlorophyll-rich spinach extract supplementation on prevention of obesity and modulation of gut microbiota in high-fat diet-fed mice. J. Funct. Foods 2019, 60, 103436. [Google Scholar] [CrossRef]
  35. Sanmiguel, C.; Gupta, A.; Mayer, E.A. Gut Microbiome and Obesity: A Plausible Explanation for Obesity. Curr. Obes. Rep. 2015, 4, 250–261. [Google Scholar] [CrossRef] [PubMed]
  36. Martins, T.; Castro-Ribeiro, C.; Lemos, S.; Ferreira, T.; Nascimento-Gonçalves, E.; Rosa, E.; Oliveira, P.A.; Antunes, L.M. Murine Models of Obesity. Obesities 2022, 2, 127–147. [Google Scholar] [CrossRef]
  37. Martins, T.; Ferreira, T.; Nascimento-Gonçalves, E.; Castro-Ribeiro, C.; Lemos, S.; Rosa, E.; Antunes, L.M.; Oliveira, P.A. Obesity Rodent Models Applied to Research with Food Products and Natural Compounds. Obesities 2022, 2, 171–204. [Google Scholar] [CrossRef]
  38. Bortolin, R.C.; Vargas, A.R.; Gasparotto, J.; Chaves, P.R.; Schnorr, C.E.; Martinello, K.B.; Silveira, A.K.; Rabelo, T.K.; Gelain, D.P.; Moreira, J.C.F. A new animal diet based on human Western diet is a robust diet-induced obesity model: Comparison to high-fat and cafeteria diets in term of metabolic and gut microbiota disruption. Int. J. Obes. 2018, 42, 525–534. [Google Scholar] [CrossRef]
  39. Casimiro, I.; Stull, N.D.; Tersey, S.A.; Mirmira, R.G. Phenotypic sexual dimorphism in response to dietary fat manipulation in C57BL/6J mice. J. Diabetes Complicat. 2021, 35, 107795. [Google Scholar] [CrossRef]
  40. Gelineau, R.R.; Arruda, N.L.; Hicks, J.A.; Monteiro De Pina, I.; Hatzidis, A.; Seggio, J.A. The behavioral and physiological effects of high-fat diet and alcohol consumption: Sex differences in C57BL6/J mice. Brain Behav. 2017, 7, e00708. [Google Scholar] [CrossRef] [PubMed]
  41. Oraha, J.; Enriquez, R.F.; Herzog, H.; Lee, N.J. Sex-specific changes in metabolism during the transition from chow to high-fat diet feeding are abolished in response to dieting in C57BL/6J mice. Int. J. Obes. 2022, 46, 1749–1758. [Google Scholar] [CrossRef]
  42. Cox, H.M.; Tough, I.R.; Woolston, A.M.; Zhang, L.; Nguyen, A.D.; Sainsbury, A.; Herzog, H. Peptide YY is Critical for Acylethanolamine Receptor Gpr119-Induced Activation of Gastrointestinal Mucosal Responses. Cell Metab. 2010, 11, 532–542. [Google Scholar] [CrossRef]
  43. Dhawan, S.S.; Xia, S.; Tait, D.S.; Bundgaard, C.; Bowman, E.; Brown, V.J. Oral Dosing of Rodents Using a Palatable Tablet. Psychopharmacology 2018, 235, 1527–1532. [Google Scholar] [CrossRef] [PubMed]
  44. Flecknell, P.A.; Roughan, J.V.; Stewart, R. Use of Oral Buprenorphine (‘Buprenorphine Jello’) for Postoperative Analgesia in Rats—A Clinical Trial. Lab. Anim. 1999, 33, 169–174. [Google Scholar] [CrossRef] [PubMed]
  45. Zhang, L.; Lee, N.J.; Nguyen, A.D.; Enriquez, R.F.; Riepler, S.J.; Stehrer, B.; Yulyaningsih, E.; Lin, S.; Shi, Y.C.; Baldock, P.A.; et al. Additive Actions of the Cannabinoid and Neuropeptide Y Systems on Adiposity and Lipid Oxidation. Diabetes Obes. Metab. 2010, 12, 591–603. [Google Scholar] [CrossRef]
  46. Kronenberger, J.P.; Médioni, J. Food Neophobia in WIld and Laboratory Mice (Mus musculus domesticus). Behav. Process. 1985, 11, 53–59. [Google Scholar] [CrossRef]
  47. Martins, T.; Matos, A.F.; Soares, J.; Leite, R.; Pires, M.J.; Ferreira, T.; Medeiros-Fonseca, B.; Rosa, E.; Oliveira, P.A.; Antunes, L.M. Comparison of Gelatin Flavors for Oral Dosing of C57BL/6J and FVB/N Mice. J. Am. Assoc. Lab. Anim. Sci. 2022, 61, 89–95. [Google Scholar] [CrossRef] [PubMed]
  48. Rodríguez-Correa, E.; González-Pérez, I.; Clavel-Pérez, P.I.; Contreras-Vargas, Y.; Carvajal, K. Biochemical and nutritional overview of diet-induced metabolic syndrome models in rats: What is the best choice? Nutr. Diabetes 2020, 10, 24. [Google Scholar] [CrossRef] [PubMed]
  49. de Macedo, I.C.; de Freitas, J.S.; da Silva Torres, I.L. The Influence of Palatable Diets in Reward System Activation: A Mini Review. Adv. Pharmacol. Sci. 2016, 2016, 7238679. [Google Scholar] [CrossRef] [PubMed]
  50. Gallop, M.R.; Wilson, V.C.; Ferrante, A.W., Jr. Post-oral sensing of fat increases food intake and attenuates body weight defense. Cell Rep. 2021, 37, 109845. [Google Scholar] [CrossRef]
  51. Serpeloni, J.M.; Grotto, D.; Aissa, A.F.; Mercadante, A.Z.; Bianchi Mde, L.; Antunes, L.M. An evaluation, using the comet assay and the micronucleus test, of the antigenotoxic effects of chlorophyll b in mice. Mutat. Res. 2011, 725, 50–56. [Google Scholar] [CrossRef]
  52. Capdevila, S.; Kelly, H. No One Likes to Live Alone: Social Housing of Lab Animals; ALN Magazine: Amherst, NH, USA, 2016. [Google Scholar]
  53. Kappel, S.; Hawkins, P.; Mendl, M.T. To Group or Not to Group? Good Practice for Housing Male Laboratory Mice. Animals 2017, 7, 88. [Google Scholar] [CrossRef]
  54. Corino, C.; Di Giancamillo, A.; Rossi, R.; Domeneghini, C. Dietary conjugated linoleic acid affects morphofunctional and chemical aspects of subcutaneous adipose tissue in heavy pigs. J. Nutr. 2005, 135, 1444–1450. [Google Scholar] [CrossRef]
  55. Pascual-Serrano, A.; Arola-Arnal, A.; Suarez-Garcia, S.; Bravo, F.I.; Suarez, M.; Arola, L.; Blade, C. Grape seed proanthocyanidin supplementation reduces adipocyte size and increases adipocyte number in obese rats. Int. J. Obes. 2017, 41, 1246–1255. [Google Scholar] [CrossRef] [PubMed]
  56. Gartaganis, S.P.; Patsoukis, N.E.; Nikolopoulos, D.K.; Georgiou, C.D. Evidence for oxidative stress in lens epithelial cells in pseudoexfoliation syndrome. Eye 2007, 21, 1406–1411. [Google Scholar] [CrossRef] [PubMed]
  57. LeBel, C.P.; Ischiropoulos, H.; Bondy, S.C. Evaluation of the probe 2′,7′-dichlorofluorescin as an indicator of reactive oxygen species formation and oxidative stress. Chem. Res. Toxicol. 1992, 5, 227–231. [Google Scholar] [CrossRef] [PubMed]
  58. Wallin, B.; Rosengren, B.; Shertzer, H.G.; Camejo, G. Lipoprotein Oxidation and Measurement of Thiobarbituric Acid Reacting Substances Formation in a Single Microtiter Plate—Its Use for Evaluation of Antioxidants. Anal. Biochem. 1993, 208, 10–15. [Google Scholar] [CrossRef] [PubMed]
  59. Durak, I.; Yurtarslanl, Z.; Canbolat, O.; Akyol, O. A methodological approach to superoxide dismutase (SOD) activity assay based on inhibition of nitroblue tetrazolium (NBT) reduction. Clin. Chim. Acta 1993, 214, 103–104. [Google Scholar] [CrossRef]
  60. Nakamura, W.; Hosoda, S.; Hayashi, K. Purification and properties of rat liver glutathione peroxidase. Biochim. Biophys. Acta Enzymol. 1974, 358, 251–261. [Google Scholar] [CrossRef]
  61. Lu, S.F.; Tang, Y.X.; Zhang, T.; Fu, S.P.; Hong, H.; Cheng, Y.; Xu, H.X.; Jing, X.Y.; Yu, M.L.; Zhu, B.M. Electroacupuncture Reduces Body Weight by Regulating Fat Browning-Related Proteins of Adipose Tissue in HFD-Induced Obese Mice. Front. Psychiatry 2019, 10, 353. [Google Scholar] [CrossRef] [PubMed]
  62. Kim, J.; Shin, W. How to do random allocation (randomization). Clin. Orthop. Surg. 2014, 6, 103–109. [Google Scholar] [CrossRef] [PubMed]
  63. Huo, L.; Su, Y.; Xu, G.; Zhai, L.; Zhao, J. Sulforaphane Protects the Male Reproductive System of Mice from Obesity-Induced Damage: Involvement of Oxidative Stress and Autophagy. Int. J. Environ. Res. Public Health 2019, 16, 3759. [Google Scholar] [CrossRef]
  64. Xu, Y.; Fu, J.F.; Chen, J.H.; Zhang, Z.W.; Zou, Z.Q.; Han, L.Y.; Hua, Q.H.; Zhao, J.S.; Zhang, X.H.; Shan, Y.J. Sulforaphane ameliorates glucose intolerance in obese mice via the upregulation of the insulin signaling pathway. Food Funct. 2018, 9, 4695–4701. [Google Scholar] [CrossRef] [PubMed]
  65. Ashmawy, A.I.; El-Abhar, H.S.; Abdallah, D.M.; Ali, M.A. Chloroquine modulates the sulforaphane anti-obesity mechanisms in a high-fat diet model: Role of JAK-2/STAT-3/SOCS-3 pathway. Eur. J. Pharmacol. 2022, 927, 175066. [Google Scholar] [CrossRef]
  66. Çakır, I.ı.; Lining Pan, P.; Hadley, C.K.; El-Gamal, A.; Fadel, A.; Elsayegh, D.; Mohamed, O.; Rizk, N.M.; Ghamari-Langroudi, M. Sulforaphane reduces obesity by reversing leptin resistance. eLife 2022, 11, e67368. [Google Scholar] [CrossRef] [PubMed]
  67. Zhang, Y.; Wu, Q.; Liu, J.; Zhang, Z.; Ma, X.; Zhang, Y.; Zhu, J.; Thring, R.W.; Wu, M.; Gao, Y.; et al. Sulforaphane alleviates high fat diet-induced insulin resistance via AMPK/Nrf2/GPx4 axis. Biomed Pharmacother. 2022, 152, 113273. [Google Scholar] [CrossRef]
  68. Nagata, N.; Xu, L.; Kohno, S.; Ushida, Y.; Aoki, Y.; Umeda, R.; Fuke, N.; Zhuge, F.; Ni, Y.; Nagashimada, M.; et al. Glucoraphanin ameliorates obesity and insulin resistance through adipose tissue browning and reduction of metabolic endotoxemia in mice. Diabetes 2017, 66, 1222–1236. [Google Scholar] [CrossRef] [PubMed]
  69. Li, X.; Luo, J.; Anandh Babu, P.V.; Zhang, W.; Gilbert, E.; Cline, M.; McMillan, R.; Hulver, M.; Alkhalidy, H.; Zhen, W.; et al. Dietary supplementation of chinese ginseng prevents obesity and metabolic syndrome in high-fat diet-fed mice. J. Med. Food 2014, 17, 1287–1297. [Google Scholar] [CrossRef]
  70. Jurgens, H.S.; Schurmann, A.; Kluge, R.; Ortmann, S.; Klaus, S.; Joost, H.G.; Tschop, M.H. Hyperphagia, lower body temperature, and reduced running wheel activity precede development of morbid obesity in New Zealand obese mice. Physiol. Genom. 2006, 25, 234–241. [Google Scholar] [CrossRef]
  71. Piccione, G.; Giudice, E.; Fazio, F.; Refinetti, R. Association between obesity and reduced body temperature in dogs. Int. J. Obes. 2011, 35, 1011–1018. [Google Scholar] [CrossRef]
  72. Savastano, D.M.; Gorbach, A.M.; Eden, H.S.; Brady, S.M.; Reynolds, J.C.; Yanovski, J.A. Adiposity and human regional body temperature. Am. J. Clin. Nutr. 2009, 90, 1124–1131. [Google Scholar] [CrossRef] [PubMed]
  73. Landsberg, L.; Young, J.B.; Leonard, W.R.; Linsenmeier, R.A.; Turek, F.W. Is obesity associated with lower body temperatures? Core temperature: A forgotten variable in energy balance. Metabolism 2009, 58, 871–876. [Google Scholar] [CrossRef]
  74. Keys, A.; Brožek, J.; Henschel, A.; Mickelsen, O.; Taylor, H.L. The Biology of Human Starvation; University of Minnesota Press: Minneapolis, MN, USA, 1950; p. 763. [Google Scholar]
  75. Geiser, F. Reduction of metabolism during hibernation and daily torpor in mammals and birds: Temperature effect or physiological inhibition? J. Comp. Physiol. B 1988, 158, 25–37. [Google Scholar] [CrossRef] [PubMed]
  76. Hammel, H.T.; Elsner, R.W.; Le Messurier, D.H.; Andersen, H.T.; Milan, F.A. Thermal and metabolic responses of the Australian aborigine exposed to moderate cold in summer. J. Appl. Physiol. 1959, 14, 605–615. [Google Scholar] [CrossRef]
  77. Benhariz, M.; Goulet, O.; Salas, J.; Colomb, V.; Ricour, C. Energy cost of fever in children on total parenteral nutrition. Clin. Nutr. 1997, 16, 251–255. [Google Scholar] [CrossRef]
  78. Du Bois, E.F. The basal metabolism in fever. JAMA 1921, 77, 352–357. [Google Scholar] [CrossRef]
  79. Huang, W.; Metlakunta, A.; Dedousis, N.; Zhang, P.; Sipula, I.; Dube, J.J.; Scott, D.K.; O’Doherty, R.M. Depletion of liver Kupffer cells prevents the development of diet-induced hepatic steatosis and insulin resistance. Diabetes 2010, 59, 347–357. [Google Scholar] [CrossRef] [PubMed]
  80. Leone, V.; Gibbons, S.M.; Martinez, K.; Hutchison, A.L.; Huang, E.Y.; Cham, C.M.; Pierre, J.F.; Heneghan, A.F.; Nadimpalli, A.; Hubert, N.; et al. Effects of diurnal variation of gut microbes and high-fat feeding on host circadian clock function and metabolism. Cell Host Microbe 2015, 17, 681–689. [Google Scholar] [CrossRef] [PubMed]
  81. Zhang, Y.K.; Wu, K.C.; Liu, J.; Klaassen, C.D. Nrf2 deficiency improves glucose tolerance in mice fed a high-fat diet. Toxicol. Appl. Pharmacol. 2012, 264, 305–314. [Google Scholar] [CrossRef]
  82. Chen, Y.J.; Wallig, M.A.; Jeffery, E.H. Dietary Broccoli Lessens Development of Fatty Liver and Liver Cancer in Mice Given Diethylnitrosamine and Fed a Western or Control Diet. J. Nutr. 2016, 146, 542–550. [Google Scholar] [CrossRef]
  83. Ferreira de Oliveira, J.M.; Costa, M.; Pedrosa, T.; Pinto, P.; Remédios, C.; Oliveira, H.; Pimentel, F.; Almeida, L.; Santos, C. Sulforaphane induces oxidative stress and death by p53-independent mechanism: Implication of impaired glutathione recycling. PLoS ONE 2014, 9, e92980. [Google Scholar] [CrossRef]
  84. Moon, D.O.; Kim, M.O.; Kang, S.H.; Choi, Y.H.; Kim, G.Y. Sulforaphane suppresses TNF-alpha-mediated activation of NF-kappaB and induces apoptosis through activation of reactive oxygen species-dependent caspase-3. Cancer Lett. 2009, 274, 132–142. [Google Scholar] [CrossRef]
  85. Singh, S.V.; Srivastava, S.K.; Choi, S.; Lew, K.L.; Antosiewicz, J.; Xiao, D.; Zeng, Y.; Watkins, S.C.; Johnson, C.S.; Trump, D.L.; et al. Sulforaphane-induced cell death in human prostate cancer cells is initiated by reactive oxygen species. J. Biol. Chem. 2005, 280, 19911–19924. [Google Scholar] [CrossRef] [PubMed]
  86. Okai, Y.; Higashi-Okai, K. Protective effects of chlorophyll a and pheophytin a derived from green tea (Camellia sinensis) on p-nonylphenol-induced cell growth inhibition and oxygen radical generation in yeast (Saccharomyces cerevisiae). J. Sci. Food Agric. 2001, 81, 1443–1446. [Google Scholar] [CrossRef]
  87. Koh, E.J.; Kim, K.J.; Choi, J.; Kang, D.H.; Lee, B.Y. Spirulina maxima extract prevents cell death through BDNF activation against amyloid beta 1-42 (Aβ(1-42)) induced neurotoxicity in PC12 cells. Neurosci. Lett. 2018, 673, 33–38. [Google Scholar] [CrossRef]
  88. Barrett, P.; Mercer, J.G.; Morgan, P.J. Preclinical models for obesity research. Dis. Model. Mech. 2016, 9, 1245–1255. [Google Scholar] [CrossRef] [PubMed]
  89. de María Márquez Álvarez, C.; Hernández-Cruz, E.Y.; Pedraza-Chaverri, J. Oxidative stress in animal models of obesity caused by hypercaloric diets: A systematic review. Life Sci. 2023, 331, 122019. [Google Scholar] [CrossRef] [PubMed]
  90. Levin, B.E.; Sullivan, A.C. Differences in saccharin-induced cerebral glucose utilization between obesity-prone and -resistant rats. Brain Res. 1989, 488, 221–232. [Google Scholar] [CrossRef]
  91. van der Valk, E.S.; Savas, M.; van Rossum, E.F.C. Stress and Obesity: Are There More Susceptible Individuals? Curr. Obes. Rep. 2018, 7, 193–203. [Google Scholar] [CrossRef]
  92. Patterson, Z.R.; Abizaid, A. Stress induced obesity: Lessons from rodent models of stress. Front. Neurosci. 2013, 7, 130. [Google Scholar] [CrossRef]
  93. Turner, P.V.; Brabb, T.; Pekow, C.; Vasbinder, M.A. Administration of substances to laboratory animals: Routes of administration and factors to consider. J. Am. Assoc. Lab. Anim. Sci. 2011, 50, 600–613. [Google Scholar]
  94. Arantes-Rodrigues, R.; Henriques, A.; Pinto-Leite, R.; Faustino-Rocha, A.; Pinho-Oliveira, J.; Teixeira-Guedes, C.; Seixas, F.; Gama, A.; Colaco, B.; Colaco, A.; et al. The effects of repeated oral gavage on the health of male CD-1 mice. Lab. Anim. 2012, 41, 129–134. [Google Scholar] [CrossRef]
  95. Balcombe, J.P.; Barnard, N.D.; Sandusky, C. Laboratory routines cause animal stress. Contemp. Top. Lab. Anim. Sci. 2004, 43, 42–51. [Google Scholar] [PubMed]
  96. Murphy, S.J.; Smith, P.; Shaivitz, A.B.; Rossberg, M.I.; Hurn, P.D. The effect of brief halothane anesthesia during daily gavage on complications and body weight in rats. Contemp. Top. Lab. Anim. Sci. 2001, 40, 9–12. [Google Scholar] [PubMed]
  97. Pound, P.; Ritskes-Hoitinga, M. Is it possible to overcome issues of external validity in preclinical animal research? Why most animal models are bound to fail. J. Transl. Med. 2018, 16, 304. [Google Scholar] [CrossRef] [PubMed]
Figure 1. Experimental design. After 1 week of acclimation, mice were trained to voluntarily ingest gelatine pellets once daily during the training week. Then, mice were fed a Western control diet (CTR) or a Western diet + 0.2% cholesterol (WD) for 14 weeks. Experimental groups were supplemented with sulforaphane (SFN; 0.25 or 0.5 mg/kg/day) or chlorophyll a (Chlo.a; 0.2 or 0.5 mg/kg/day) 5 days a week, during the last 4 weeks of the study.
Obesities 03 00022 g001
Figure 2. White adipose tissue weight and morphometric analysis of adipocytes. Mice were fed a Western control diet (CTR) or a Western diet + 0.2% cholesterol (WD) for 14 weeks. Experimental groups were supplemented with sulforaphane (SFN; 0.25 or 0.5 mg/kg/day) or chlorophyll a (Chlo.a; 0.2 or 0.5 mg/kg/day) only in the last 4 weeks of the study. Relative weight of (A) epididymal fat and (B) retroperitoneal fat (C) number of adipocytes; (D) volume per adipocyte; (E) area per adipocyte; and (F) relative frequency of adipocyte size (calculated based on adipocyte area). Data are expressed as mean ± SEM (n = 7). * p < 0.05, ** p < 0.01, **** p < 0.0001, different from CTR; # p < 0.05, ## p < 0.01, ### p < 0.001, #### p < 0.001, different from WD. One-way ANOVA followed by Dunnett’s multiple comparison test.
Obesities 03 00022 g002
Figure 3. Exemplificative images of epididymal surrounding adipose tissue of animals from the different experimental groups; (A) Western control diet (CTR); (B) Western diet + 0.2% cholesterol (WD); (C) CTR supplemented with sulforaphane (SFN, 0.5 mg/kg/day); (D) WD supplemented with sulforaphane (SFN, 0.25 mg/kg/day); (E) WD supplemented with sulforaphane (SFN, 0.5 mg/kg/day); (F) CTR supplemented with chlorophyll a (Chlo.a; 0.5 mg/kg/day); (G) WD supplemented with chlorophyll a (Chlo.a; 0.2 mg/kg/day); (H) WD supplemented with chlorophyll a (Chlo.a; 0.5 mg/kg/day). a, adipocyte, CT, connective tissue; Ep, epididymal epithelium; arrowhead, nuclei; arrow, blood vessel. Barr = 100 µm.
Obesities 03 00022 g003
Figure 4. Glucose tolerance test, plasma glucose and lipid profile. Mice were fed a Western control diet (CTR) or a Western diet + 0.2% cholesterol (WD) for 14 weeks. Experimental groups were supplemented with sulforaphane (SFN; 0.25 or 0.5 mg/kg/day) or chlorophyll a (Chlo.a; 0.2 or 0.5 mg/kg/day) only in the last 4 weeks of the study. The IPGTT was performed at week 14. After overnight fasting, mice were injected with a 50% glucose solution (2 g/kg, i.p.). Blood glucose (mg/dL) was measured immediately before and 30, 60, and 120 min after the injection, then, glucose concentration was expressed as a function of time and the area under the curve (AUC; mg×min/dL) was calculated. (A) Blood glucose area under the curve (AUC); (B) plasma glucose levels after sacrifice (after 24 h of fasting); (C) total cholesterol (TC); (D) triglycerides (TG); (E) high-density lipoprotein-cholesterol (HDL-c); (F) low-density lipoprotein-cholesterol (LDL-c). Data are expressed as mean ± SEM (n = 7). * p < 0.05, ** p < 0.01, *** p < 0.001, **** p < 0.0001, different from CTR; ## p < 0.01, ### p < 0.001, different from WD. One-way ANOVA followed by Dunnett’s multiple comparisons test.
Obesities 03 00022 g004
Figure 5. Hepatic oxidative stress parameters. Mice were fed a Western control diet (CTR) or a Western diet + 0.2% cholesterol (WD) for 14 weeks. Experimental groups were supplemented with sulforaphane (SFN; 0.25 or 0.5 mg/kg/day) or chlorophyll a (Chlo.a; 0.2 or 0.5 mg/kg/day) only during the last 4 weeks of the study. The levels of (A) the oxidative stress index (OSI), (B) reactive oxygen species (ROS) and (C) malondialdehyde (MDA), an indicator of lipid peroxidation (LPO), were evaluated in the liver. Data are expressed as mean ± SEM (n = 7). * p < 0.05, ** p < 0.01, *** p < 0.001, **** p < 0.0001, different from CTR; # p < 0.05, ## p < 0.01, ### p < 0.001, #### p < 0.0001, different from WD. DCF, dichlorofluorescein diacetate; GSH, reduce glutathione; GSSG, oxidized glutathione.
Obesities 03 00022 g005
Figure 6. Hepatic antioxidant response. Mice were fed a Western control diet (CTR) or a Western diet + 0.2% cholesterol (WD) for 14 weeks. Experimental groups were supplemented with sulforaphane (SFN; 0.25 or 0.5 mg/kg/day) or chlorophyll a (Chlo.a; 0.2 or 0.5 mg/kg/day) only in the last 4 weeks of the study. The activity of (A) superoxide dismutase (SOD), (B) catalase (CAT), (C) glutathione peroxidase (GPx), and (D) glutathione s-transferase (GST) were evaluated in the liver. Data are expressed as mean ± SEM (n = 7). ** p < 0.01, *** p < 0.001, **** p < 0.0001, different from CTR. One-way ANOVA followed by Dunnett’s multiple comparison test. CDNB, 1-chloro-2,4-dinitrobenzene; DCF, dichlorofluorescein diacetate; GSH, reduce glutathione; GSSG, oxidized glutathione.
Obesities 03 00022 g006
Table 1. Body weight (g) at the beginning and at the end of the study, weight gain (%), daily food intake (g), and body temperature (°C) at week 14.
Body WeightWeight Gain
(%)
Daily Food
Intake (g)
Body Temperature (°C)
GroupInitial (g)Final (g)
CTR21.87 ± 0.4630.89 ± 0.5929.43 ± 1.0221.78 ± 0.6629.56 ± 0.22
WD23.45 ± 0.3235.77 ± 1.20 *36.17 ± 1.4021.15 ± 0.5528.47 ± 0.17 *
CTR + 0.5 SFN22.72 ± 0.6133.28 ± 0.7331.57 ± 2.2022.86 ± 0.5429.04 ± 0.24
WD + 0.25 SFN22.23 ± 0.5635.16 ± 0.5334.71 ± 1.3925.58 ± 1.26 **;###30.27 ± 0.24 ####
WD + 0.5 SFN21.35 ± 0.45 #33.42 ± 0.9635.86 ± 1.3422.08 ± 0.6129.49 ± 0.18 #
CTR + 0.5 Chlo.a23.08 ± 0.4934.48 ± 1.5936.71 ± 2.76 *24.06 ± 0.63 #29.60 ± 0.245 #
WD + 0.2 Chlo.a21.51 ± 0.39 #32.74 ± 0.5435.67 ± 0.9921.39 ± 0.5830.46 ± 0.341 ####
WD + 0.5 Chlo.a23.11 ± 0.6536.72 ± 1.43 *36.57 ± 2.63 *22.59 ± 0.5729.76 ± 0.194 ##
Mice were fed a Western control diet (CTR) or a Western diet + 0.2% cholesterol (WD) for 14 weeks. Experimental groups were supplemented with sulforaphane (SFN; 0.25 or 0.5 mg/kg/day) or chlorophyll a (Chlo.a; 0.2 or 0.5 mg/kg/day) during the last 4 weeks of the study. Data are expressed as mean ± SEM (n = 7). * p < 0.05, ** p < 0.01, different from CTR; # p < 0.05,## p < 0.01, ### p < 0.001, #### p < 0.0001, different from WD. The differences are relative to the values in the same column. One-way ANOVA followed by Dunnett’s multiple comparison test.
Table 2. Liver fatty changes and distribution of the lesions, multifocal hepatitis (%), and relative weight of the liver at the end of the study.
GroupNormalLiver Fatty ChangesMultifocal HepatitisLiver Weight (mg/g bw)
DiffuseFocal
CTR7/7 (100%)0/7 (0%)0/7 (0%)0/7 (0%)35.95 ± 0.23
WD1/7 (14.3%) a5/7 (71.4%)1/7 (14.3%)2/7 (28.6%)44.25 ± 0.67 **
CTR + 0.5 SFN7/7 (100%)0/7 (0%)0/7 (0%)0/7 (0%)38.50 ± 1.31
WD + 0.25 SFN3/7 (42.9%)3/7 (42.9%)1/7 (14.3%)4/7 (57.1%)42.44 ± 0.77 *
WD + 0.5 SFN1/7 (14.3%) a5/7 (71.4%)1/7 (14.3%)4/7 (57.1%)41.29 ± 2.00
CTR + 0.5 Chlo.a5/7 (71.4%)0/7 (0%)2/7 (28.6%)2/7 (28.6%)37.93 ± 0.29 #
WD + 0.2 Chlo.a3/7 (42.9%)4/7 (57.1%)0/7 (0%)5/7 (71.4%)45.09 ± 1.11 ***
WD + 0.5 Chlo.a2/7 (28.6%)4/7 (57.1%)1/7 (14.3%)5/7 (71.4%)43.97 ± 2.78 **
Mice were fed a Western control diet (CTR) or a Western diet + 0.2% cholesterol (WD) for 14 weeks. Experimental groups were supplemented with sulforaphane (SFN; 0.25 or 0.5 mg/kg/day) or chlorophyll a (Chlo.a; 0.2 or 0.5 mg/kg/day) only in the last 4 weeks of the study. Data are expressed in number of animals and percentage (n = 7). a p < 0.05 different from CTR according to Chi-square test. Relative liver weight data are expressed as mean ± SEM (n = 7). * p < 0.05, ** p < 0.01, *** p < 0.001, different from CTR; # p < 0.05, different from WD, according to one-way ANOVA followed by Dunnett’s multiple comparisons test. Bw, body weight.
Disclaimer/Publisher’s Note: The statements, opinions and data contained in all publications are solely those of the individual author(s) and contributor(s) and not of MDPI and/or the editor(s). MDPI and/or the editor(s) disclaim responsibility for any injury to people or property resulting from any ideas, methods, instructions or products referred to in the content.

