Article

The Development and Validation of Correlation Charts to Predict the Undisturbed Ground Temperature of Pakistan: A Step towards Potential Geothermal Energy Exploration

1
Department of Civil & Environmental Engineering, Hanyang University, Seoul 04763, Republic of Korea
2
School of Civil and Environmental Engineering, National University of Sciences and Technology, Islamabad 44000, Pakistan
3
Department of Electrical and Computer Engineering, Sungkyunkwan University, Suwon 16419, Republic of Korea
4
ANS Associates Pvt. Limited, Lahore 54000, Pakistan
5
EMJMD, MSc Geospatial Technologies, Westfälische Wilhelms Universität, 48149 Münster, Germany
*
Authors to whom correspondence should be addressed.
Eng 2023, 4(3), 1837-1850; https://doi.org/10.3390/eng4030104
Submission received: 20 April 2023 / Revised: 27 June 2023 / Accepted: 28 June 2023 / Published: 30 June 2023
(This article belongs to the Special Issue GeoEnergy Science and Engineering)

Abstract

:
As a country, Pakistan is mostly dependent on fossil fuels for fulfilling its energy demand, which is expensive, as well as being environmentally unfriendly. It is high time that the country decides to shift from fossil fuels to renewable energy resources like geothermal, wind, solar, etc., to cater for global warming issues. Pakistan has a lot of potential geothermal sites, as the location of Pakistan lies on several fault lines and hot springs, thus making it very easy to extract the temperature from deep inside the earth and harness it for Geothermal Energy. Also, a sound knowledge of ground temperature is essential to use geothermal energy, which is obtained by drilling boreholes and putting in sensors. However it becomes a very expensive and labor intensive procedure. Therefore, to avoid the huge cost for drilling boreholes, particularly for ground temperature analysis, a numerical approach has been considered for determining ground temperature. Furthermore, correlation charts between air and ground temperatures have been developed, as there were no proper studies on the ground temperature of Pakistan. Then, with the help of a boreholes drilled in the National University of Sciences and Technology, Islamabad, Pakistan, the actual ground and numerically calculated temperatures have been compared. The results show a temperature error margin in the range between 0.27% for higher depths of about 5.6 m and 7.3% near the surface of about 2.7 m. Thus, it is shown that the proposed method is easy to implement and better than large scale testing methods for the depths at which geothermal energy is extracted.

1. Introduction

Sustainability, considering the carbon neutral energy production, is the primary goal of the global energy market. Moreover, responsible consumption of natural resources and renewable energy are the dire need of this era, according to the United Nation’s Sustainable development goals [1]. Pakistan is rich in renewable energy resources, and still, it is facing energy crises like the shortage of electricity and load shedding [2,3]. Also, to generate electricity it imports fuel, which is a huge hindrance to its economic development. The conventional energy sources like coal, gas, diesel, and fossil fuels are on the verge of ending. Pakistan needs to consider alternative renewable energy sources [4]. The conventional methods are hazardous to the environment due to the release of ozone depletion and greenhouse gases (GHG). These two phenomena are mostly responsible for global warming and climate change, thus causing extreme weather conditions, glacier melting and flooding [5,6]. On the other hand, renewable sources like wind, hydro and geothermal energy are clean energy technologies which produce less GHG and are environmentally friendly. Furthermore, these are a counter measure for global warming to fulfill energy demands [7,8,9]. Pakistan has a lot of geothermal potential due to its geology, which can be harvested for energy purposes. This research discusses the potential of geothermal energy in Pakistan, where all the energy resources are being used for energy generation except the geothermal energy to cater global warming. The statistics of the available energy sources previously studied illustrate that the energy sources are mainly composed of conventional sources and fossil fuels [10]. Thus, it is becoming very difficult to meet the energy requirements of the country, as the prices of fossil fuels are increasing day by day. The average annual energy demand of Pakistan is also increasing at the rate of 8% to 10% annually [11]. The board of investment Pakistan provides the figure of 22,797 MW as the installed power capacity. But the generation stands approximately between 12,000 MW and 13,000 MW per day [10]. The China–Pakistan Economic Corridor (CPEC) is opening ways for investors in Pakistan, increasing the energy demand abruptly. These commercial enterprise ventures can be powered by the energy generated by themselves using geo-thermal energy.
Pakistan is located within the latitude and longitude of 30.37° N, 69.34° E with a land of about 800,000 km2. The northeast to southwest extent of the country is about 1700 km, and its East–West width is approximately 1000 km. The geomorphology of Pakistan varies from lofty mountains of the Himalayas, Karakorum, Hindukush, and Pamirs in the north to the fascinating coastline of the Arabian Sea in the south. In between the northern and southern extreme ends of the country, notable and unique bended north–south-oriented mountain ranges exist centrally bounded by the fertile plains of the 3000-long River Indus and western part of the famous Thar Desert on the eastern side, and by the Chagai volcanic arc, vast tectonic depression of Kharan, and the westward swinging mountain ranges of the Makran flysch basin. Pakistan is a huge museum of geological formations with a variety of rocks and formations. Pakistan’s geothermal energy resources are located in the following four regions: northern Pakistan, consisting of Gilgit Baltistan; northwestern and South Baluchistan; Indus Basin and West Sindh; and southwestern and northern Punjab [12]. The sources, location and outlet reservoir temperature of some of the geothermal springs in Pakistan are Murtazaabad Springs in Hunza (237 °C), Budelas Valey Springs in Hunza (159 °C), Dasu Springs in Kohistan (200 °C), Tatta Pani in Astore (200 °C), Sassi in Skardu (200 °C), Karsaz Spring in Karachi (70–145 °C), Manghopir Spring in Karachi (70–145 °C), Kharan and Kohe Sultan Spring in Kharan and Chaghi (200–300 °C) [12,13]. Besides the regions mentioned, there are other spots as well, where single or multiple geothermal springs exist, and a geological survey of Pakistan has issued a list of 12 regions to be investigated [14]. These regions are blessed with un-tapped geothermal energy resources. The only need is to exploit and utilize them efficiently and responsibly [15]. But the concept of geothermal energy is rare in Pakistan. Furthermore, to determine the geothermal potential, ground temperature data is required, but the ground temperature of Pakistan is not studied in detail. Thus, a numerical approach is needed to find out the temperature at higher depths, in order to avoid the cost of drilling boreholes and using heavy instrumentations to measure the ground temperature. By now, it is evident that Pakistan has enough resources to generate and use the geothermal energy, but many geothermal potential areas are still unexplored and those which are known are not being used to fulfill the energy needs. Thus, there is a dire need to study the geothermal potential and ground temperature of Pakistan in detail.
The literature shows that ground temperature is influenced significantly by the air temperature at shallower depths. As the depth increases, a lag between air and ground temperature is observed. However, this lag becomes constant after a particular depth. At this depth, the temperature remains almost the same for the whole year. Thus, the difference between the air and ground temperature is utilized for heating purposes during the winter season and for cooling during the summer season. The greater the difference between air and ground temperature, the greater the efficiency of the geothermal system installed [16]. It is evident that the heat energy of the earth, stored in the ground, is a renewable source and can be extracted easily through environmentally friendly techniques [17]. The subsurface ground temperature profile is a prominent determinant of various thermo-active and latent heat applications. These include geothermal energy extraction and storage through contact mechanisms with structural elements, heating of airport runways, and the closed systems, using tunnel lining and support as energy absorbers [18,19]. Geothermal energy is now widely regarded as a global green energy source [20]. Moreover, the Ground Temperature (GT) profile is also being utilized to effectively predict the biological, zoological and pathological life cycle processes that occur underground. These complex activities have their major roots in the earth, acting as a fluctuating heat source with variable vertical temperature distribution and thermal diffusivity, at various times of the year. Geothermal resources are, at present, mainly used for generating electricity and air conditioning by means of District Heating (DH) and geothermal heat pump systems [21]. These resources are normally classified as renewable energy sources, because they are maintained by a continuous energy current [22]. Geothermal technologies use renewable energy resources to generate electricity or heating and cooling while producing very low levels of greenhouse-gas emissions [23,24,25]. Researchers have also explored novel and innovative approaches to invest in geothermal energy. Furthermore, the same study states that intelligently schemes for the modeling of interfacial tension in CO2 brine systems has implications for CO2 trapping. This research emphasizes the importance of understanding CO2 brine system dynamics to develop effective methods for carbon dioxide storage. The global interest in studying geothermal energy is evident, as it can contribute to broader carbon capture and storage initiatives [26]. Thus, as a solution of global warming, this research focuses on the potential of geothermal energy in Pakistan by mapping its ground temperature at different depths with the help of newly generated temperature correlation charts between air and ground that have never performed before for this region. Section 2 discusses the numerical and empirical approach, while Section 3 analyzes the temperature chart of respective regions and concludes with discussion at end.

2. Methodology

2.1. Determination of Ground Temperature by Numerical Approach

Kusuda formulated a correlation, in which it was described that ground temperature is a function of the depth below the surface and time of year [16,27]. The thermo-physical properties of soils and rocks make them an excellent propagator of latent heat in the ground. The equation developed by Kusuda is as follows:
T s o i l ( D , t y e a r ) = T m e a n T a m p × e x p ( D π 365 × α ) × c o s [ 2 π 365 ( t y e a r t s h i f t D 2 365 π × α ) ]
where:
  • Tsoil (D, tyear) = Ground Temperature
  • Tmean = average surface, i.e., air temperature
  • Tamp = Amplitude of surface temperature [(max. air temperature − min. air temperature)/2]
  • D = Depth below the surface (surface = 0)
  • α = Thermal diffusivity of the soil
  • tyear = current time (day)
  • tshift = day of the year of minimum surface temperature
This correlation has been widely used to effectively predict the ground temperature profile, over the term of many decades. The correlation assumes that thermal diffusivity varies with different depths, irrespective of the time of year. The time period can be as short as one day (86,400 s) to as long as a year (3.1536 × 10⁷ s). Applying this equation for Islamabad Pakistan, the profile of ground temperature Figure 1 is obtained. The ground temperatures were calculated by considering the soil thermal diffusivity equivalent to clay (0.0267 m2/day) because the predominant soil in the Islamabad region is made up of clay, which is also confirmed by the bore logs. The air temperature data was obtained from the Pakistan Meteorological Department (PMD).

2.2. Determination of Ground Temperature by Experimental Approach
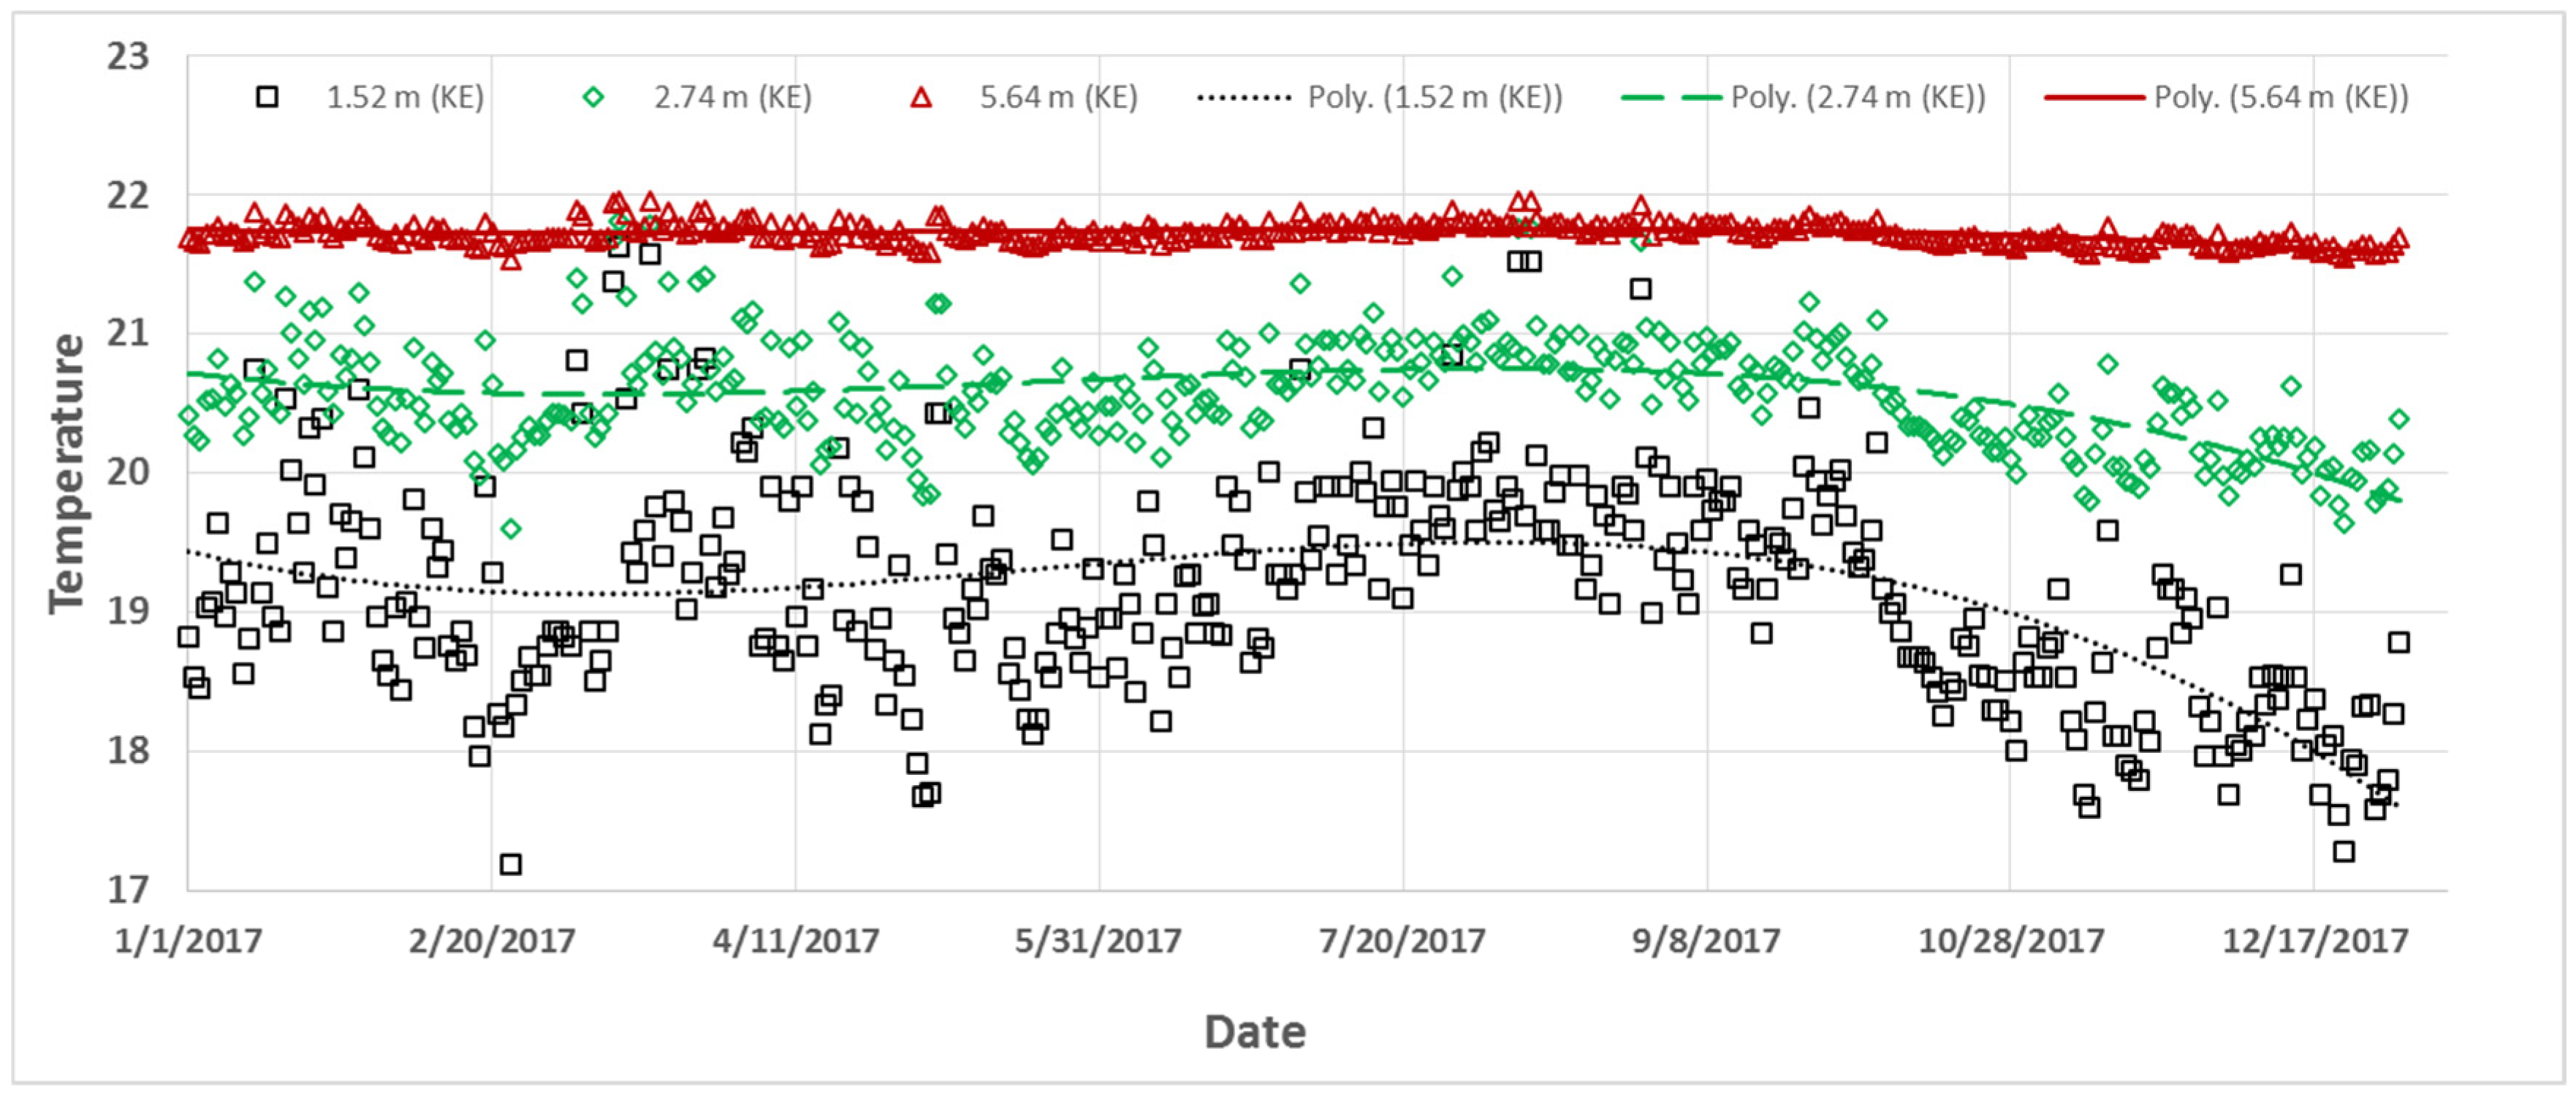
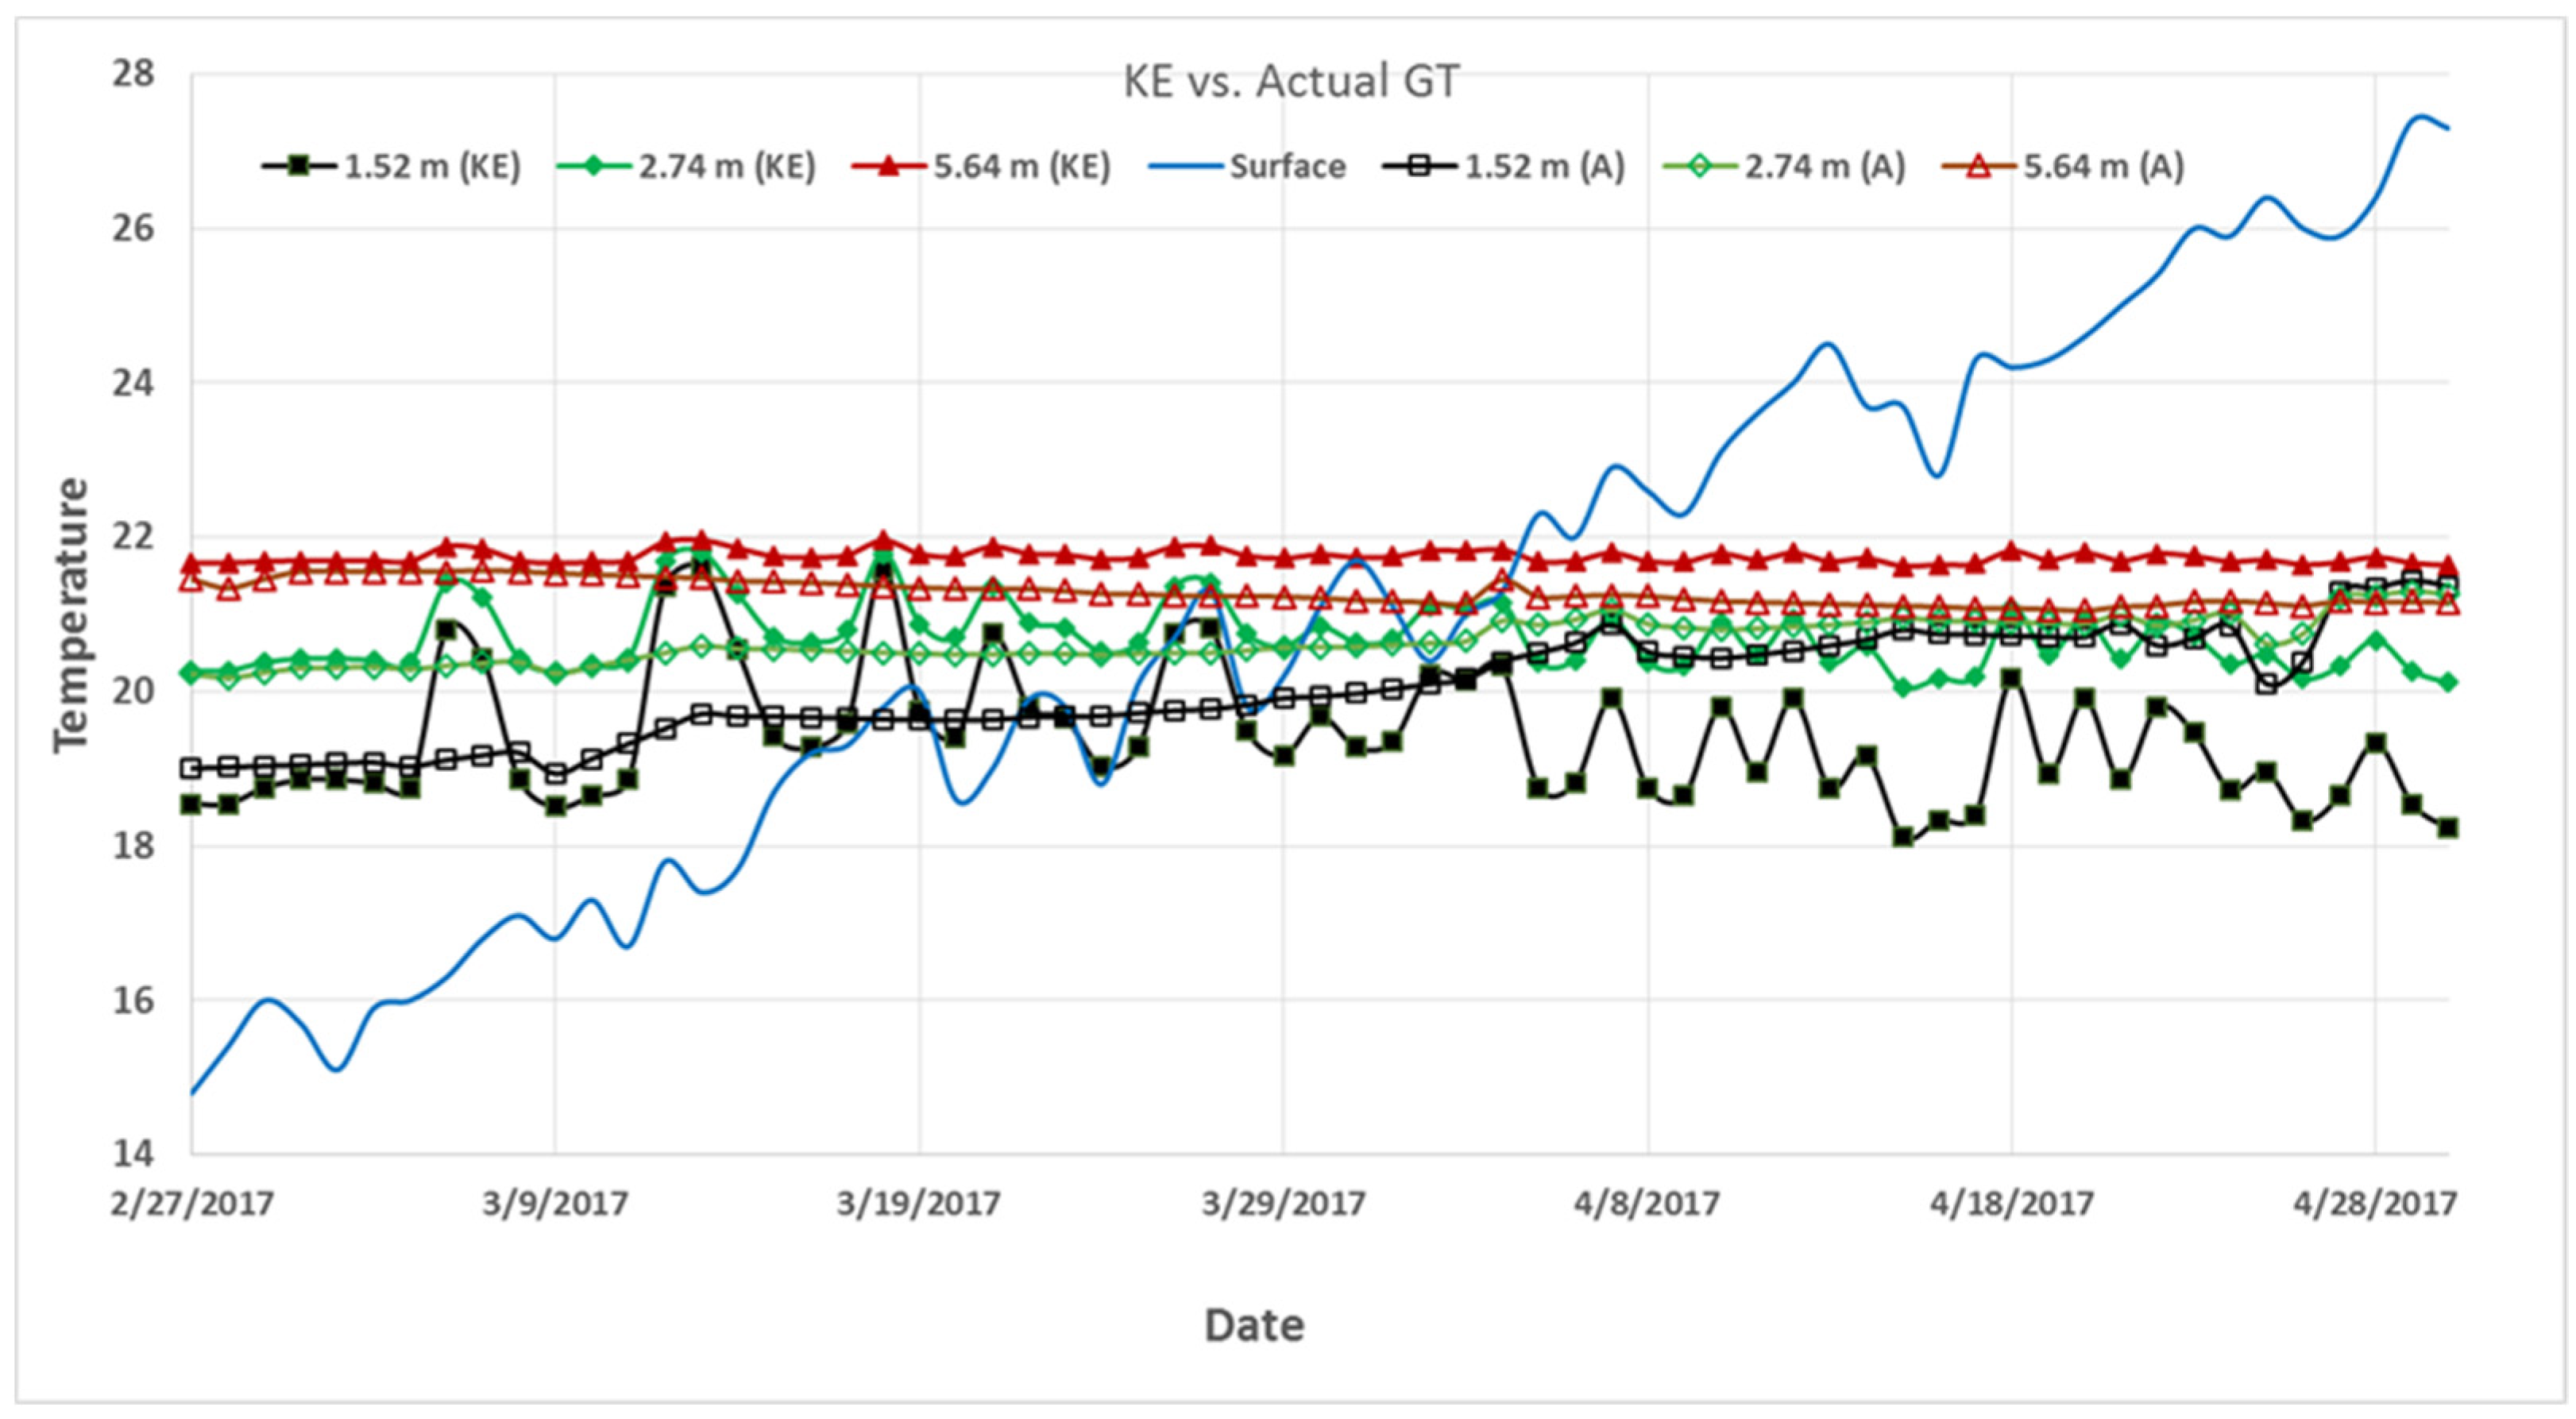
Previous studies show that the Kusuda formula might not provide accurate results everywhere because of different spatial temperature variation and the equatorial location [28]. Thus, it is necessary to verify and validate this equation for Pakistan before its application. The validation of this equation was carried out by comparing its results obtained with the borehole drilled inside the university, especially for ground temperature measurement purposes. Figure 2 shows the actual ground temperatures. The comparison between numerical results and experimental results shows an error margin in the range between 0.27% for higher depths to 7.3% near the surface. Figure 3 shows that the approach works perfectly for depths greater than about 2 m and the error margin decreases as the depth increases. At lower depths, the results from field and equation vary significantly because shallow depths are affected greatly by surface weather conditions [16].

3. Results

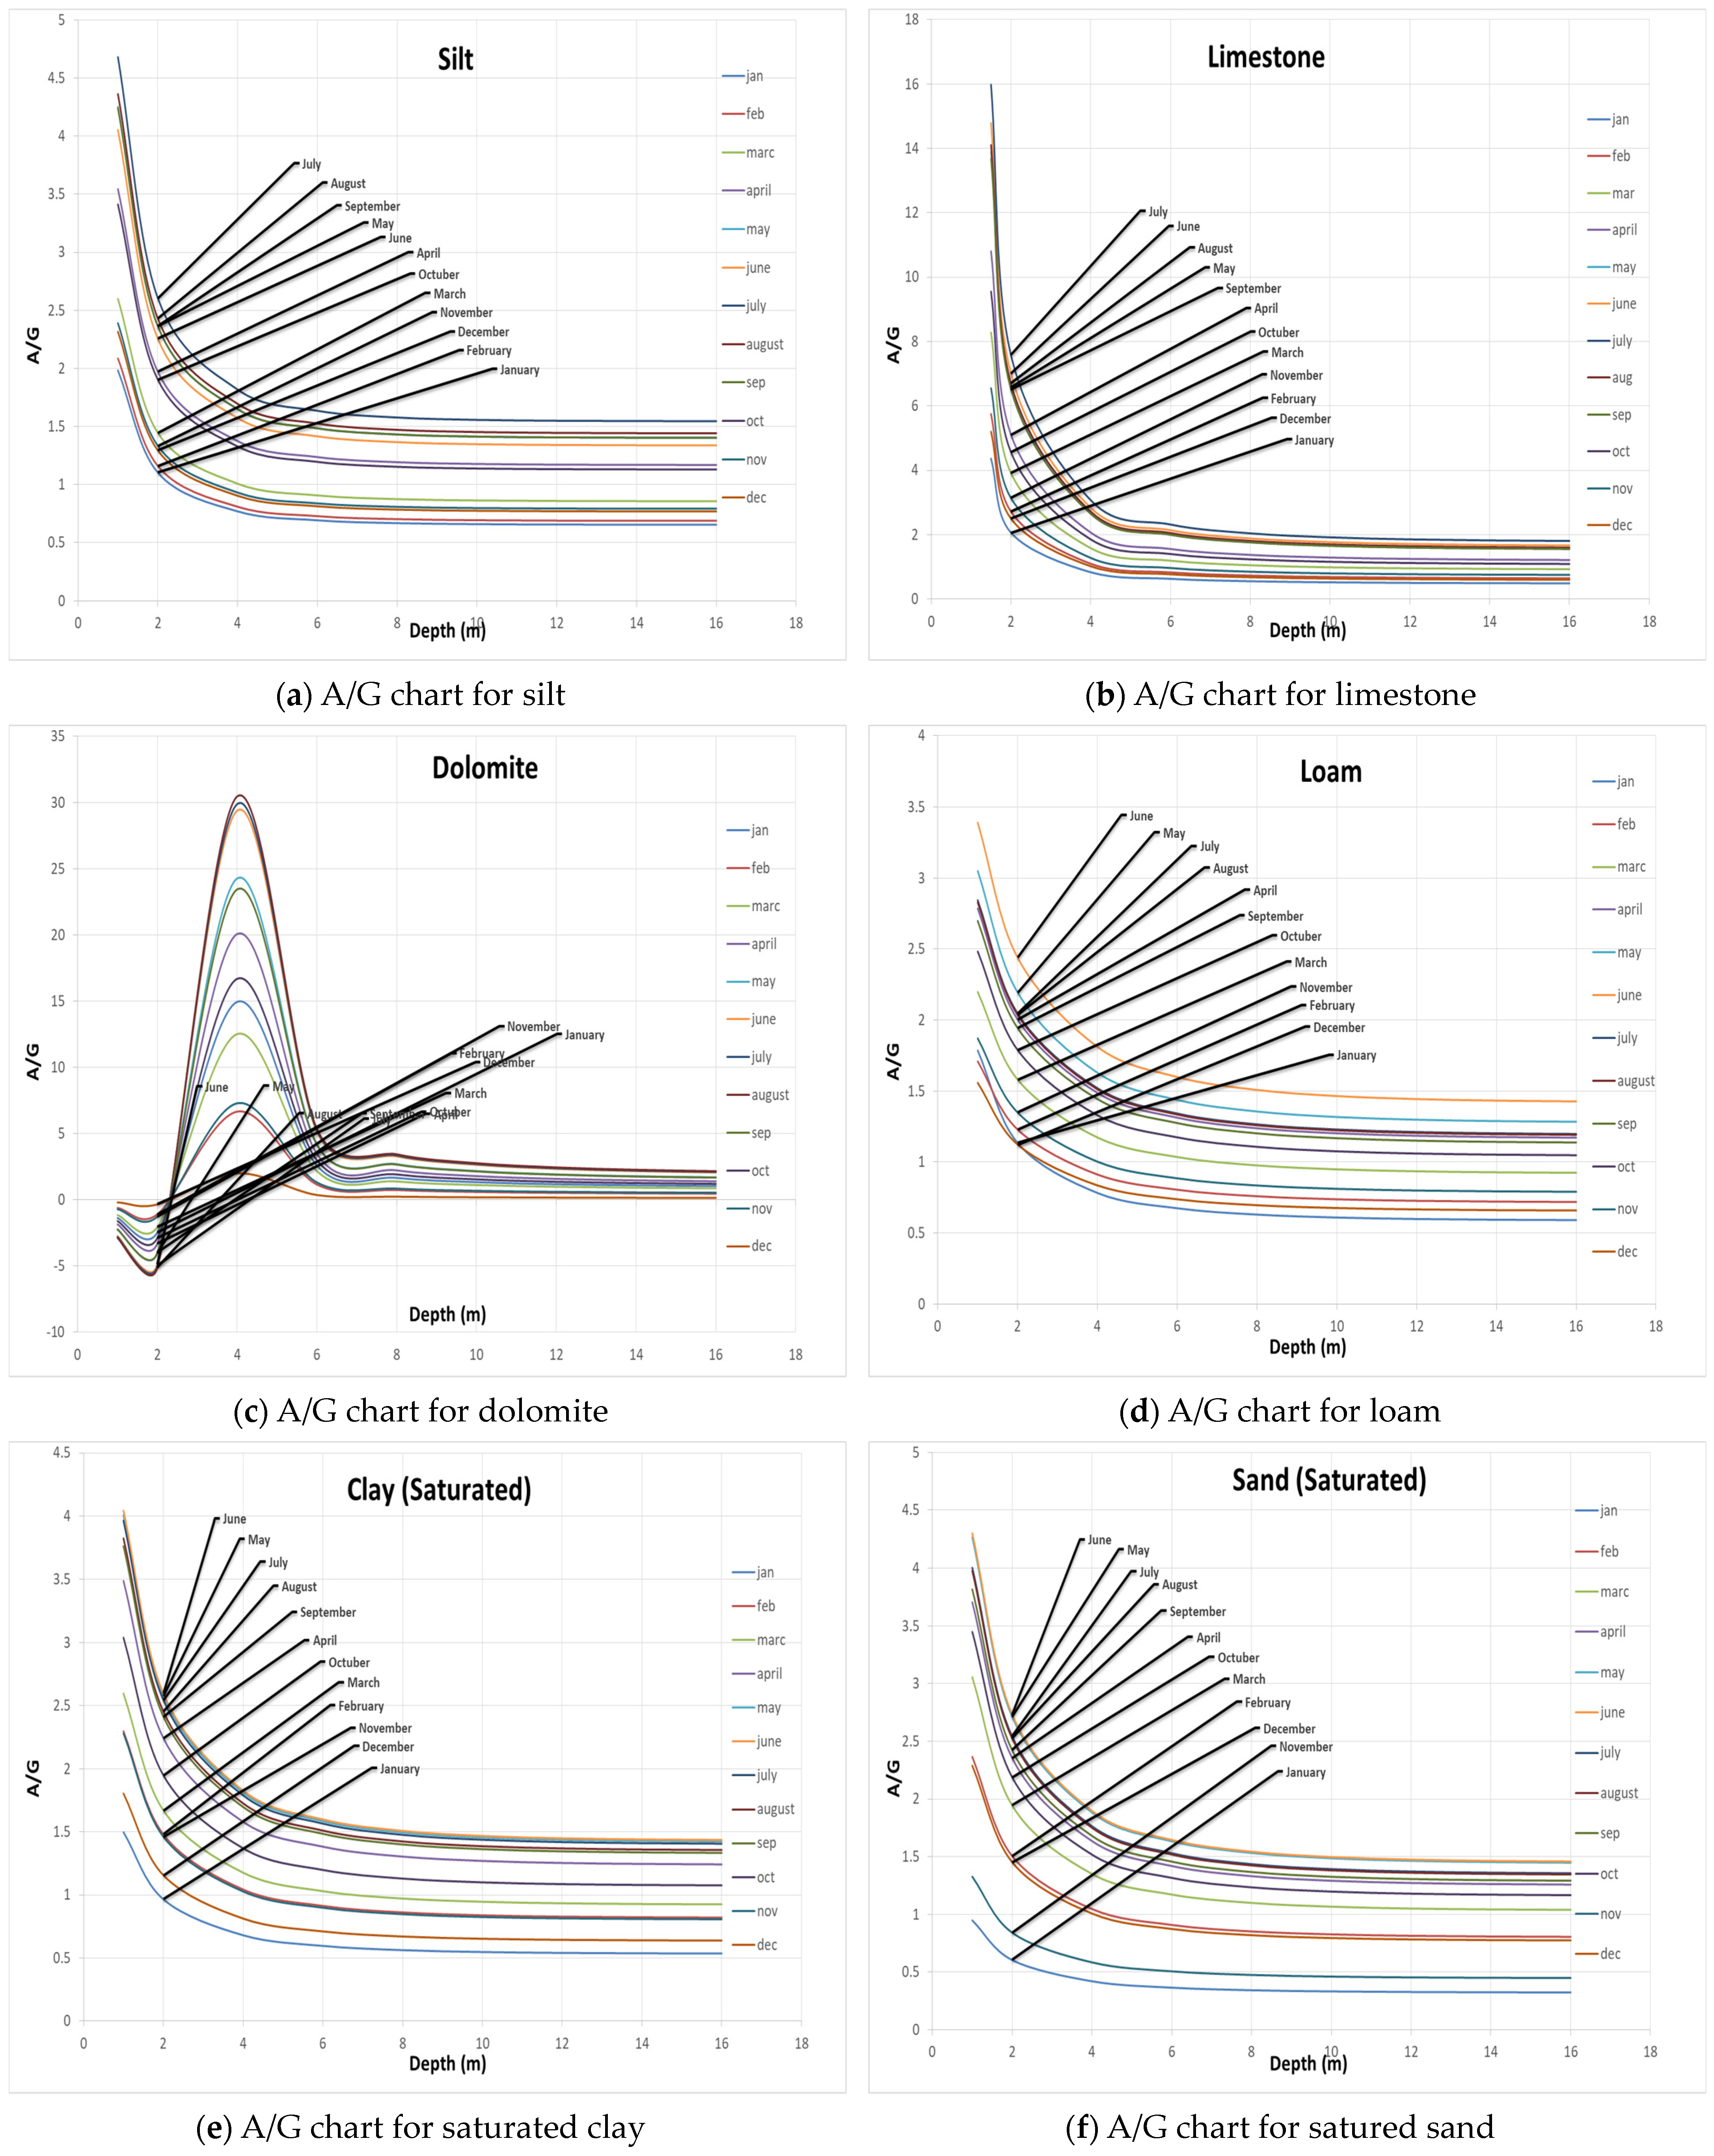
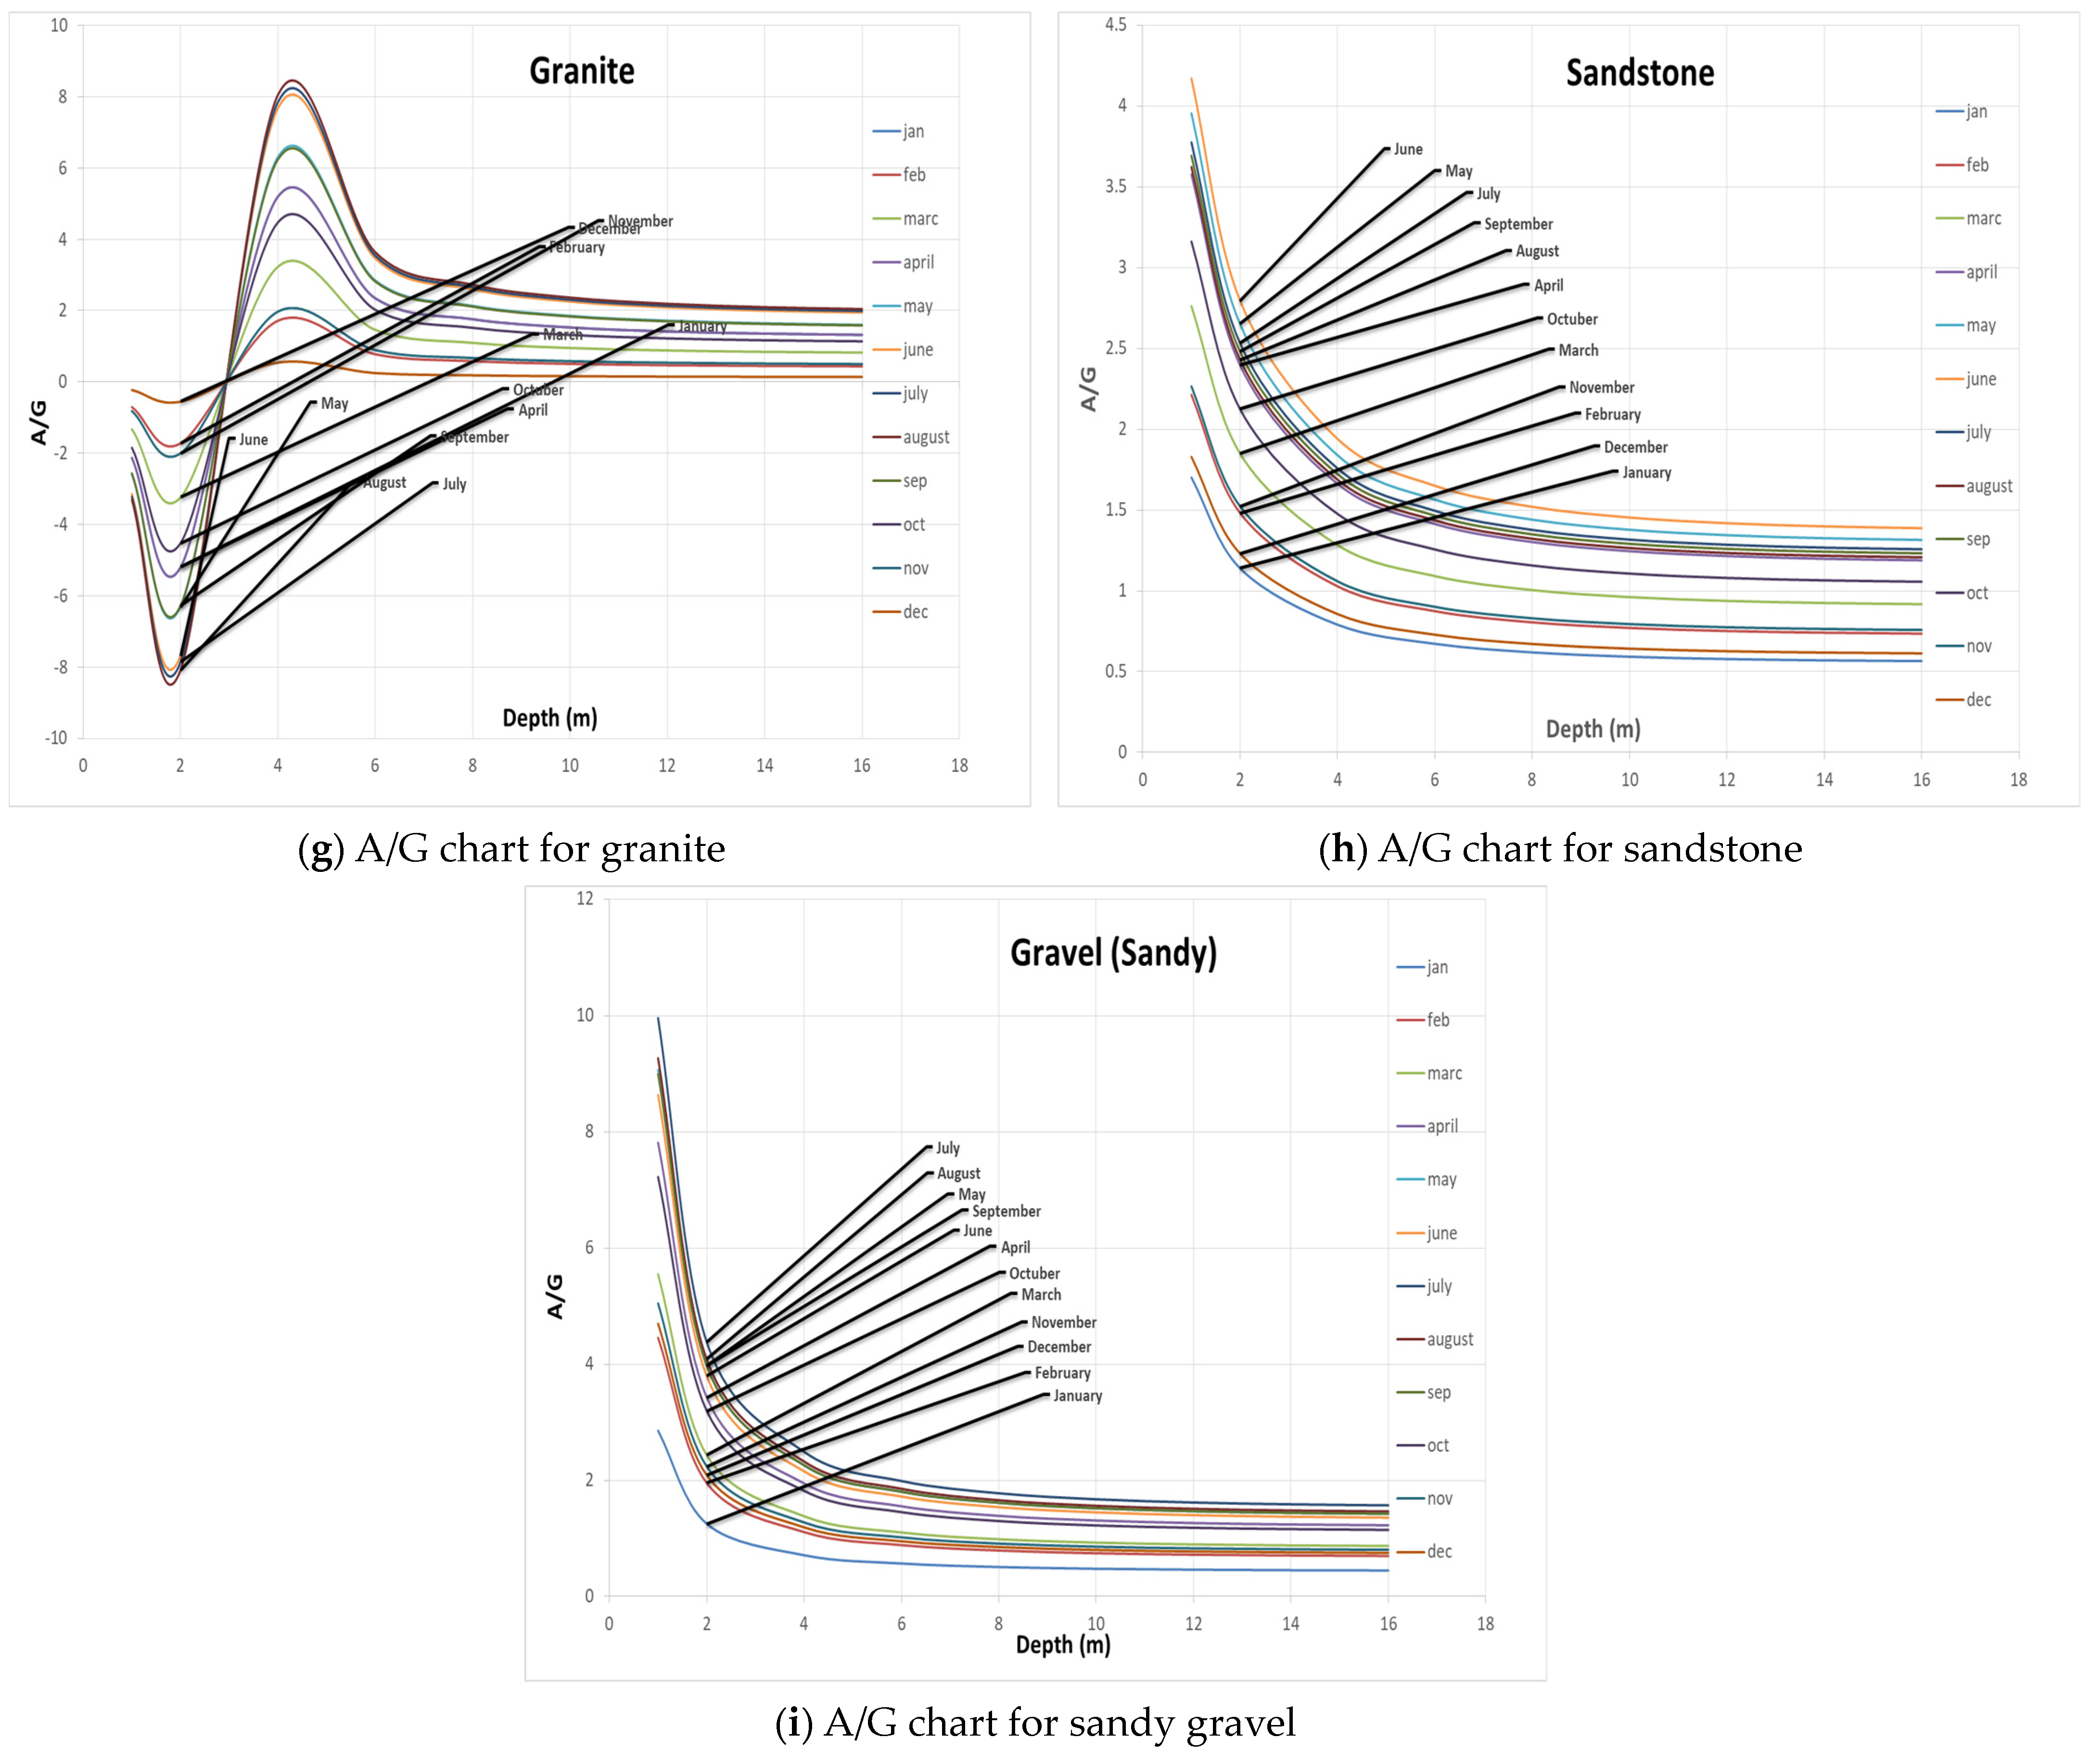
Temperature Correlation

Air vs. Ground Temperature (A/G) Charts:
The Kusuda formula has been widely used to effectively predict the ground temperature profile, over the term of many decades. However, a very important contemplation of Kusuda’s equation is the hypothesis of defining the variation of the ratio of air and ground temperatures with depth, as shown in Figure 4a–d, which is the main contribution of the authors. After the formulation of the ground temperature graphs, as shown in Figure 5, A/G (Ratio between air and ground temperature) charts were developed to make this numerical approach practical. Thus, four charts of both fine (clay) and coarse (sand) classifications of soil and rock types (gravel and shale) have been shown in Figure 4. In order to make these correlation charts more diversified to account for different geographical locations of Pakistan, further major soil and rock classification were considered. This allowed us to make the zoning of the country into different ground temperature potential areas. Other charts of rock and soil with different moisture content, etc., are shown in Figure 6. The A/G graphs have been plotted by taking into account the average monthly air and ground temperatures on the y-axis and uniformly increasing ground depth on the x-axis. Time interval taken is one complete month, over the course of a complete year. Different types of soils and rocks have been investigated in the postulation of this hypothesis; these include: sand (unsaturated and saturated), clay (unsaturated and saturated), silt, peat, gravel, sandy gravel, loam, shale, granite, dolomite, quartz, sandstone and limestone, which correspond to meteorologically recorded average monthly temperatures of eleven separate districts, from all across Pakistan. These areas include Rawalpindi, Bahawalpur, Lahore, Multan, Faisalabad, Quetta, Peshawar, Skardu, Jhelum, Zhob and Karachi. It can be seen that the slope of monthly air/ground temperatures vs. depth is steeper for the first 2 m below the ground. However, it is observed that the A/G ratio becomes relatively constant, exceeding the depths of 6 m. It is due to the high-thermal inertia of the soil; the fluctuations in ground temperature are diminished with higher depths and the ground temperature remains relatively constant [29]. The increase in fluctuation of A/G (Air temperature/Ground temperature) values shows that there is some dominant contribution of surface temperatures at shallow depths. At higher depths, the ground temperature becomes constant, thus making minimizing the effect of aerial temperatures and making the A/G value consistent. This trend is also confirming the error margins encountered during the verification of Kusuda’s Equation (percentage of error decreases with increase in depth underground). The A/G graphs also indicate some abnormal behavior of rock lithology. This is due to the reason that rocks of different categories have higher thermal diffusivity values than different soil types. The ability of rocks to conduct more heat energy as compared to fine soils has made us believe that they show major fluctuations in their A/G values at shallow depths because of larger influence of surface temperatures, thus contributing in errors to some extent.
Temperature Mapping of Pakistan:
Resulting soil and rock temperature envelopes, formulated from the annual A/G ratio vs. Depth graphs, have been used to develop a comparison between each soil envelope. Figure 7 shows the resulting annual graphs of each soil and rock, modelled over a period of one year. It can be perceived from the resultant graphs that the A/G vs. depth is highest for clay (dry), sand (dry), loam, shale and sandstone for the month of June; silt, gravel, sandy gravel and limestone for the month of July; and dolomite and granite for the month of August. However, the lower most temperature fluctuates between the winter months of January and December for all of the different soil and rock types under investigation. It can be inferred from the hypothesis that the ambient temperature of the month under study and resulting ground temperature greatly influences soil and rock temperature envelopes, when thermal diffusivities of the said geological materials are kept constant. Conversely, the soil can have a better heat-exchanging capacity through engineered soil mixing/replacement techniques, in order to obtain the desired geothermal energy storage/transfer potential of soil. This will greatly influence in achieving the energy capacity for any kind of energy requirements of infrastructures.
Figure 8 depicts the work of the authors who used A/G charts for the temperature zoning of Pakistan, based on the annual ground temperatures obtained considering the predominant soil type in the mentioned region. The soils-type map was obtained from the soil survey of Pakistan. The ground depth considered for temperature mapping is 16 m. Since most of the A/G curves become flat at this depth, this was considered as a benchmark for zoning. Also, this depth is usually considered for most of the commercial buildings in Pakistan for foundations, hence allowing the designers to have access to these temperatures charts for their foundation depth and to use them in geothermal heating and cooling of the buildings over the year. The zoning map will allow the designers to work out different ways to improve the energy requirements and efficiency of the buildings and other infra works. Form the charts, it can also be observed that increasing the moisture content of a particular soil can also influence the heat exchanging capability of that particular soil. This phenomenon will open new dimensions for developing both heat transfer and storage capabilities of soils and rock types, respectively. Moreover, the charts are also provide ease to the user, so that they can determine ground temperatures without doing any extensive calculations.

4. Discussion and Conclusions

Geothermal energy is a clean energy technology which plays a key role in reducing greenhouse gases, thus providing a solution for global warming while fulfilling the energy needs. The authors discussed the geothermal energy potential of Pakistan and provided a new correlation chart to understand the ground energy in terms of temperature. It is also shown that the type of soil and its characteristics governs the transmission of ground temperature between soil and the structural foundation element. Moreover, the morphological, rheological and geological characteristics of the soil and rock type, greatly affects A/G vs. depth charts. The thermal properties of the material under study are significantly affected by the ground temperature profile. Overall, using the A/G charts is both environmentally friendly and inexpensive, considering both time and labor cost. These charts also depict that there is substantial geothermal energy potential, considering the ground temperatures of Pakistan, that is waiting to be explored. Thus, the geothermal potential of Pakistan is easily conceptualized by using the A/G charts. The study is concluded as:
  • Rock types at a shallow depth have a highly fluctuating air/ground temperature profile compared to the same rock types at higher depths. Significant fluctuations of the A/G pattern is observed in the case of dolomite and other sedimentary rocks.
  • Air/ground temperature ratio for igneous and sedimentary rocks (granite and dolomite) is higher than soil and soft rocks.
  • A/G trend, with regard to limestone, sandstone and shale, is similar to that of soils even though they are sedimentary rocks.
  • Kusuda formula might not provide accurate results everywhere because of different spatial temperature variation and equatorial location. Kusuda equation has limitations at shallower depths. Aerial temperature greatly influences the A/G (Aerial Temperature/Ground Temperature) values at shallower depths.
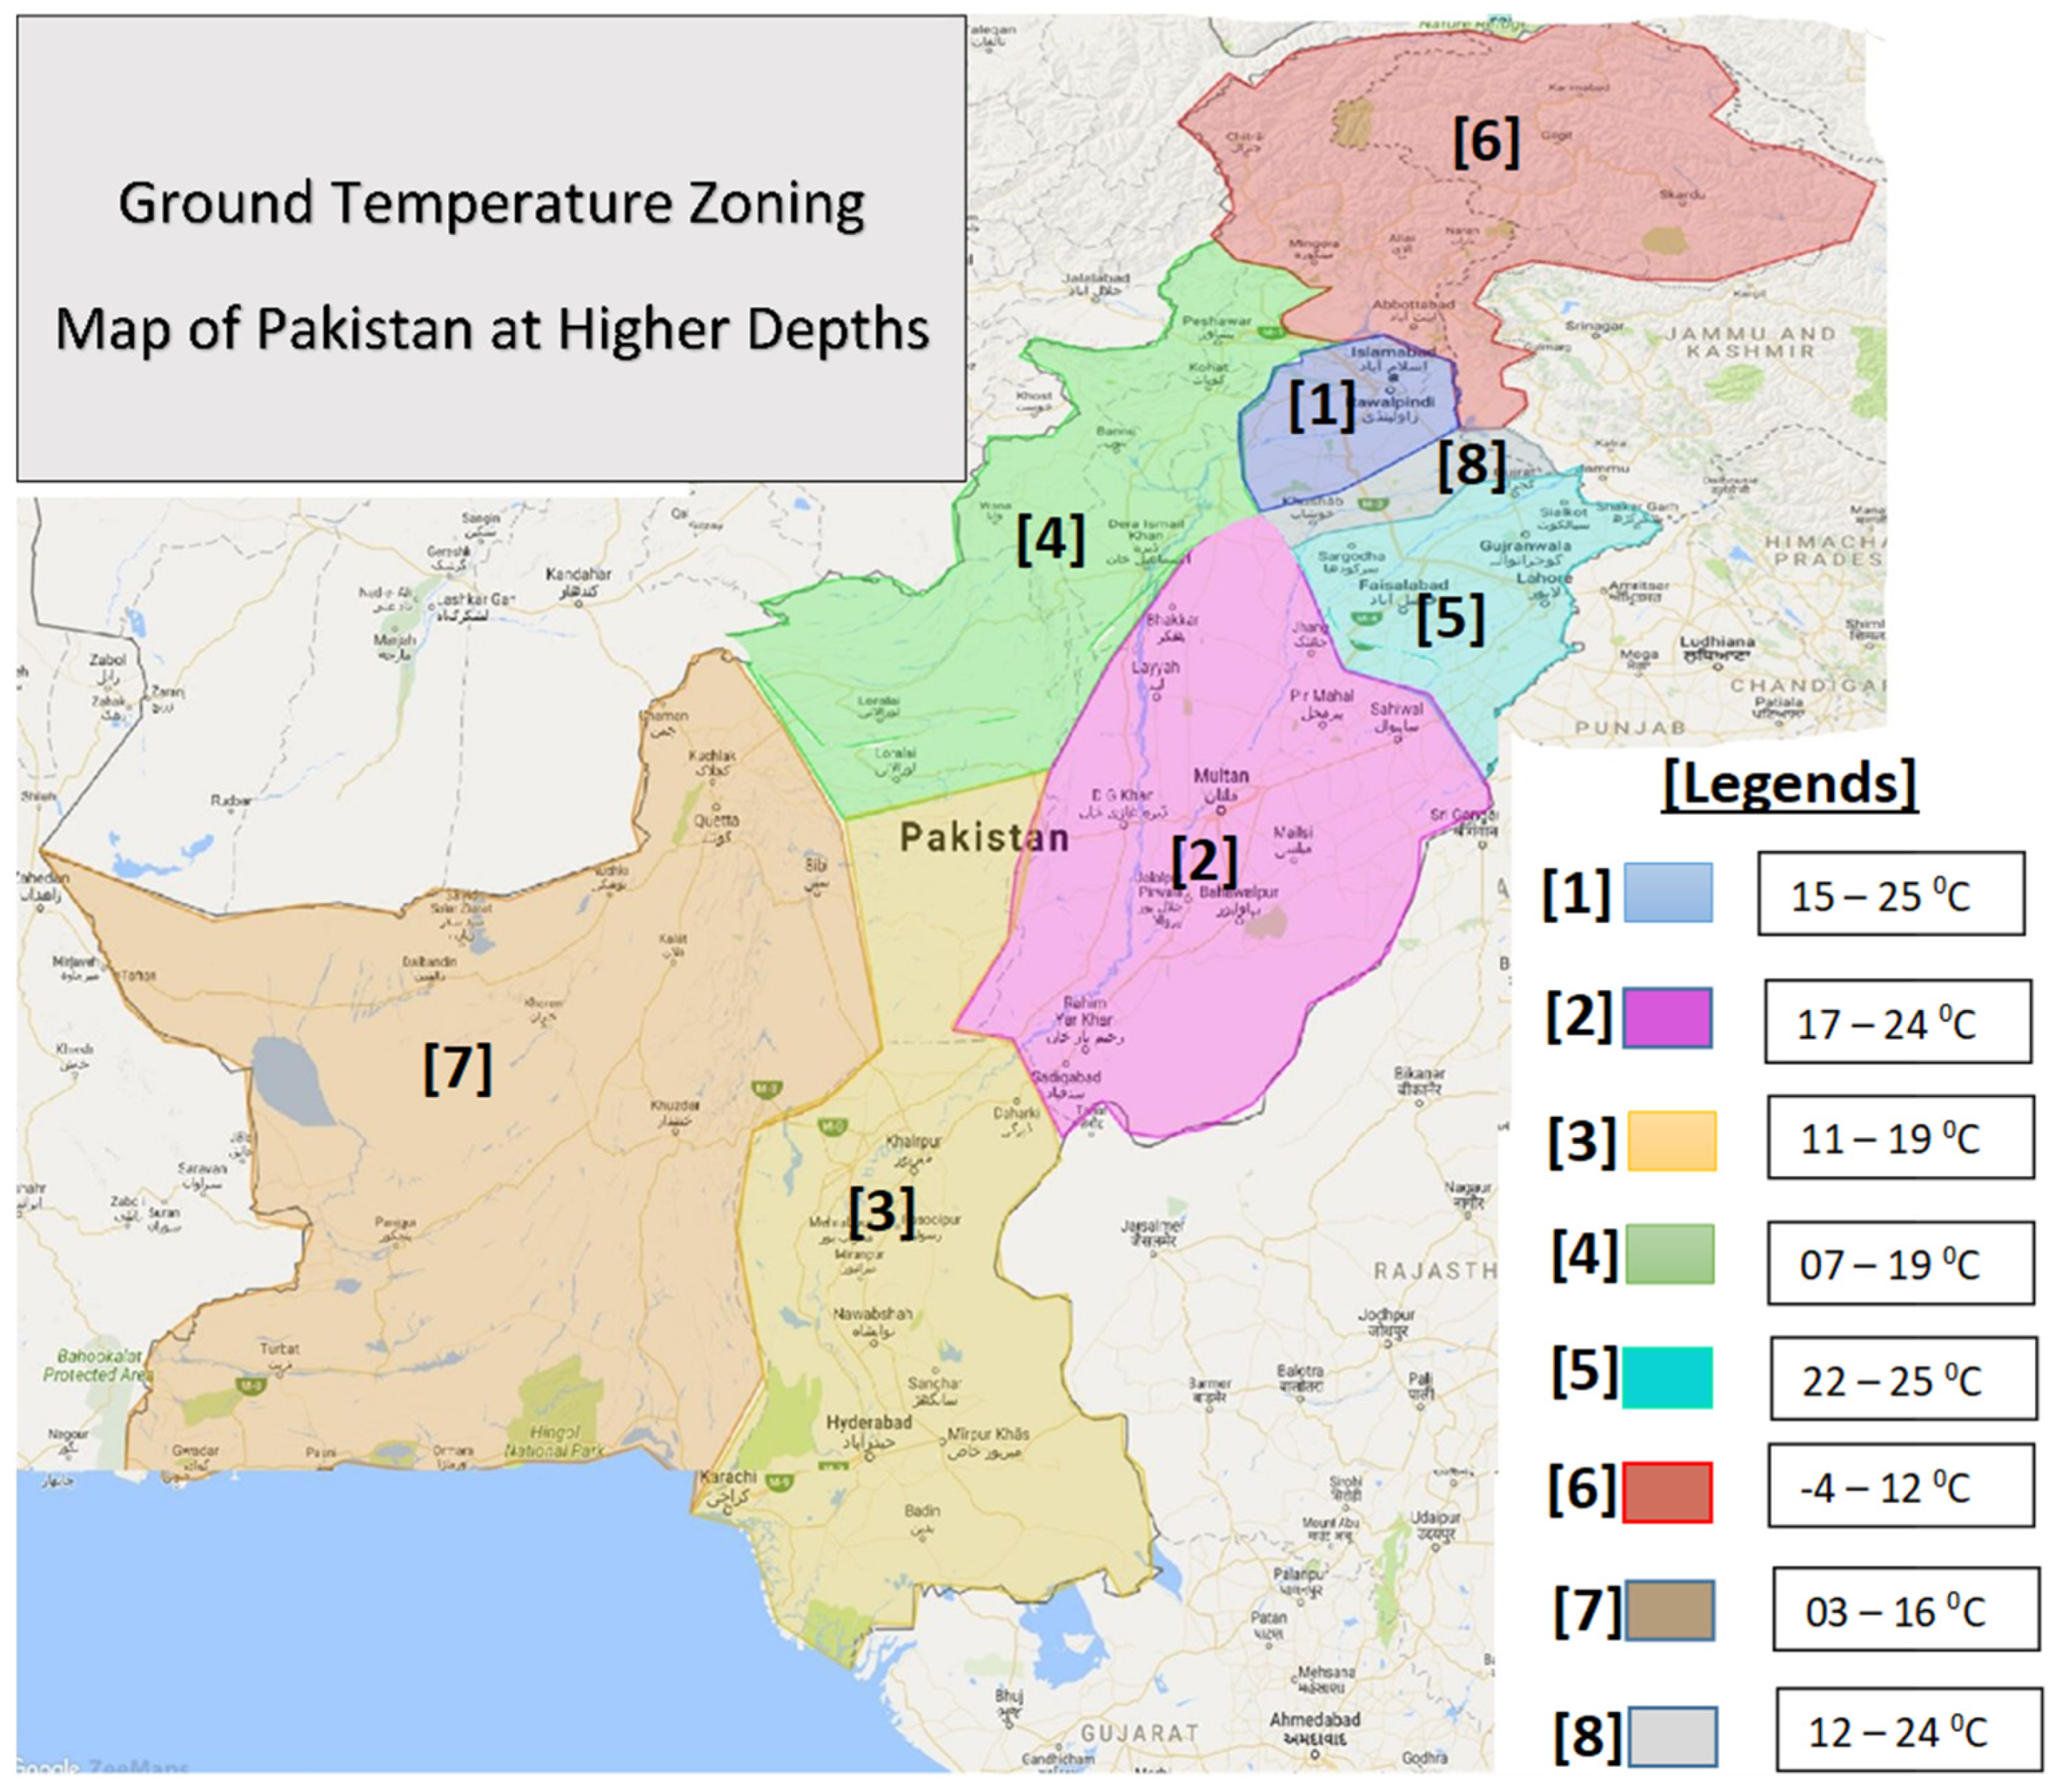
  • The zoning map will allow the designers to workout different ways to improve the energy requirements and efficiency of the buildings and other infra works. Form the charts, it can also be observed that increasing the moisture content of a particular soil can also influence the heat-exchanging capability of that particular soil.
  • The thermal characteristics of soil and rock types greatly influence their heat exchanging and storage capacity. Heat-exchanging capabilities of the same soil can be changed by modifying its physical characteristics or mixing it with other soils.
For future studies, it is recommended that other cities’ data must also be validated for any inconsistencies, as the boreholes were drilled only in one city. In this way, air/ground temperature charts made for other cities of Pakistan and the zoning conducted for geothermal potential by considering the ground temperature, can become more reliable.

Author Contributions

Conceptualization, T.A. and W.H.; methodology, T.A.; software, T.A.; validation, T.A., W.H. and A.H.; formal analysis, A.H.; investigation, T.A., M.H. and M.O.K.; resources, A.H.; data curation, T.A.; writing—original draft preparation, T.A.; writing—review and editing, W.H., M.H. and M.O.K.; visualization, W.H.; supervision, A.H.; project administration, T.A.; funding acquisition, A.H. All authors have read and agreed to the published version of the manuscript.

Funding

This research received no external funding.

Informed Consent Statement

Not applicable.

Data Availability Statement

The data will be available on request.

Conflicts of Interest

The authors declare no conflict of interest.

References

  1. Alcaraz, M.; García-Gil, A.; Vázquez-Suñé, E.; Velasco, V. Use rights markets for shallow geothermal energy management. Appl. Energy 2016, 172, 34–46. [Google Scholar] [CrossRef]
  2. Arshad, F.; Shamshad, M. Energy Crisis in Pakistan: Socio-Economic Implications and the Way Forward. Ann. Soc. Sci. Perspect. 2022, 3, 105–115. [Google Scholar] [CrossRef]
  3. Ali, M.; Wazir, R.; Imran, K.; Ullah, K.; Janjua, A.K.; Ulasyar, A.; Khattak, A.; Guerrero, J.M. Techno-economic assessment and sustainability impact of hybrid energy systems in Gilgit-Baltistan, Pakistan. Energy Rep. 2021, 7, 2546–2562. [Google Scholar] [CrossRef]
  4. Kalair, A.; Abas, N.; Saleem, M.S.; Kalair, A.R.; Khan, N. Role of energy storage systems in energy transition from fossil fuels to renewables. Energy Storage 2021, 3, e135. [Google Scholar] [CrossRef] [Green Version]
  5. Kumari, S. Chapter-5 Global Warming: Causes, Effects and Solutions. In Emerging Trends in Agriculture Sciences; Integrated Publications: New Delhi, India, 2021; p. 67. [Google Scholar]
  6. Wang, L.K.; Wang, M.-H.S.; Wang, N.-Y.; Wong, J.O. Effect of Global Warming and Climate Change on Glaciers and Salmons. In Integrated Natural Resources Management; Springer: Cham, Switzerland, 2021; pp. 1–36. [Google Scholar]
  7. Nautiyal, A.; Ramlal, A. Clean Energy Sources for a Better and Sustainable Environment of Future Generations. In Energy: Crises, Challenges and Solutions; John Wiley & Sons Ltd.: Hoboken, NJ, USA, 2021; pp. 151–168. [Google Scholar]
  8. Dincer, I.; Acar, C. A review on clean energy solutions for better sustainability. Int. J. Energy Res. 2015, 39, 585–606. [Google Scholar] [CrossRef]
  9. Evans, A.; Strezov, V.; Evans, T.J. Assessment of sustainability indicators for renewable energy technologies. Renew. Sustain. Energy Rev. 2009, 13, 1082–1088. [Google Scholar] [CrossRef]
  10. Farooqui, S.Z. Prospects of renewables penetration in the energy mix of Pakistan. Renew. Sustain. Energy Rev. 2014, 29, 693–700. [Google Scholar] [CrossRef]
  11. Khan, H.A.; Pervaiz, S. Technological review on solar PV in Pakistan: Scope, practices and recommendations for optimized system design. Renew. Sustain. Energy Rev. 2013, 23, 147–154. [Google Scholar] [CrossRef]
  12. Hossein, S.; Bukhari, S. Country Update Paper on Pakistan. In Proceedings of the World Geothermal Congress, Melbourne, Australia, 25–29 April 2015; p. 7. [Google Scholar]
  13. Ahmad, M.; Rafique, M.; Iqbal, N.; Fazil, M. Investigation of Origin, Subsurface Processes and Reservoir Temperature of Geothermal Springs Around Koh-i-Sultan Volcano, Chagai, Pakistan; Pakistan Institute of Nuclear Science and Technology: Nilore, Pakistan, 2009. [Google Scholar]
  14. Bakht, M.S. An overview of geothermal resources of pakistan. In Proceedings of the World Geothermal Congress, Khyushu-Tohoku, Japan, 28 May–10 June 2000; pp. 77–83. [Google Scholar]
  15. Ahmad, I.; Rashid, A. Study of geothermal energy resources of Pakistan for electric power generation. Energy Sources Part A Recovery Util. Environ. Eff. 2010, 32, 826–838. [Google Scholar] [CrossRef]
  16. Florides, G.; Kalogirou, S. Measurements of Ground Temperature at Various Depths. In Proceedings of the SET 2004, 3rd International Conference on Sustainable Energy Technologies, Nottingham, UK, 28–30 June 2004; pp. 1–6. [Google Scholar]
  17. Limberger, J.; Boxem, T.; Pluymaekers, M.; Bruhn, D.; Manzella, A.; Calcagno, P.; Beekman, F.; Cloetingh, S.; van Wees, J.-D. Geothermal energy in deep aquifers: A global assessment of the resource base for direct heat utilization. Renew. Sustain. Energy Rev. 2018, 82, 961–975. [Google Scholar] [CrossRef]
  18. Brandl, H. Thermo-active ground-source structures for heating and cooling. Procedia Eng. 2013, 57, 9–18. [Google Scholar] [CrossRef] [Green Version]
  19. Pascal, C.; Elvebakk, H.; Olesen, O. An assessment of deep geothermal resources in Norway. In Proceedings of the Abstracts and Proceedings, World Geothermal Congress, Bali, Indonesia, 25–29 April 2010. [Google Scholar]
  20. Smith, D.P. Fitting geothermal energy into the energy transition. Neth. J. Geosci. 2019, 98, e6. [Google Scholar] [CrossRef] [Green Version]
  21. Manzella, A.; Bonciani, R.; Allansdottir, A.; Botteghi, S.; Donato, A.; Giamberini, S.; Lenzi, A.; Paci, M.; Pellizzone, A.; Scrocca, D. Environmental and social aspects of geothermal energy in Italy. Geothermics 2018, 72, 232–248. [Google Scholar] [CrossRef]
  22. Axelsson, G. Production capacity of geothermal systems. In Proceedings of the Workshop for Decision Makers on the Direct Heating Use of Geothermal Resources in Asia, Tanjin, China, 11–18 May 2008; p. 14. [Google Scholar]
  23. Fridleifsson, I.B.; Bertani, R.; Huenges, E.; Lund, J.W.; Ragnarsson, A.; Rybach, L. The possible role and contribution of geothermal energy to the mitigation of climate change. In Proceedings of the IPCC Scoping Meeting on Renewable Energy Sources, Luebeck, Germany, 20–25 January 2008; Citeseer: Princeton, NJ, USA, 2008; Volume 20, pp. 59–80. [Google Scholar]
  24. Sowizdzal, A. Geothermal energy resources in Poland–Overview of the current state of knowledge. Renew. Sustain. Energy Rev. 2017, 82, 4020–4027. [Google Scholar] [CrossRef]
  25. Litjens, G.B.M.A.; Worrell, E.; Van Sark, W.G.J.H.M. Lowering greenhouse gas emissions in the built environment by combining ground source heat pumps, photovoltaics and battery storage. Energy Build. 2018, 180, 51–71. [Google Scholar] [CrossRef]
  26. Adalı, Z.; Dinçer, H.; Eti, S.; Mikhaylov, A.; Yüksel, S. Identifying new perspectives on geothermal energy investments. In Multidimensional Strategic Outlook on Global Competitive Energy Economics and Finance; Emerald Publishing Limited: Bingley, UK, 2022. [Google Scholar]
  27. Kusuda, T.; Archenbach, P. Earth temperature and thermal diffusivity at selected stations in the United States. ASHRAE Trans. 1965, 71, 61–75. [Google Scholar]
  28. Muhammad, I.S.; Baharun, A.; Ibrahim, H.S. Investigation of ground temperature for heat sink application in kuching, sarawak, malaysia. J. Civ. Eng. 2016, 7, 20–29. [Google Scholar] [CrossRef] [Green Version]
  29. Florides, G.; Kalogirou, S. Annual ground temperature measurements at various depths. In Proceedings of the 8th REHVA World Congress, Proceedings of CLIMA 2005, Lausanne, Switzerland, 9–12 October 2005; pp. 1–6. [Google Scholar]
Figure 1. Ground temperature at different depths using Kusuda Equation.
Eng 04 00104 g001
Figure 2. Ground Temperature at different depths from thermometers in the boreholes.
Eng 04 00104 g002
Figure 3. Comparison of Numerical approach (Kusuda Equation) and Experimental Results.
Eng 04 00104 g003
Figure 4. Ground temperature correlation charts. (a) Clay (b) Sand (c) Shale (d) Gravel.
Eng 04 00104 g004aEng 04 00104 g004b
Figure 5. Initial Temperature Graphs obtained for different soil types for (a) January and (b) June.
Eng 04 00104 g005
Figure 6. A/G charts for various types of soils, rocks and moisture conditions.
Eng 04 00104 g006aEng 04 00104 g006b
Figure 7. Ground Temperature envelope for all soils and rocks considered.
Eng 04 00104 g007
Figure 8. Zoning of Pakistan based on Ground Temperature for Geothermal potential.
Eng 04 00104 g008
Disclaimer/Publisher’s Note: The statements, opinions and data contained in all publications are solely those of the individual author(s) and contributor(s) and not of MDPI and/or the editor(s). MDPI and/or the editor(s) disclaim responsibility for any injury to people or property resulting from any ideas, methods, instructions or products referred to in the content.

