Review

A Review on Vibration Monitoring Techniques for Predictive Maintenance of Rotating Machinery

by
Marcelo Romanssini
*,
Paulo César C. de Aguirre
,
Lucas Compassi-Severo
and
Alessandro G. Girardi
*
Computer Architecture and Microelectronics Group, Federal University of Pampa, Alegrete 97546-550, Brazil
*
Authors to whom correspondence should be addressed.
Eng 2023, 4(3), 1797-1817; https://doi.org/10.3390/eng4030102
Submission received: 15 May 2023 / Revised: 21 June 2023 / Accepted: 23 June 2023 / Published: 26 June 2023
(This article belongs to the Special Issue Feature Papers in Eng 2023)

Abstract

:
Machine failure in modern industry leads to lost production and reduced competitiveness. Maintenance costs represent between 15% and 60% of the manufacturing cost of the final product, and in heavy industry, these costs can be as high as 50% of the total production cost. Predictive maintenance is an efficient technique to avoid unexpected maintenance stops during production in industry. Vibration measurement is the main non-invasive method for locating and predicting faults in rotating machine components. This paper reviews the techniques and tools used to collect and analyze vibration data, as well as the methods used to interpret and diagnose faults in rotating machinery. The main steps of this technique are discussed, including data acquisition, data transmission, signal processing, and fault detection. Predictive maintenance through vibration analysis is a key strategy for cost reduction and a mandatory application in modern industry.

1. Introduction

Rotating machinery is used in a variety of industries. They include equipment such as motors, pumps, fans, generators, compressors, and more. Motors and generators are essential to the operation of an industrial facility to maintain productivity, efficiency, and safety of operations. Research on the reliability of electrical machines has identified that failures can occur in all engine components [1]. Machine failures often occur due to continuous operation and various cyclic loading situations. This process leads to gradual wear of components, which increases the risk of failure [2]. This wear of machine components can be considered normal and is a consequence of machine operation. What is not normal, however, is the operation of these components under critical conditions, compromising the integrity of components in good condition and exposing the machine to total failure.
Machine failure results in production losses and increased maintenance costs. According to the literature, maintenance costs account for between 15% and 60% of the manufacturing cost of the final product, and in heavy industry, these costs can be as high as 50% of the total production cost [3]. These costs can be avoided by choosing an efficient maintenance strategy, which allows for detecting and correcting the problem in time. The main objective of the maintenance techniques strategy is to increase the availability of machines with lower maintenance costs [4].
Maintenance techniques can be basically divided into three types, breakdown maintenance, preventive maintenance, and predictive maintenance (PdM) [4,5]. Among the techniques used for equipment maintenance, PdM has proven to be the most efficient in the industrial environment. PdM is based on the analysis of data collected through monitoring or inspections [6]. The data are collected from machines to determine the health status and define the maintenance strategy. Various techniques are available for monitoring machine health, such as acoustic emission, vibration monitoring, temperature monitoring, noise monitoring, current monitoring, oil and debris monitoring, and corrosion monitoring. Each technique has its proper characteristic of application and use [2,3,4].
Faults can be detected by a variety of diagnostic methods. Among the various techniques used in predictive maintenance, vibration analysis has emerged as a valuable tool. By analyzing the vibration patterns of machines, it becomes possible to detect abnormalities and early signs of faults. Vibration monitoring has proven to be an effective method for locating faults in machine components [3,4,7]. Vibrations are oscillatory movements of equipment around its equilibrium position. Any change in signal amplitude or frequency indicates that machine performance is impaired [8].
Vibration analysis can be an effective tool for diagnosing faults of looseness, eccentricity, imbalance, blade defects, misalignment, defective bearings, damaged gears, and cracked or bent shafts [9,10]. As a result, this technique has emerged as a powerful and well-established PdM technique for rotating machines [11]. Compared to other PdM techniques, vibration analysis offers several advantages, such as high accuracy, sensitivity to a wide range of defect types, and it is a noninvasive and nondestructive method [12,13]. However, this method also has some disadvantages, such as the difficulty of fault detection in machines with low rotations [14], the need for continuous monitoring, and the need for reliable sensors to collect machine data.
Figure 1 shows an example of a system installed in an electrical machine located in an industry for continuously monitoring vibration. Figure 2 shows the detail of an IoT vibration monitoring system that is able to measure four points simultaneously in the same machine.
The process of fault diagnosis in machine monitoring by vibration analysis mainly consists of four steps: data acquisition, data transmission, signal processing, and fault detection. The main steps of fault diagnosis in rotating machinery by vibration analysis are shown in Figure 3. Data acquisition can be performed using many vibration measurement devices available on the market. These devices can use different types of transducers to perform a measurement. Among the types of sensors used to acquire the vibration signal, the accelerometer is the most commonly used [16]. Signal processing consists of manipulating, filtering, digitizing, and analyzing raw data to extract meaningful information. It is a crucial aspect of vibration analysis because it allows the extraction of patterns and insights from a large amount of vibration data that would otherwise be difficult to interpret [17,18]. Fault detection is the final step of the vibration analysis process. In this stage the vibration signal is recorded in the time or frequency domain. Then, this signal is interpreted by an expert to determine the type of fault and its location [19].
Evaluating life prediction through vibration analysis is challenging in terms of capturing the hidden nonlinear fault dynamics and adequately representing them with engineering characteristics. Vibration signals in rotating machinery are non-stationary, which complicates their analysis due to changing time–frequency characteristics. Bearing faults present a particular challenge because traditional methods assume only rolling behavior, while a combination of rolling and sliding causes dynamic frequency shifts. Non-stationary early vibration signals dominated by external vibrations and the presence of multiple simultaneous faults further complicate accurate fault diagnosis. Disturbances from additional vibration sources, such as bearing looseness, increase the complexity of the analysis. Overcoming these challenges requires advanced signal processing, feature extraction, and fault diagnosis algorithms capable of handling nonlinear dynamics and extracting relevant information from complex vibration signals [20].
To improve fault analysis, different types of signals can be acquired simultaneously, such as vibration signals, acoustic emissions, temperature, etc. More system information leads to a more accurate estimate of the machine’s condition. Compared to the scenario where data from a single sensor are used, better predictive performance can be achieved by fusing data from multiple sensors [21].
Artificial intelligence (AI) and machine learning (ML) have been used for detecting faults. This method does not require an expert to perform the analysis and has been the subject of much research in recent years [19,22]. One issue facing the adoption of machine learning algorithms is the need for large data sets, which generally require access to machine data from multiple companies and factories. Despite the potential benefits of data sharing, this solution is not usually preferred due to the importance of data privacy in real-world industries. To address this problem, the work of [23] proposes a federated transfer learning method for machine fault diagnosis, where customer-invariant features can be extracted for diagnosis while maintaining data privacy.
Given the importance of vibration analysis for the predictive maintenance of rotating machines in order to reduce maintenance costs, as well as reduce machine downtime, this work provides an overview of some techniques and tools used to collect and analyze vibration data, as well as methods of interpreting and diagnosing faults in rotating machinery using this data. The rest of this article is organized as follows: Section 2 describes the types of sensors and the techniques for mounting the sensor on the machine that are used to collect vibration data; Section 3 discusses the main ways to transmit the acquired data, namely conventional cable transmission and wireless transmission; Section 4 presents the main techniques for processing vibration signals and methods for identifying faults in rotating machinery; and Section 5 provides concluding remarks.

2. Data Acquisition

To measure machinery vibration, a transducer or a vibration pickup is used. A transducer is a device that converts changes in mechanical quantities into changes in other physical quantities, usually an electrical signal proportional to a parameter of the experienced motion. There are three commonly used transducers for vibration measurement: displacement sensors, velocity sensors, and accelerometers [24]. Each sensor has some advantages and disadvantages, depending on the application. The type of sensor used is basically determined by the frequency range, sensitivity, and operating limits.
New approaches have been proposed, such as the use of vision data from the event-based camera [25]. However, accelerometers are most commonly used because of their greater accuracy, measurement range, ease of mounting, and cost. Moreover, it is relatively simple to numerically integrate the acceleration signal and obtain the velocity and displacement [26,27]. The next subsections discuss the main characteristics of these three types of sensors.

2.1. Displacement Transducers

Displacement transducers use capacitive, optical, or ultrasonic principles to measure vibration displacement. They are suitable for measuring vibration frequencies below 10 Hz [28]. There are several types of displacement transducers, some of which are based on variable resistance and others on induced currents. The most used for predictive maintenance in rotating machines are those based on induced currents [26]. These transducers, also called eddy current sensors or gap current sensors, are installed a short distance from the surface whose vibrations are to be measured. The eddy current sensor uses a high-frequency current in a coil inside the sensor head to generate a high-frequency magnetic field. When this magnetic field achieves a conductor in the measuring object, an eddy current is generated on the surface of the measuring object, and the impedance of the sensor coil changes. This change in impedance is proportional to the gap between the transducer and the vibrating surface [29]. The main advantage of this type of sensor over others is its application in low-frequency measurements and its great temperature stability [26]. Furthermore, it requires a simple processing circuit. This sensor can easily identify problems such as imbalance and misalignment in electrical motors or generators. On the other hand, the disadvantages are that this type of sensor is difficult to install, it is susceptible to shocks, and the calibration depends on the type of surface material [30].

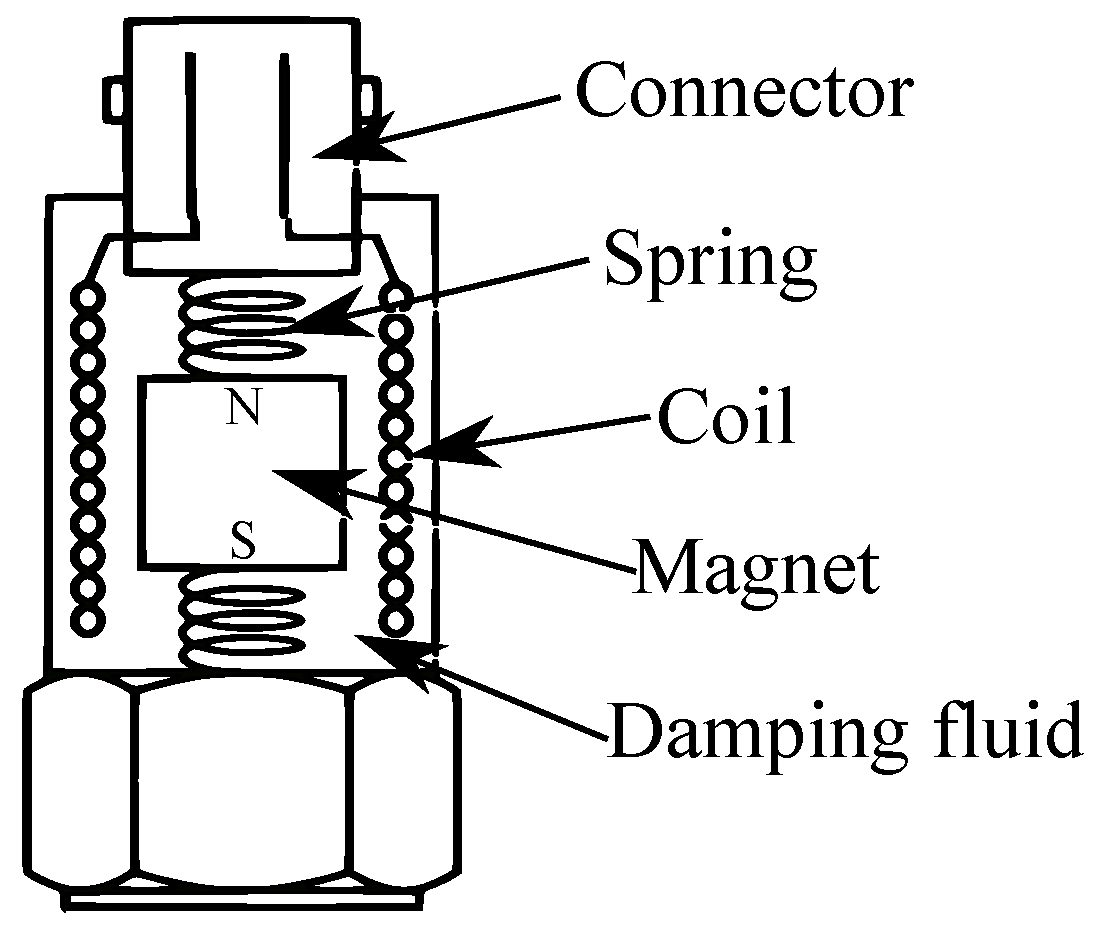
2.2. Velocity Transducer

Velocity transducers are electromechanical sensors designed to directly measure vibratory movement. The velocity sensor is basically composed of three parts: a permanent magnet, a coil of wire, and spring supports. The schematic of the velocity sensor is shown in Figure 4. This type of sensor is based on the principle of electromagnetic induction. The movement of a coil within the magnetic field results in the generation of an induced voltage across the end wires of the coil. This voltage is produced by the transfer of energy from the magnetic field of the magnet to the wire coil. When the coil is subjected to vibration, it experiences relative movement with respect to the magnet, which leads to the induction of a voltage signal. This voltage signal is directly proportional to the speed of vibration applied to the sensor. An advantage is that this sensor does not need any external power supply for its operation. The sensitivity of the velocity is constant over a specified frequency range, usually between 10 Hz and 1000 Hz. The sensitivity decreases at low vibration frequencies, which causes inaccurate readings at vibration frequencies below 10 Hz [24,28].
Other advantages of velocity sensors are the ease of installation, strong signal in the mid-frequency range, and low cost when compared to piezoelectric accelerometers. The disadvantages include the relative large size, weight, variable sensitivity to input frequencies, narrow frequency response, moving parts, and sensitivity to magnetic interference [24,26].

2.3. Accelerometers

Accelerometers are electromechanical transducers designed for measuring linear acceleration and are the most popular transducers used for rotating machinery applications [24]. There are many types of accelerometers, however, for measuring the vibration of rotating machines, the most used are the piezoelectric and microelectromechanical system (MEMS) accelerometers. These sensors can be uniaxial—detecting acceleration in only one axis—or triaxial—when the accelerometer can identify movements in three dimensions. Compared to the uniaxial accelerometer, the triaxial accelerometer demands a larger memory capacity, resulting in a higher cost [30].

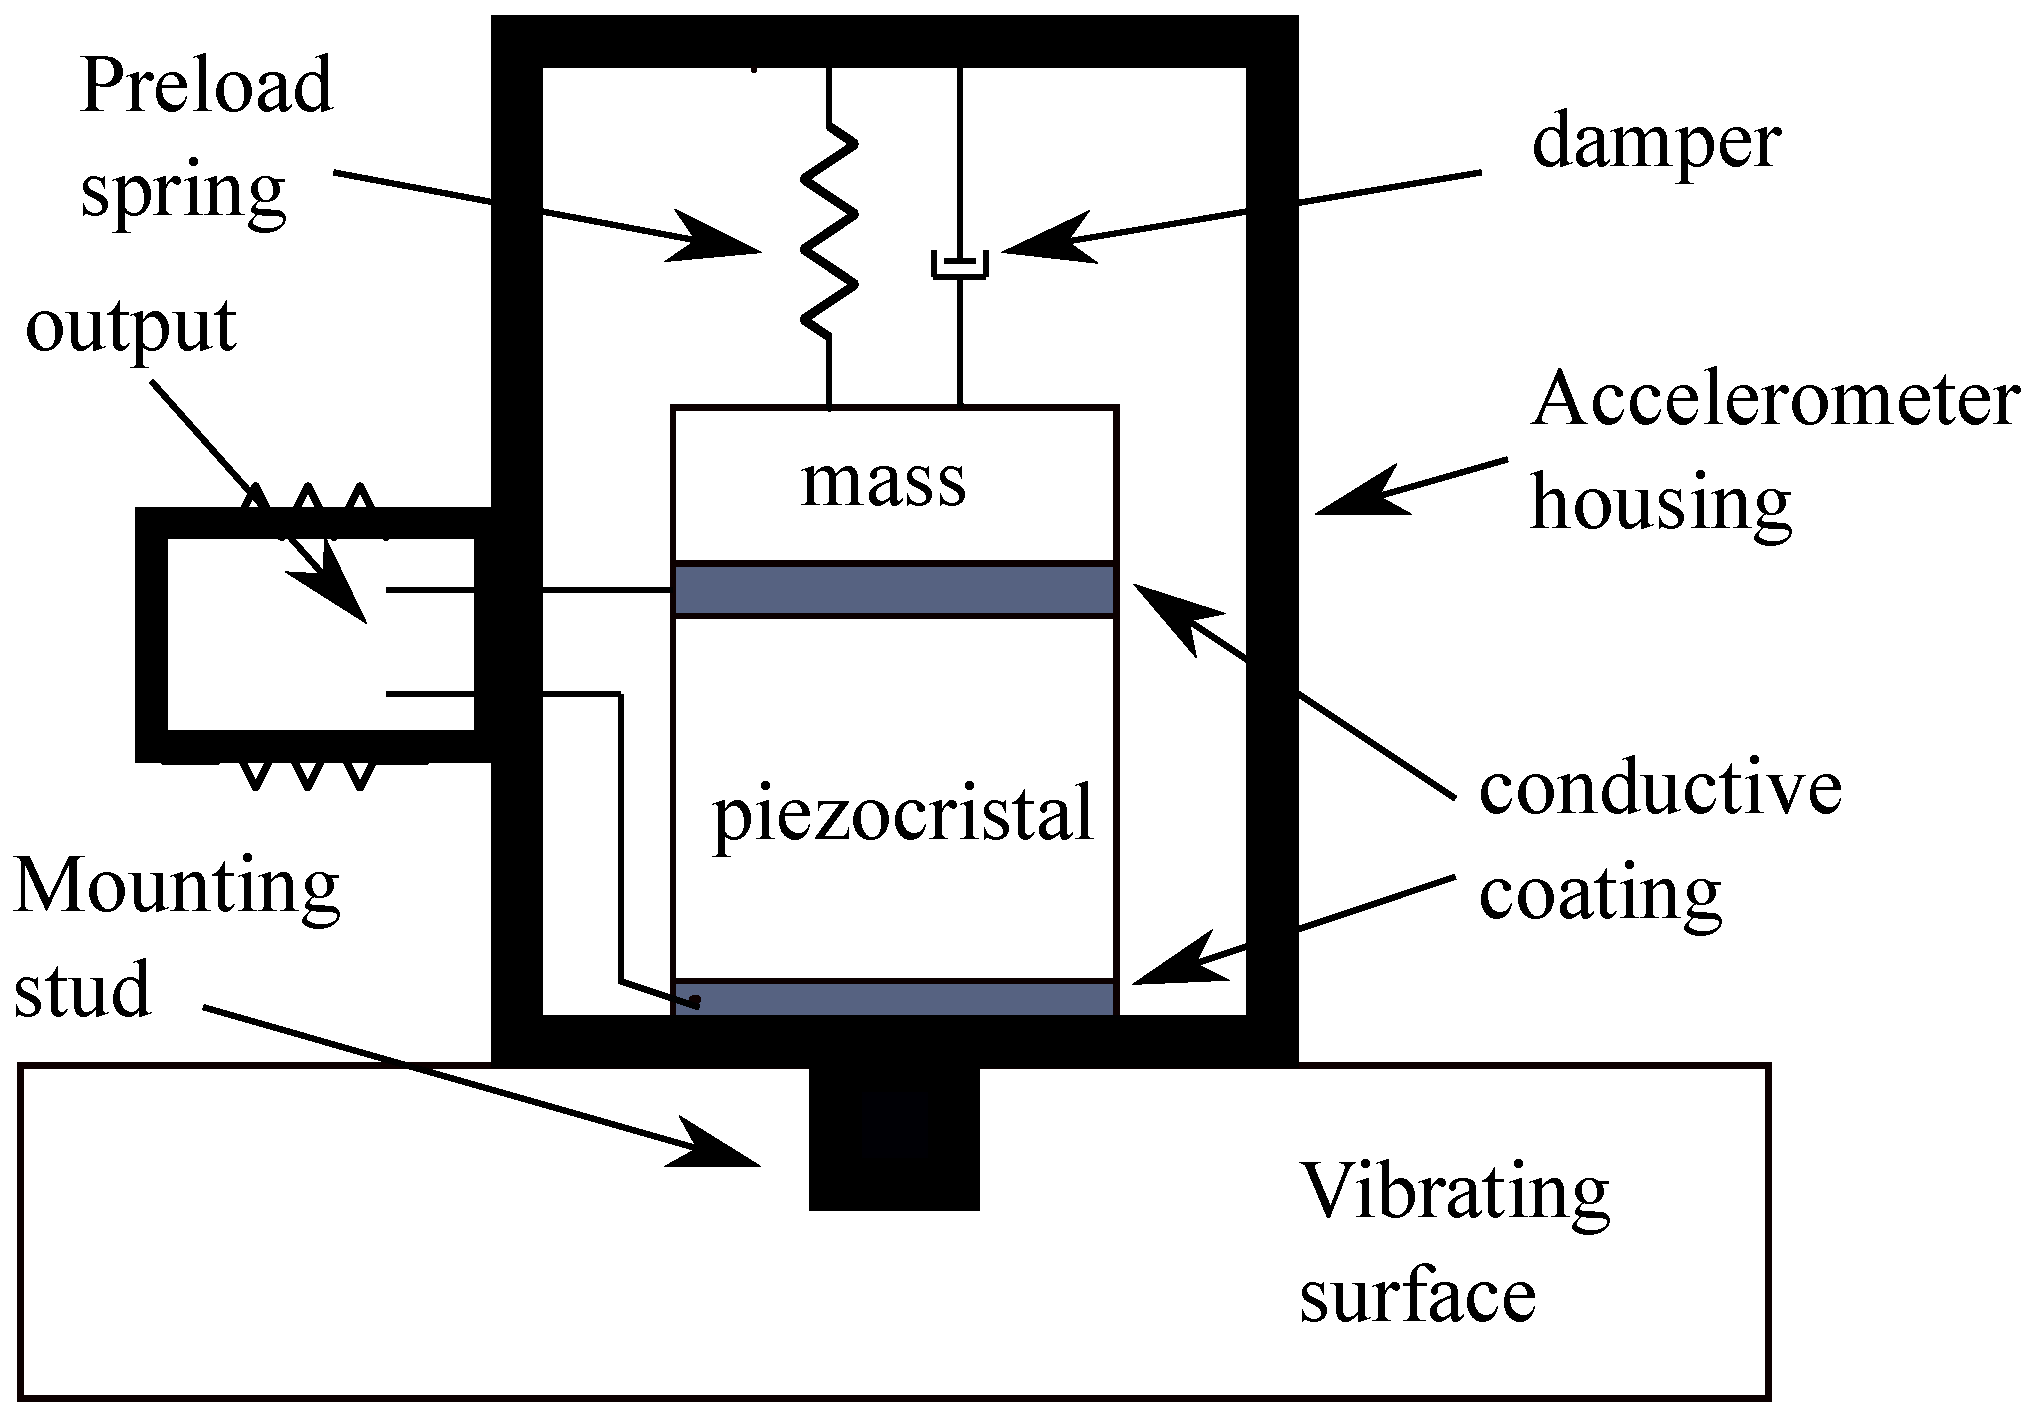
2.3.1. Piezoelectric Accelerometer

The piezoelectric accelerometer produces an electrical signal in the output proportional to the incident acceleration. The working mechanism is based on the piezoelectric effect, which converts mechanical motion to a voltage signal. When the piezoelectric crystal of the sensor is deformed by an external force (acceleration), it generates a certain potential difference between its terminals that is proportional to the force to which it is subjected [26,31]. A representation of the piezoelectric sensor and its components can be seen in Figure 5. This type of accelerometer is one of the most used transducers for measuring vibrations, as it presents the best general characteristics when compared to the other transducers. It has a wide frequency range and presents a dynamic range with good linearity. It is relatively robust and stable so its characteristics remain stable for a long period of time. Piezoelectric accelerometers have greater reliability when compared to other types of sensors, being able to operate in a frequency range of 1 Hz to 30 kHz; therefore, they are suitable for measuring high-frequency vibrations [24,27].

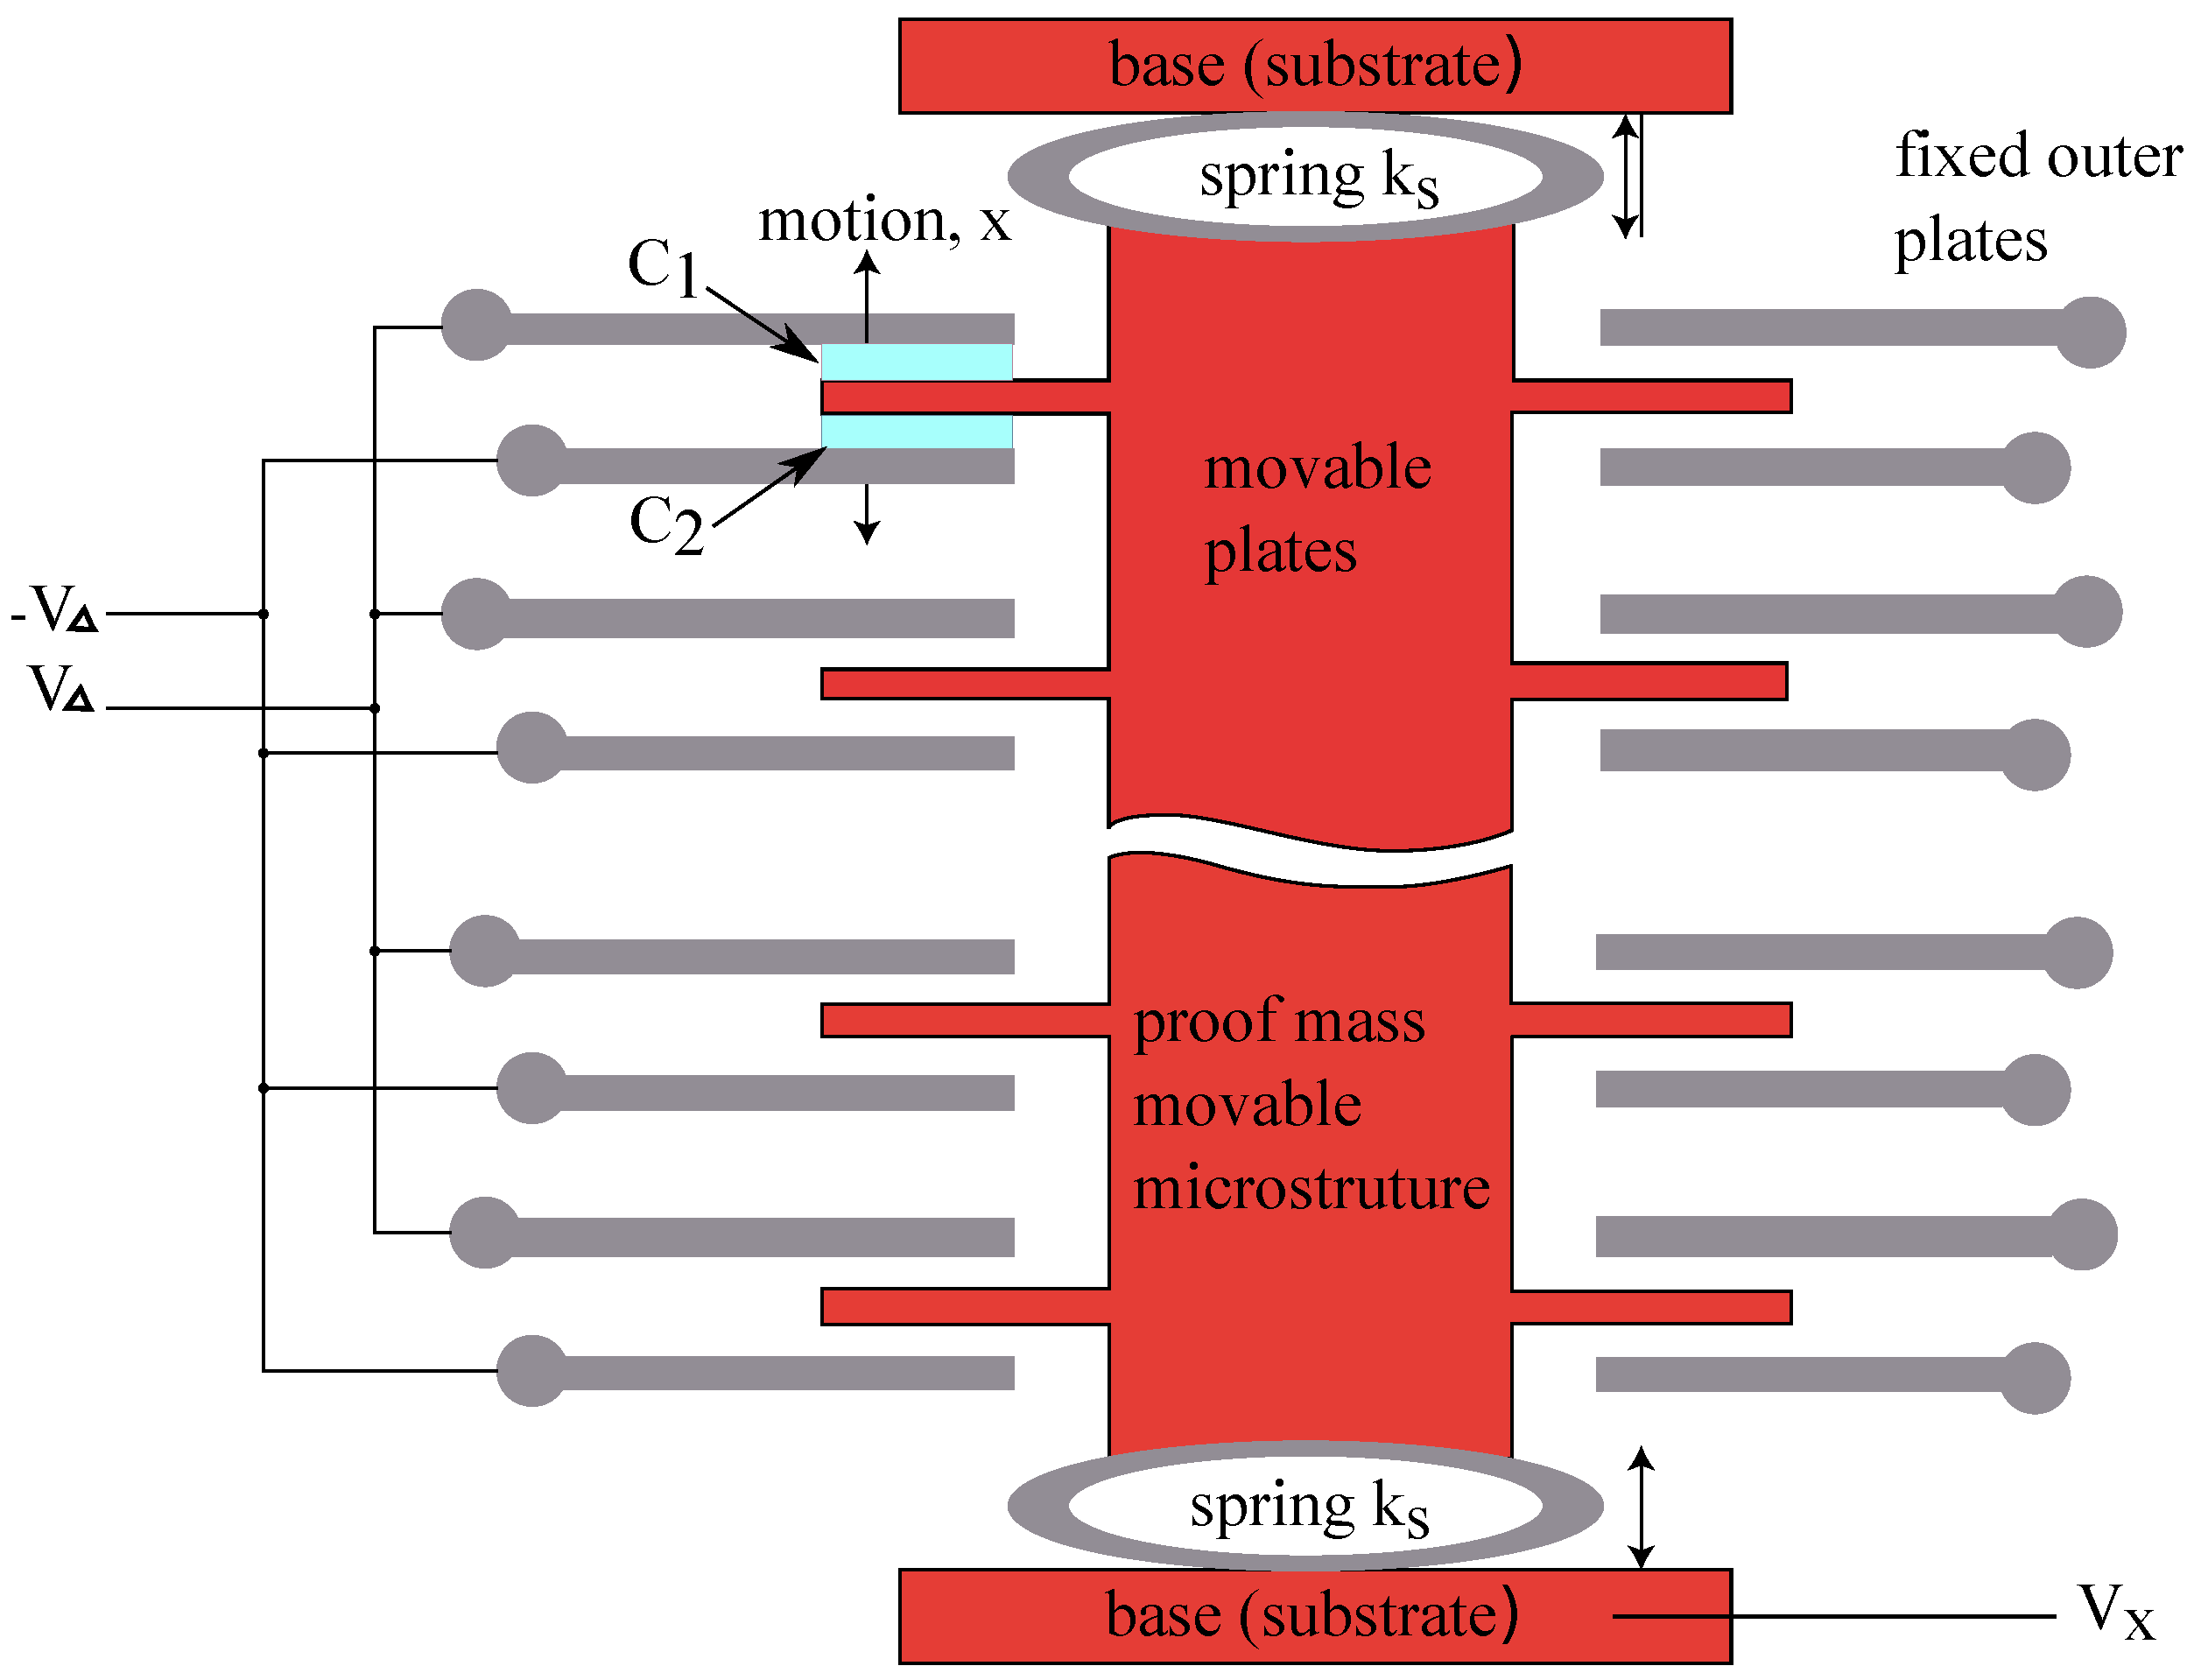
2.3.2. MEMS Accelerometer

The rapid development of semiconductor microfabrication techniques made possible the creation of devices composed of mechanical parts with dimensions of up to a few micrometers [32]. It led to the development of micro-electro mechanical system (MEMS) accelerometers. These devices are characterized by their small size and low cost compared with the piezoelectric accelerometers [33]. As a result, MEMS accelerometers are particularly attractive for vibration monitoring in rotating structures [34].
MEMS accelerometers can be implemented based on piezoresistive or capacitive principles. Capacitive MEMS accelerometers are less sensitive to thermal excitation, which enables capacitance sensing to provide a wider operating temperature range [33]. They present three fundamental structures for their operation: the mobile test mass, the spring region, and the fixed structures or capacitive fingers. Figure 6 depicts these elements. The capacitive fingers are placed on both sides of the accelerometer. The accelerometer design allows for lateral movement of the test mass. When the sensor is at rest, the capacitance is equal on both sides of the test mass. When the device is under the effect of acceleration in a given direction, the mass moves in the opposite direction, so the capacitances formed between the fingers and the fixed structure on both sides are different. The acceleration is measured by reading the changes in the differential capacitance [35].
Most of the MEMS accelerometers available in the market are capable of measuring accelerations in three perpendicular directions simultaneously. Furthermore, MEMS accelerometers allow the easy acquisition of analog or digital signals, even with cheap microcontrollers. This can be considered the biggest advantage over traditional accelerometers, which are more accurate and reliable but require wires to transmit the collected data and still need a more robust signal conditioning circuit [34].
MEMS accelerometers have been implemented and tested for vibration measurement in a wide variety of machines, primarily because of their ease of integration into IoT systems. Rossi et al. [34] compared the use of a piezoelectric accelerometer with a MEMS accelerometer connected to a Raspberry PI microcontroller to measure vibration in a rotating machine. As a result, they found a difference of less than 5% between the data measured by the MEMS accelerometer system and the piezoelectric accelerometer. In recent years, several publications and studies that use MEMS accelerometers to measure vibration can be found. This is due to the evolution of fabrication technology that makes MEMS accelerometers more accurate, with a wide operating frequency range and at a lower cost compared to piezoelectric accelerometers.

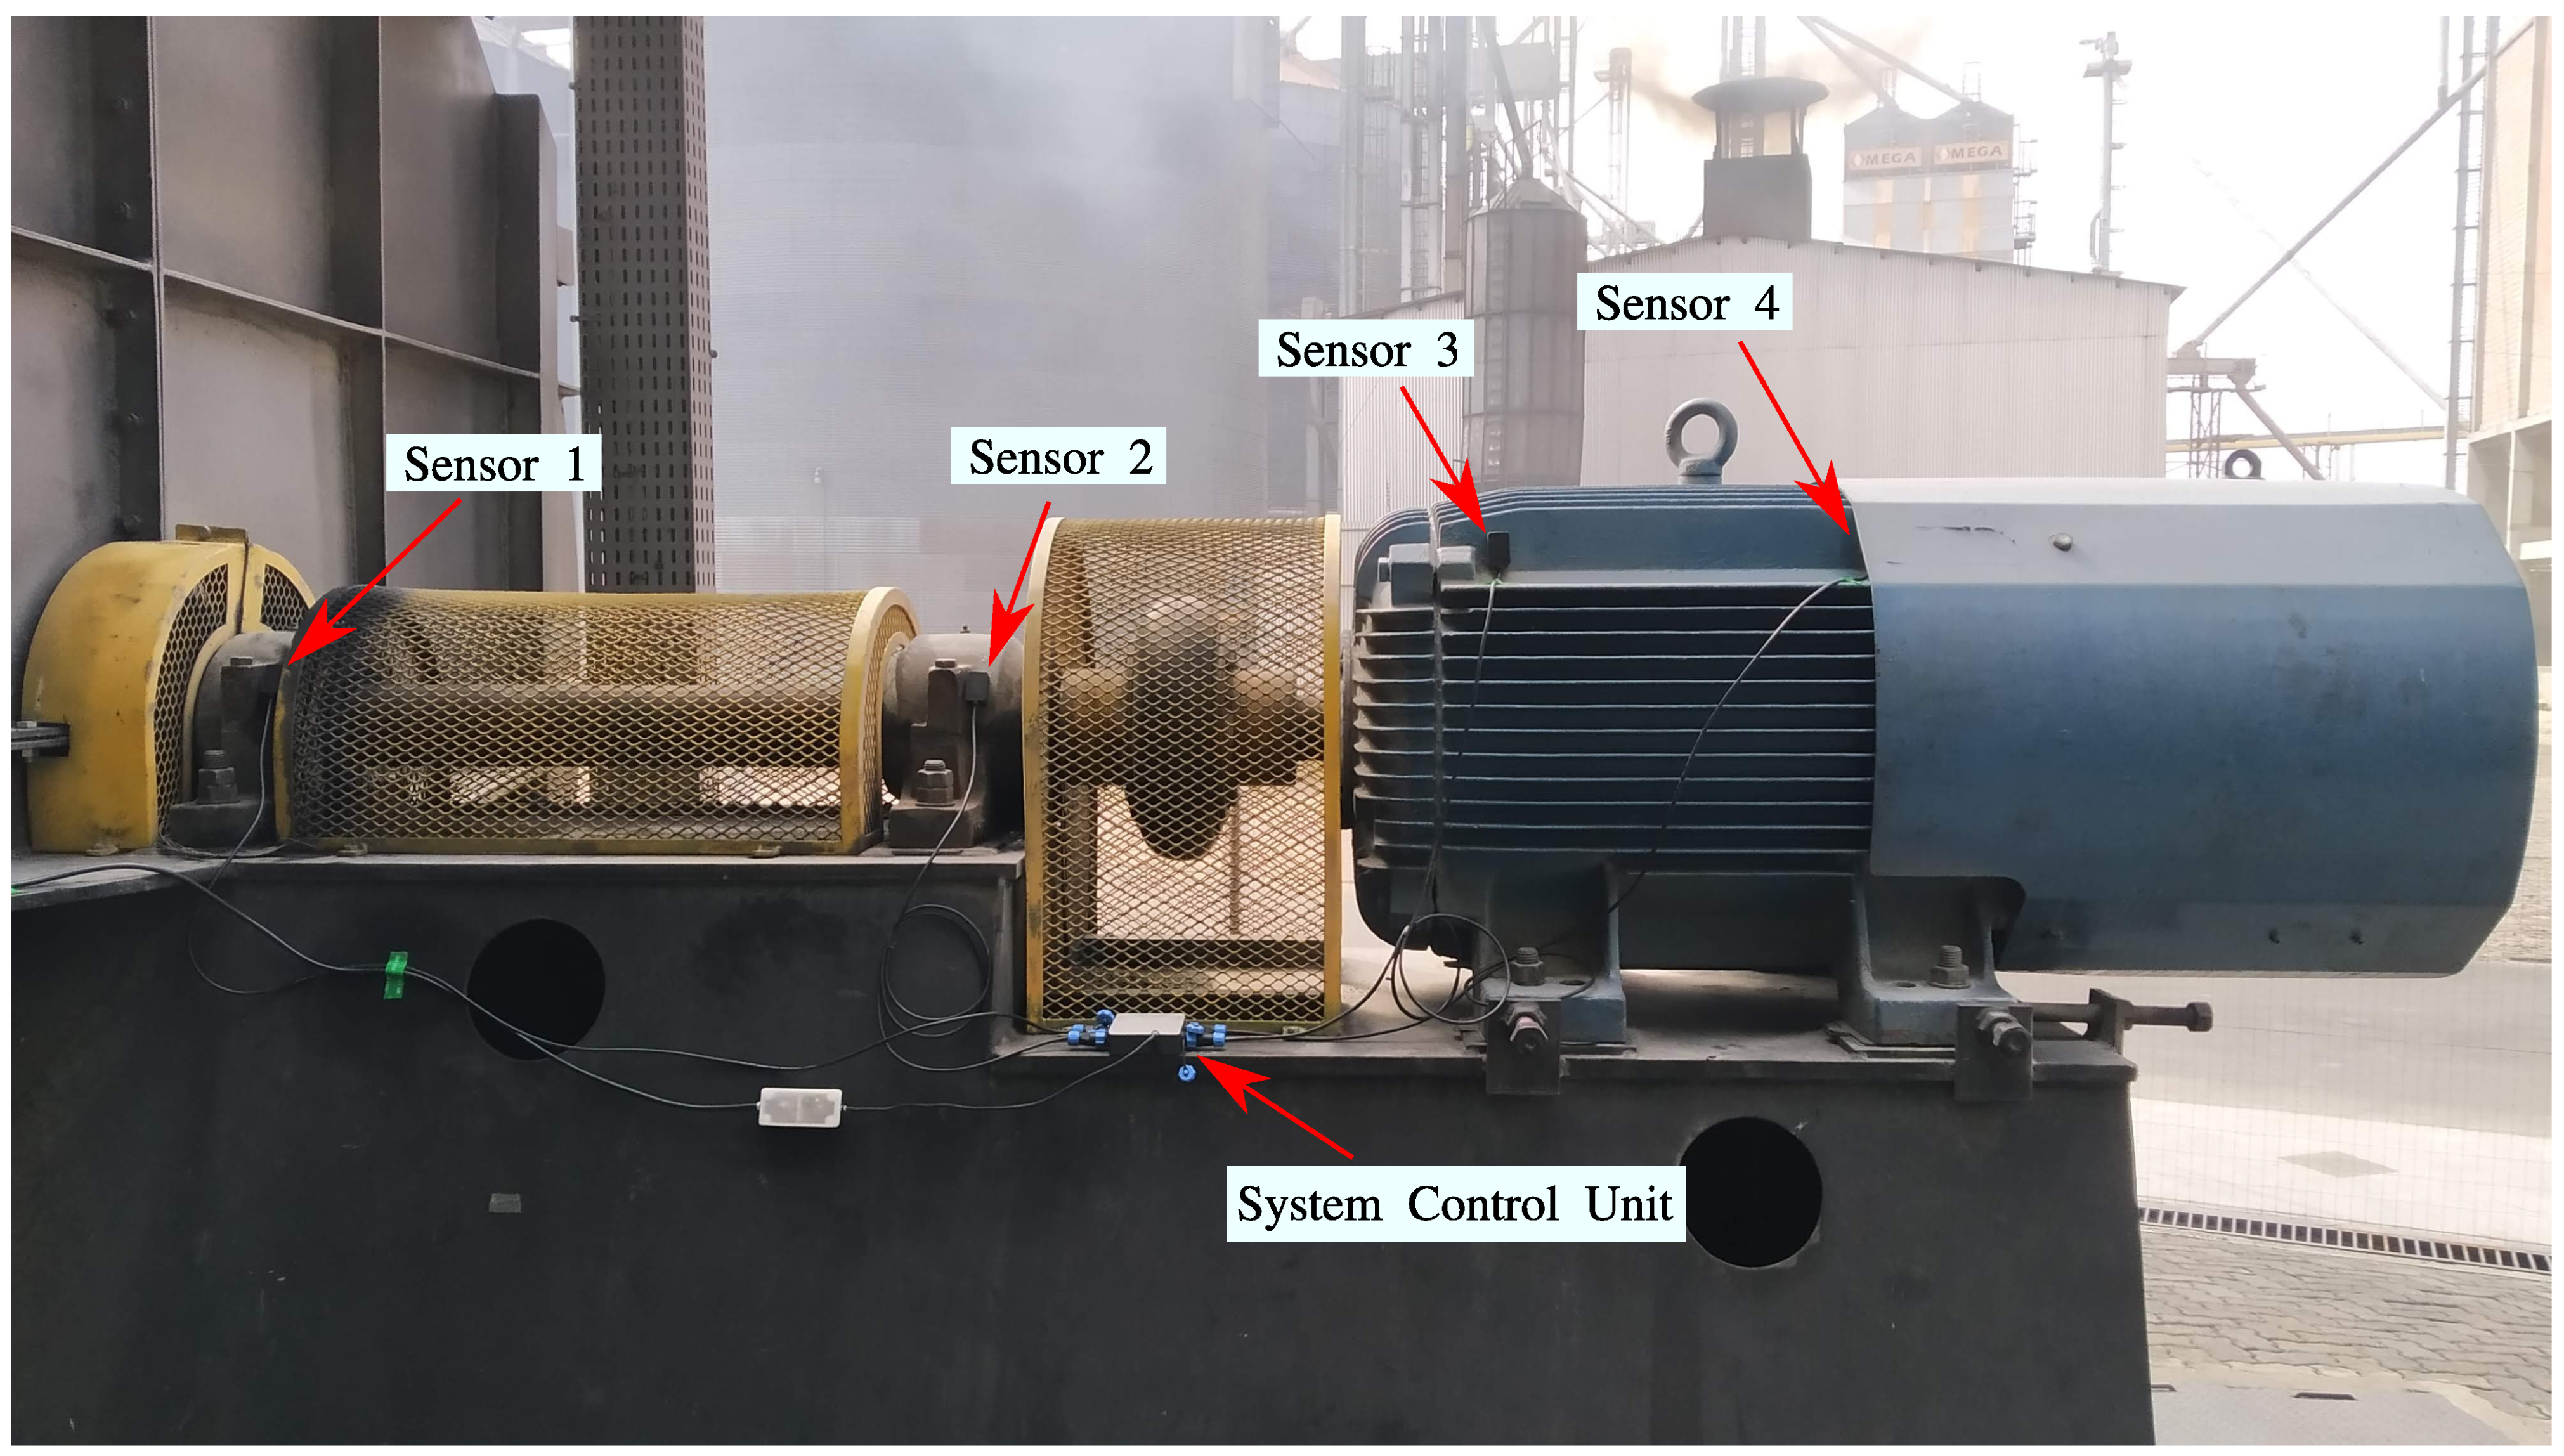
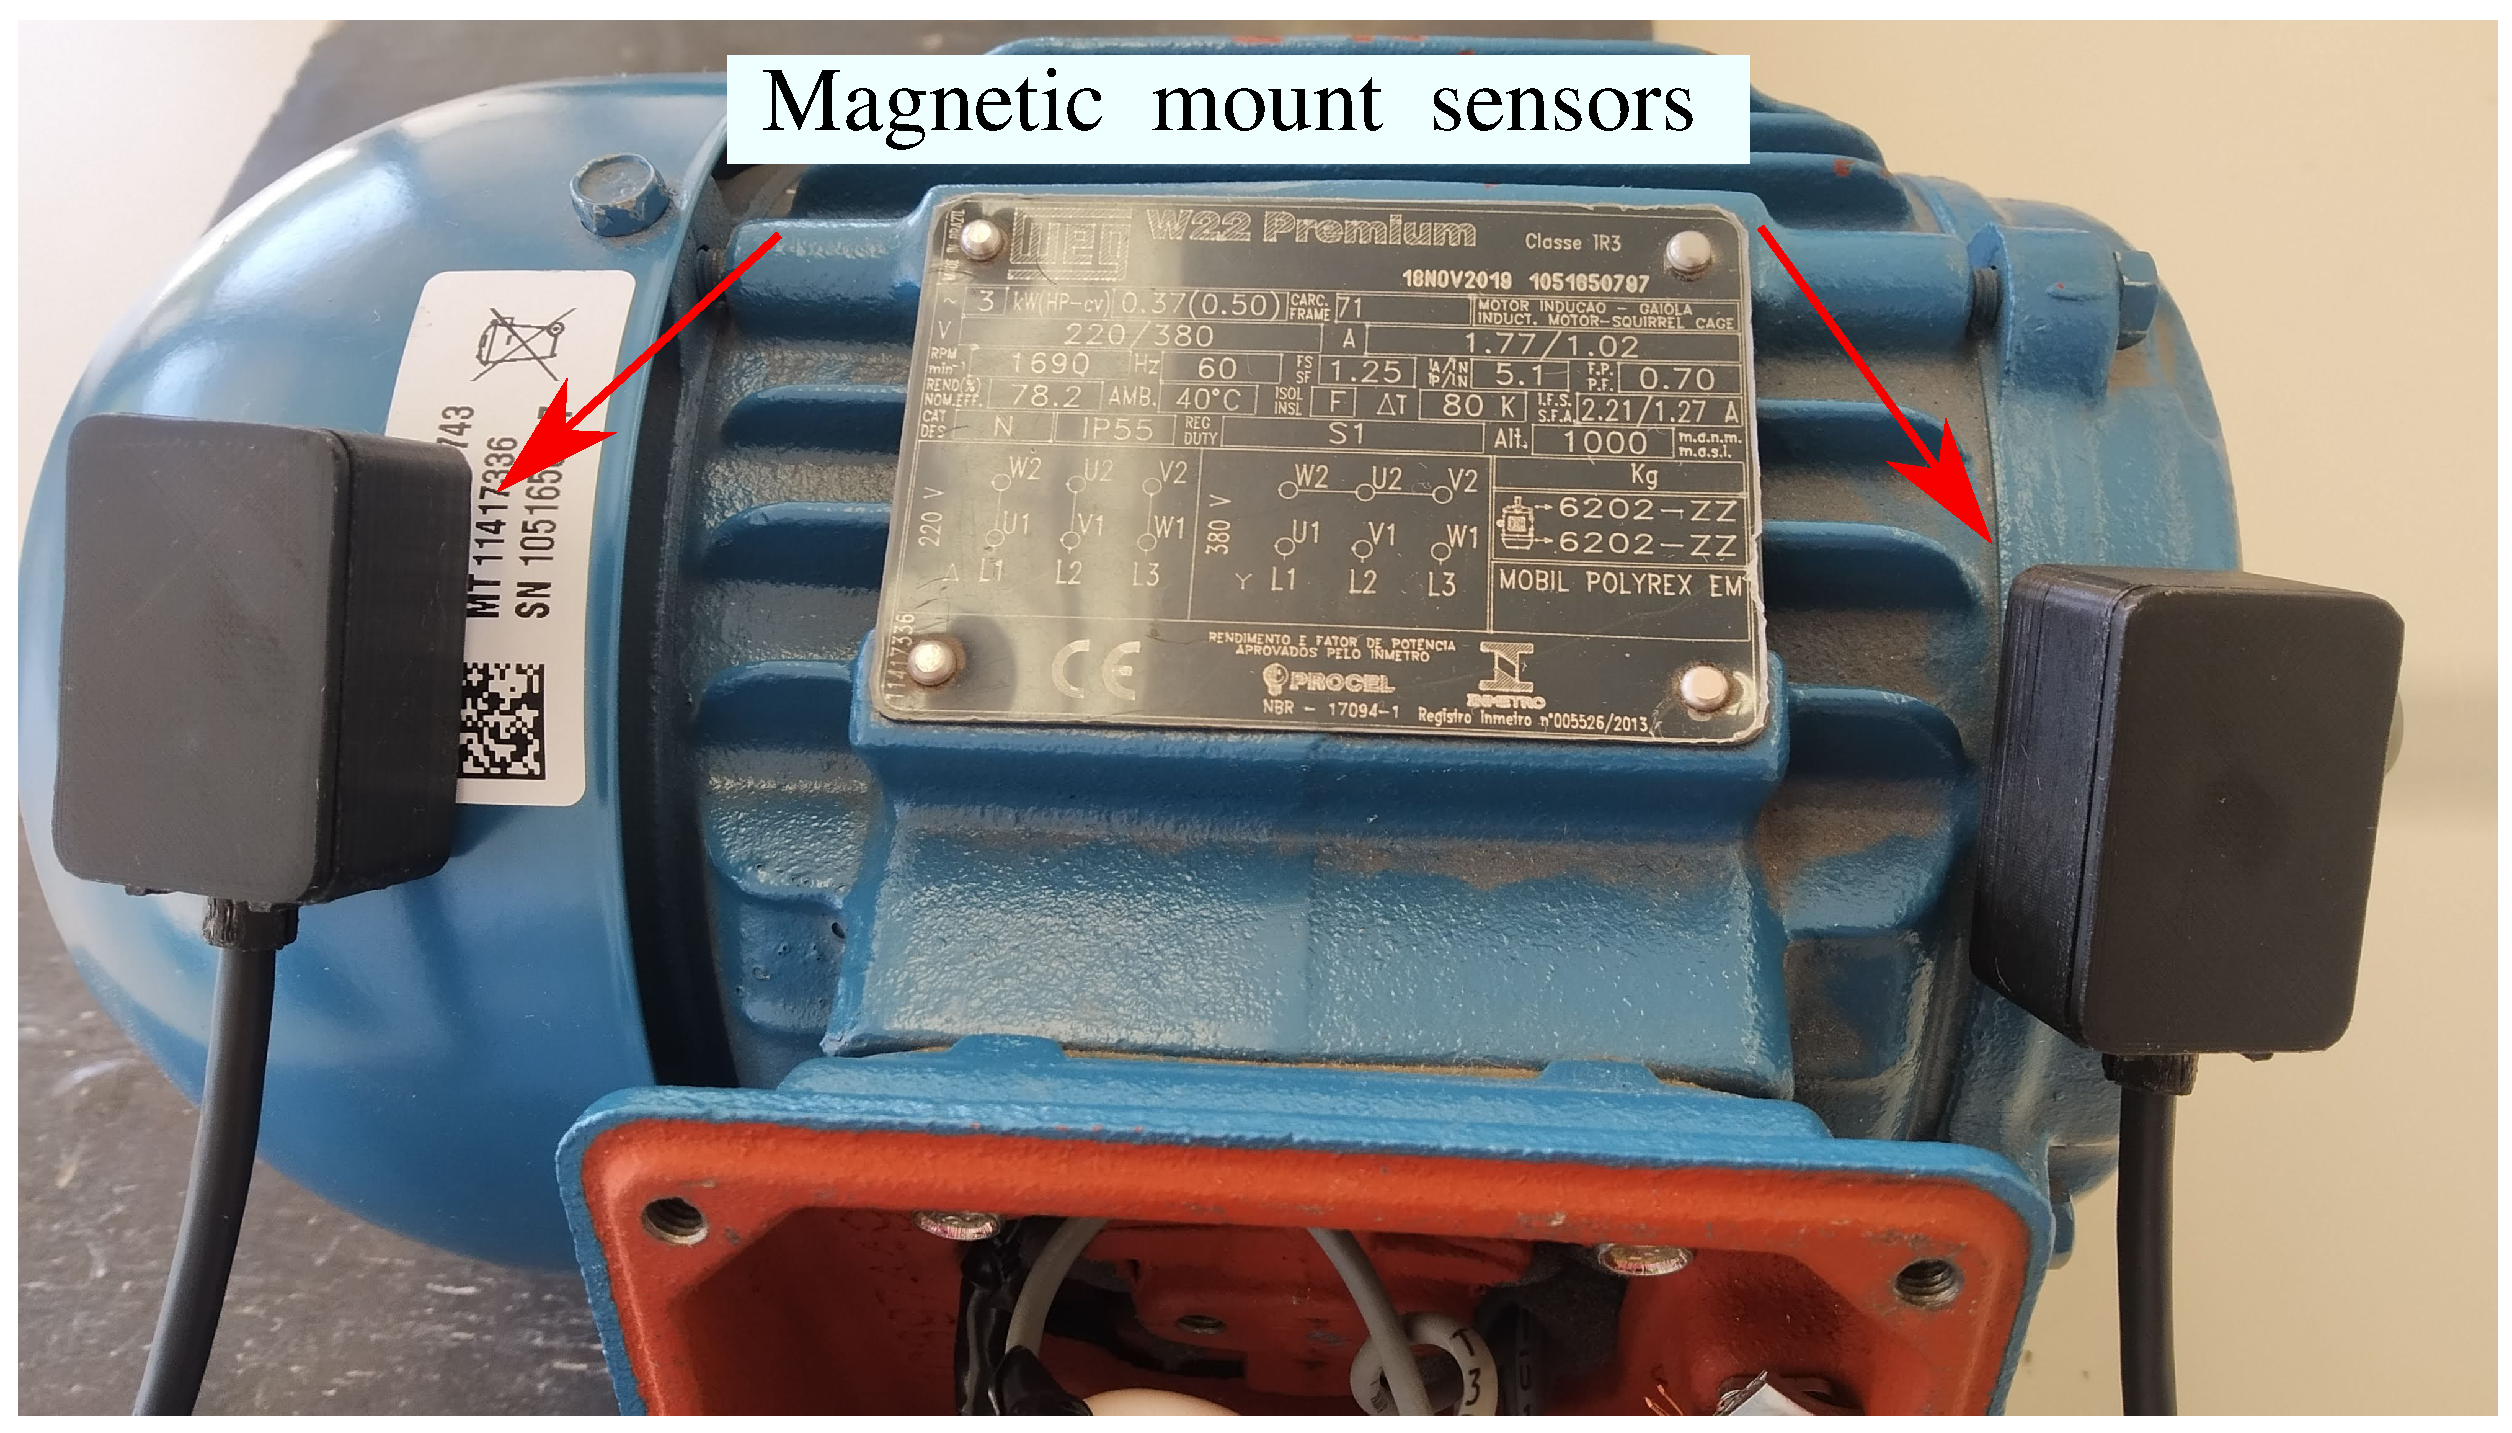
2.4. Sensor Mounting

Effective acquisition of vibration data is highly dependent on the proper technique of sensor mounting on the machine. In continuous or online machine condition monitoring, vibration sensors are usually mounted at a specific location on the machine [30]. The mounting methods depend largely on the sensor to be used. However, there are four main methods that can be used for both velocity and acceleration sensors: stud bolt mount, adhesive mount, magnetic mount, and unmounted [24].
In stud mounting, the sensor is screwed into a stud to attach it to the machine. This technique is extremely reliable and secure, making it ideal for permanently mounted applications. It also provides the best frequency response compared to other methods. It is important to ensure that the mounting surface is clean and free of paint to avoid irregularities that could cause incorrect readings or damage to the sensor [24].
If the machine cannot be drilled for stud mounting, adhesive mounting is a good alternative. This method involves applying epoxy, glue, or wax to the mounting surface. It is easy to apply, but the dampening effect of the adhesive reduces measurement accuracy. In addition, sensors mounted with adhesive are more difficult to remove compared to other mounting methods [24].
The magnetic mount is typically used for temporary vibration measurements with portable analyzers. It is not recommended for permanent monitoring because the sensor can be inadvertently moved and the multiple surfaces and materials of the magnet can interfere with the high-frequency vibrations [24]. This can be mitigated by using neodymium magnets, the strongest type of permanent magnets commercially available. The magnetic mount is the most flexible mounting method, as the sensor can be attached and removed countless times without damaging the device or machine. Figure 7 illustrates magnetic mounting in an electric motor.
Finally, the unmounted method uses a probe tip with no external mechanism. It is often used in hard-to-reach places. However, the length of the probe tip can affect measurement accuracy, with longer probes leading to greater inaccuracies [30]. It is also used in manual vibration measurements, where the probe tip is placed on the machine surface at the point of interest for a few seconds and then removed.
In addition to the four methods described, there are other techniques for mounting vibration sensors using clamps, brackets, and flexible cables. These methods provide additional flexibility for mounting sensors on rotating machinery, but may introduce harmonics into the measured signal.
Choosing the right method for mounting vibration sensors on rotating machinery is critical to obtaining accurate and reliable data. Each method has its advantages and limitations, and selection should be based on the application and the equipment to be used. Proper installation and placement of the sensors is also critical for accurate measurements.

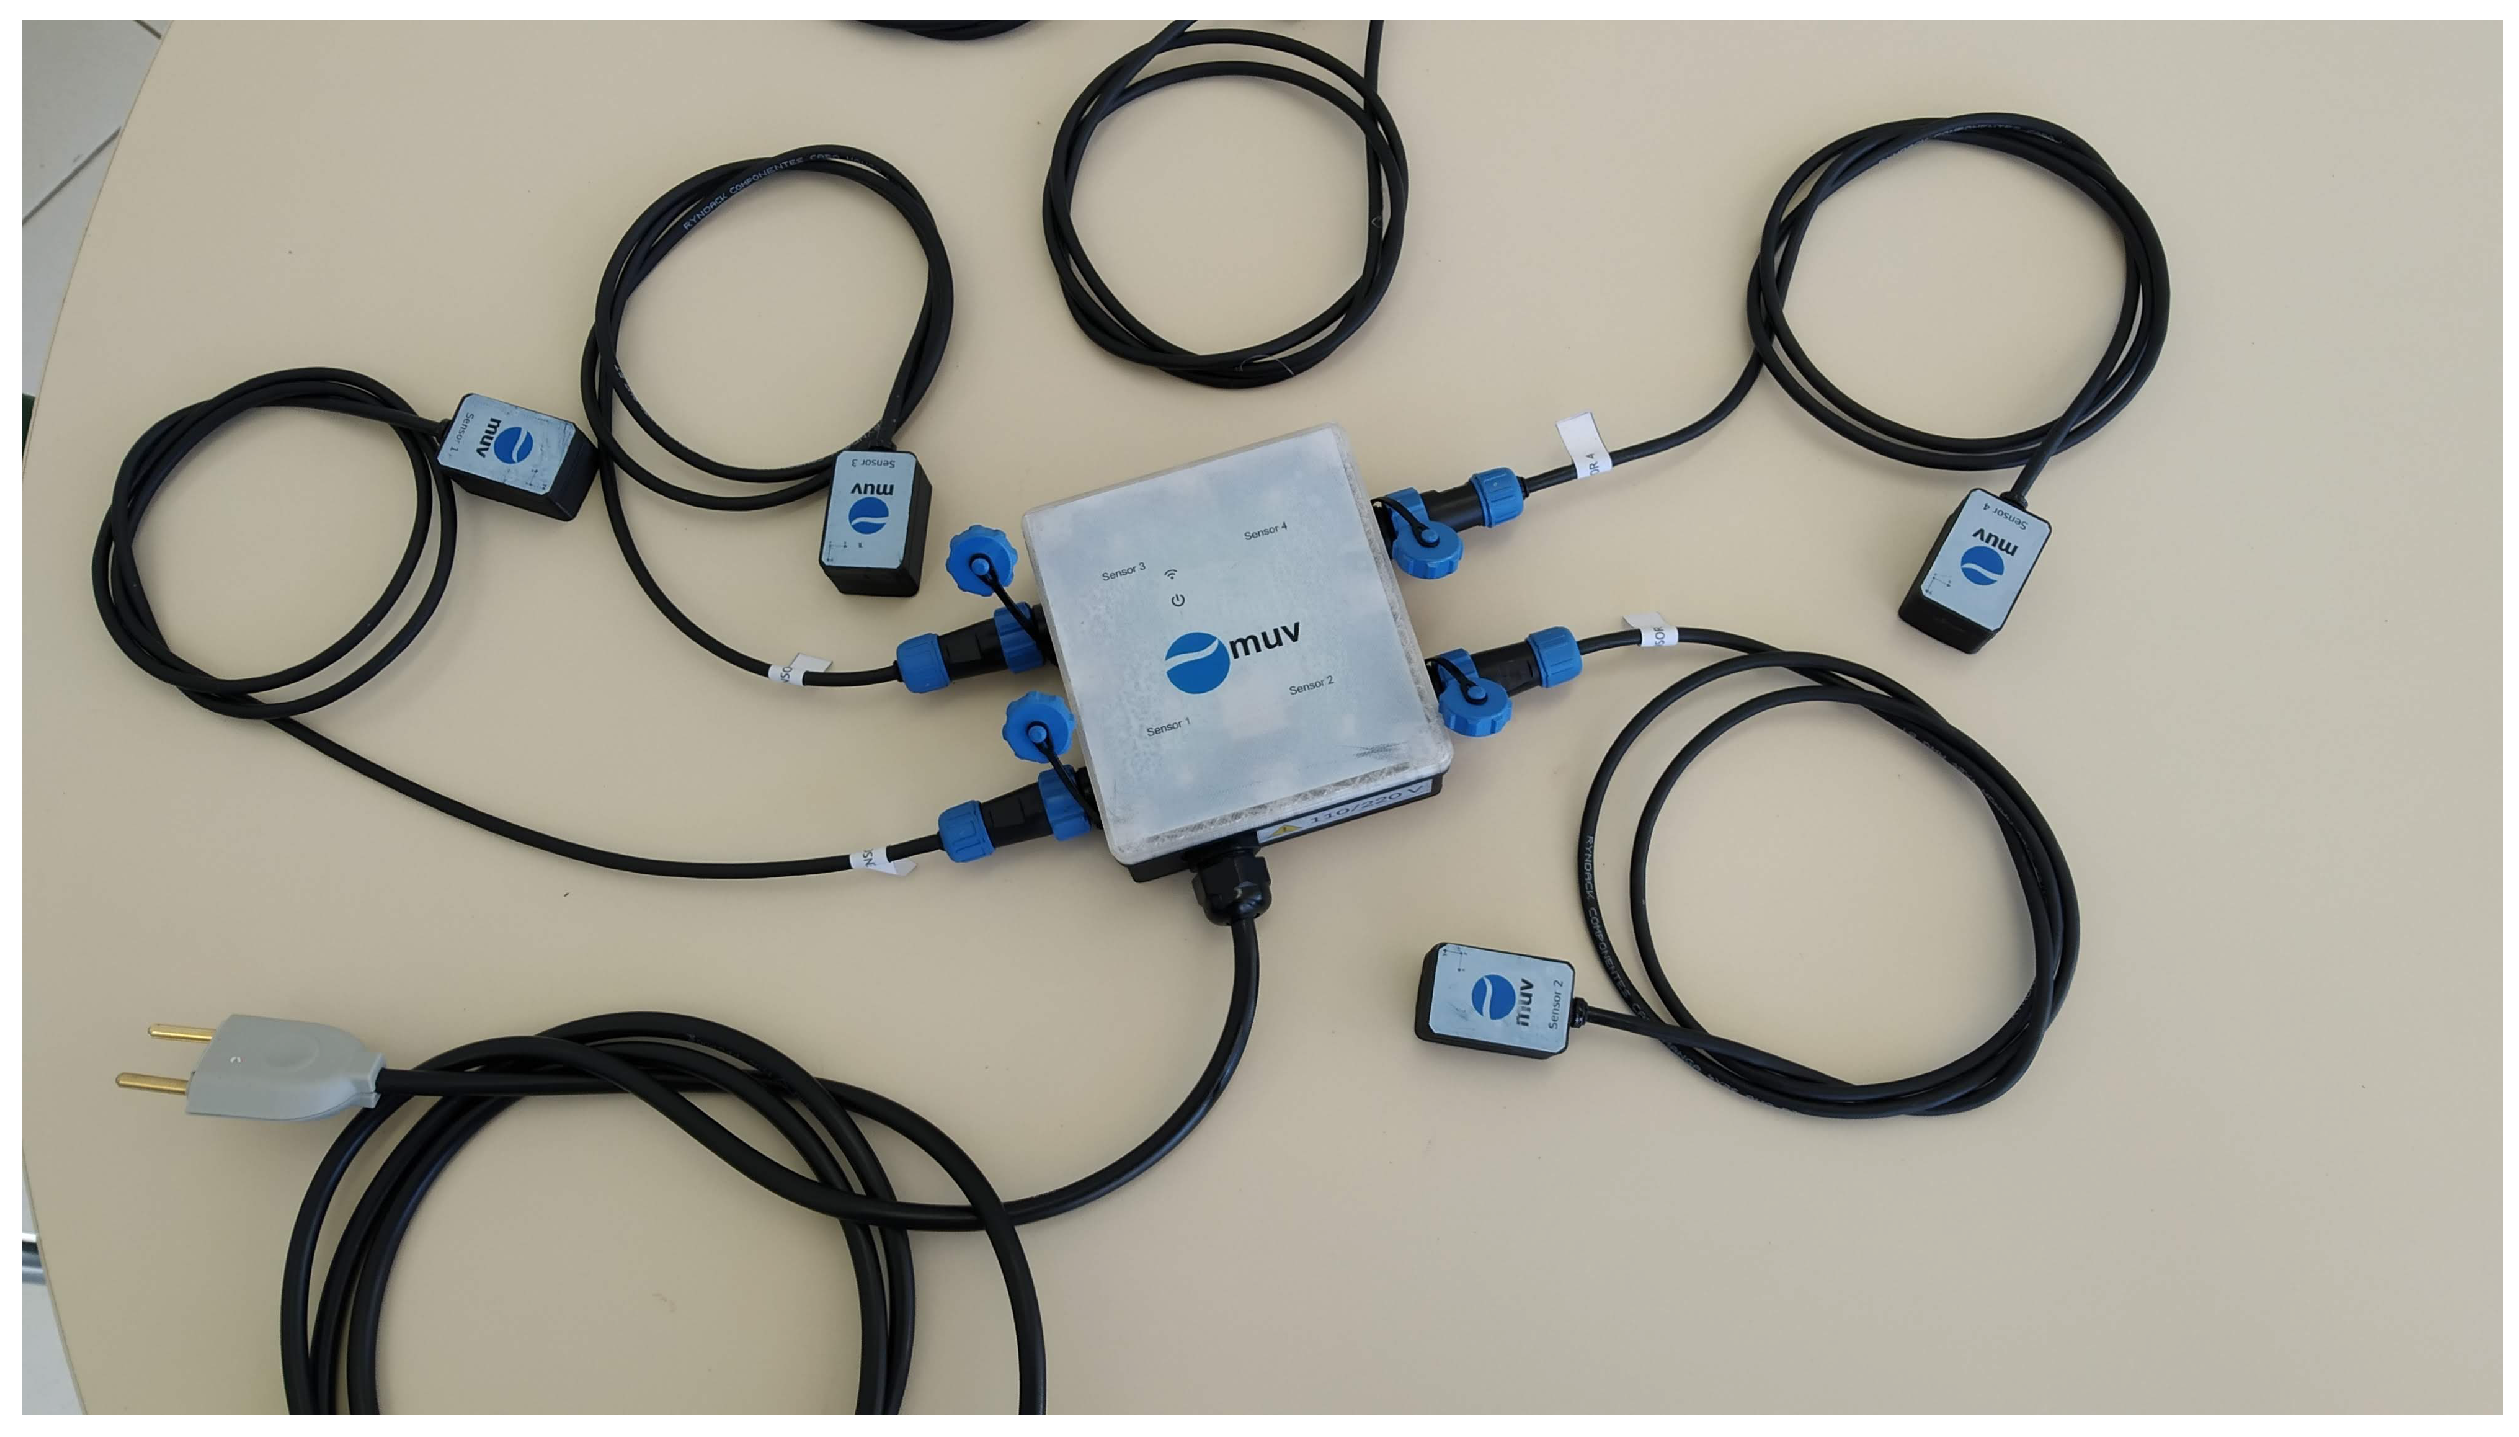
3. Data Transmission

Permanent or long-term measurement of vibration in rotating machinery requires a reliable means of storing and transmitting measurement data. There are several ways to establish communication between measuring devices to transmit vibration data. Communication can be direct from the device/sensor to the Internet, where the data are stored for later analysis, or communication can be from sensor to sensor to the end device, which must have access to the Internet. The fourth industry revolution (Industry 4.0) is based on automation and digitalization. This includes the introduction of the Internet of Things (IoT), machine-to-machine communication, improved data transmission and communication, and condition monitoring [36,37,38].
With the evolution of technology and the insertion of IoT in industries, various forms of communication and data transmission are available. Among them, the most widespread are: wired, Bluetooth, Wi-Fi, and LoRa/LoraWAN [36,39,40,41].
Wired data transmission is a stable and secure method for connecting sensors to the monitoring system [42,43,44]. The main advantage of data transmission via cables is the high data transfer rates that can be achieved. Additionally, cables can transmit data over long distances and provide a high level of security. Unlike wireless communication methods, wired communication is not susceptible to interference or hacking, making it a secure and reliable choice for transmitting confidential data. However, there are some disadvantages. This method involves high costs, complicated cable installation and maintenance, and is still not scalable [36,45]. In summary, wired connections provide a stable and reliable means of data transmission that is less susceptible to interference than wireless connections. However, wired connections are less practical in terms of mobility and may require additional hardware and setup.
Bluetooth is a widely used wireless communication technology for short-distance data transmission that can be used to transmit vibration data from rotating machinery [46]. It is a simple and easy-to-use technology with low power consumption and relatively low cost [47]. However, Bluetooth has some limitations, such as limited range and the potential for interference from other wireless technologies operating on the same frequency band [47,48]. To overcome these limitations, Bluetooth Mesh technology emerged. It is a mesh networking protocol that allows large-scale networks of Bluetooth devices to be built, providing greater coverage and flexibility. Bluetooth Mesh is more reliable than traditional Bluetooth, with built-in error correction and redundancy features. However, the use of multiple devices can create security vulnerabilities [49]. Despite these advantages and disadvantages, Bluetooth and Bluetooth Mesh remain popular choices for many applications that require wireless data transmission, such as vibration monitoring of rotating machinery. Using Bluetooth Mesh in large-scale networks can provide better coverage and flexibility, while traditional Bluetooth can be a more cost-effective solution for small-scale applications with limited range.
Wi-Fi is also widely used for wireless communication in IoT applications, including vibration monitoring of rotating machinery in industry [37,50]. Wi-Fi is a widely used wireless communication technology that can transmit data over longer distances than Bluetooth [51]. Wi-Fi Mesh offers the advantage of scalability, allowing large networks of Wi-Fi devices to be built to cover larger areas and support more devices because devices can communicate with each other and create multiple paths for data transmission [52]. Wi-Fi devices can be easily connected to other Wi-Fi-enabled devices such as computers and smartphones, making it easier to access and analyze vibration data [22]. However, there are also some limitations to using Wi-Fi and Wi-Fi Mesh for vibration monitoring, such as high power consumption, possible interference, and security concerns. The use of Wi-Fi and Wi-Fi Mesh may also require additional infrastructure and installation costs depending on the size and complexity of the network [37,51].
LoRa/LoraWAN technologies are wireless communication methods used to transmit vibration data from rotating machinery [53,54]. These technologies offer long ranges, low power consumption, and high network capacity [55]. LoRa technology, developed by Semtech Corporation, is a physical layer technology, while LoRaWAN is a network protocol built on top of LoRa [56]. They are suitable for monitoring machines in remote locations, offering a large network capacity and interoperability between different devices and networks [57]. However, their relatively low data rates make them suitable for low-to-moderate data rate applications, such as vibration monitoring. Overall, LoRa/LoraWAN technologies offer reliable and cost-effective methods for wireless transmission of vibration data, especially for monitoring rotating machinery in remote and hard-to-reach locations [58].
In summary, several methods are available for transmitting the vibration data acquired from rotating machinery, ranging from wired to wireless communication technologies. A summary of the characteristics of the main communication and data transmission methods can be found in Table 1. Wired communications provide stable and reliable data transmission with high security, but can be less convenient and more expensive. Bluetooth and Wi-Fi offer wireless communication options with varying range, scalability, and potential security concerns. LoRa/LoraWAN offers long range and high network capacity, but with lower data transfer rates. The choice of communication method depends on specific application requirements, such as the distance between sensors and the monitoring system, the amount of data to be transmitted, and the level of security required. Overall, the development of IoT and digitalization has greatly expanded the options for transmitting vibration data and offers more efficient and cost-effective solutions for monitoring rotating machinery in various industries.

4. Techniques for Signal Processing

Obtaining information through signal processing is one of the main elements for the analysis of vibration in machines. At the same time, signal processing can be considered demanding, since it aims at highlighting the features of the collected vibration signals, which are generally noisy and complex. Therefore, the data must be processed in such a way that the features of interest can be extracted.
There are several vibration signal processing methods that can be applied in monitoring rotating machinery to identify and diagnose defects or characteristic variations in the measured signal that indicate possible failures. These techniques can be divided into time domain analysis, frequency domain analysis, and time-frequency analysis. The choice of technique depends heavily on the signal to be analyzed and the characteristics of the signal to be evaluated to identify possible defects.

4.1. Time Domain Analysis

The technique of vibration analysis of rotating machinery in the time domain is the simplest analysis that can be performed. Many features such as the presence of amplitude modulation, shaft frequency components, shaft imbalance, transients, and higher frequency components can be identified visually by analyzing portions of the waveform in the function of time [62]. However, this is not sufficient to effectively detect changes in the vibration signal caused by potential faults. More sophisticated parameters and approaches should be used for time domain analysis, such as statistical parameter trends in the time domain [63]. Several statistical parameters can be defined, such as root-mean-square (RMS), peak, crest factor, and kurtosis [4]. These parameters are described hereafter.

4.1.1. Peak

The peak is the maximum value of signal x ( t ) in the measured time interval and is defined as [62,64]:
P e a k = max ( | x ( t ) | )

4.1.2. Root-Mean-Square (RMS)

Root-mean-square is related to the energy of the sampled signal, so it can contain useful information about signal construction [64,65]. This parameter is defined as:
R M S = 1 N i = 1 N ( x i ) 2
Here, N is the number of measured points and x i is the value of the ith sensor output signal.

4.1.3. Crest Factor (CRF)

Crest factor is the ratio of peak and RMS value of the signal, which shows the spikiness of the vibration signal. A CRF near 1 represents a lower spiky signal [64,65]. Crest factor is defined as:
C R F = P e a k R M S

4.1.4. Kurtosis (KUR)

Kurtosis is the measure of the tailedness of the probability density function of a time series. This number is related to the tails of the distribution. A high kurtosis value corresponds to a greater extremity of deviations (or outliers). The kurtosis is defined as the standardized fourth moment [64,65]:
KUR = μ ˜ 4 = μ 4 σ 4 ,
where μ 4 is the unstandardized central fourth moment and σ is the standard deviation.
A summary of the advantages and disadvantages of the time domain vibration analysis techniques can be seen in Table 2.

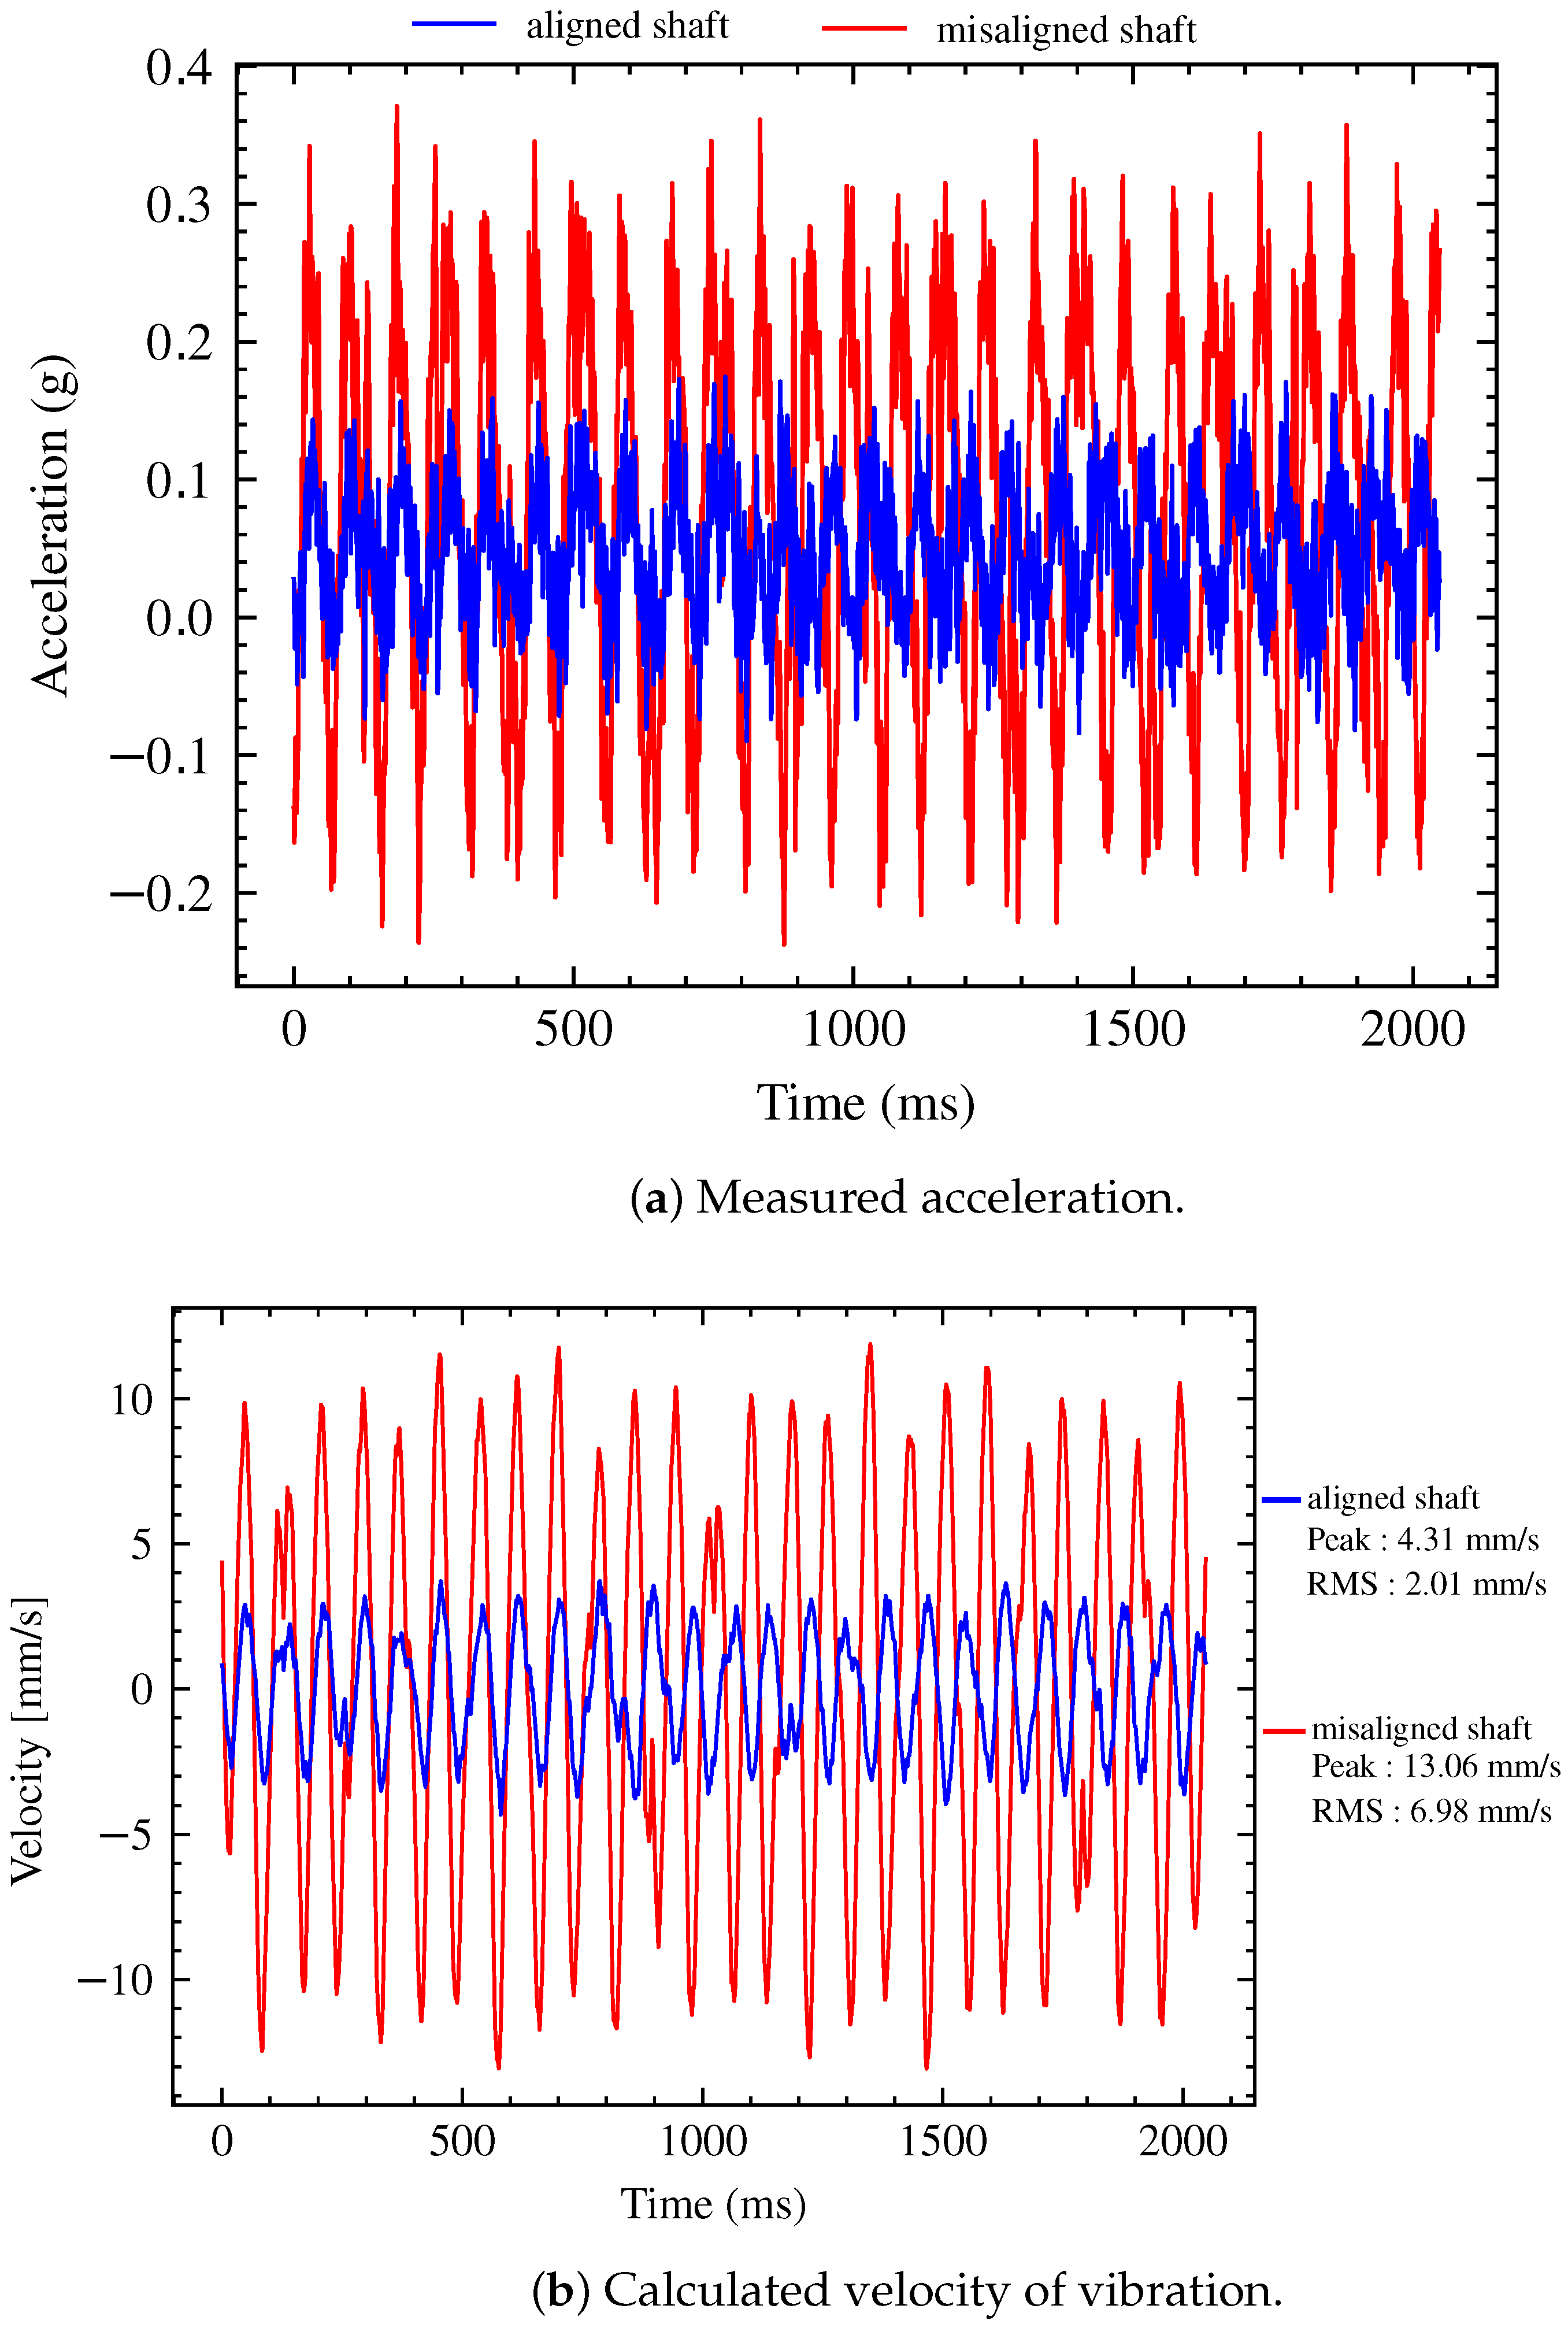
4.1.5. Application of Statistical Parameters for Vibration Analysis

The statistical parameters can be used individually or together with other parameters to analyze vibration signals to detect failures in machines. A failed machine presents an increase in the vibration peak value, and the type and severity of the failure can be evaluated based on the characteristics of the corresponding peak. The severity of failures can be evaluated by comparing features in a different derivation order. For example, a vibration signal from a machine with a bearing failure may have a peak value seven times higher than the peak value for the vibration signal collected from the same machine without a failure [66]. Peak is a simple method, but it is very susceptible to noise.
The RMS value is very useful for detecting unbalance in rotating machinery. In the time domain, the RMS value is the easiest way to identify faults in a rotating machine [67]. RMS values of a vibration signal are not affected by isolated peaks in the signal, which reduces sensitivity to incipient gear failures. This method is also not significantly affected by short bursts or low intensity vibration [30]. Therefore, the RMS method is not able to detect failures when the problem is in its early stages.
Crest factor is commonly used in rotating machinery to detect tooth breakage or failure of bearing outer rings. These faults generate pulse-like vibration signals so that the crest factor increases, which helps in detecting gear or bearing faults [67]. The introduction of a defect on any contact surface generates pulses, changing the distribution of the vibration signal and increasing the kurtosis value [68,69]. The kurtosis method does not interfere with velocity or load changes, but its effectiveness depends on the presence of significant impulsivity in the signal [70].
Figure 8 shows an example of time domain analysis applied to vibration data. The scenario is an electric motor whose vibration was measured under two different conditions: with the shaft aligned (healthy machine) and with the shaft misaligned (fault-prone machine). In the first graph (Figure 8a), the blue line represents the data collected for the machine in a healthy condition (aligned shaft), and the red line represents the data collected for the same machine but with the shaft in a misaligned state. Both lines were numerically integrated to determine the vibration velocity, as shown in Figure 8b. From this figure, the RMS and peak velocity can be calculated. The increase in RMS velocity in the misaligned shaft is clearly seen, going from 2.01 mm/s to 6.98 mm/s. The same is true for the peak velocity, which increased from 4.31 mm/s to 13.06 mm/s. These two parameters are sufficient to determine that the machine with misaligned shaft needs maintenance.

4.2. Frequency Domain Analysis

The characteristics of a signal in the frequency domain are often used for fault detection in rotating machinery through vibration analysis. Frequency domain analysis is a powerful tool for analyzing vibration signals in rotating machinery to diagnose faults. This method helps in identifying the frequency components present in a signal and their amplitudes [67]. Many signal features that are not visible with time domain analysis can be observed with frequency domain analysis. However, frequency analysis is not suitable for signals whose frequency varies with time [30]. The main frequency domain methods for detecting faults in rotating machinery are described below.

4.2.1. Fast Fourier Transform (FFT)

The Fast Fourier Transform is a computer algorithm that computes the discrete Fourier transform (DFT) much faster than other algorithms [28,71]. Through the FFT, it is possible to convert a signal from the time domain to the frequency domain. Using this signal represented in the frequency domain, the intensity of the different frequency components (the power spectrum) of a signal can be checked in the time domain. Vibration analysis in rotating machinery benefits from this technique because each component of the machine contributes a specific frequency component to the vibration signal. Therefore, one of the ways to detect faults is to compare the frequency components and their amplitudes to a signal from the same machine operating under perfect conditions. FFTs are used in predictive maintenance to detect various types of faults in rotating machinery, such as misalignment, imbalance, and bearing faults [72,73,74,75,76,77].

4.2.2. Cepstrum Analysis

Cepstrum analysis is the inverse Fourier transform of the logarithmic spectrum of the signal and is defined as [78]:
C ( x ( t ) ) = F 1 ( l o g ( X ( ω ) ) )
Here, F is the inverse of the Fourier Transform, x ( t ) is the signal in the time domain, and X ( ω ) is the signal in the frequency domain. Cepstrum analysis involves analyzing the logarithm of the power spectrum to detect any periodic structure in the spectrum, such as harmonics, side bands, or echoes [28]. It is useful in detecting faults such as bearing and localized tooth faults that produce low harmonically-related frequencies. There are four types of cepstrum, with power cepstrum being the most commonly used in machine diagnostics and monitoring. Cepstrum analysis has been used in gearbox diagnosis and monitoring, detection of friction in sliding bearings, and diagnosis of faults in a universal lathe machine [79,80,81,82,83]. The Cepstrum analysis can be sensitive to noise present in the vibration signals. This can lead to inaccurate or distorted results, especially at lower frequencies.

4.2.3. Envelope Analysis

Envelope analysis is a technique used to separate low-frequency signals from background noise in rolling element bearings and in low-speed machine diagnostics [84]. The technique involves bandpass filtering and demodulation to extract the signal envelope, which can contain diagnostic information. Envelope analysis has the advantage of early detection of bearing problems, but determining the best frequency band for this technique is a challenge [28]. The introduction of quadratic envelope analysis solved the problem of noise components in the signal. Envelope analysis has been applied in several studies to detect faults in bearings and induction motors [85,86,87,88], but it has shown poor performance compared to other techniques, such as acoustic emission analysis [28].

4.2.4. Power Spectral Density (PSD)

Power spectral density (PSD) represents the power of a signal at different frequencies. The PSD is calculated by taking the Fourier Transform of a signal and squaring the magnitude spectrum [24]. The PSD is a powerful tool for analyzing the strength of signal fluctuations as a function of frequency. It allows the detection and measurement of oscillatory signals in time series data and indicates the frequencies at which the oscillations are strong or weak. The PSD is a graphical representation of the energy distribution of the signal over different frequencies and is commonly used for fault diagnosis in induction machines [28]. Vibration analysis using PSD offers several advantages, such as a clear frequency domain of the signal, which allows the identification of specific frequency components associated with faults or anomalies in rotating machinery. Furthermore, it enables quantitative comparisons between different signals or different operating conditions, facilitating trend analysis and condition monitoring [28,89]. However, it is important to consider some limitations of PSD analysis. Often the assumption of stationarity is made, which means that the statistical properties of the signal are assumed to be constant over time [90].
All presented vibration analysis methods in the frequency domain have advantages and disadvantages, which are summarized in Table 3.

4.3. Time–Frequency Domain Analysis

In the real world, most signals are not stationary, i.e., the spectrum may change with time. In the case of vibration in machines, it can vary during operation. The vibration signal may contain different frequency components at different instants of time [28]. This variation is a problem for frequency domain analysis [30]. To overcome this challenge, time–frequency domain analysis techniques have been developed that can provide information about the time-varying frequency content of vibration signals. Time–frequency analysis allows not only the representation of the signal in three dimensions (time–frequency amplitude), but also the detection and tracking of the evolution of defects that produce weak vibration performance [78]. Conventional vibration analysis methods rely on stationary assumptions that are unsuitable for analyzing nonstationary signals. Therefore, time–frequency domain analysis methods such as the short-time Fourier transform (STFT), wavelet transform (WT), Hilbert–Huang transform (HHT), Wigner–Ville distribution (WVD), and power spectral density (PSD) are used to identify local features in the time and frequency domains [30]. These techniques are discussed in more detail below and the summary of the advantages and disadvantages can be seen in Table 4.

4.3.1. Short-Time Fourier Transform (STFT)

This technique was developed to overcome the problems of FFT. It is basically an addition to the FFT’s ability to analyze nonstationary or noisy signals. The STFT consists of a method that divides the nonstationary vibration signal into many small segments that can be assumed to be locally stationary, and applies the conventional FFT to these segments [78]. The STFT is defined as:
S t ( ω ) = 1 2 π e j ω τ S ( τ ) h ( τ t ) d τ
Here, a signal S t ( τ ) is obtained by multiplying the signal by a window function h ( τ ) centered on ( τ ) to produce a modified signal that emphasizes the signal around time τ . With that, the Fourier Transform reflects the frequency distribution at that time [30,78]. The main drawback of the STFT is the tradeoff between time and frequency. The resolution is determined by the size of the window. A large window gives good resolution in the frequency domain and poor resolution in the time domain and vice versa [78]. Despite this drawback, the STFT method is more efficient than conventional analysis methods in the time and frequency domains and is widely used in the analysis of vibration signals to monitor machine conditions [91,92,93,94,95].

4.3.2. Wavelet Transform (WT)

The Wavelet Transform is a linear transformation in which a time signal is decomposed into wavelets, i.e., local functions of time endowed with a predetermined frequency content [30]. Wavelet transforms are a powerful technique for analyzing vibration signals in rotating machinery [96,97]. By decomposing a nonstationary signal into its individual frequency components, WT can reveal time-varying features and identify transient events that may be missed by conventional Fourier transform-based methods. The wavelet scalogram provides a time–frequency representation that aids in visualization and analysis of the signal [78,98]. The advantages of using WT for vibration analysis in rotating machinery include the ability to detect local changes in vibration signals and improved time resolution. However, there are limitations to its use, including careful selection of the wavelet function and the possibility of cross terms in the wavelet scalogram [30,78]. Despite these limitations, WT is a valuable tool that is becoming increasingly popular in industry and academia for the analysis of transient vibration signals [99].

4.3.3. Wigner–Ville Distribution (WVD)

The Wigner–Vielle distribution is based on the cross-correlation function between the signal and a time-lagged version of itself [100]. It decomposes the signal into a series of elementary waveforms, each of which has its own time and frequency characteristics. Thus, the time–frequency representation is independent of the windowing function, allowing simultaneous analysis of the signal in the time and frequency domains [78]. The advantages of WVD for vibration analysis include its high time–frequency resolution and the ability to detect and locate transient events with high accuracy [30,101]. However, WVD has some limitations, such as the presence of interference terms, which can make interpretation of the results difficult [102]. Despite its limitations, WVD is a valuable tool for analyzing nonstationary signals in rotating machinery, especially for detecting and diagnosing faults in bearings, broken rods in induction, and gears [103,104].

4.3.4. Hilbert—Huang Transform (HHT)

The Hilbert–Huang Transform is a method for analyzing stationary, non-stationary, and transient signals. It combines empirical mode decomposition (EMD) and the Hilbert transform to obtain a Hilbert spectrum that can be used for fault diagnosis in machines [30]. The HHT consists of two main steps. First, the EMD method decomposes the signal into a series of intrinsic mode functions (IMFs), which are essentially vibration components with well-defined instantaneous frequencies. Each IMF represents a specific frequency component of the signal, which allows for a more detailed analysis of the time-varying features. After obtaining the IMFs, the Hilbert transform is applied to each IMF to calculate the instantaneous frequency as a function of time. In this way, a time-varying frequency representation of the signal is obtained, which allows the detection of transient events and the analysis of frequency fluctuations [105,106].
The advantages of HHT for vibration analysis in rotating machinery include its adaptability to nonstationary and nonlinear signals, its high time-frequency resolution, its ability to capture transient phenomena, and its low computation time. It is particularly effective in identifying and analyzing fault signatures associated with bearings, gears, and other rotating components. However, the HHT has certain limitations, such as sensitivity to noise, generation of undesirable IMFs in the low-frequency range, and difficulty in separating low-frequency components [28,30].
In summary, HHT is a valuable technique for vibration analysis in rotating machinery, providing a detailed time–frequency representation of non-stationary signals and enabling the detection and diagnosis of faults and transient events. Its application in conjunction with other analysis methods can improve the understanding of vibration behavior and contribute to effective condition monitoring and maintenance strategies [107,108,109].

5. Conclusions

This paper provides a comprehensive review of vibration monitoring techniques for predictive maintenance of rotating machinery. We explore the main types of transducers used to acquire vibration signals, as well as the options for transmitting and analyzing data. We describe the key features and the advantages and disadvantages of each transducer. Each component, whether in acquisition, transmission, or analysis, is very important for accurate evaluation and thus for identifying potential faults in rotating machines before they become serious problems.
In summary, the field of vibration monitoring for predictive maintenance of rotating machinery is constantly evolving due to technological advances and the need for increased reliability. As highlighted in this review, the selection of the appropriate vibration monitoring technique is critical for effective machine condition assessment. Future research should focus on further refining these techniques and exploring innovative approaches, such as integrating the Internet of Things (IoT) and cloud-based platforms to enable real-time monitoring and analysis, as well as applying artificial intelligence and machine learning techniques to automatically diagnose faults.

Funding

This study was financed by the Brazilian research agency Fundação de Amparo à Pesquisa do Estado do Rio Grande do Sul (FAPERGS)—Grant 22/2551-0000841-0.

Data Availability Statement

Not applicable.

Conflicts of Interest

The authors declare no conflict of interest.

Abbreviations

The following abbreviations are used in this manuscript:
AIArtificial Intelligence
CRFCrest Factor
DFTDiscrete Fourier Transform
EMDEmpirical Mode Decomposition
FFTFast Fourier Transform
IoTInternet of Things
HHTHilbert–Huang transform
IMFIntrinsic Mode Function
KURKurtosis
MEMSMicro-Electro Mechanical System
MLMachine Learning
PdMPredictive Maintenance
PSDPower Spectral Density
RMSRoot-Mean-Square
STFTShort-Time Fourier Transform
WTWavelet Transform
WVDWigner–Ville distribution

References

  1. Lee, S.B.; Stone, G.C.; Antonino-Daviu, J.; Gyftakis, K.N.; Strangas, E.G.; Maussion, P.; Platero, C.A. Condition monitoring of industrial electric machines: State of the art and future challenges. IEEE Ind. Electron. Mag. 2020, 14, 158–167. [Google Scholar] [CrossRef]
  2. Madhukar, G.; Boosi, S.; Adhoni, Z.A.; Bhaskar, K.A.; Naik, A.V. A Machine Learning Based Methodology for Fault Diagnosis in Rotating Machine. In Proceedings of the 2023 IEEE International Conference on Integrated Circuits and Communication Systems (ICICACS), Raichur, India, 24–25 February 2023; pp. 1–5. [Google Scholar] [CrossRef]
  3. Shukla, K.; Nefti-Meziani, S.; Davis, S. A heuristic approach on predictive maintenance techniques: Limitations and scope. Adv. Mech. Eng. 2022, 14, 16878132221101009. [Google Scholar] [CrossRef]
  4. Kumar, A.; Sathujoda, P.; Bhalla, N.A. Vibration signal analysis of a rotor-bearing system through wavelet transform and empirical mode decomposition. IOP Conf. Ser. Mater. Sci. Eng. 2022, 1248, 012027. [Google Scholar] [CrossRef]
  5. Efeoğlu, E.; Tuna, G. Machine Learning for Predictive Maintenance: Support Vector Machines and Different Kernel Functions. J. Mach. Manuf. Reliab. 2022, 51, 447–456. [Google Scholar] [CrossRef]
  6. Villarroel, A.; Zurita, G.; Velarde, R. Development of a Low-Cost Vibration Measurement System for Industrial Applications. Machines 2019, 7, 12. [Google Scholar]
  7. Umbrajkaar, A.; Krishnamoorthy, A.; Dhumale, R. Vibration analysis of shaft misalignment using machine learning approach under variable load conditions. Shock Vib. 2020, 2020, 1650270. [Google Scholar] [CrossRef]
  8. Nascimento, E.G.S.; Liang, J.S.; Figueiredo, I.S.; Guarieiro, L.L.N. T4PdM: A Deep Neural Network based on the Transformer Architecture for Fault Diagnosis of Rotating Machinery. arXiv 2022, arXiv:2204.03725. [Google Scholar]
  9. Althubaiti, A.; Elasha, F.; Teixeira, J.A. Fault diagnosis and health management of bearings in rotating equipment based on vibration analysis—A review. J. Vibroeng. 2022, 24, 46–74. [Google Scholar] [CrossRef]
  10. Tiboni, M.; Remino, C.; Bussola, R.; Amici, C. A review on vibration-based condition monitoring of rotating machinery. Appl. Sci. 2022, 12, 972. [Google Scholar]
  11. Ranjan, R.; Ghosh, S.K.; Kumar, M. Fault diagnosis of journal bearing in a hydropower plant using wear debris, vibration and temperature analysis: A case study. Proc. Inst. Mech. Eng. Part E J. Process Mech. Eng. 2020, 234, 235–242. [Google Scholar] [CrossRef]
  12. Li, Q.; Zhang, W.; Liu, J.; Chen, M. Fault diagnosis of wind turbine gearbox based on improved ELM algorithm and multimodal sensor fusion. Measurement 2021, 180, 109598. [Google Scholar]
  13. Cheng, Y.; Lin, M.; Wu, J.; Zhu, H.; Shao, X. Intelligent fault diagnosis of rotating machinery based on continuous wavelet transform-local binary convolutional neural network. Knowl.-Based Syst. 2021, 216, 106796. [Google Scholar] [CrossRef]
  14. Popescu, T.D.; Aiordachioaie, D.; Culea-Florescu, A. Basic tools for vibration analysis with applications to predictive maintenance of rotating machines: An overview. Int. J. Adv. Manuf. Technol. 2021, 118, 2883–2899. [Google Scholar] [CrossRef]
  15. Muv Tecnologia. Available online: http://www.muvtecnologia.com.br (accessed on 15 May 2023).
  16. Pedotti, L.A.S.; Zago, R.M.; Fruett, F. Instrument based on MEMS accelerometer for vibration and unbalance analysis in rotating machines. In Proceedings of the 2016 1st International Symposium on Instrumentation Systems, Circuits and Transducers (INSCIT), Belo Horizonte, Brazil, 29 August–3 September 2016; IEEE: Piscataway, NJ, USA, 2016; pp. 25–30. [Google Scholar]
  17. Amezquita-Sanchez, J.P.; Adeli, H. Signal processing techniques for vibration-based health monitoring of smart structures. Arch. Comput. Methods Eng. 2016, 23, 1–15. [Google Scholar]
  18. John Lu, Z.Q. The elements of statistical learning: Data mining, inference, and prediction. J. R. Stat. Soc. Ser. Stat. Soc. 2010, 173, 693–694. [Google Scholar] [CrossRef]
  19. Zhao, Z.; Wu, J.; Li, T.; Sun, C.; Yan, R.; Chen, X. Challenges and opportunities of AI-enabled monitoring, diagnosis & prognosis: A review. Chin. J. Mech. Eng. 2021, 34, 1–29. [Google Scholar]
  20. Shaheryar, A.; Yin, X.C.; Yousuf, W. robust feature extraction on vibration data under deep-learning framework: An application for fault identification in rotary machines. Int. J. Comput. Appl. 2017, 167, 37–45. [Google Scholar] [CrossRef]
  21. Li, X.; Xu, Y.; Li, N.; Yang, B.; Lei, Y. Remaining Useful Life Prediction with Partial Sensor Malfunctions Using Deep Adversarial Networks. IEEE/CAA J. Autom. Sin. 2023, 10, 121–134. [Google Scholar] [CrossRef]
  22. Zhang, F.; Sun, W.; Wang, H.; Xu, T. Fault diagnosis of a wind turbine gearbox based on improved variational mode algorithm and information entropy. Entropy 2021, 23, 794. [Google Scholar] [CrossRef] [PubMed]
  23. Zhang, W.; Li, X. Data privacy preserving federated transfer learning in machinery fault diagnostics using prior distributions. Struct. Health Monit. 2022, 21, 1329–1344. [Google Scholar] [CrossRef]
  24. Scheffer, C.; Girdhar, P. Practical Machinery Vibration Analysis and Predictive Maintenance; Elsevier: Amsterdam, The Netherlands, 2004. [Google Scholar]
  25. Li, X.; Yu, S.; Lei, Y.; Li, N.; Yang, B. Intelligent Machinery Fault Diagnosis with Event-Based Camera. IEEE Trans. Ind. Inform. 2023, 1–10. [Google Scholar] [CrossRef]
  26. Correa, J.C.A.J.; Guzman, A.A.L. Mechanical Vibrations and Condition Monitoring; Academic Press: Cambridge, MA, USA, 2020. [Google Scholar]
  27. Pedotti, L.A.D.S.; Zago, R.M.; Fruett, F. Fault diagnostics in rotary machines through spectral vibration analysis using low-cost MEMS devices. IEEE Instrum. Meas. Mag. 2017, 20, 39–44. [Google Scholar] [CrossRef]
  28. Goyal, D.; Pabla, B. The vibration monitoring methods and signal processing techniques for structural health monitoring: A review. Arch. Comput. Methods Eng. 2016, 23, 585–594. [Google Scholar] [CrossRef]
  29. Dowell, M.; Sylvester, G. Turbomachinery prognostics and health management via eddy current sensing: Current developments. In Proceedings of the 1999 IEEE Aerospace Conference, (Cat. No. 99TH8403), Snowmass, CO, USA, 7 March 1999; Volume 3, pp. 1–9. [Google Scholar] [CrossRef]
  30. Mohd Ghazali, M.H.; Rahiman, W. Vibration analysis for machine monitoring and diagnosis: A systematic review. Shock Vib. 2021, 2021, 9469318. [Google Scholar] [CrossRef]
  31. Dzhudzhev, B.; Ivancheva, V.; Kachulkova, S.; Gospodinova, E. Vibration measurement with piezoelectric transducer. In Proceedings of the XLVIII International Scientific Conference on Information, Communication and Energy Systems and Technologies ICEST 2013, Ohrid, North Macedonia, 26–29 June 2013. [Google Scholar]
  32. Guru Manikandan, K.; Pannirselvam, K.; Kenned, J.J.; Suresh Kumar, C. Investigations on suitability of MEMS based accelerometer for vibration measurements. Mater. Today Proc. 2021, 45, 6183–6192. [Google Scholar] [CrossRef]
  33. Varanis, M.; Silva, A.; Mereles, A.; Pederiva, R. MEMS accelerometers for mechanical vibrations analysis: A comprehensive review with applications. J. Braz. Soc. Mech. Sci. Eng. 2018, 40, 527. [Google Scholar] [CrossRef]
  34. Rossi, A.; Bocchetta, G.; Botta, F.; Scorza, A. Accuracy Characterization of a MEMS Accelerometer for Vibration Monitoring in a Rotating Framework. Appl. Sci. 2023, 13, 5070. [Google Scholar] [CrossRef]
  35. Tez, S.; Akin, T. Fabrication of a sandwich type three axis capacitive MEMS accelerometer. In Proceedings of the SENSORS 2013 IEEE, Baltimore, MD, USA, 3–6 November 2013; IEEE: Piscataway, NJ, USA, 2013; pp. 1–4. [Google Scholar]
  36. Wu, D.; Liu, S.; Zhang, L.; Terpenny, J.; Gao, R.X.; Kurfess, T.; Guzzo, J.A. A fog computing-based framework for process monitoring and prognosis in cyber-manufacturing. J. Manuf. Syst. 2017, 43, 25–34. [Google Scholar] [CrossRef]
  37. Sicard, B.; Alsadi, N.; Spachos, P.; Ziada, Y.; Gadsden, S.A. Predictive Maintenance and Condition Monitoring in Machine Tools: An IoT Approach. In Proceedings of the 2022 IEEE International IOT, Electronics and Mechatronics Conference (IEMTRONICS), Toronto, ON, Canada, 1–4 June 2022; IEEE: Piscataway, NJ, USA, 2022; pp. 1–9. [Google Scholar]
  38. Swamy, S.N.; Kota, S.R. An Empirical Study on System Level Aspects of Internet of Things (IoT). IEEE Access 2020, 8, 188082–188134. [Google Scholar] [CrossRef]
  39. Rizzi, M.; Ferrari, P.; Flammini, A.; Sisinni, E.; Gidlund, M. Using LoRa for industrial wireless networks. In Proceedings of the 2017 IEEE 13th International Workshop on Factory Communication Systems (WFCS), Trondheim, Norway, 31 May–2 June 2017; IEEE: Piscataway, NJ, USA, 2017; pp. 1–4. [Google Scholar]
  40. Leonardi, L.; Battaglia, F.; Patti, G.; Bello, L.L. Industrial LoRa: A novel medium access strategy for LoRa in Industry 4.0 applications. In Proceedings of the IECON 2018—44th Annual Conference of the IEEE Industrial Electronics Society, Washington, DC, USA, 21–23 October 2018; IEEE: Piscataway, NJ, USA, 2018; pp. 4141–4146. [Google Scholar]
  41. Cheikh, I.; Aouami, R.; Sabir, E.; Sadik, M.; Roy, S. Multi-layered energy efficiency in LoRa-WAN networks: A tutorial. IEEE Access 2022, 10, 9198–9231. [Google Scholar] [CrossRef]
  42. Sinha, J.K. Vibration Analysis, Instruments, and Signal Processing; CRC Press: Boca Raton, FL, USA, 2014. [Google Scholar]
  43. Hou, L.; Bergmann, N.W. Novel Industrial Wireless Sensor Networks for Machine Condition Monitoring and Fault Diagnosis. IEEE Trans. Instrum. Meas. 2012, 61, 2787–2798. [Google Scholar] [CrossRef]
  44. Sofi, A.; Regita, J.J.; Rane, B.; Lau, H.H. Structural health monitoring using wireless smart sensor network—An overview. Mech. Syst. Signal Process. 2022, 163, 108113. [Google Scholar] [CrossRef]
  45. Bal, M. Industrial applications of collaborative wireless sensor networks: A survey. In Proceedings of the 2014 IEEE 23rd International Symposium on Industrial Electronics (ISIE), Istanbul, Turkey, 1–4 June 2014; IEEE: Piscataway, NJ, USA, 2014; pp. 1463–1468. [Google Scholar]
  46. Seferagić, A.; Famaey, J.; De Poorter, E.; Hoebeke, J. Survey on wireless technology trade-offs for the industrial internet of things. Sensors 2020, 20, 488. [Google Scholar] [CrossRef] [PubMed] [Green Version]
  47. Rondón, R.; Mahmood, A.; Grimaldi, S.; Gidlund, M. Understanding the performance of bluetooth mesh: Reliability, delay, and scalability analysis. IEEE Internet Things J. 2019, 7, 2089–2101. [Google Scholar] [CrossRef] [Green Version]
  48. Chang, K.H. Bluetooth: A viable solution for IoT? [Industry Perspectives]. IEEE Wirel. Commun. 2014, 21, 6–7. [Google Scholar] [CrossRef]
  49. Martínez, C.; Eras, L.; Domínguez, F. The Smart Doorbell: A proof-of-concept Implementation of a Bluetooth Mesh Network. In Proceedings of the 2018 IEEE Third Ecuador Technical Chapters Meeting (ETCM), Cuenca, Ecuador, 15–19 October 2018; pp. 1–5. [Google Scholar] [CrossRef]
  50. Jaber, A.A.; Bicker, R. Design of a Wireless Sensor Node for Vibration Monitoring of Industrial Machinery. Int. J. Electr. Comput. Eng. 2016, 6, 639–653. [Google Scholar]
  51. Fellan, A.; Schellenberger, C.; Zimmermann, M.; Schotten, H.D. Enabling communication technologies for automated unmanned vehicles in Industry 4.0. In Proceedings of the 2018 International Conference on Information and Communication Technology Convergence (ICTC), Jeju, Republic of Korea, 17–19 October 2018; IEEE: Piscataway, NJ, USA, 2018; pp. 171–176. [Google Scholar]
  52. Bruno, R.; Conti, M.; Gregori, E. Mesh networks: Commodity multihop ad hoc networks. IEEE Commun. Mag. 2005, 43, 123–131. [Google Scholar] [CrossRef]
  53. Ikpehai, A.; Adebisi, B.; Rabie, K.M.; Anoh, K.; Ande, R.E.; Hammoudeh, M.; Gacanin, H.; Mbanaso, U.M. Low-Power Wide Area Network Technologies for Internet-of-Things: A Comparative Review. IEEE Internet Things J. 2019, 6, 2225–2240. [Google Scholar] [CrossRef] [Green Version]
  54. Joshitha, C.; Kanakaraja, P.; Bhavani, M.D.; Raman, Y.N.V.; Sravani, T. Lorawan based cattle monitoring smart system. In Proceedings of the 2021 7th International Conference on Electrical Energy Systems (ICEES), Chennai, India, 11–13 February 2021; IEEE: Piscataway, NJ, USA, 2021; pp. 548–552. [Google Scholar]
  55. Zhou, W.; Tong, Z.; Dong, Z.Y.; Wang, Y. LoRa-Hybrid: A LoRaWAN Based multihop solution for regional microgrid. In Proceedings of the 2019 IEEE 4th International Conference on Computer and Communication Systems (ICCCS), Singapore, 23–25 February 2019; IEEE: Piscataway, NJ, USA, 2019; pp. 650–654. [Google Scholar]
  56. Wixted, A.J.; Kinnaird, P.; Larijani, H.; Tait, A.; Ahmadinia, A.; Strachan, N. Evaluation of LoRa and LoRaWAN for wireless sensor networks. In Proceedings of the 2016 IEEE SENSORS, Orlando, FL, USA, 30 October–3 November 2016; IEEE: Piscataway, NJ, USA, 2016; pp. 1–3. [Google Scholar]
  57. Mikhaylov, K.; Moiz, A.; Pouttu, A.; Rapún, J.M.M.; Gascon, S.A. LoRa WAN for wind turbine monitoring: Prototype and practical deployment. In Proceedings of the 2018 10th International Congress on Ultra Modern Telecommunications and Control Systems and Workshops (ICUMT), Moscow, Russia, 5–9 November 2018; IEEE: Piscataway, NJ, USA, 2018; pp. 1–6. [Google Scholar]
  58. Ertürk, M.A.; Aydın, M.A.; Büyükakkaşlar, M.T.; Evirgen, H. A survey on LoRaWAN architecture, protocol and technologies. Future Internet 2019, 11, 216. [Google Scholar] [CrossRef] [Green Version]
  59. Derevianckine, G.H.; Guitton, A.; Iova, O.; Ning, B.; Valois, F. Opportunities and Challenges of LoRa 2.4 GHz. IEEE Commun. Mag. 2023, 1–7. [Google Scholar] [CrossRef]
  60. Lyczkowski, E.; Wanjek, A.; Sauer, C.; Kiess, W. Wireless Communication in Industrial Applications. In Proceedings of the 2019 24th IEEE International Conference on Emerging Technologies and Factory Automation (ETFA), Zaragoza, Spain, 10–13 September 2019; pp. 1392–1395. [Google Scholar] [CrossRef]
  61. Lee, J.S.; Su, Y.W.; Shen, C.C. A Comparative Study of Wireless Protocols: Bluetooth, UWB, ZigBee, and Wi-Fi. In Proceedings of the IECON 2007—33rd Annual Conference of the IEEE Industrial Electronics Society, Taipei, Taiwan, 5–8 November 2007; pp. 46–51. [Google Scholar] [CrossRef] [Green Version]
  62. Howard, I. A Review of Rolling Element Bearing Vibration Detection, Diagnosis and Prognosis; Defence Science and Technology Organization: Canberra, Australia, 1994.
  63. Gangsar, P.; Tiwari, R. Multiclass fault taxonomy in rolling bearings at interpolated and extrapolated speeds based on time domain vibration data by SVM algorithms. J. Fail. Anal. Prev. 2014, 14, 826–837. [Google Scholar] [CrossRef]
  64. Jain, P.H.; Bhosle, S.P. Analysis of vibration signals caused by ball bearing defects using time-domain statistical indicators. Int. J. Adv. Technol. Eng. Explor. 2022, 9, 700. [Google Scholar]
  65. Yadav, O.P.; Pahuja, G. Bearing health assessment using time domain analysis of vibration signal. Int. J. Image Graph. Signal Process. 2020, 10, 27. [Google Scholar]
  66. Lahdelma, S.; Juuso, E. Signal processing in vibration analysis. In Proceedings of the 5th International Conference on Condition Monitoring and Machinery Failure Prevention Technologies, CM 2008 / MFPT 2008, Edinburgh, UK, 15–18 July 2008; pp. 879–889. [Google Scholar]
  67. Vishwakarma, M.; Purohit, R.; Harshlata, V.; Rajput, P. Vibration analysis & condition monitoring for rotating machines: A review. Mater. Today Proc. 2017, 4, 2659–2664. [Google Scholar]
  68. Williams, T.; Ribadeneira, X.; Billington, S.; Kurfess, T. Rolling element bearing diagnostics in run-to-failure lifetime testing. Mech. Syst. Signal Process. 2001, 15, 979–993. [Google Scholar]
  69. McFadden, P.; Toozhy, M. Application of synchronous averaging to vibration monitoring of rolling element bearings. Mech. Syst. Signal Process. 2000, 14, 891–906. [Google Scholar]
  70. Tian, J.; Morillo, C.; Azarian, M.H.; Pecht, M. Motor bearing fault detection using spectral kurtosis-based feature extraction coupled with K-nearest neighbor distance analysis. IEEE Trans. Ind. Electron. 2015, 63, 1793–1803. [Google Scholar] [CrossRef]
  71. Brigham, E.O.; Morrow, R.E. The fast Fourier transform. IEEE Spectr. 1967, 4, 63–70. [Google Scholar] [CrossRef]
  72. Patil, S.S.; Gaikwad, J.A. Vibration analysis of electrical rotating machines using FFT: A method of predictive maintenance. In Proceedings of the 2013 Fourth International Conference on Computing, Communications and Networking Technologies (ICCCNT), Tiruchengode, India, 4–6 July 2013; pp. 1–6. [Google Scholar] [CrossRef]
  73. Khadersab, A.; Shivakumar, S. Vibration analysis techniques for rotating machinery and its effect on bearing faults. Procedia Manuf. 2018, 20, 247–252. [Google Scholar] [CrossRef]
  74. Lin, H.C.; Ye, Y.C.; Huang, B.J.; Su, J.L. Bearing vibration detection and analysis using enhanced fast Fourier transform algorithm. Adv. Mech. Eng. 2016, 8, 1687814016675080. [Google Scholar] [CrossRef] [Green Version]
  75. Kumar, B.K.; Diwakar, G.; Satynarayana, M. Determination of unbalance in rotating machine using vibration signature analysis. Int. J. Mod. Eng. Res. 2012, 2, 3415–3421. [Google Scholar]
  76. Saleem, M.A.; Diwakar, G.; Satyanarayana, M. Detection of unbalance in rotating machines using shaft deflection measurement during its operation. IOSR J. Mech. Civ. Eng 2012, 3, 8–20. [Google Scholar] [CrossRef]
  77. de Sá Só Martins, D.H.C.; Viana, D.P.; de Lima, A.A.; Pinto, M.F.; Tarrataca, L.; Lopes e Silva, F.; Gutiérrez, R.H.R.; de Moura Prego, T.; Monteiro, U.A.B.V.; Haddad, D.B. Diagnostic and severity analysis of combined failures composed by imbalance and misalignment in rotating machines. Int. J. Adv. Manuf. Technol. 2021, 114, 3077–3092. [Google Scholar] [CrossRef]
  78. Lakis, A. Rotating machinery fault diagnosis using time-frequency methods. In Proceedings of the 7th WSEAS International Conference on Electric Power Systems, High Voltages, Electric Machines, Venice, Italy, 21–23 November 2007. [Google Scholar]
  79. Satyam, M.; Rao, V.S.; Devy, C. Cepstrum analysis: An advanced technique in vibration analysis of defects in rotating machinery. Def. Sci. J. 1994, 44, 53. [Google Scholar] [CrossRef] [Green Version]
  80. Li, H.; Ai, S. Application of order bi-cepstrum to gearbox fault detection. In Proceedings of the 2008 7th World Congress on Intelligent Control and Automation, Chongqing, China, 25–27 June 2008; pp. 1781–1785. [Google Scholar] [CrossRef]
  81. Randall, R.; Smith, W. New cepstral methods for the diagnosis of gear and bearing faults under variable speed conditions. In Proceedings of the ICSV23 Conference, Athens, Greece, 10–14 July 2016. [Google Scholar]
  82. Liu, Y.; Jiang, Z.; Haizhou, H.; Xiang, J. Asymmetric penalty sparse model based cepstrum analysis for bearing fault detections. Appl. Acoust. 2020, 165, 107288. [Google Scholar] [CrossRef]
  83. Randall, R.B. A history of cepstrum analysis and its application to mechanical problems. Mech. Syst. Signal Process. 2017, 97, 3–19. [Google Scholar] [CrossRef]
  84. Randall, R.B.; Antoni, J. Rolling element bearing diagnostics—A tutorial. Mech. Syst. Signal Process. 2011, 25, 485–520. [Google Scholar] [CrossRef]
  85. Chen, B.; Song, D.; Cheng, Y.; Zhang, W.; Huang, B.; Muhamedsalih, Y. IGIgram: An improved Gini index-based envelope analysis for rolling bearing fault diagnosis. J. Dyn. Monit. Diagn. 2022, 111–124. [Google Scholar] [CrossRef]
  86. Cheng, F.; Qu, L.; Qiao, W.; Wei, C.; Hao, L. Fault diagnosis of wind turbine gearboxes based on DFIG stator current envelope analysis. IEEE Trans. Sustain. Energy 2018, 10, 1044–1053. [Google Scholar] [CrossRef]
  87. Abboud, D.; Antoni, J.; Sieg-Zieba, S.; Eltabach, M. Envelope analysis of rotating machine vibrations in variable speed conditions: A comprehensive treatment. Mech. Syst. Signal Process. 2017, 84, 200–226. [Google Scholar] [CrossRef]
  88. Rangel-Magdaleno, J.; Peregrina-Barreto, H.; Ramirez-Cortes, J.; Cruz-Vega, I. Hilbert spectrum analysis of induction motors for the detection of incipient broken rotor bars. Measurement 2017, 109, 247–255. [Google Scholar] [CrossRef]
  89. Mehrjou, M.R.; Mariun, N.; Marhaban, M.H.; Misron, N. Rotor fault condition monitoring techniques for squirrel-cage induction machine—A review. Mech. Syst. Signal Process. 2011, 25, 2827–2848. [Google Scholar] [CrossRef]
  90. Radi, A.; Bakalli, G.; Guerrier, S.; El-Sheimy, N.; Sesay, A.B.; Molinari, R. A multisignal wavelet variance-based framework for inertial sensor stochastic error modeling. IEEE Trans. Instrum. Meas. 2019, 68, 4924–4936. [Google Scholar] [CrossRef]
  91. Huang, Z.; Zhu, J.; Lei, J.; Li, X.; Tian, F. Tool wear monitoring with vibration signals based on short-time fourier transform and deep convolutional neural network in milling. Math. Probl. Eng. 2021, 2021, 9976939. [Google Scholar] [CrossRef]
  92. Santhoshi, M.S.; Sharath Babu, K.; Kumar, S.; Nandan, D. An investigation on rolling element bearing fault and real-time spectrum analysis by using short-time fourier transform. In Proceedings of the International Conference on Recent Trends in Machine Learning, IoT, Smart Cities and Applications: ICMISC, Hyderabad, India, 29–30 March 2020; Springer: Berlin/Heidelberg, Germany, 2021; pp. 561–567. [Google Scholar]
  93. Ribeiro Junior, R.F.; dos Santos Areias, I.A.; Campos, M.M.; Teixeira, C.E.; da Silva, L.E.B.; Gomes, G.F. Fault detection and diagnosis in electric motors using convolution neural network and short-time fourier transform. J. Vib. Eng. Technol. 2022, 10, 2531–2542. [Google Scholar] [CrossRef]
  94. Leiber, M.; Marnissi, Y.; Barrau, A.; El Badaoui, M. Differentiable Adaptive Short-Time Fourier Transform with Respect to the Window Length. In Proceedings of the ICASSP 2023—2023 IEEE International Conference on Acoustics, Speech and Signal Processing (ICASSP), Rhodes Island, Greece, 4–10 June 2023; IEEE: Piscataway, NJ, USA, 2023; pp. 1–5. [Google Scholar]
  95. Wang, L.H.; Zhao, X.P.; Wu, J.X.; Xie, Y.Y.; Zhang, Y.H. Motor fault diagnosis based on short-time Fourier transform and convolutional neural network. Chin. J. Mech. Eng. 2017, 30, 1357–1368. [Google Scholar] [CrossRef]
  96. Al-Badour, F.; Sunar, M.; Cheded, L. Vibration analysis of rotating machinery using time–frequency analysis and wavelet techniques. Mech. Syst. Signal Process. 2011, 25, 2083–2101. [Google Scholar] [CrossRef]
  97. Teng, W.; Ding, X.; Cheng, H.; Han, C.; Liu, Y.; Mu, H. Compound faults diagnosis and analysis for a wind turbine gearbox via a novel vibration model and empirical wavelet transform. Renew. Energy 2019, 136, 393–402. [Google Scholar] [CrossRef]
  98. Loparo, K.A.; Adams, M.L.; Lin, W.; Abdel-Magied, M.F.; Afshari, N. Fault detection and diagnosis of rotating machinery. IEEE Trans. Ind. Electron. 2000, 47, 1005–1014. [Google Scholar] [CrossRef]
  99. Li, Y.; Xu, M.; Wei, Y.; Huang, W. A new rolling bearing fault diagnosis method based on multiscale permutation entropy and improved support vector machine based binary tree. Measurement 2016, 77, 80–94. [Google Scholar] [CrossRef]
  100. Li, S.; Xin, Y.; Li, X.; Wang, J.; Xu, K. A review on the signal processing methods of rotating machinery fault diagnosis. In Proceedings of the 2019 IEEE 8th Joint International Information Technology and Artificial Intelligence Conference (ITAIC), Chongqing, China, 24–26 May 2019; IEEE: Piscataway, NJ, USA, 2019; pp. 1559–1565. [Google Scholar]
  101. Liao, Y.; Ragai, I.; Huang, Z.; Kerner, S. Manufacturing process monitoring using time-frequency representation and transfer learning of deep neural networks. J. Manuf. Process. 2021, 68, 231–248. [Google Scholar] [CrossRef]
  102. Sun, K.; Jin, T.; Yang, D. A new reassigned spectrogram method in interference detection for GNSS receivers. Sensors 2015, 15, 22167–22191. [Google Scholar] [CrossRef] [Green Version]
  103. Ding, C.; Zhao, M.; Lin, J.; Liang, K.; Jiao, J. Kernel ridge regression-based chirplet transform for non-stationary signal analysis and its application in machine fault detection under varying speed conditions. Measurement 2022, 192, 110871. [Google Scholar] [CrossRef]
  104. Liu, X.; Yan, Y.; Hu, K.; Zhang, S.; Li, H.; Zhang, Z.; Shi, T. Fault diagnosis of rotor broken bar in induction motor based on successive variational mode decomposition. Energies 2022, 15, 1196. [Google Scholar] [CrossRef]
  105. Pai, P.F.; Huang, L.; Hu, J.; Langewisch, D.R. Time-frequency method for nonlinear system identification and damage detection. Struct. Health Monit. 2008, 7, 103–127. [Google Scholar] [CrossRef]
  106. Susanto, A.; Liu, C.H.; Yamada, K.; Hwang, Y.R.; Tanaka, R.; Sekiya, K. Application of Hilbert–Huang transform for vibration signal analysis in end-milling. Precis. Eng. 2018, 53, 263–277. [Google Scholar] [CrossRef]
  107. Bin, G.; Gao, J.; Li, X.; Dhillon, B. Early fault diagnosis of rotating machinery based on wavelet packets—Empirical mode decomposition feature extraction and neural network. Mech. Syst. Signal Process. 2012, 27, 696–711. [Google Scholar] [CrossRef]
  108. Liu, R.; Yang, B.; Zio, E.; Chen, X. Artificial intelligence for fault diagnosis of rotating machinery: A review. Mech. Syst. Signal Process. 2018, 108, 33–47. [Google Scholar] [CrossRef]
  109. Zhang, D.; Feng, Z. Enhancement of time-frequency post-processing readability for nonstationary signal analysis of rotating machinery: Principle and validation. Mech. Syst. Signal Process. 2022, 163, 108145. [Google Scholar] [CrossRef]
Figure 1. Example of vibration monitoring system installed in an electrical rotating machine for predictive maintenance.
Eng 04 00102 g001
Figure 2. A vibration monitoring system composed of 4 sensors for simultaneously measuring 4 points in the same rotating machine [15].
Eng 04 00102 g002
Figure 3. Main steps for fault diagnosis in rotating machinery through vibration analysis.
Eng 04 00102 g003
Figure 4. Velocity sensor schematic with the indication of main components.
Eng 04 00102 g004
Figure 5. Schematic of a piezoelectric accelerometer.
Eng 04 00102 g005
Figure 6. Diagram of an integrated MEMS accelerometer.
Eng 04 00102 g006
Figure 7. Magnetic mounting of two MEMS accelerometers on an electrical motor.
Eng 04 00102 g007
Figure 8. Vibration levels for a machine with aligned (blue) and misaligned (red) shaft. (a) Acquired acceleration data; (b) calculated velocity of vibration.
Eng 04 00102 g008
Table 1. Comparison between common communication methods [37,59,60,61].
WiredBluetoothWi-FiLoRa
Frequency band-2.4 GHz2.4–5 GHzsub-GHz, 2.4 GHz
Typical range-10 m100 m3–12 km
Range on factory floor-≈5 m≈25–50 m-
Max Data rate 1 Mb/s35 Mb/s–1 Gb/s00.18–37.5 kbps,
31.72–253.91 kbps
LatencyLowestModerateLow-
ThroughputHighLowModerate
ScalabilityDifficultEasyEasyEasy
Interference susceptibilityLowHighHigh
Power consumption-ModerateHighLow
Table 2. Advantages and disadvantages of time domain methods.
Time Domain MethodsAdvantagesDisadvantages
PeakSimple technique.Considers only the maximum value of x ( t ) because this technique is sensitive to noise.
RMSEasy technique, RMS values are not affected by isolated peaks
in the signal.
It is not able to detect failures in the early operating stages.
Crest factorEasy to estimate.Reliable only in the presence of
a spiky signal.
KurtosisHigh performance in detecting faults; independent of
the signal amplitude.
Its effectiveness depends on the presence of significant impulsivity in the signal.
Table 3. Summary of main advantages and disadvantages of frequency domain analysis.
Frequency Domain AnalysisAdvantagesDisadvantages
Fast Fourier TransformEasy to implement.It is not efficient for detecting failures if the frequency and amplitude signals of the machine in normal operation
are unknown.
Cepstrum AnalysisEasy technique, useful to detect harmonics, side bands, or echoes.Sensitive to noise present in the vibration signals.
Envelope AnalysisEarly detection of bearing problems.Determining the best frequency band for this technique is a challenge.
Power Spectral DensityClear frequency domain of the signal, which allows identification of specific frequency components associated with faults or anomalies in rotating machinery.Specialist is required for graphical interpretation
of the signal.
Table 4. Main advantages and disadvantages of time–frequency domain analysis.
Time–Frequency Domain AnalysisAdvantagesDisadvantages
STFTMore efficient than conventional analysis methods in the time and frequency domain; low computational complexity.The resolution is determined by the size of the window.
WTAbility to detect local changes in vibration signals; improved
time resolution.
Need a careful selection of the wavelet function.
WVDHigh time–frequency resolution; ability to detect and locate transient events with high accuracy.The presence of interference can make it difficult to interpret
the results.
HHTSuitable for analyzing stationary, non-stationary and transient signals; high time-frequency resolution; ability to capture transient phenomena; low computation time.Sensitivity to noise; generation of undesirable IMFs in the low-frequency range; difficulty in separating low-frequency components.
Disclaimer/Publisher’s Note: The statements, opinions and data contained in all publications are solely those of the individual author(s) and contributor(s) and not of MDPI and/or the editor(s). MDPI and/or the editor(s) disclaim responsibility for any injury to people or property resulting from any ideas, methods, instructions or products referred to in the content.

