1. Introduction
At the present time, there is a need for products that result in the use of less disposable material by environmentally conscious consumers. In the tissue paper converting industrial process, this has encouraged manufacturers to produce products with the ability to be partitioned [
1].
In the production of finished tissue paper products, such as facial papers, paper towels and toilet papers, transversal perforation lines are used to facilitate the separation of the roll into individual “sheets” or services needed by the consumer. This feature of perforation allows the consumer to conveniently dispense a certain amount of the product according to their convenience [
2]. Perforation takes place in the tissue paper converting machine when the sheet of paper passes through a nip between a stationary anvil and the perforator blades. These blades are usually mounted on a rotating cylinder and have alternately spaced teeth and notches. Both the anvil and the perforator are skewed in the machine direction (MD) to decrease the impact of the blade against the anvil by reducing vibration and keeping the cut line perpendicular to the MD of the tissue paper sheet. It is important that the perforator blades produce the desired cut in the finished product, so that consumer acceptance is as intended. The quality of the product cannot be affected by this operation due to poor distribution or the type of perforations. On the other hand, there has to be a balance between the number of cuts, the dimension of the cuts, the number of spacings, the dimension of the spacings and the number of plies, so that the partition of the paper roll partition by the consumer is neither easy nor too hard [
3,
4,
5]. This balance is called the perforation efficiency and can be determined accordingly to the standard [
6] by Equation (1):
where
is the perforation efficiency (%),
is the average tensile strength of perforated papers (N/m) and
is the average tensile strength of unperforated papers (N/m).
During the tissue paper manufacturing process, raised up cellulosic fibers are found on the sheet surface, which help in consumer hygiene, but which in excess can form agglomerates, impairing the quality of the final product. To reduce the loss of cellulosic fibers on the paper surface, it is desirable that the perforation blade have relatively thin teeth [
3,
4]. Thus, the proper geometry of the blade must be considered. The perforator is also responsible for the visual appearance of the free edge of the remaining paper roll. The consumer wants an aesthetically pleasing free edge (smoother and less irregular between the cut and uncut areas) after tearing off the desired amount of paper [
3,
4].
The geometric discontinuity of the perforation line will affect the existing stress field in this area, thus affecting the stress concentration factor and consequently the final efficiency. The ratio between the highest value in a geometric discontinuity and the nominal stress in the minimum cross section is called the stress concentration factor [
7]. In a previous work develop by Vieira et al. [
8], they concluded that in toilet paper samples with a stress concentration factor above 0.11, a tear occurs at other locations away from the perforation line. On the other hand, toilet papers with a stress concentration factor below 0.11 tear along the perforation line. Another study carried out by Vieira et al. [
9] showed that the perforation efficiency increases with an increase in the cut distance, stabilizing with a cut distance of 6 mm. The predicted differences of numerical simulations, when compared to experimental tests, decreases from 27% to 4% with a cutting distance ranging from 2 mm to 8 mm. However, the numerical simulations shown a trend in terms of the stabilization of the perforation efficiency for a cutting distance of 6 mm.
The current study aimed to verify if the perforation line at 0° is the best solution to maximize the perforation efficiency. To carry out this study, four commercial two-ply toilet papers were tested with the line of perforation at several angles. The perforation efficiency was evaluated at each angle. According to the authors’ knowledge, there are limited studies on this subject.
2. Simulation–Materials and Methods
2.1. Optimization
The optimization of a constrained problem, using discrete variables, is better performed using the genetic algorithm (GA) [
10] than using gradient-based methods, with the use of the GA avoiding the trap of local minima [
11]. For this problem, the objective was to find the minimum force necessary to detach the toilet paper service by optimizing the angle α and the blank distance
of the paper cuts (see
Figure 1), where the cut distance was maintained constant in all simulations (
c = 3 mm). Additionally, a second optimization was performed regarding only the angle α by maintaining the blank distance
= 1.0 mm.
As usual, the design variables were coded as genes (coded as integer numbers) grouped into chromosomes (strings). The chromosomes were weighted as the fitness function (minimum force), representing the chromosome phenotype. Populations of possible optimal values were generated considering their probabilistic characteristics, which evolved over generations through reproductions. To avoid local minima, it is necessary to use enough search points within the design variables space [
10]. The GA algorithm begins with a random population and assesses the fitness function. Reproduction is carried out by selecting the best individuals and generating the offspring. During reproduction, the genes can be exchanged by the crossovers [
11].
The optimization parameters regard a population of 40 individuals (20 times the design parameters) and 150 generations (or as many generations as it takes for a convergence criterion to be reached), with 20% of mutation parameters and 50% crossover probability [
12].
As mentioned before, the objective was to minimize the force to detach the toilet paper regarding specific design constrains, i.e., the angle, α, which ranged from 0° to 55°, and the blank distance, , between the cuts, which ranged from 0.1 to 1.0 mm.
The GA created an angle, α, and a blank distance, , population at random based on the angle range of interest. These parameters needed to be qualified according to how they may be more able than others to achieve the design objective.
When this was carried out by using the finite element (FE) model, population crossing could produce a new generation, which was again qualified by the FE model, and this process was repeated until the best generation was found, as shown by the flowchart in
Figure 2. After each crossing, the algorithm made an elitism pre-definition, comparing the new generation with the previous one, and selecting the best members to compose the next generation to be crossed. For the genetic algorithm, the mutation probability is 1% and the crossover probability is 100%.
Regarding the optimization flowchart presented in
Figure 2, four routines were developed separately:
a Python script to modify the FE model regarding the GA design parameters;
a Python script to perform the FE results analyses (post-processing);
a Fortran subroutine for the material model (more details in the section below);
a MATLAB® script to control the FE analysis and GA.
The optimization process was controlled using the MATLAB® GA algorithm. The analysis started when MATLAB® GA generated the first generation of design parameters. Then, a Python script was called to modify the FE model regarding the design parameters. After that, the MATLAB® ran the FE analysis with the material model.
Die to the fact that explicit FE analyses can take a long time and the GA algorithm demands a considerable number of analyses, it was necessary to obtain the maximum force value and terminate the current analysis. This was performed by the MATLAB® code and a Python script that accesses the ABAQUSTM results several times until it detected a reduction of 20% in terms of the maximum force.
2.2. Material Model
It is not possible to adopt the isotropic behavior for tissue paper if the kind of paper has different behaviors in the machine and cross directions [
8], and ABAQUS
TM does not have a native constitutive law to model plasticity for orthotropic materials. Hence, a user material subroutine for explicit simulations (VUMAT) was implemented to simulate the orthotropic elastic–plastic behavior for the paper sheet. The material model, proposed by Mäkelä and Östlund [
13], allows the paper anisotropic behavior to be accounted for, since the paper response is highly dependent on the fiber orientation. The model assumes the decomposition of the strain tensor into an elastic strain tensor and a plastic strain tensor (Equation (2)) while conserving the volume.
where
is the total strain,
is the elastic strain, and
is the plastic strain.
The material model adopts the concept of an isotropic plasticity equivalent material [
14], a fictitious material that relates the orthotropic stress state to the isotropic stress state. Equation (3) gives the relation between the Cauchy stress tensor and the isotropic plasticity equivalent (IPE) deviatoric tensor.
where
is the deviatoric IPE stress tensor,
is the Cauchy stress and
is the fourth order transformation tensor shown in Equation (4) for plane stress.
where the parameters
A,
B,
C and
D are calibrated from the experimental results at 0° (MD—machine direction) and 90° (CD—cross direction) without perforation obtained in a previous work [
15], using the following Equations (5)–(12) [
11]:
The parameters
and
are related to the curve fit of the tensile test applying the Ramberg–Osgood methodology. For the MD tensile test (see Equation (13)):
For the CD (see Equation (14)):
Note that for Equation (13), the repeated indices do not mean the usual summation rule used in the indicial notation. Finally, the parameter
is obtained using Equation (15).
The Hooke’s law for plane stress, small strain, linear elastic orthotropic material is given using Equation (16).
Where is the second order Cauchy stress tensor, is the four-order plane stress, linear elastic, orthotropic constitutive law tensor and is the second order small strain elastic tensor using matrix notation.
2.3. Finite Element Model
The implementation of this model follows the well-known
flow theory for isotropic materials using the backward Euler algorithm [
11]. The explicit solver was used to overcome convergence issues that are common when using the implicit solver for this type of simulation. On the other hand, the stable time increment is very small, which increases the computational costs. Simulations were performed using a workstation with two intel Xeon E5-2630 8 cores (16 cores total with 32 threads) with 256 Gb ram.
The FE model dimensions, and boundary conditions are presented in
Figure 3. The boundary conditions were imposed to represent a tensile test. Thus, all the displacement degrees of freedom are restricted (see
Figure 3) in one side, and a prescribed displacement was applied on the reference point. A rigid link between the reference point and paper edge was used to connect the paper and the reference point.
Modeling the tensile test using the reference point to apply the prescribed displacement was important for the post-processing once the number of procedures for the automatic results analysis had been reduced. This strategy does not affect the analysis results, as the resultant applied forces are the same for the case where a prescribed displacement is applied in each boundary node [
8].
The paper was simulated using a four-node reduced integration membrane element (M3D4R). The model has a total of 11,086 elements and due to the cuts, a free mesh was used. It is important to mention that the mesh parameters did not change for all simulations. The material properties for the material model are: E11 = 13.89 MPa, E22 = E33 = 4.23 MPa, μ = 0.33 and G12 = 2.1 MPa. The parameters for the IPE model consider K22 = K33 since the mechanical behavior in the CD (direction 2) is similar to that in the thickness direction (direction 3). Thus, A = 1, B = 2.40, C = 2.40 and D = 1.38.
4. Results and Discussion
Structural characterizations were carried out on the four commercial two-ply toilet papers samples, according to the above-referred standards.
Table 1 shows the results in terms of grammage, thickness, bulk, cut and blank distances for all toilet paper samples.
Looking at
Table 1, the grammage shows values in the range of 32.4–44.9 g/m
2. Evaluating the outcomes for the thickness and bulk, values vary between 51% and 60%, respectively, due to the embossing process type.
Figure 5 shows the perforation efficiency behavior as function of the perforation line angle obtained for all toilet paper samples. Analyzing
Figure 5, a decreasing trend in perforation efficiency can be observed with an increasing perforation line angle. Although the selected toilet papers present different characteristics, it was demonstrated that they present the same tendency in this regard. This fact is in line with what it was found by Vieira et al. [
9], who stated that the perforation efficiency depends on the cut dimensions and not on the fibrous composition and/or the number of plies.
To validate the FE model, the perforation efficiency for papers B and C (
Table 1), with a cut distance,
c, of 1.9 mm and 4.0 mm, respectively, was simulated. The experimental and simulated results are compared in
Figure 6. For these simulations, the FE model considered the same conditions (boundary conditions and fiber orientation) as the experiments with and without perforation.
There are some differences between the numerical and experimental results regarding the perforation efficiency (see
Figure 6) that could be related to how the failure evolves in the FE model, resulting in higher failure loads (see Equation (1)). Despite these two cases, the FE model showed the same trend, and therefore optimization can be performed using this model (
Figure 6). For the 4 mm perforation, the average error between the simulations and experiments was 5.2%, with the error being 8.8% for the 2 mm perforation.
The first case considered the optimization of the two parameters, the blank distance,
, and the angle of the perforation line, according to
Figure 1, to minimize the tear force. The parameter boundaries used in the GA were 0° ≤ α ≤ 55° and 0.1 ≤
≤ 1.0 mm. Regarding the upper boundary for the perforation line angle, α, the value of 55° was chosen to avoid the cut line cross of the upper or the lower edges of the paper model, where the displacement boundary conditions were applied.
For the case regarding the optimization of the perforation line angle and the blank distance, the optimum configuration was achieved after 51 generations, with the tear force being in the region of 0.064 N. In the configuration for the minimum tear force, the optimum angle was 0.56°, which corresponds to a perforation efficiency of 96.8% and, as expected, = 0.1 mm. In comparison to a perforation efficiency of 0°, in the case of the optimal angle, an increase of 29.3% was obtained.
The GA’s best value and mean value over the generations is presented in
Figure 7. In this figure, the best value is almost equal through all generations and the mean value converges to the best value after 17 generations.
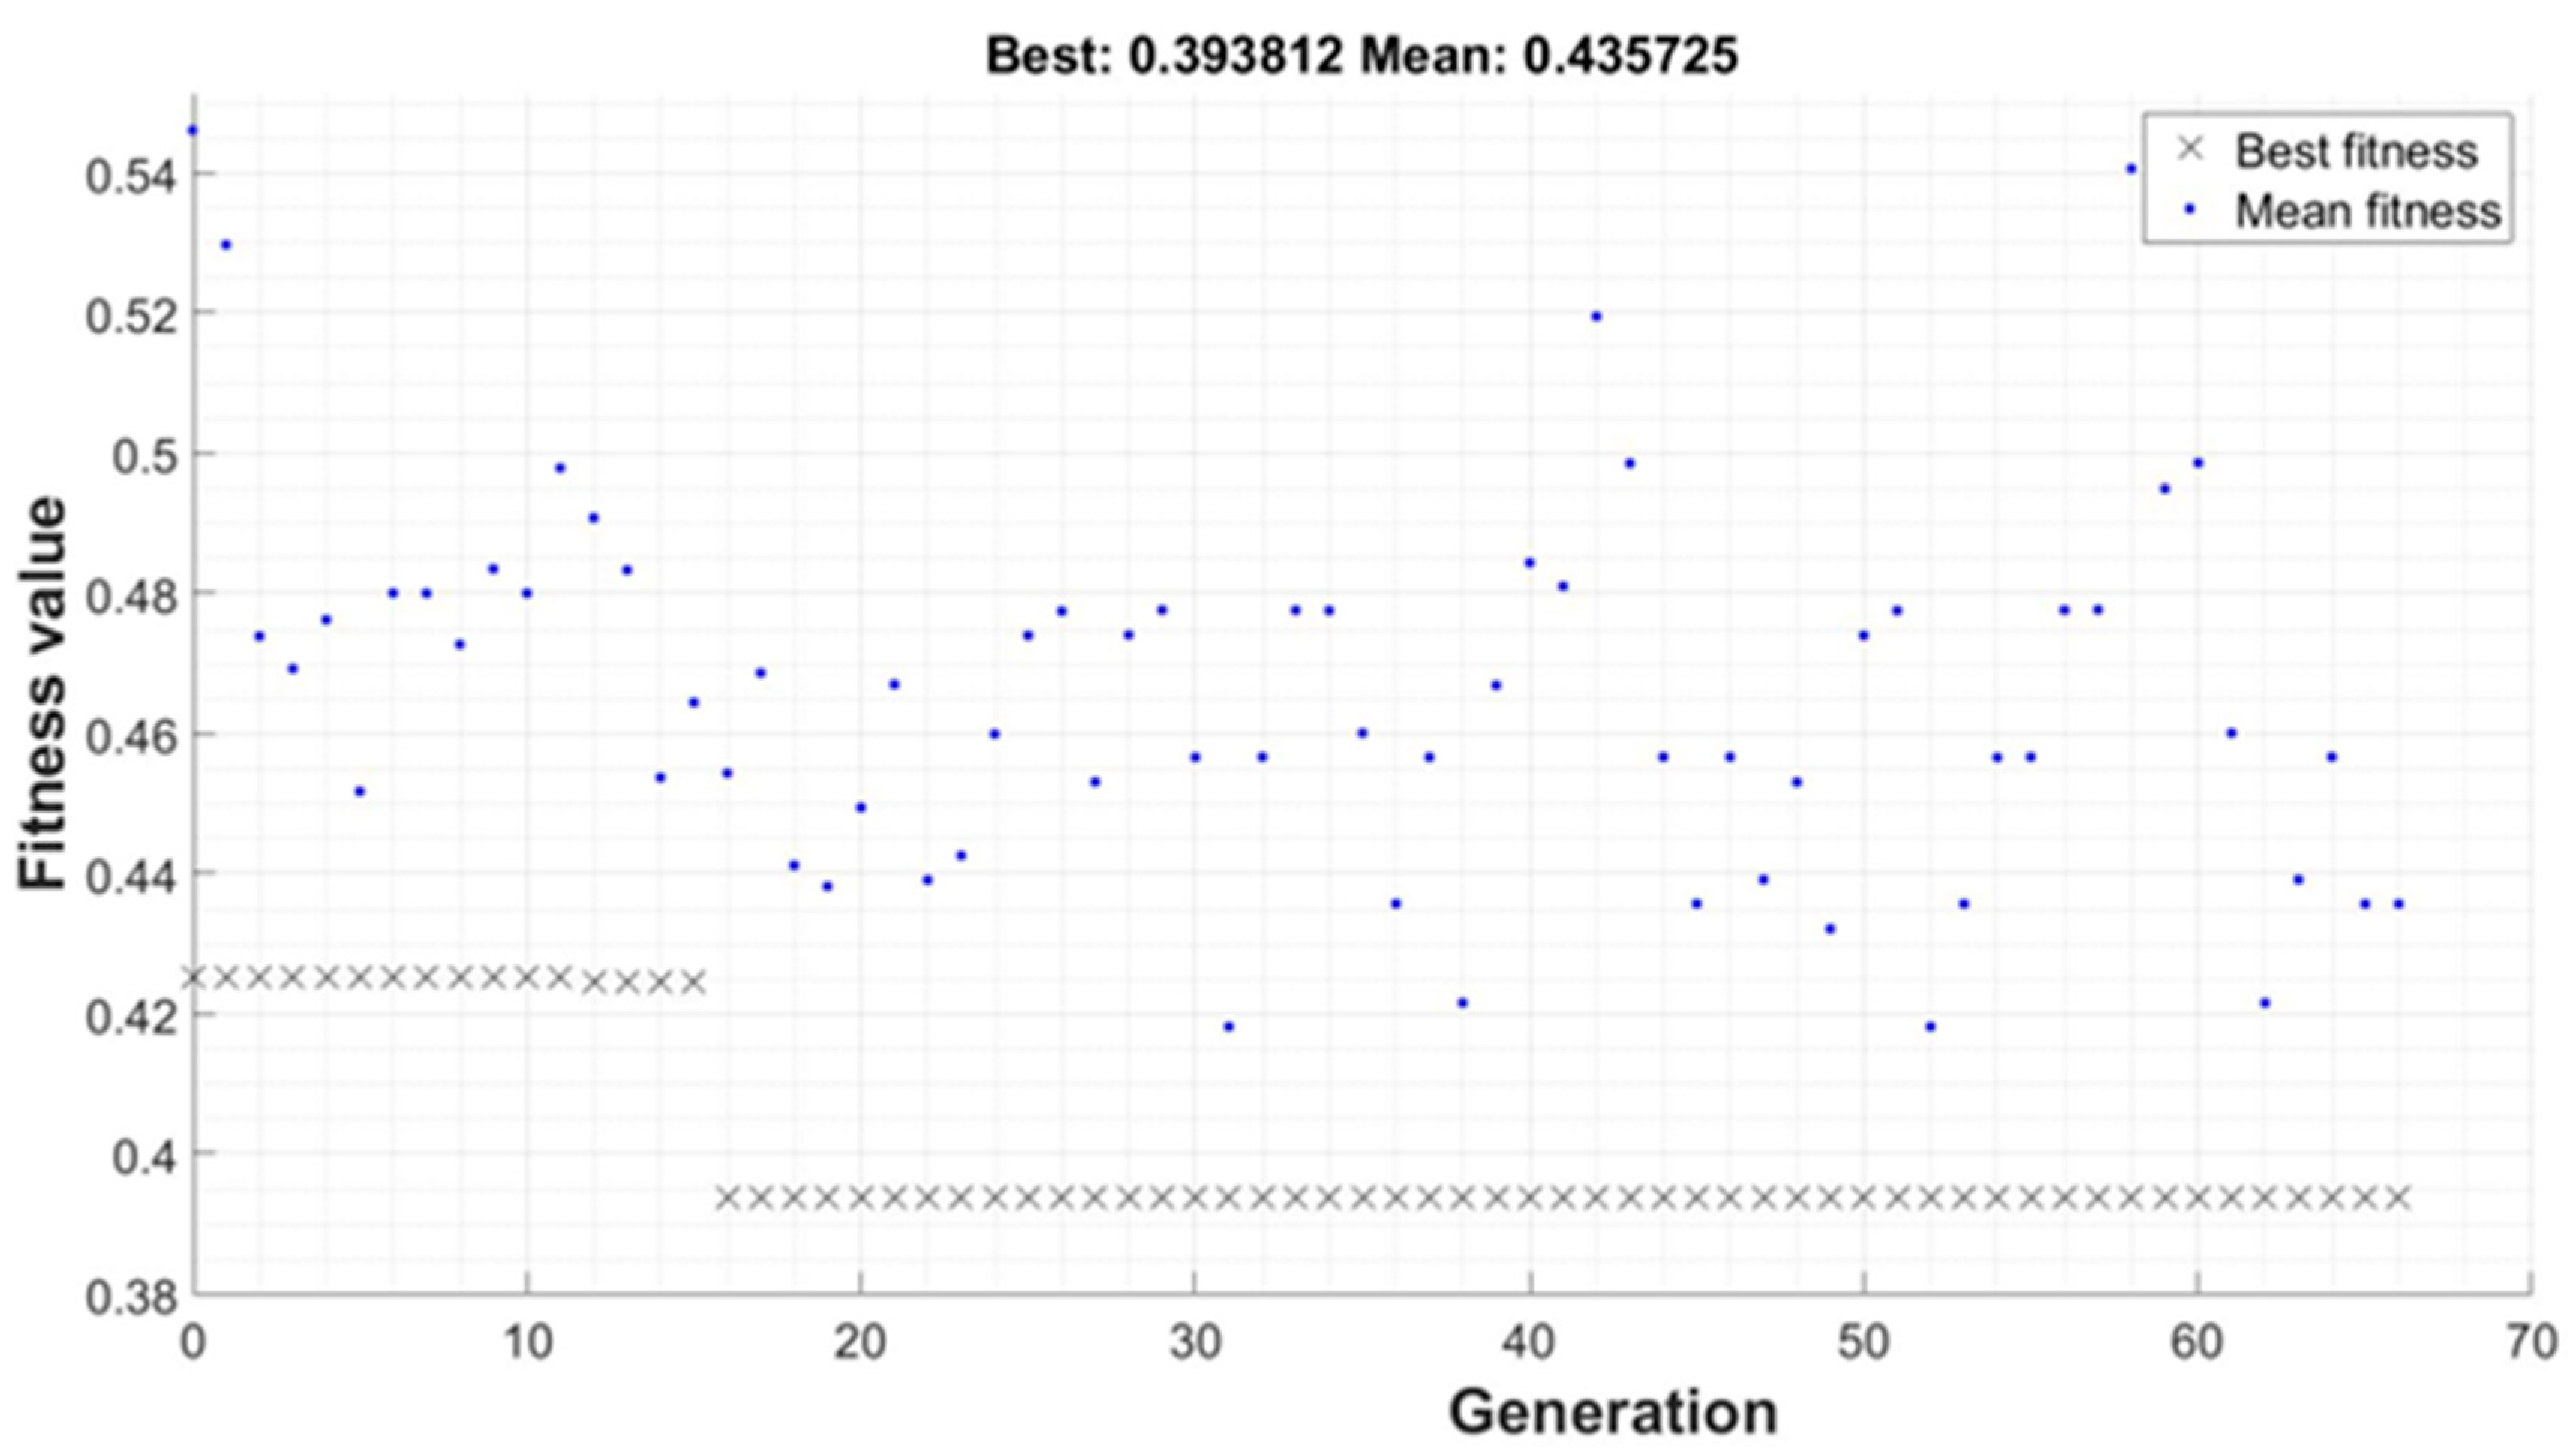
For the case where only the perforation line angle was the variable to be optimized (blank distance d was fixed and equal to 1 mm), the convergence occurred only after 66 generations, and the minimum tear force was 0.394 N. For this case, the angle for the minimum tear force was 0.67°, which corresponds to a perforation efficiency of 80.6%. Compared with a perforation efficiency at 0°, in the case of the optimal angle, an increase of 7.6% was obtained.
As presented in
Figure 8, the best value was almost constant after the 16th generation. On the other hand, the mean value did not converge. For this case, the stop criteria adopted was when the best value between generations was less than the MATLAB
® default tolerance.
The stresses field for the optimum case, where the blank distance,
, and angle, α, were optimized, are presented in
Figure 9, in the increment just before rupture.
The normal stress field in the MD (
in
Y direction),
Figure 9a, shows a stress concentration between the cuts, as expected. As the distance between cuts are only 0.1 mm, the stress concentration is approximately
Kt = 21 (regarding the stress in fiber direction, MD), justifying the low rupture force. The same behavior is detected for the other stresses (the CD (
in
X direction) in
Figure 9b and shear stress (
) in
Figure 9c). Hence, cuttings affect the stress fields in the different directions of the paper plane. In this case, rupture begins at the center of the paper, moving fast towards the left and right edges (see
Figure 9d), in the same way as it occurs experimentally in the laboratory.
Considering the other case, the optimization regarding only the inclination of the cuts, the stress fields are show in
Figure 10. The stress concentration factor is approximately
Kt = 4.1 for the MD stress (significantly lower as in the previous case). As in the previous case, the rupture starts at the center of the paper and moves towards the left and right edges (see
Figure 10d).
Additionally, the simulations regarded the paper as a homogeneous media with no variations in fiber alignment or different concentrations throughout the model. This would not be the case in real paper, and such factors would have an influence on the paper rupture force.
Figure 11a shows the MD stress field distribution (
in
Y direction) around the cuts with an orientation of 45°, and
Figure 11b shows the same MD stress field distribution at the beginning of the paper rupture starting at the lower edge towards the center. Due to paper rupture (
Figure 11b), stress flows in the non-ruptured region and hence stress is increased (darker green) in this region, while in the ruptured region stress field tends towards zero (darker blue).
5. Conclusions
In general, the results of the FE model simulation analysis support the idea that the value of perforation efficiency tends to decrease with an increasing perforation line angle, in agreement with the experimental results.
A reduction in the tear force for the toilet paper was pursued using a genetic algorithm considering two different cases. In the first case, the blank distance and the angle of the cuts were the variables to be optimized and, for this case, the best configuration was achieved with a blank distance of 0.1 mm and a 0.56° inclination in terms of the perforation line, achieving an increase of 29.3% in perforation efficiency. Both the best and mean values converged for almost the same value for this case. For the case where the only variable to be optimized was the inclination of the cuts, with the blank distance fixed at 1.0 mm, the genetic algorithm found the best inclination angle to be 0.67°, achieving an increase of 7.6% in perforation efficiency, but the average values of the population did not converge. This was due to the complex failure mode of the paper and its kinematics as the damage evolved. Despite the complex failure behavior, the optimum configuration was achieved for both cases (with and without a blank distance fixed at 1.0 mm), and only a small inclination in the perforation line will reduce the tear force, regardless of the rupture progression along the perforation line.
Digital twining is an emergent simulation tool that will be commonly used in the near future because it will permit optimization in a digital environment and the subsequent transition to and application in the industrial environment, as proved with this work.
The main limitation of this work was that it considered the material to be homogeneous and orthotropic. In fact, the material used experimentally contained heterogeneously distributed fibers, preferentially oriented in the MD. But this macroscale model is accurate enough to simulate different geometries in terms of both the perforation line and the cut itself, such as waves, triangles, etc.


 ,
, 


