Article

Sediment Transport Capacity in a Gravel-Bed River with a Sandy Tributary

by
Pedro Martin-Moreta
1,*,
Susana Lopez-Querol
2 and
Juan P. Martín-Vide
3
1
Civil and Environmental Engineering Department, Brunel University, London UB8 3PH, UK
2
Civil and Environmental Engineering Department, University College London, London WC1E 6BT, UK
3
Civil and Environmental Engineering Department, Technical University of Catalonia, 1-3, 08034 Barcelona, Spain
*
Author to whom correspondence should be addressed.
CivilEng 2023, 4(4), 1214-1232; https://doi.org/10.3390/civileng4040067
Submission received: 14 July 2023 / Revised: 4 October 2023 / Accepted: 27 November 2023 / Published: 30 November 2023
(This article belongs to the Section Water Resources and Coastal Engineering)

Abstract

:
Bedload transport in a river is a deeply analyzed problem, with many methodologies available in the literature. However, most of the existing methods were developed for reaches of rivers rather than for confluences and are suitable for a particular type of material, which makes them very inaccurate in cases where the sediments are comprised of a mix of different types of soil. This study considers the effect of two different bed sediment sizes, gravel and sand, in relation to bed load transport in a confluence. Five well-known and validated equations (namely Meyer-Peter and Müller, Parker + Engelund and Hansen, Ackers and White, and Yang) are applied to the case study of the Tagus–Alberche rivers confluence (in Talavera de la Reina, Spain), where main and tributary rivers transport different materials (sand and gravel). Field works in the area of the confluence were conducted, and a set of alluvial samples were collected and analyzed. The previously mentioned methods were employed to analyze the geomorphology in the confluence area and downstream of it under different flooding scenarios, concluding different trends in terms of deposition/erosion in the area under historic flooding scenarios. When the trends show erosion, all methods are very consistent in terms of numerical predictions. However, the results present high disparity in the estimated values when the predictions suggest deposition, with Parker + Engelund and Hansen yielding the highest volumes and Meyer-Peter and Müller the lowest (the latter being around 1% of the former). Yang and Ackers and White predict deposits in the same range in all cases (around 15% of Parker and Engelund Hansen). Yang’s formula was found to be suitable for the confluences of rivers with different materials, allowing for the estimation of sediment transport for different grain sizes. The effect of different flow regimes has been analyzed with the application of Yang’s formula to the Tagus-Alberche confluence.

1. Introduction and Objectives

Understanding the origin and process of sediment transport in river systems is one of the key aspects of flood and river management [1]. The channel capacity can be reduced under different scenarios, causing morphological adjustments and bed aggradation that might increase flood hazards, even if the flow frequency distribution remains unchanged [2].
The river confluence of a tributary with a main river is likely to change the water and sediment discharge of the main reach, affecting the morphology and hydrology of both rivers upstream and particularly downstream from the confluence point [3,4,5]. A number of experimental works [6,7,8,9,10,11] have studied the morphology and dynamics of river confluences. These laboratory experiments have resulted in the identification of several local characteristics, and some numerical modelling approaches have been tested under the particular conditions of specific river confluences [1,12]. The extrapolation of these laboratory results to real cases has been less explored [13], and most of the reported case studies with field data deal with small rivers [14,15,16]. Some exceptions are the field studies in the Paraná River [13] and the Toltén River [17]. These studies conclude that confluences provide diverse flow conditions in rivers that influence physical channel processes. The different flow and sediment discharge regimes between the tributary and main river create new erosional and depositional environments with changes in channel morphology downstream of the confluence. When the sediment load in the tributary is added to the main river, this one experiences a sudden increase in the sediment load, changing the overall channel profile along a distance from the confluence [8,18]. The higher the sediment input from the tributary, the greater the influence on the main river, changing the mean size of the river bed sediment downstream from the tributary junction. The magnitude of this change depends on the energy level of the tributary to carry the sediment load.
The analysis of bedload transport from field data involves technical difficulties [19]. Equations derived from laboratory experimental data are more common for analysis [20,21], although some others developed from site observations are also available [22]. Numerous authors have tested the bedload equations and their applicability to sediment transport estimation in rivers [23,24,25,26].
Downstream of river confluences, the tributaries add their own sediment load, which influences the sediment discharge and grain size of the main river. Bedload transport downstream of a river confluence is difficult to quantify because it depends on the dynamics of open-channel flow, the river channel geometry and flow parameters, such as cross-sectional area, slope, angle of river junction, discharge ratio between the tributary and main river, downstream Froude number, hydraulic roughness and the size of the sediments coming from the two rivers. For flood management, it is very important to consider the sediment phase, and the sediment budget approach provides an effective basis for a qualitative analysis that offers useful means of improving the understanding of erosion/accretion processes and their effect on river management practices [27,28,29].
A sediment budget can be used to describe and quantify the spatial and temporal distribution of sediment in a river basin, coastline or river reach [30,31]. The sediment budgets of a river give information on the possible effects of human activities on it, such as sediment deficit due to dam construction, gravel mining, and river training works [32,33]. An important variable in the sediment budget is the transport capacity of a river reach (defined within the limits of the budget). The original idea of transport capacity in river morphology [34,35] was further developed by Einstein [36] and Strahler [37]. These authors stated that when the rate of sediment supply equals the transport rate, then the river bed profile and banks are in equilibrium. If the transport capacity of a river/stream is overloaded, deposition and accretion occur. If it is underloaded, the bed/banks will be eroded [35].
The use and application of sediment transport capacity is complex for three main reasons. Firstly, sediment in a river is transported as a bed as well as suspended load, for a single flow condition. Secondly, sediment transported in natural rivers is heterogeneous in size and, therefore, the sediment transport rates are not only affected by the flow characteristics but also by the interaction between differently sized particles [35,38] and the rate of upstream sediment supply. Finally, the complex phenomenon due to the forces caused by form drag, turbulence and flow spatial heterogeneity in gravel and sand beds [39] and the three-dimensional (3D) turbulence characteristics of sediment beds, compared to smooth beds, can also have significant effects, as shown by Pu et al. [40,41]. In this paper, however, the turbulence and forces acting on sediment beds are not analyzed, and only overall bed load transport is analyzed, although different sizes fed by the tributary (sand) and main river (gravel) are considered. Bed load transport determines aggradation rates on river channel beds, and the capacity concept helps to understand if the sediment supply (for example, downstream of a dam) or river flow hydraulics (rivers with multiple water intakes) are limiting the bedload transport [35,42,43].
Quantitatively, bedload transport capacity can be predicted with one of the established capacity equations [44,45,46]. However, none of these equations applies to a wide range of rivers [22,42,47,48,49], making this problem one of the most uncertain ones in river engineering. In this study, five different equations for estimating bed load transport, Meyer-Peter and Müller, Parker + Engelund Hansen, Ackers and White, and Yang, were used and compared. These methodologies were tested in the case of Tagus–Alberche rivers confluence in Talavera de la Reina (Spain).
The Tagus River in Talavera de la Reina (Spain) has been the focus of many flood studies due to the large floods recorded in a gauge station and the existing paleoflood deposits. Flood analysis from numerical modelling, recorded historical floods and paleohydrology has shed some light on the case in the area of Talavera de la Reina [3,4], but the effect of sediment transport and morphodynamics has not been fully analyzed and understood. The effect of bed load transport in terms of the dynamics of the Tagus River at Talavera seems to be highly influenced by the upstream tributary, the Alberche River, which transports large quantities of sand, while the Tagus River mostly carries gravel. This increase in the bed load downstream of their confluence due to the Alberche could influence the flow capacity of the Tagus River and the flood management at Talavera de la Reina [3]. In addition, some weirs in urban stretches of the river help to reduce velocities and sediment movement, and high rates of accretion have been identified.
The Tagus–Alberche confluence creates a mix of sand (Alberche) and gravel (Tagus) downstream, which was analyzed through the use of (i) field data sampling for the grain size distribution of the sediment deposits along the river reach (Alberche confluence and Tagus river downstream) (ii) estimating the proportion of the tributary, main river and total bedloads, (iii) analysis of the spatial distribution of the bedload along the river, (iv) comparing the performance of transport equations that compute bedload by grain size fractions, (v) comparing the grain size distribution of the estimated bedload with the river grain sizes in deposits, and (vi) defining the dynamics of bedload transport: in equilibrium or under/below capacity (accretion/erosion).
In view of the above, this paper presents field data collected in the Alberche and Tagus River confluence and downstream, and an analytical model was developed based on the sediment budget to quantitatively describe the sediment evolution under flood and low water conditions. For the field data, a sediment collection campaign was conducted through the Alberche–Tagus confluence and a non-confluence control reach, and the grain size distributions of the sediment deposits were measured. Cross-sections were taken immediately before (Alberche and Tagus) and after the tributary confluence points (Tagus). The spatial distributions of the sediment deposits among the sample sites (previous cross-sections) were compared, and the sediment budget approach, together with sediment capacity equations, were applied to explore the effect of the Alberche confluence on sediment routing.
The objective of this paper was to investigate bed sediment transport in the river confluences of regulated rivers with different types of sediments and analyze the particular case of river Tagus at Talavera de la Reina via the analysis of sediment data, the application of the budget equations and capacity, and the analysis of bed load transport equations. The proposed approach consists of calculating the transport capacity at each reach of a river under different scenarios of discharges and predicting the trends of deposition or erosion based on the sediment budgets. Some of the transport equations separately consider different grain sizes. This procedure can be extrapolated to other complex confluences.

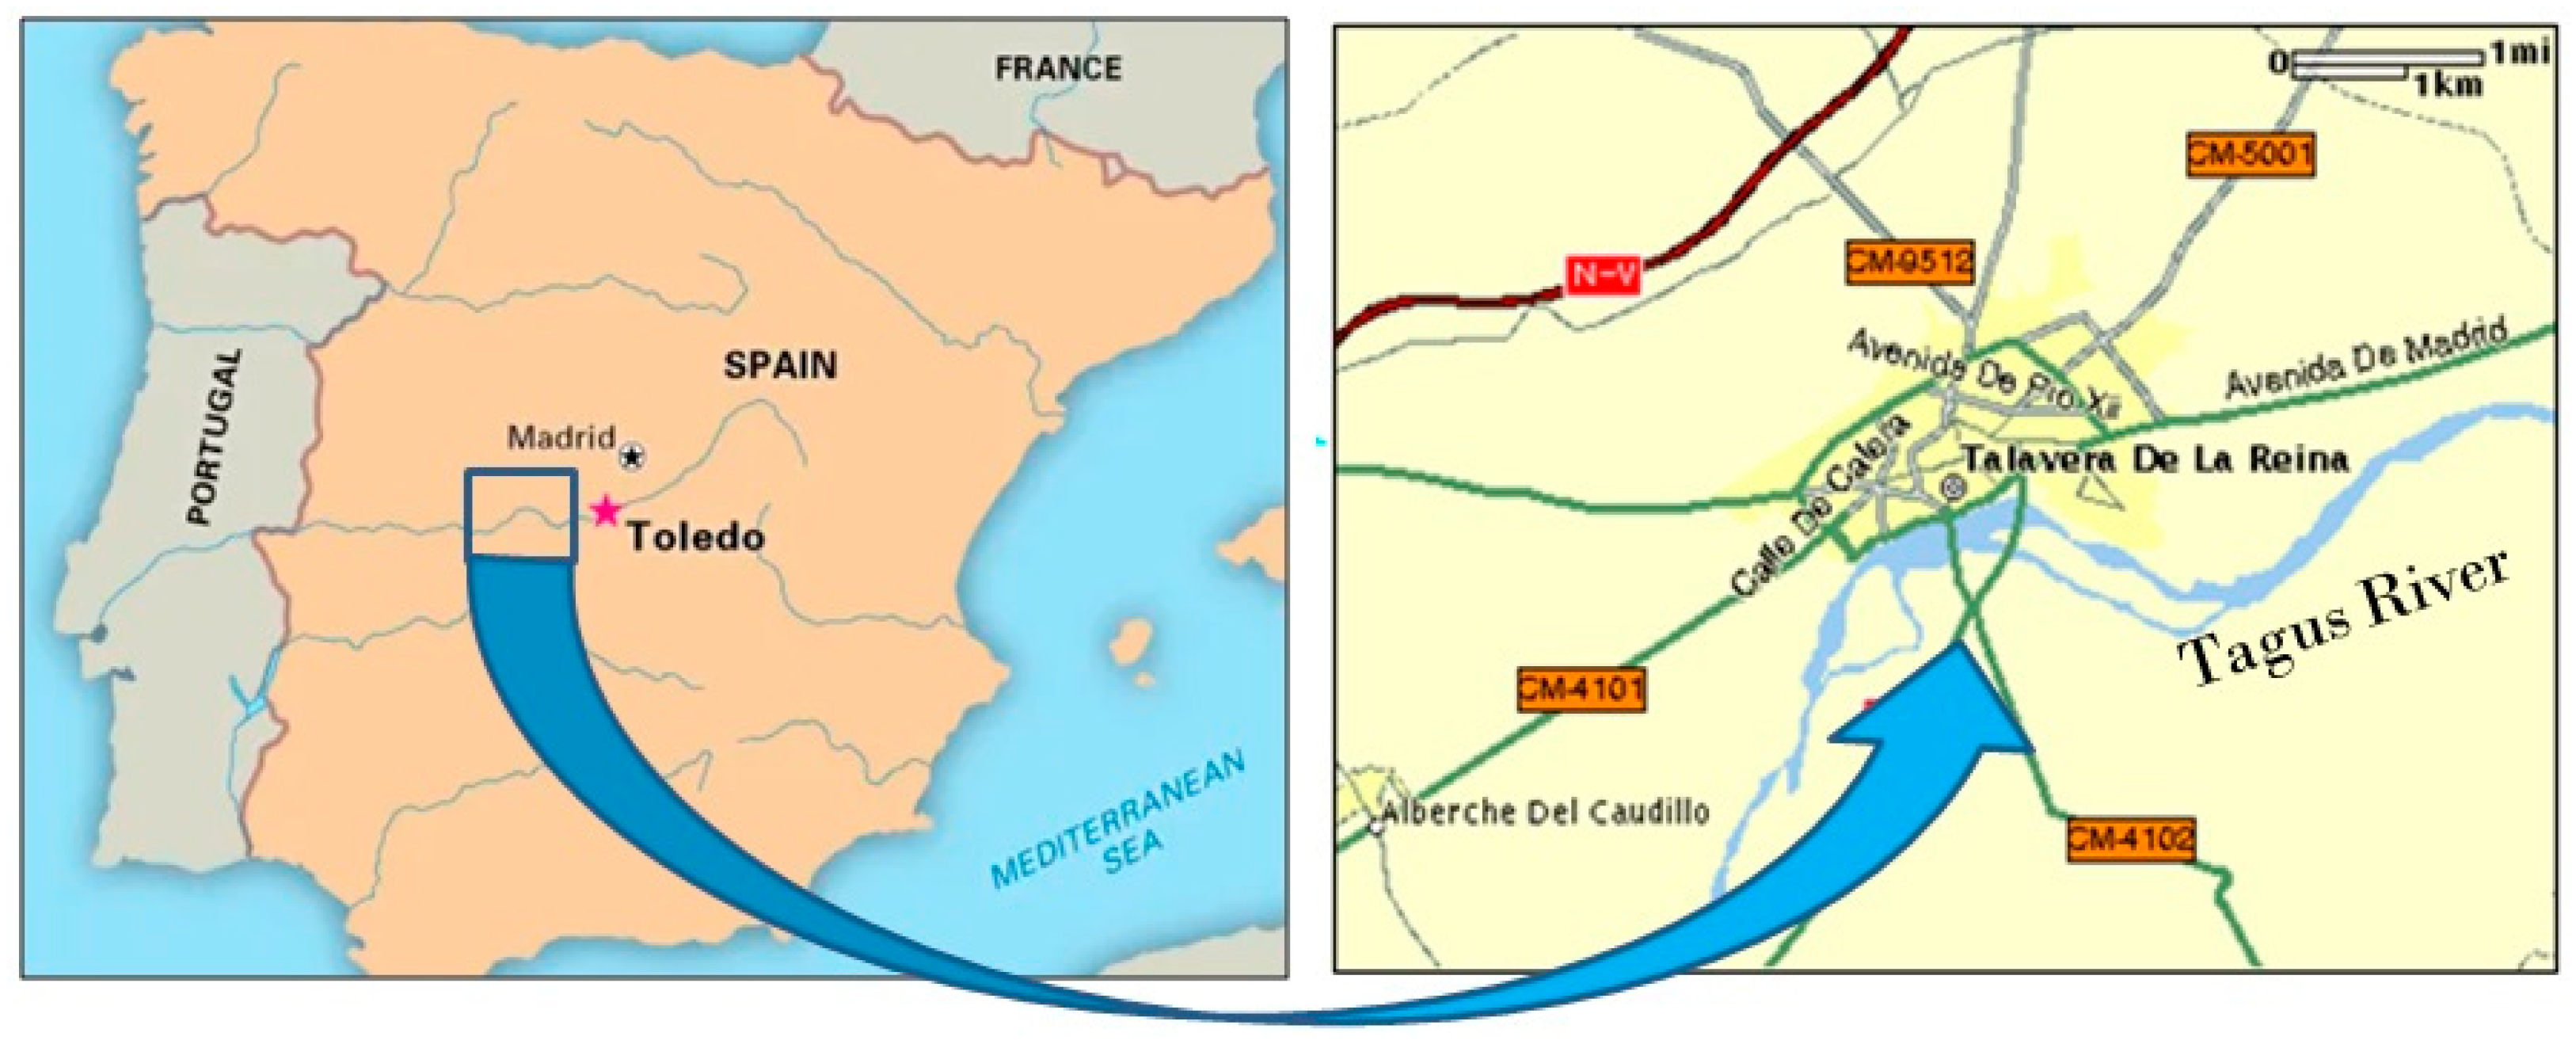
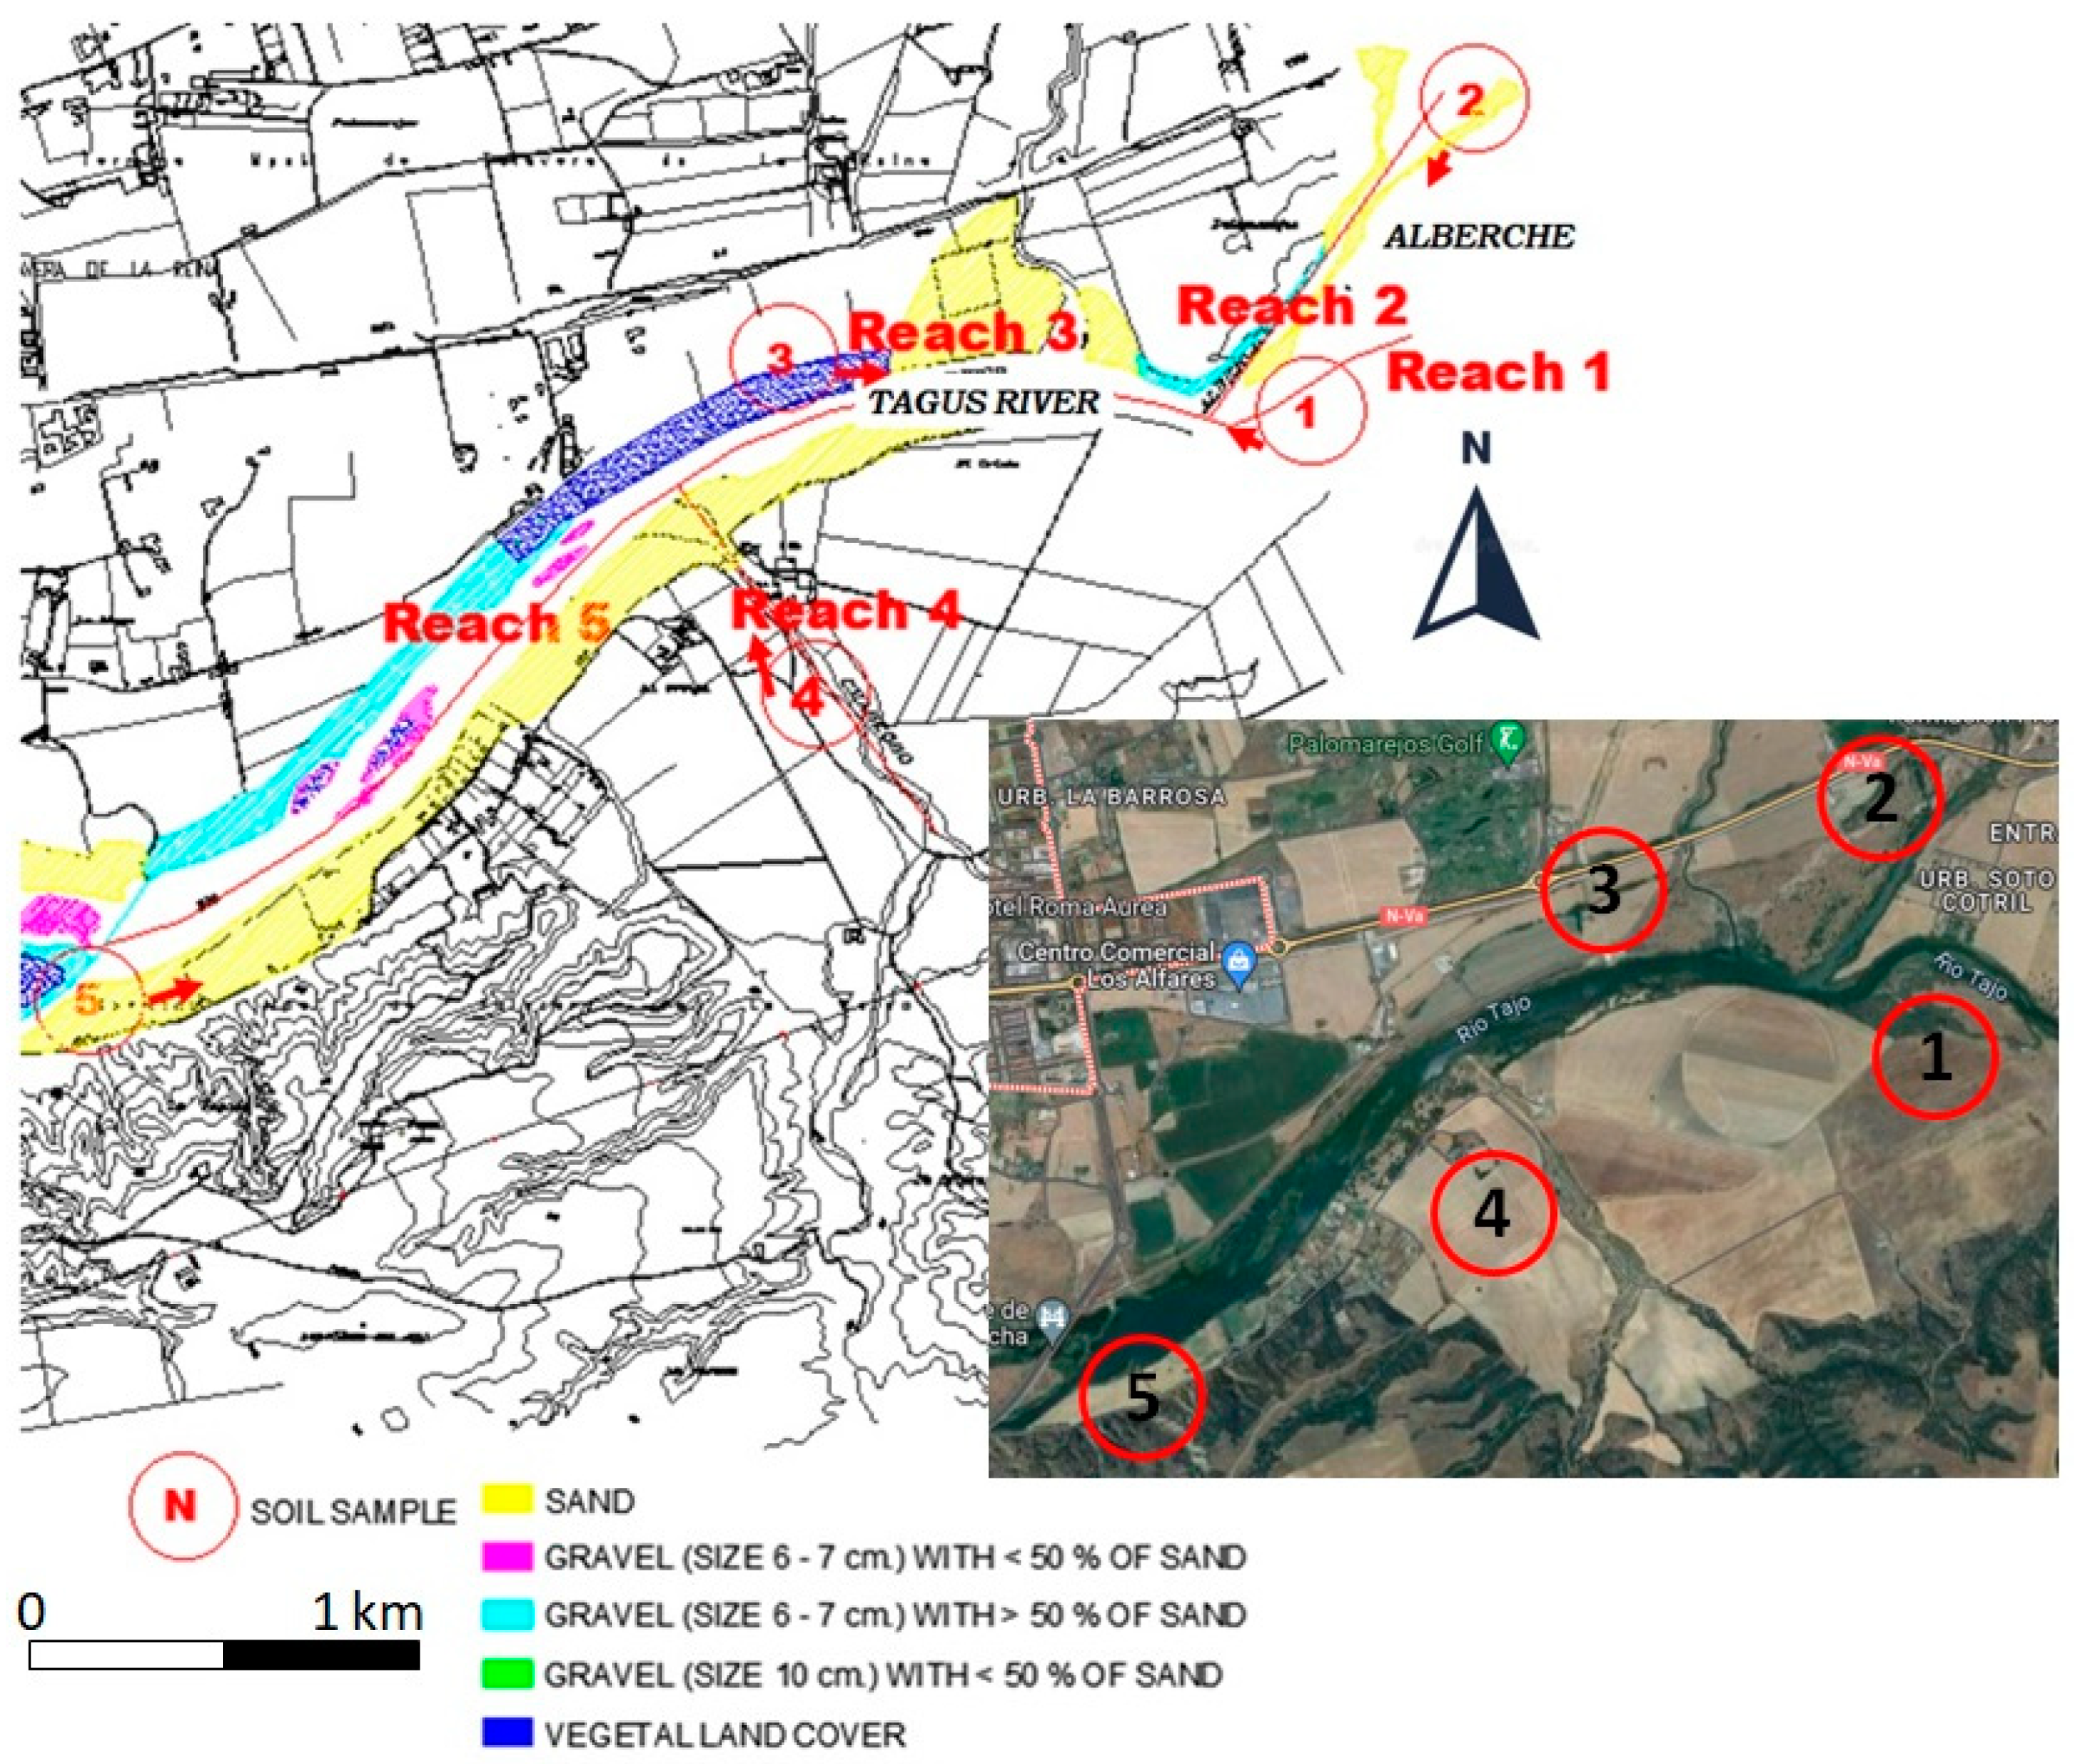
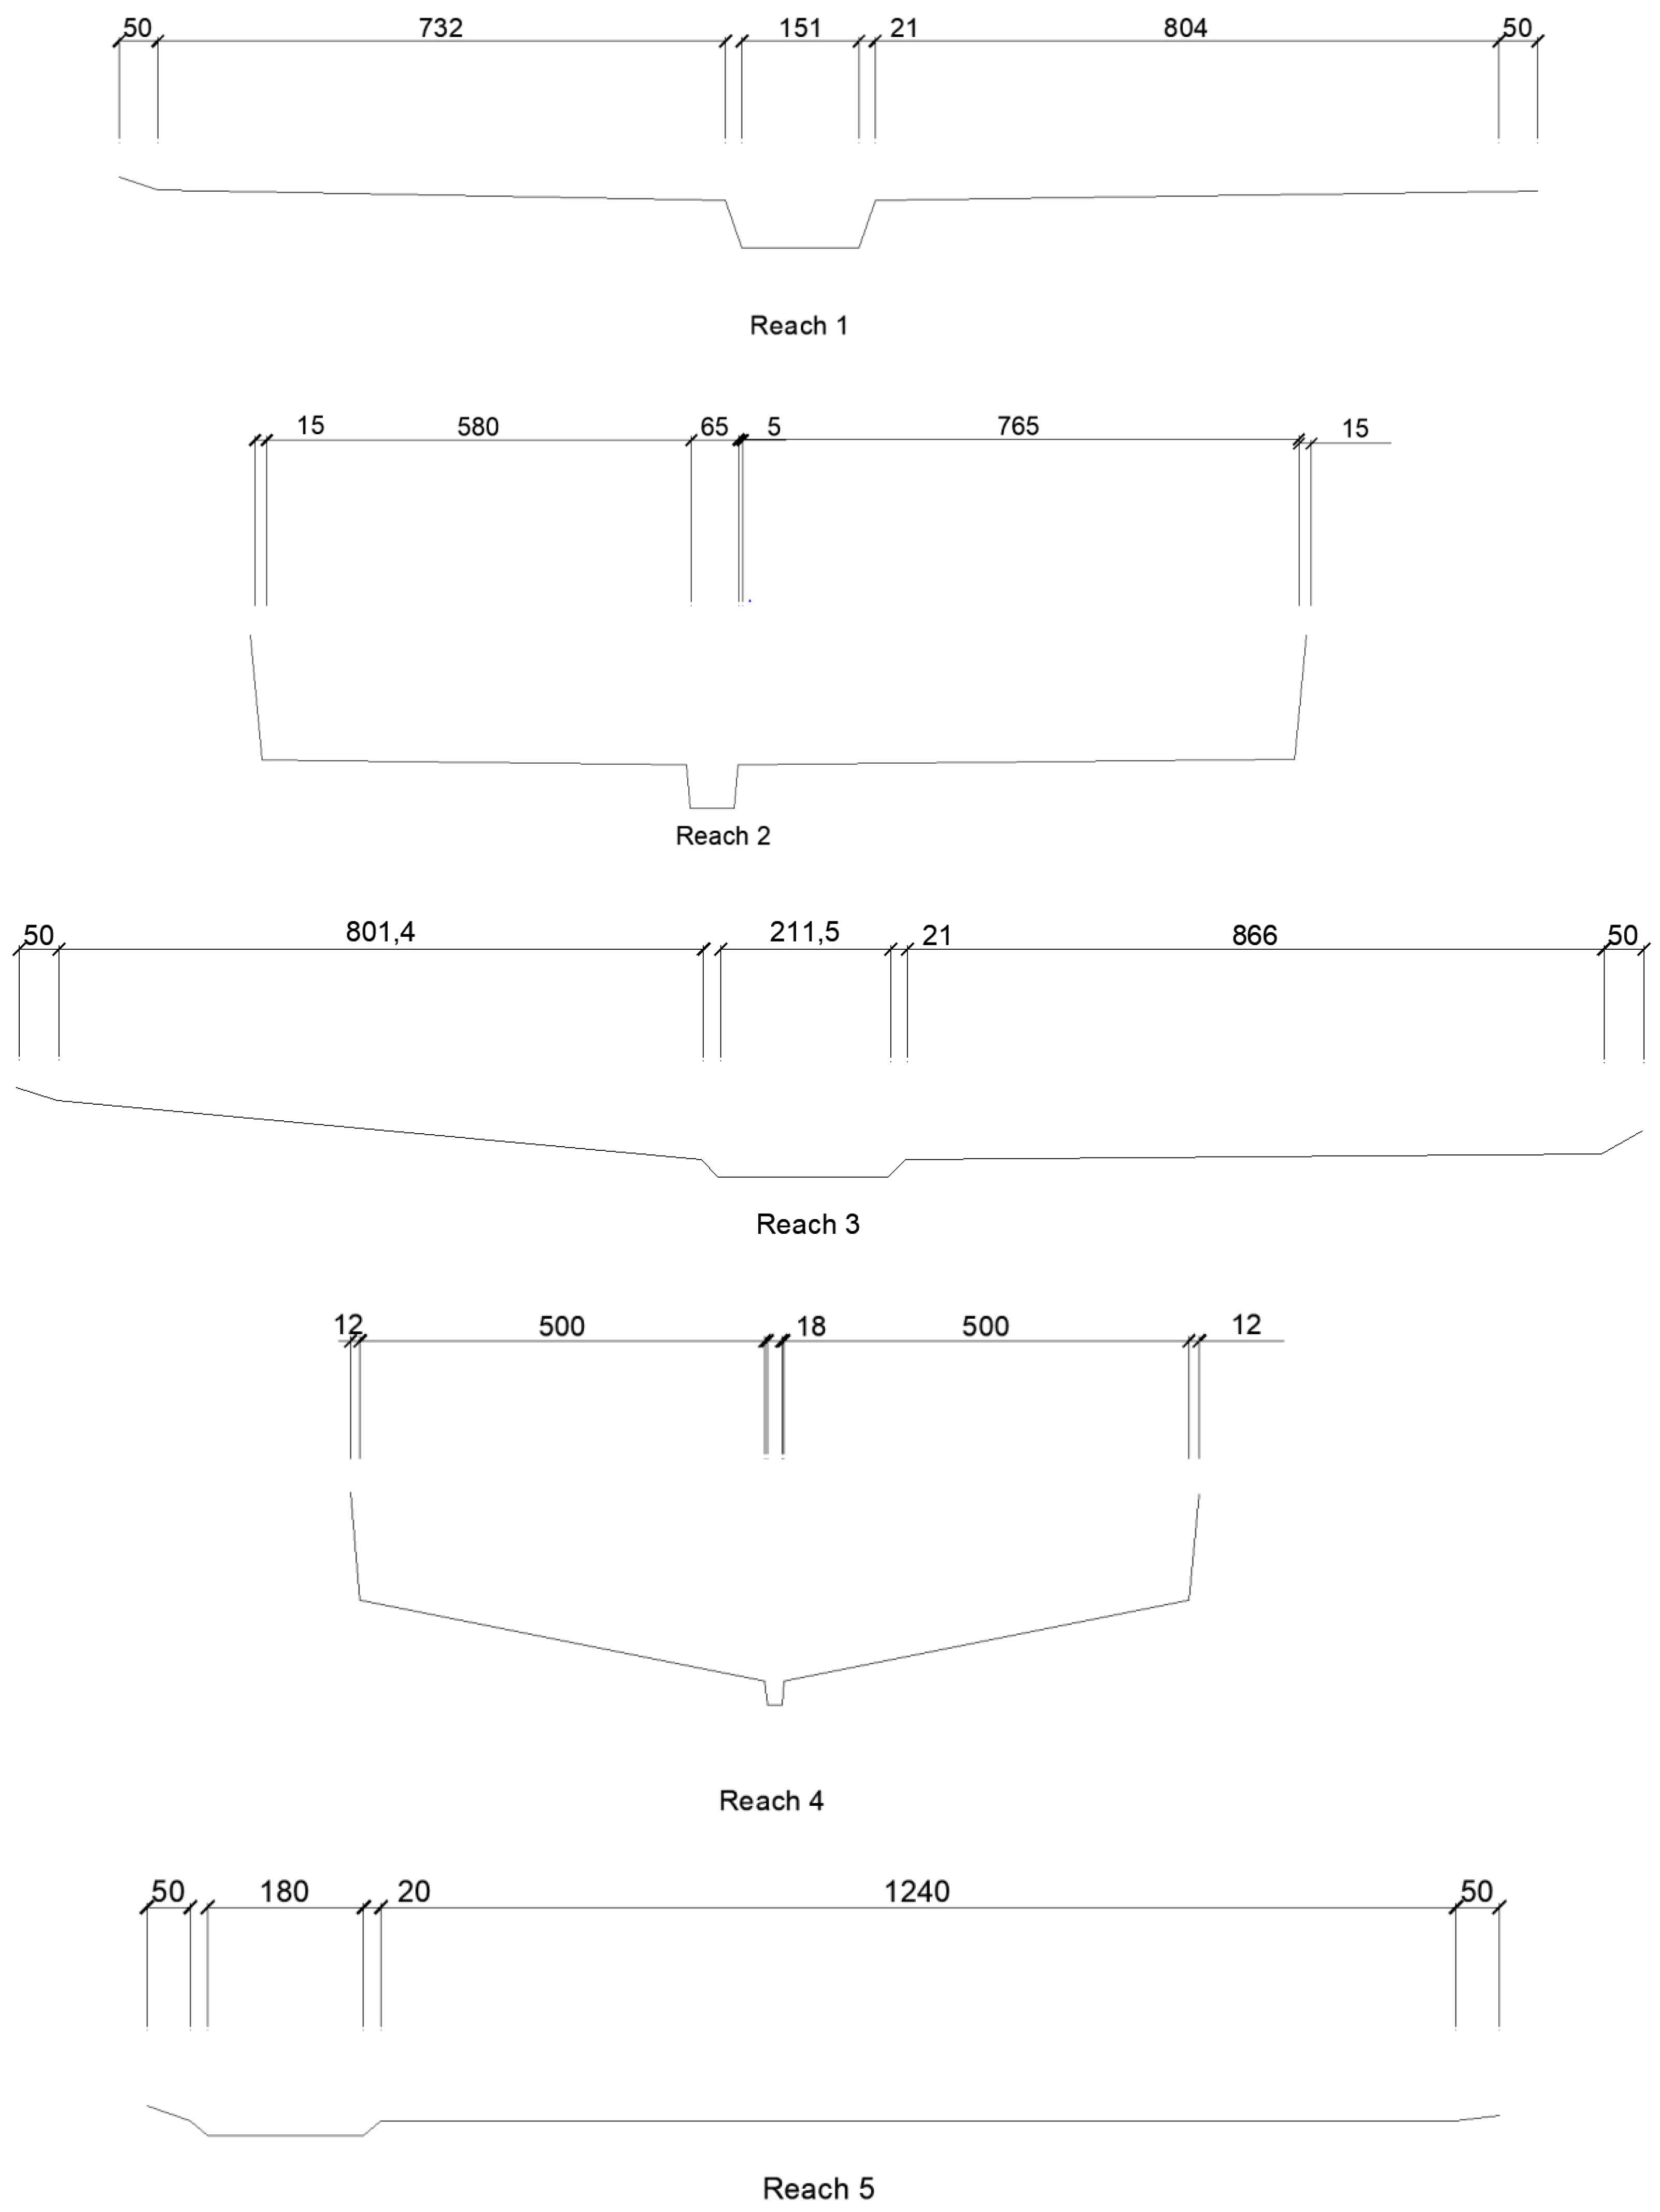
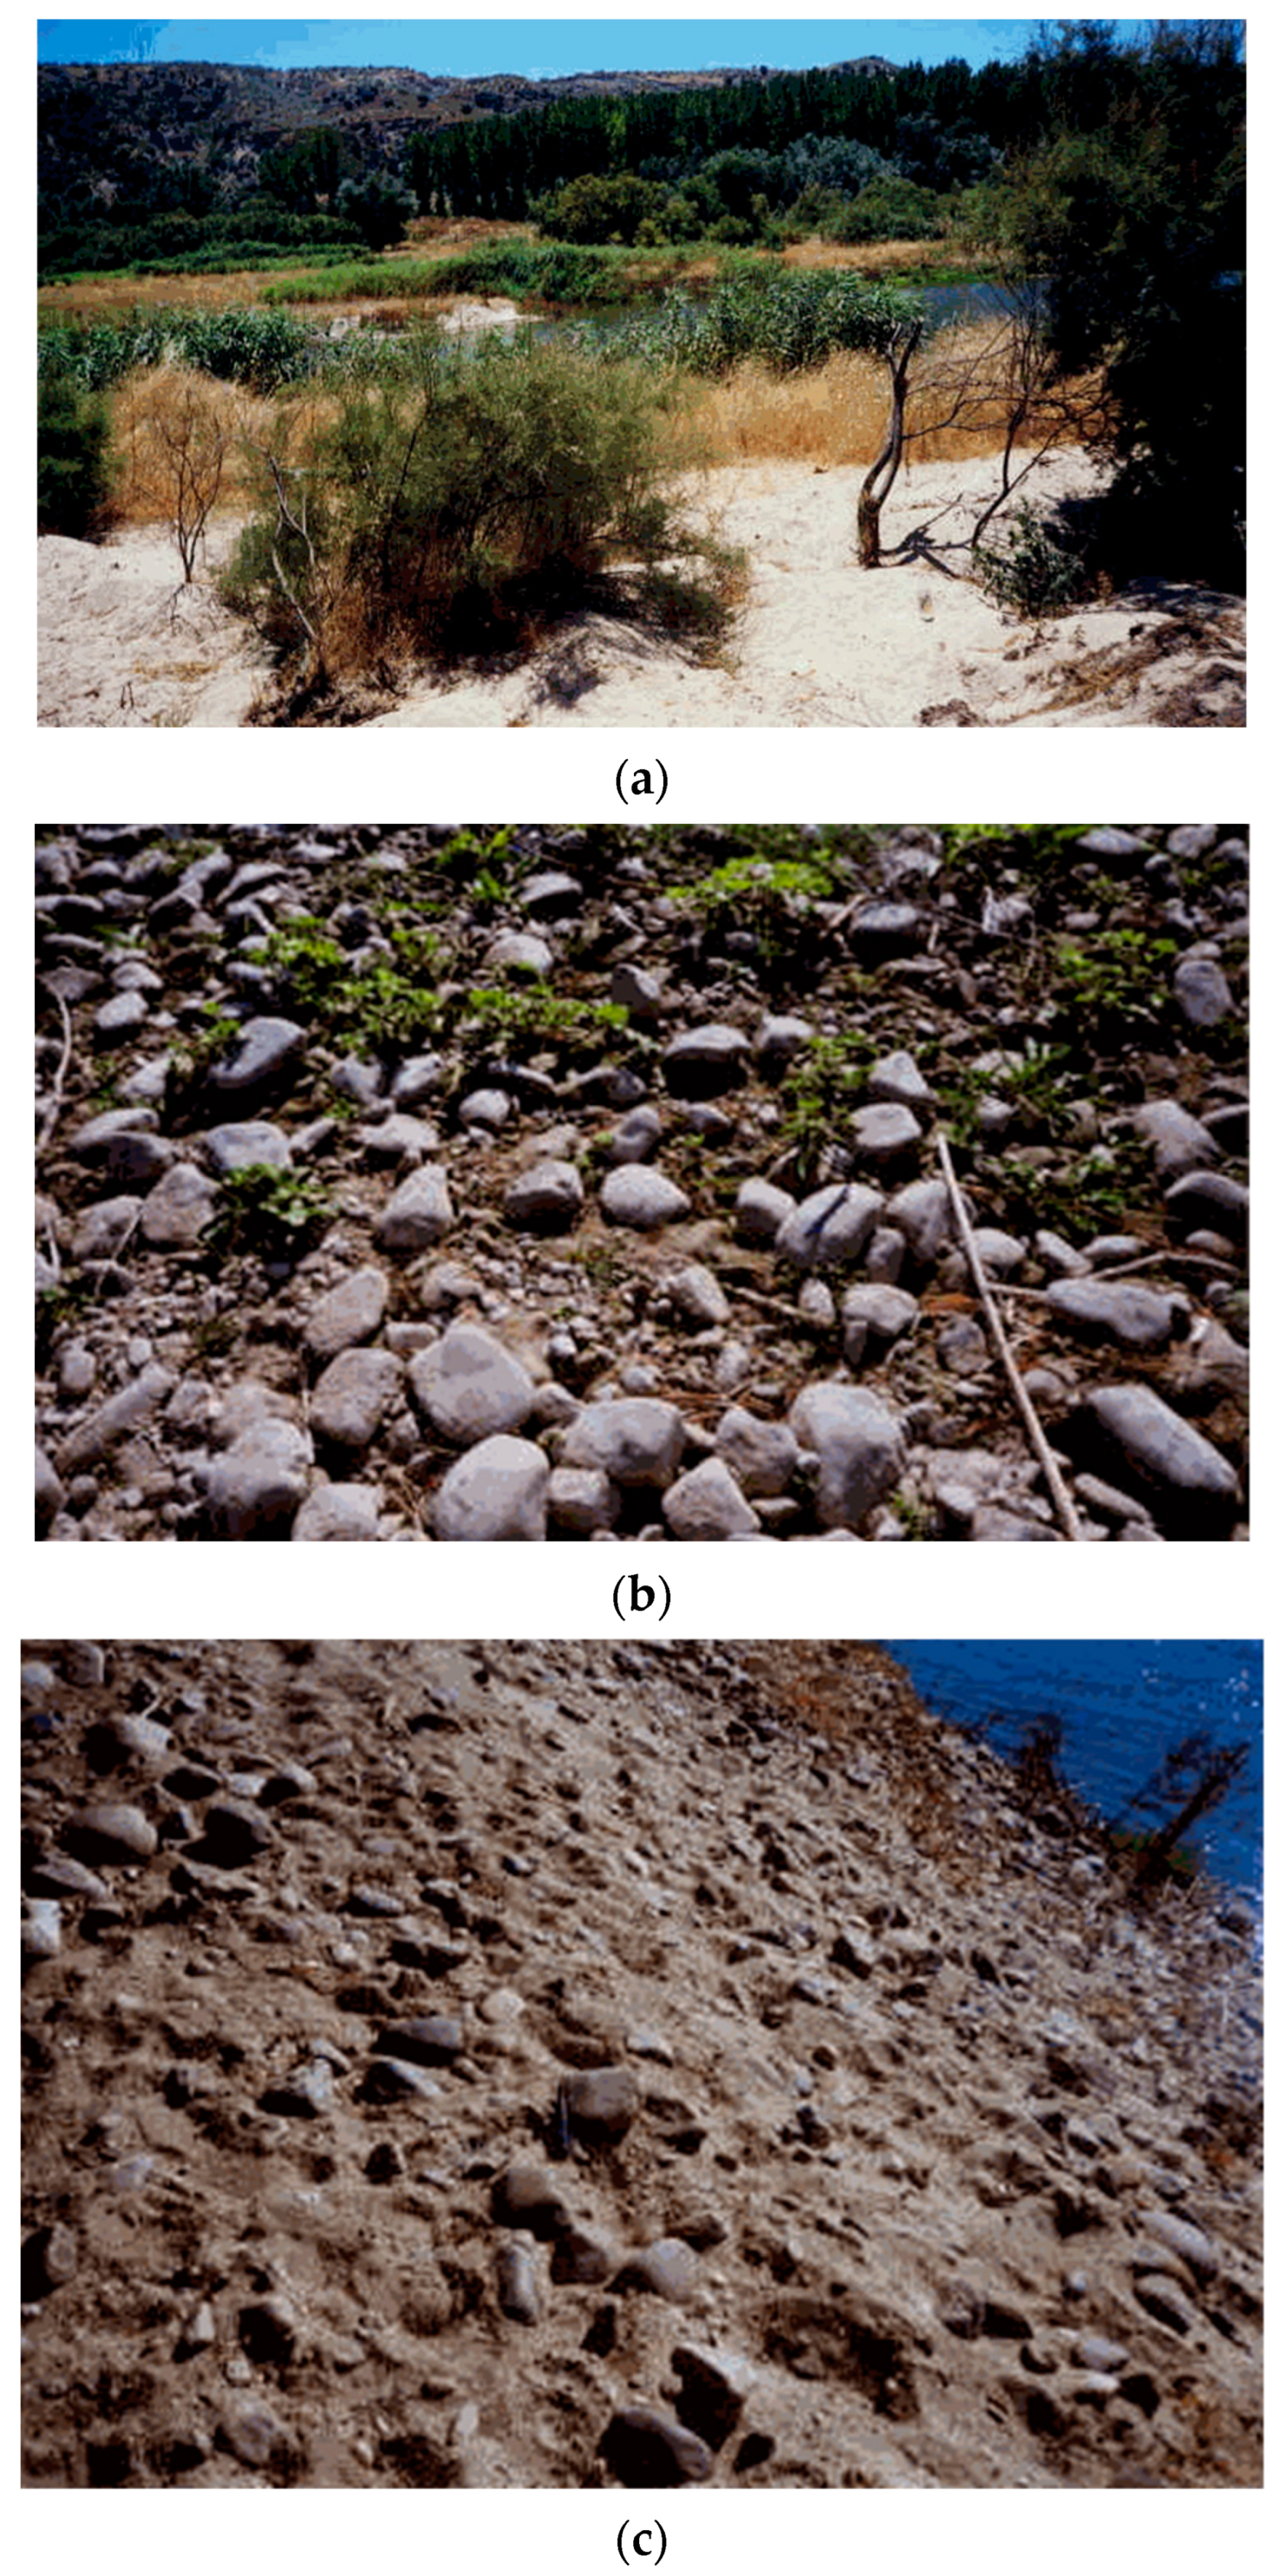
2. Case Study: The Tagus–Alberche–Chascoso Confluences (in Talavera)

The area of the Tagus River in Talavera (in Toledo, Spain—Figure 1) is composed of alluvial deposits carried and deposited by the rivers during periodic flooding episodes; the most recent floods occurred in 1912, 1936, 1947, 1955, 1970 and 1979 [50]. The Alberche River flows into the Tagus River around 4 km upstream of Talavera.
The detailed plan view of the Tagus River system and its confluences/tributaries in the reach of the study is shown in Figure 2. The reach includes three rivers: the main Tagus River and the tributaries, Alberche and Chascoso. Each of these tributaries is considered a single reach, and the Tagus River is split into three reaches: upstream of Alberche, between Alberche and Chascoso and downstream of Chascoso. Sediment samples in each reach were taken and tested during field and laboratory work.
The Alberche River is a large tributary that played a very significant role in the flooding events recorded before 1947. When the Cazalegas reservoir, which is about 15 km upstream from the confluence with the Tagus River, was built, the Alberche River became further regulated. The nearest gauge record is on the study reach at Talavera de la Reina, just 5 km downstream of the confluence [3]. The peak discharge record is incomplete and includes the periods 1942–1949 and 1971–1990. During these periods, only two floods exceeded 1500 m3/s, and four floods surpassed 1000 m3/s. Currently, the Tagus River is fully regulated by dams, which affect the flow and sediments in the reach analyzed. The most relevant ones are the Cazalegas dam on the Alberche River and the Castrejon dam in the Tagus River, just 10 km and 50 km upstream of the confluence, respectively.
The Chascoso River is a small tributary downstream of the Alberche River. It is a sandy ephemeral stream, contributing to the sand distribution of sediment transport in reaches 3 and 5. The catchment is very small but not regulated and has a high slope; therefore, its sediment transport could have some effect on the capacity of the Tagus River.

3. Methodology

3.1. Bedload Transport Equations

In this paper, an analysis of sediment transport has been conducted using the four following approaches:
Meyer-Peter and Müller (MPM, according to Wong and Parker [21] modification): This formula estimates the bed sediment transport only, depending on the median particle diameter (Dm). This approach is suitable for rivers carrying gravel, and therefore, the results obtained for the transport of sandy material are less reliable. The bedload transport per meter of cross-section, qs, is a function of the dimensionless parameters:
q b * = 4 . 93 ( τ * τ c * ) 1.60
where τc* = 0.047 for mixed-sized gravel [38], and qb* and τ* denote dimensionless transport and mobility parameters, respectively, and
τ * = τ γ s γ D m
q s = q b * R g D m D m
where R is the hydraulic radius and g is the gravity acceleration.
Parker and Engelund and Hansen (P and EH) [51,52]: In this case, to properly capture the results for both sandy and gravel sediments, a combination of these very well-known formulae has been adopted, as Parker is appropriate for gravel, while Engelung and Hansen is mostly suitable for sandy materials. Despite the combined approach, the total amount of sediment transport is found, with no separation between the different material size distributions. Therefore, for the sandy rivers, we applied Engelund and Hansen, while in the gravel reaches, we employed Parker. This methodology is difficult to apply when both materials are mixed.
Parker’s methodology for D50 > 2 mm neglects armouring, which means that all soil fractions are equally mobilized. The employed equation in this case is as follows:
q s = 0.00218 · u * 3 · G · ρ g ( ρ s ρ )
where G is a function of the shear stress over the critical shear stress at the start of the movement, and u* is the shear velocity (u* = (τ/ρ)0.5); ρs and ρ denote densities of the particles and water, respectively.
The Engelund and Hansen equation for D50 < 2 mm is as follows:
q s = 0.05 · v 2 · ( τ * ) 3 / 2 D 50 g γ s γ 1
where D50 is the median sediment diameter (when the cumulative percentage in weight reaches 50%), v is the average velocity in the channel, and γs and γ denote the unit weights of solid particles and water, respectively.
Ackers and White (AW) [53]: this equation provides total bed solid transport discharge and does not differentiate between different particle sizes. However, this methodology has been extensively used and validated for sandy rivers, and although it is applied to gravel rivers too, fewer experiences with these materials have been reported in the literature. The bedload transport per meter of the section is given as follows:
q s = G g r · s · D m h · u * v n
where s represents the sediment specific gravity, h is the effective depth, n is an exponent (function of the particles), and Ggr denotes the transport parameter, given as follows:
G g r = C · F g r A A m
where C and m are coefficient and exponent, respectively; A is the threshold mobility, and Fgr is the sediment mobility.
Yang is used for non-uniform materials (Y) (as reported in Maza-Alvarez and García Flores [54]). This methodology is applied to both sandy and gravel rivers and those transporting mixes of both sizes. The analysis is conducted by separately predicting the transport of each particle size. This method does not represent armouring, which might cause overestimation in the solutions. The following Yang [55] equations are applied,
For sandy material (Dm < 2 mm):
log C B T i = { 5.165 0.152 · l o g ω i D i ν 0.297 · l o g u * ω i + 1.78 0.36 · l o g ω i D i ν 0.48 · l o g u * ω i l o g v · S ω i } · p i 100
If the bed material is gravel (Dm ≥ 2 mm):
log C B T i = { 6.681 0.633 · l o g ω i D i ν 4.816 · l o g u * ω i + 2.78 0.30 · l o g ω i D i ν 0.28 · l o g u * ω i l o g v · S ω i } · p i 100
The above equations are applied to every granulometric fraction to the soil per one (pi/100), as pi is the % of each size. CBTi = total gravel concentration in parts per million by unit of weight; Di is the median particle diameter (in m); ωi denotes the velocity of the sedimentation of the particles (in m/s), u* is the shear flow velocity (in m/s) and ν = kinematic viscosity of water (in m2/s).
In summary, the main parameters involved in the analysis are as follows: the bedload transport per meter of cross-section, qs; the characteristic bed sediment diameter, Dm or D50; the sediment and water densities, ρs and ρ; the effective depth, h; the width of section, w; the flow velocity, vc (ql representing the unit discharge per meter of width); and the bed slope, S.

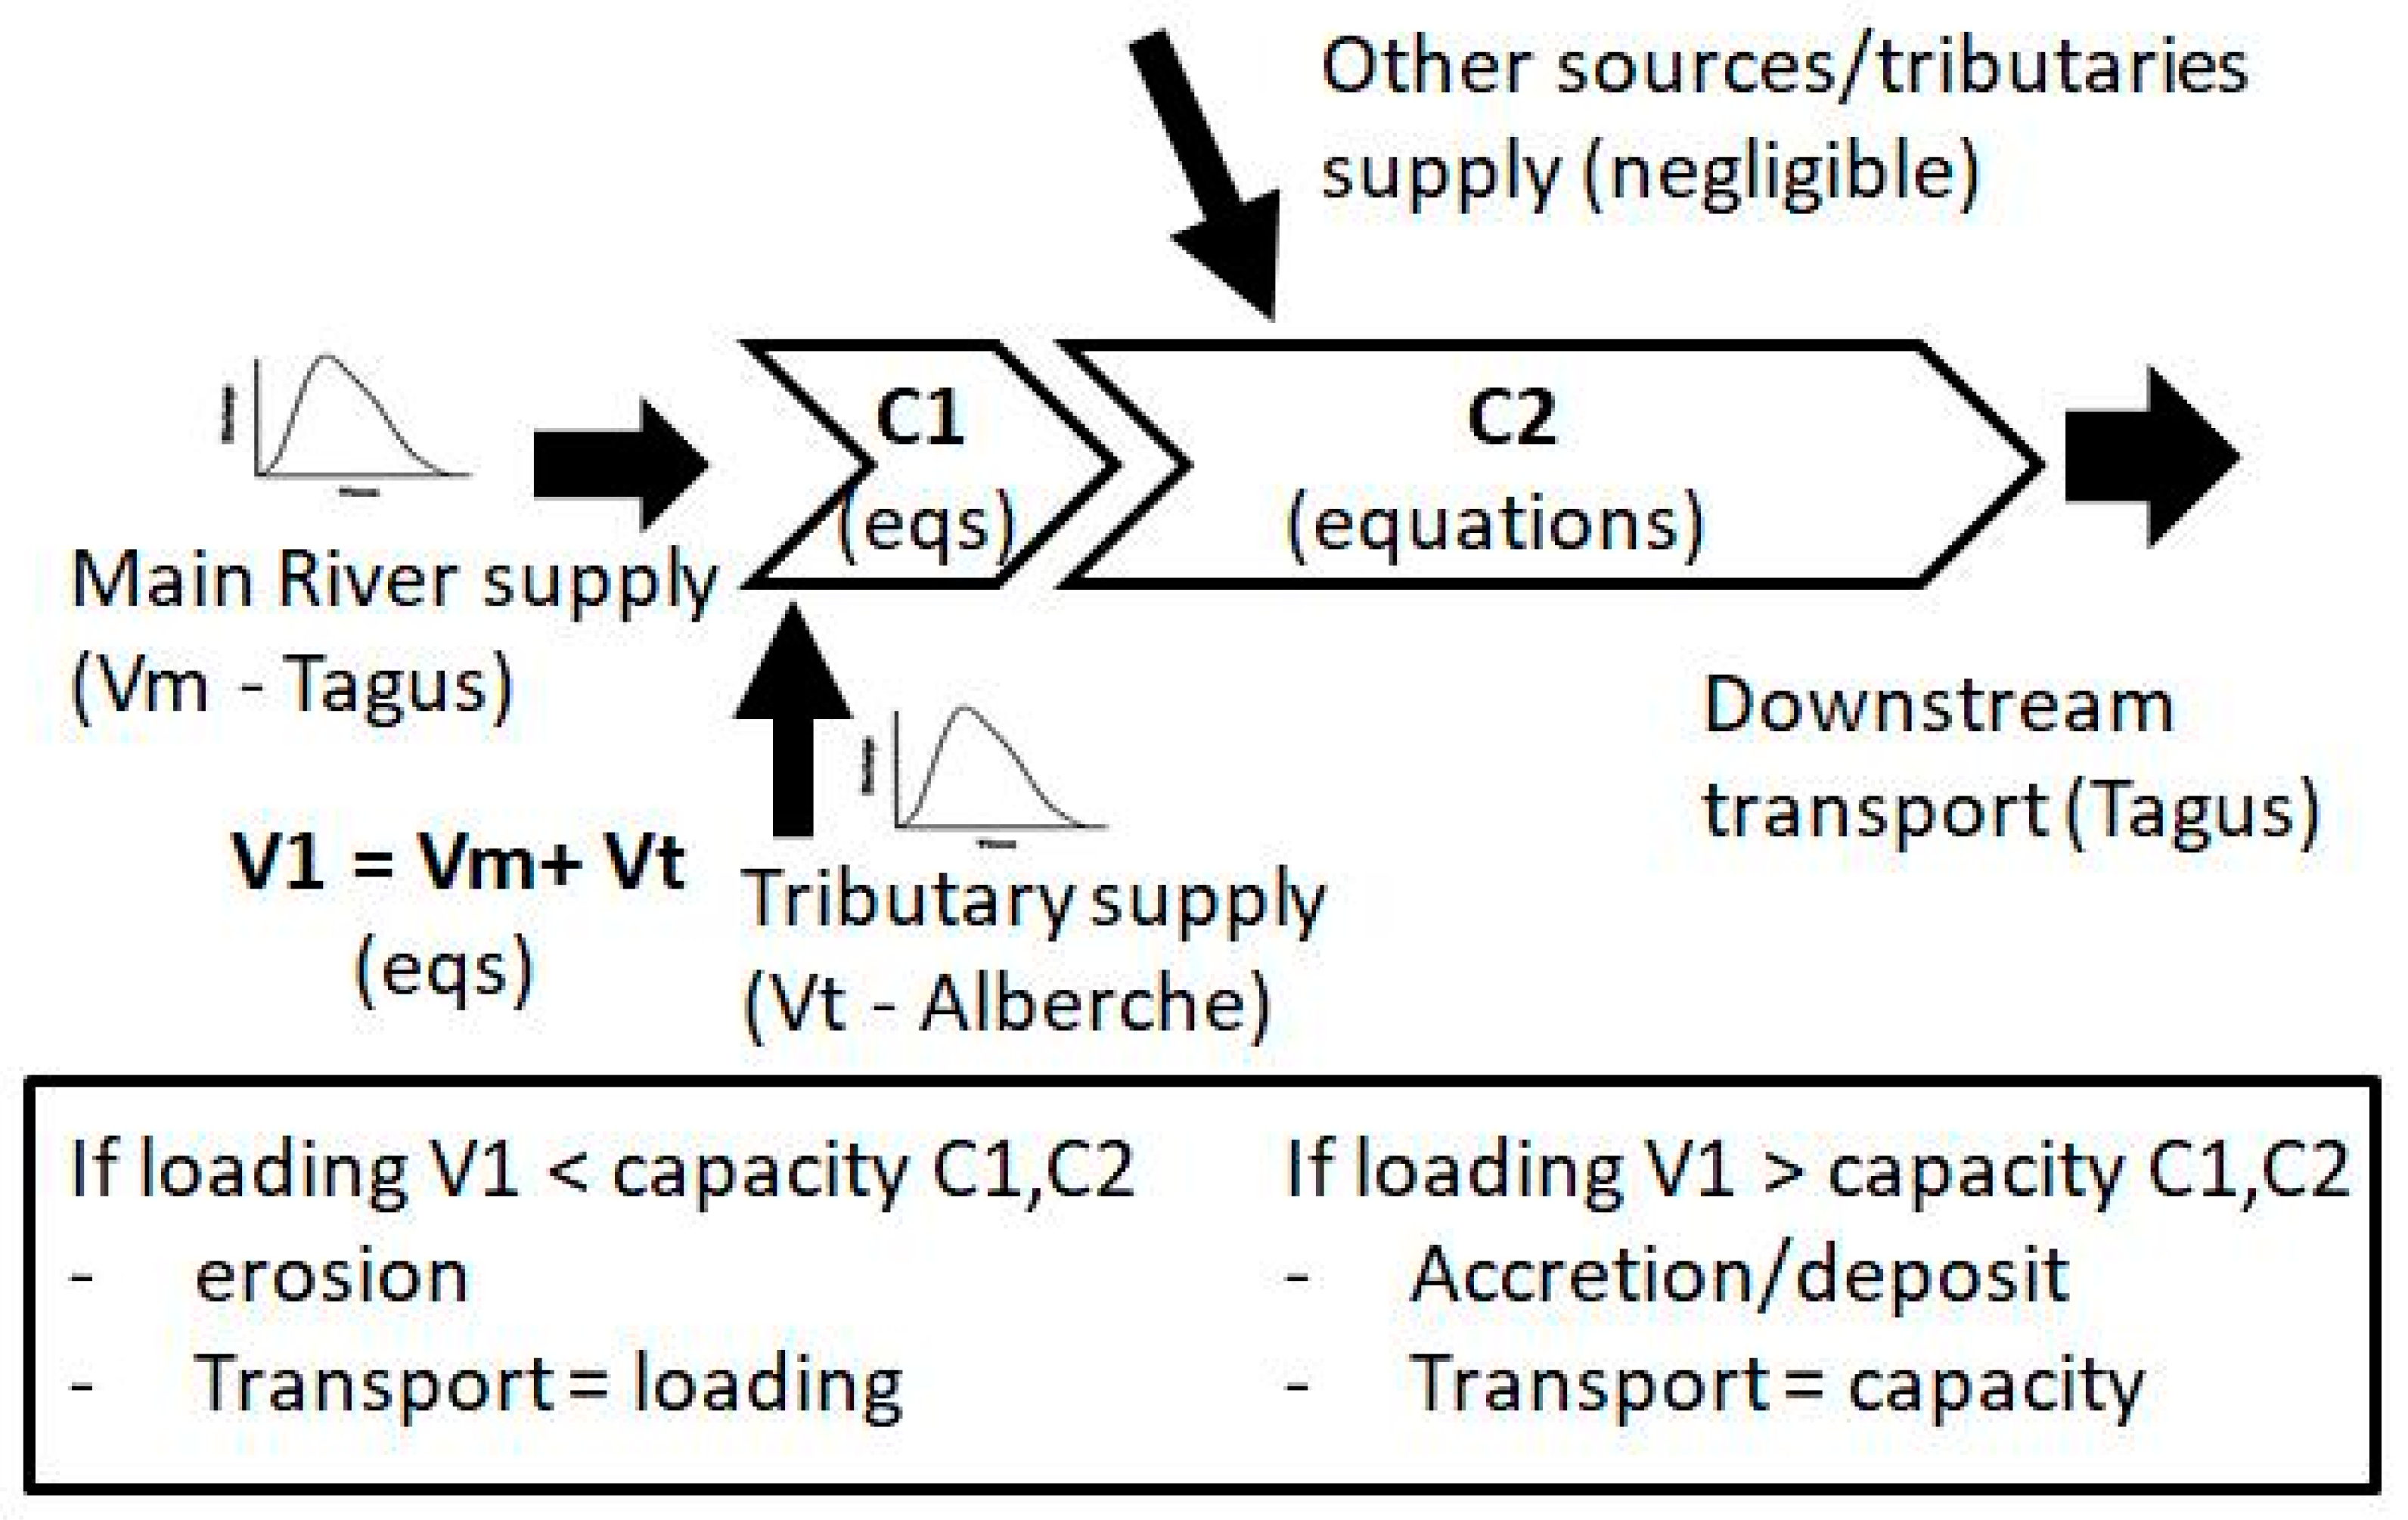
3.2. Description of the Model and Main Hypotheses

An analytical model to calculate the solid transport in the different reaches of the previously mentioned fluvial system has been developed with Matlab. The model uses the sediment budget equation with the five different sediment transport formulae to simulate five flow reaches, with the topology sketched in Figure 2. Each reach can be considered straight due to the low sinuosity downstream of the confluence, with a constant slope (taken as the average slope in each one of them) and with simplified, representative cross-sections (Figure 3) obtained from a digital terrain model. Therefore, the influence of plan sinuosity in sediment transport is not considered in this analysis. The description and main characteristics of the five reaches are given in Table 1.
The bedload sediment budget (Figure 4) is used to predict the evolution of the bed level (equilibrium/ erosion/accretion) by using the concept of sediment transport capacity (STC), which is a function of the river width, slope, discharge, the settling velocity of the bedload particles, and the hydraulic roughness of the river. Using different sediment capacity relationships, Equations (1)–(8), enables the prediction of STC in a river confluence.
The Manning roughness coefficient in the main channel was estimated with the Strickler formula [56], see Table 1:
n = D 90 1 / 6 26
where D90 denotes the size of grains (in m) for which 90% of the material is smaller in weight in a sample. In the floodplains, the adopted roughness is taken as a typical value for softly vegetated land cover [57].

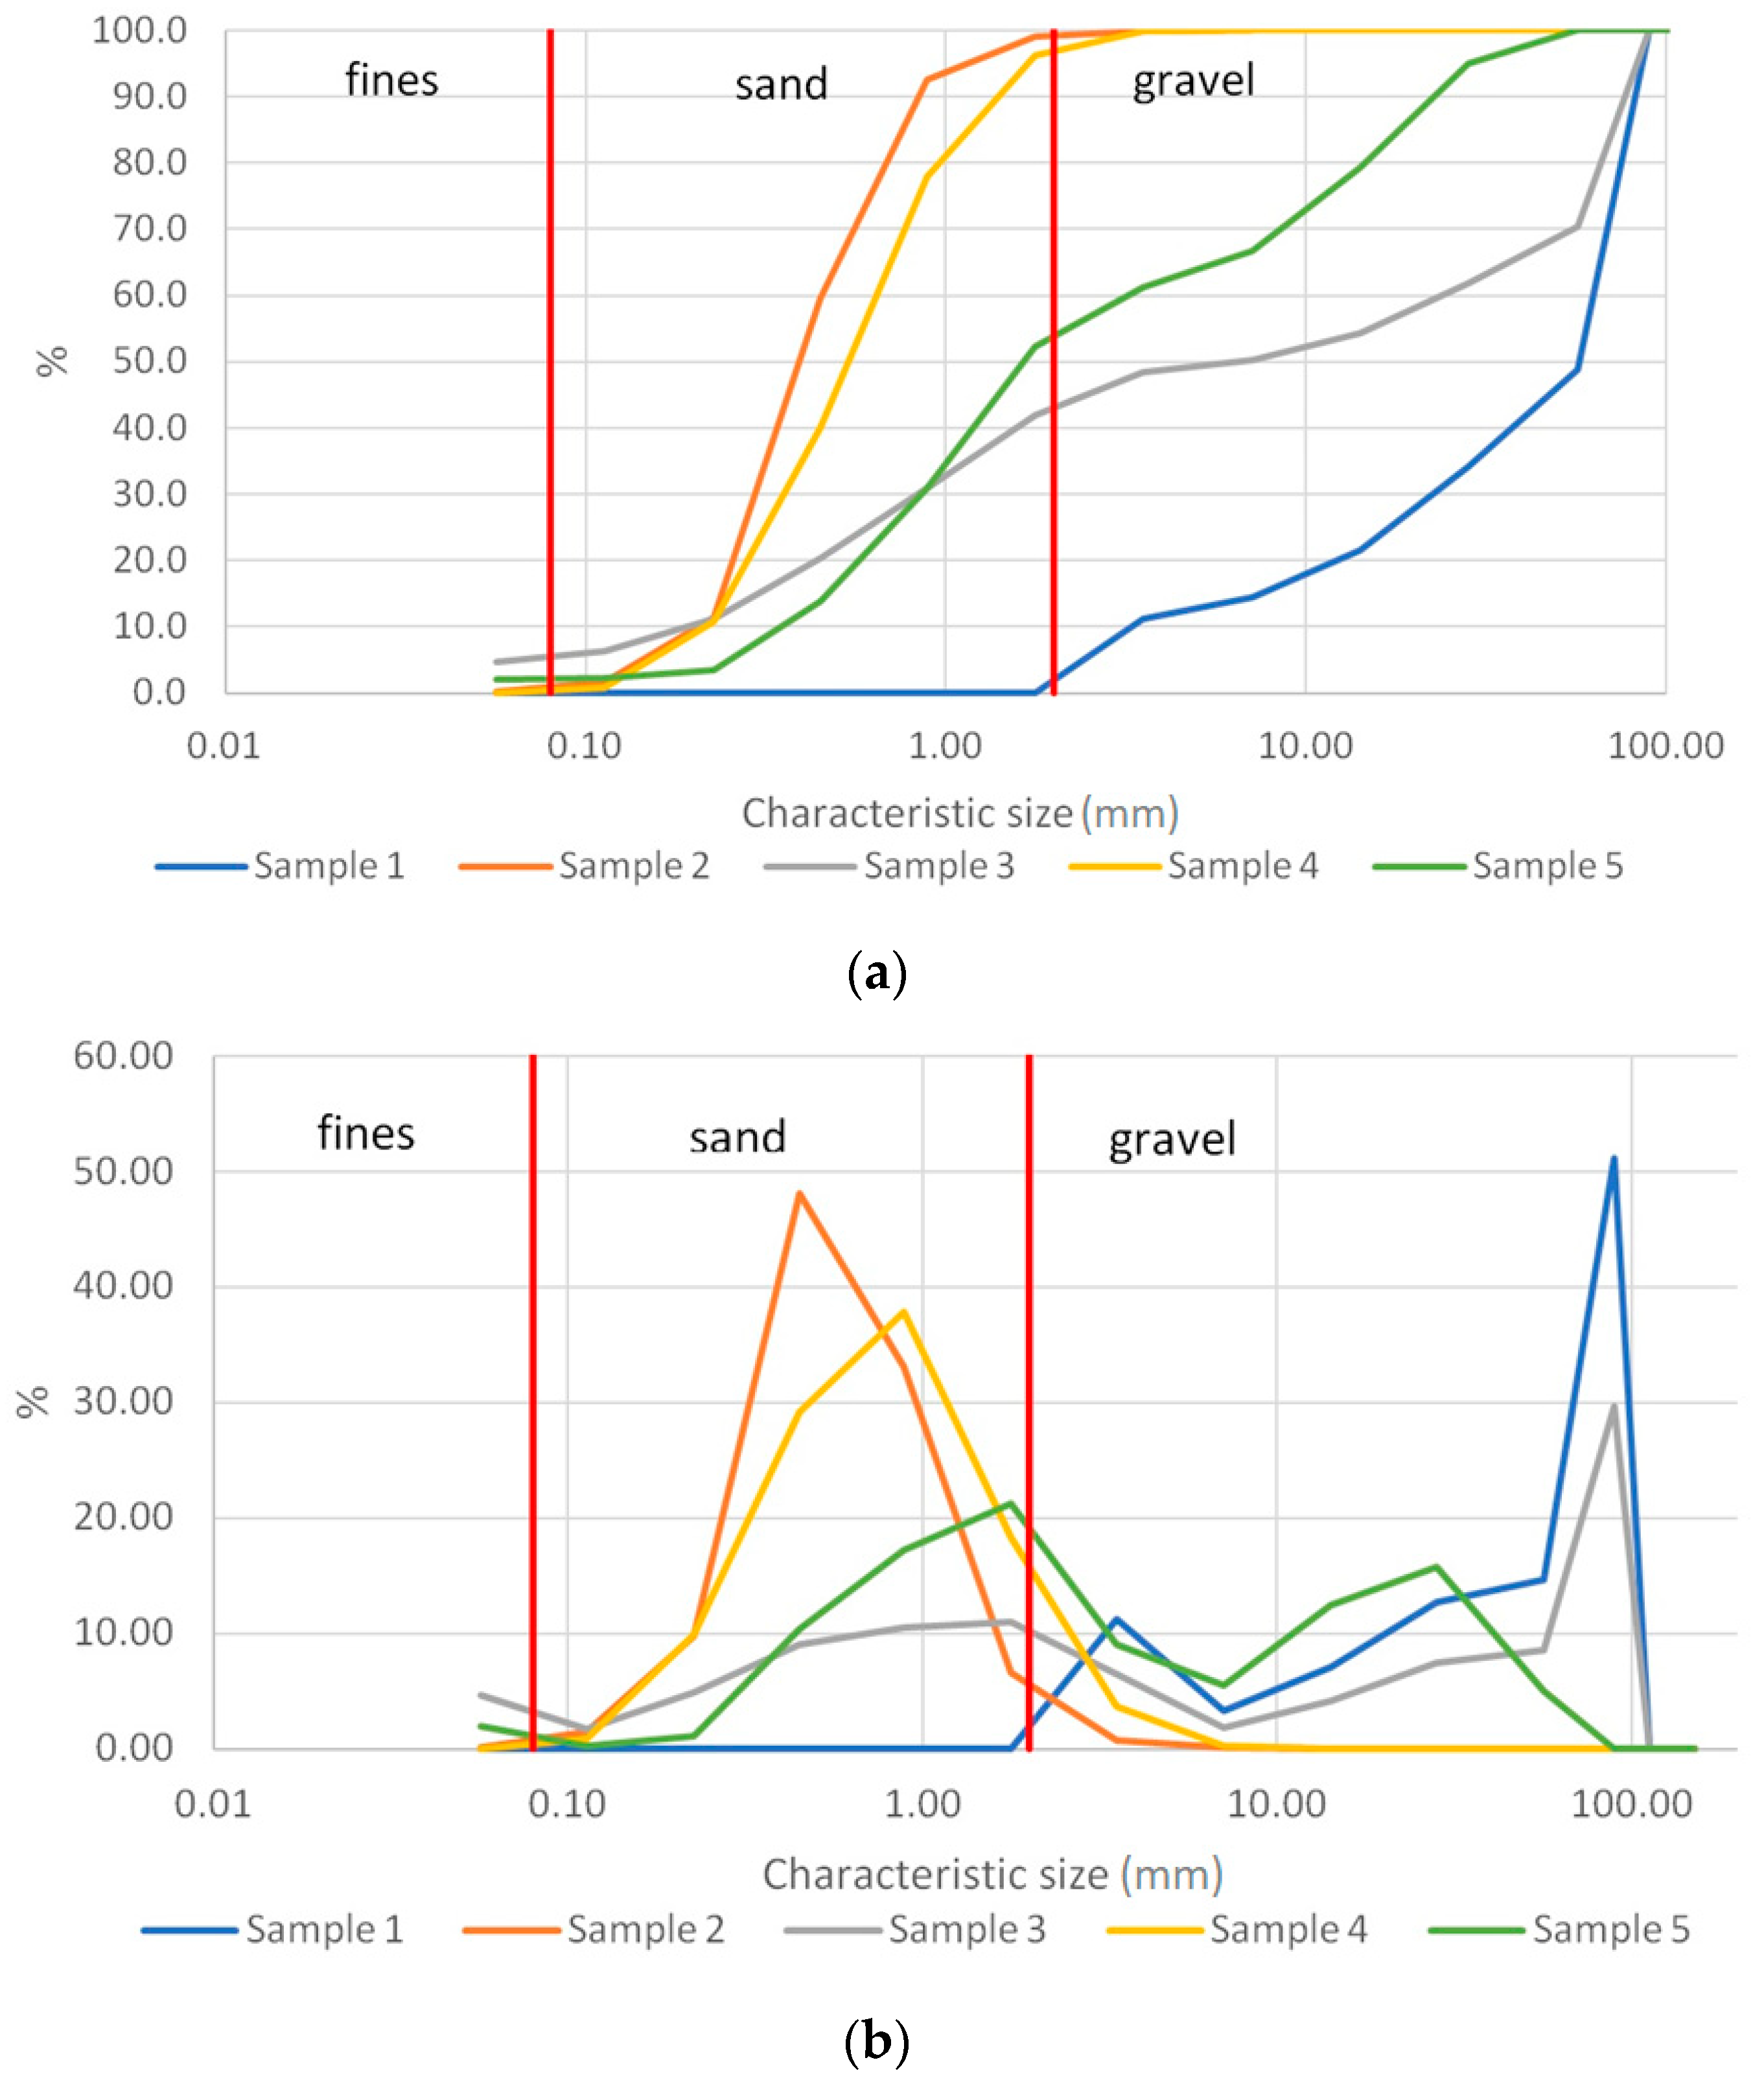
3.3. Bed Materials Data

In total, in the area of analysis, 5 sediment samples were collected at different locations of each reach (Figure 2) to determine their particle size distribution via sieving. The samples were collected in the summer period, and no flooding had been recorded within the last few years. Therefore, the samples of bed materials can be representative of the system under normal flow conditions rather than after a flooding event. Samples 1, 3 and 5, located in the floodplains (Figure 2) but very close to the main channel of the Tagus River, were visually identified as gravels and were collected using an excavator after removing the top vegetal cover. The weight of each of these samples was around 20 kg. Samples 2 and 4, identified as sands, were manually collected from large deposits located by the main channels of both Alberche and Chascoso rivers, which were almost dry by the time the samples were collected. In Figure 5, the cumulative and non-cumulative representations of these grading curves are represented.
Pictures taken on-site in the locations where samples 2, 3 and 5 were collected are presented in Figure 6. In summary, we can see that samples 2 and 4 (from Alberche and Chascoso rivers, respectively) are sands with very similar particle size distributions. The material collected in the Tagus River basin, upstream of the confluences (sample 1), is gravel with almost no sand, while sample 3, from the Tagus and between both confluences, is gravel with a significant amount of sand (nearly 45%). This material, from sample 3, was assumed to be in the bed of reach 5 (R5), as the Chascoso flow is very small, and the deposits around it seem to be not that significant. As samples 3 and 5 were taken from different banks and their size distributions are fairly similar, we can confirm that the effect of the sinuosity in the sediment deposition is very small, as was assumed. The calculation of the grading curve of the bedload transported in reach 5 will be compared to sample 5, which is at the downstream location of the whole area of analysis in the Palomarejos weir, which contains sediments carried by the river. These comparisons were conducted to verify to what extent the predictions of the model match the characteristics of the material collected from the site.
The values of the main parameters involved in the Sediment Transport Equations are given in Table 2.

3.4. Flood Scenarios

Five different scenarios were simulated, representing distinct real flooding conditions recorded in the past. Three input hydrographs, upstream of the Tagus, the Alberche and the Chascoso, were analyzed in small time steps (dt = 1 h). For each one of the steps, in each reach, uniform flow conditions were considered to determine the average velocities and discharges in the main channel and floodplains, using the divided channel method (USACE [58]). Flow velocities were obtained for each reach from this analysis at the bed of the channel and floodplains, and the bedload transport was determined in each step and integrated throughout the whole-reach geometry. In each confluence, the total volume of sediments arriving upstream of the confluence (V1 = adding the volumes carried by Tagus River, Vm, and Alberche River, Vt), the bedload transport capacity of the materials reaching the confluence (C1) and the bedload transport capacity of the reach downstream of the confluence, with the materials on its bed (C2), were compared, and the volume of the transport downstream of the confluence was obtained (Vo) based on sediment budget balance, as shown in Figure 4. The deposition or erosion trends were concluded as a result of this volume balance (V1–Vo). This analysis was conducted for each one of the previously listed solid transport formulae in all the scenarios and the reaches downstream of both confluences (i.e., reaches 3 and 5, R3 and R5). The analyzed cases are summarised in the following:
-
Case 1: flooding in the Alberche River (5 day hydrograph, with a peak discharge of 250 m3/s) and in the Chascoso stream (8 h long hydrograph, with a peak discharge of 67 m3/s), while the Tagus River carries its constant average discharge (110 m3/s).
-
Case 2: In this case, the 1970 flooding [50] is replicated. Simplified triangular and symmetric hydrographs are employed in this case, with a peak discharge in the Tagus River (upstream of its confluence with the Alberche) of 1400 m3/s, while the Alberche carries 400 m3/s at the peak of the hydrograph. The Chascoso stream is simulated with the same hydrograph as in case 1.
-
Case 3: All rivers are assumed to carry average discharges, with 110 m3/s in the Tagus (upstream of the Alberche) and the Alberche with its minimal discharge (0.1 m3/s). The Chascoso stream is assumed to be totally dry in this case. This situation aims to represent a summer standard scenario when little to no rains are expected. This analysis is conducted for 1 month to represent steady conditions and find the global erosion/transport/deposition trends in summer.
-
Case 4: The same hydrographs as in case 3 are employed in this case, but the bed material in the Tagus River, between the Alberche and the Chascoso confluences (reach 3), is substituted by the sandy material carried by the Alberche River. This case represents the situation immediately after case 1 when the Alberche is supposed to dispose of a large amount of its bedload into the Tagus River.
-
Case 5: The 1970 flooding is again represented, as in Case 2, but this time, it follows the flooding simulated in Case 1, and therefore, the bed materials in the Tagus are assumed to be the same as those carried by the Alberche (like in Case 4).
The discharges and duration of the hydrographs employed replicate those observed in similar flooding events as those represented in the previous cases.

4. Results and Analysis

In this section, the total available volume of sediment arriving at each confluence from the upstream reaches (V1 = Vmain + Vtributary), the total transport capacity of the material arriving at the confluence in the downstream reach (C1) and the total transport capacity in the downstream reach of the material in the bed of that reach (C2), obtained with all methods, are presented and discussed for each methodology and each flooding scenario. The balance between those amounts in each confluence results in the amount of sediment transport after the confluence (S). The main trends in each case (i.e., erosion or sedimentation) are concluded and discussed.

4.1. Case 1: Flooding in Alberche and Chascoso, While the Tagus River Carries Its Average Discharge

The results obtained in this case are summarised in Table 3. All methodologies agree with the prediction that there is no available volume in terms of sediments coming from the Tagus upstream of its confluence with the Alberche, and they predict very similar volumes in reach 3. Greater differences between all methods are observed in the upstream volume coming from the Alberche River (V1), which ranges from 172,393 m3 (with MPM) to 2,500,000 m3, with P + EH. As these materials are sands, MPM is less indicative than P + EH. However, as both values are very extreme, they are not considered in the current analysis. Conclusions concerning the trends coincide with all methods, predicting the deposition downstream of the Alberche confluence (reach 3) and from very little erosion to very little deposition in reach 5.
As the sediments are a mixture of sands and gravels, the results obtained with Yang’s formulation can be taken as the most representative of all the methods and it can be assumed that the deposition found in the reach would occur both in reach 3 and in reach 5, as there is a continuous transition between these reaches, and the Chascoso does not have a significant influence on the geomorphology of the area. As the Tagus is not flooded, all the sedimentation would take place in the main channel. Using the geometry of the cross-sections for reaches 3 and 5 in Figure 3 and the lengths of these reaches reported in Table 1, it can be concluded that the deposition area could be approximately 1500 × 211.5 + 2000 × 180 = 677,250 m2. Therefore, the total deposition in reach 3–5 could be 920,976 m3 during periods that the Alberche flooded. This leads to an average increase in the bed level by about 1.35 m in both reaches 3 and 5. This amount would be eroded when the discharge in the Tagus increases.

4.2. Case 2: 1970 Flooding

The results obtained in this case are summarised in Table 4. The highest disparity between the four methods (as described earlier in this paper, method 2 combines Parker and Englelund and Hansen equations) again lies in the estimation of the volume of sediments in the Alberche, ranging from a bit more than 84,000 m3 with MPM to 2.9 M m3 with P + EH. The qualitative conclusions are coincident, yielding predictions of the deposition of sediments after both confluences. Again, and assuming that Yang’s method is the most representative, we found that sediment transport mainly occurs due to the sand transport from the Alberche, and 712,119 m3 of these sands are deposited in reach 3 after flooding, while 5365 m3 would go to reach 5. The Tagus River is flooded during this whole scenario, which means that these deposits will take place in both the main channel and floodplains—the total width of the cross-sections of reaches 3 and 5 are taken in this case to determine the area of deposition. As in the previous case, we assume that the deposition occurs throughout the whole Tagus River (reaches 3 and 5). Thus, by dividing the total deposits over the total area, we conclude that, on average, the whole elevation of the area would increase by about 0.14 m (much lower than in Case 1 because the area of deposition includes the floodplains).
Moreover, this is a very typical flooding scenario in the Tagus River in Talavera. The gravel materials tend to be deposited in the main channel, while the sandy sediments are deposited in the channel and floodplains. It can also be concluded that flooding like this has a negligible erosion capacity in the analyzed reaches of the river.

4.3. Case 3: Average Discharges in Summer

The main results from this analysis are listed in Table 5. The Alberche River, in this case, carries a very small amount of sediments according to all of the methods used, which are in very good agreement. While the first two methods provide neither deposition nor erosion after both confluences, AW and Y predict some erosion in the main channel of reaches 3 (1118 m3) and 5 (125 m3). In reach 3, the river would erode the finest particles of the bed soil, no greater than 7 mm, while in reach 5, the peak size of the mobilized soil is 14 mm.

4.4. Case 4: Average Discharges in Summer following Floodings of the Alberche and Chascoso Rivers (Case 1)

The results obtained for this case are presented in Table 6, and they are very consistent for all methods, except for MPM, which predicts much higher erosion than the others. This case replicated one month of summer conditions after the high deposits calculated in Case 1, with sandy material from the Alberche in the main channel of the Tagus River. If, once again, we take the results obtained using Yang’s equation as representative, with an erosion rate of 22,944 m3 per month, we can conclude that, to remove the total sandy soil deposited by a typical flooding in the Alberche River, about 40 months of average annual flow in Tagus River would be needed.

4.5. Case 5: The 1970 Flooding Event (Case 2) following the Flooding in Alberche and Chascoso Rivers (Case 1)

Table 7 presents the results obtained in this case. It is worth noting that the conclusions are very similar to Case 2, i.e., a high amount of sandy material deposited in the main channel of Tagus River, because most of the transported sediments have their origin in the Alberche River, and therefore, the nature of the materials in the Tagus river bed is not relevant as they are not transported during this scenario. The main results from this analysis are listed in Table 4. The Alberche River, in this case, carries a very small amount of sediments according to all methods, which are in very good agreement. While the first two methods give neither deposition nor erosion after both confluences, AW and Y predict some erosion in the main channel of reaches 3 and 5. In reach 3, the river would erode the finest particles of the bed soil (no greater than 7 mm), while in reach 5, the peak size of the mobilized soil is 14 mm.

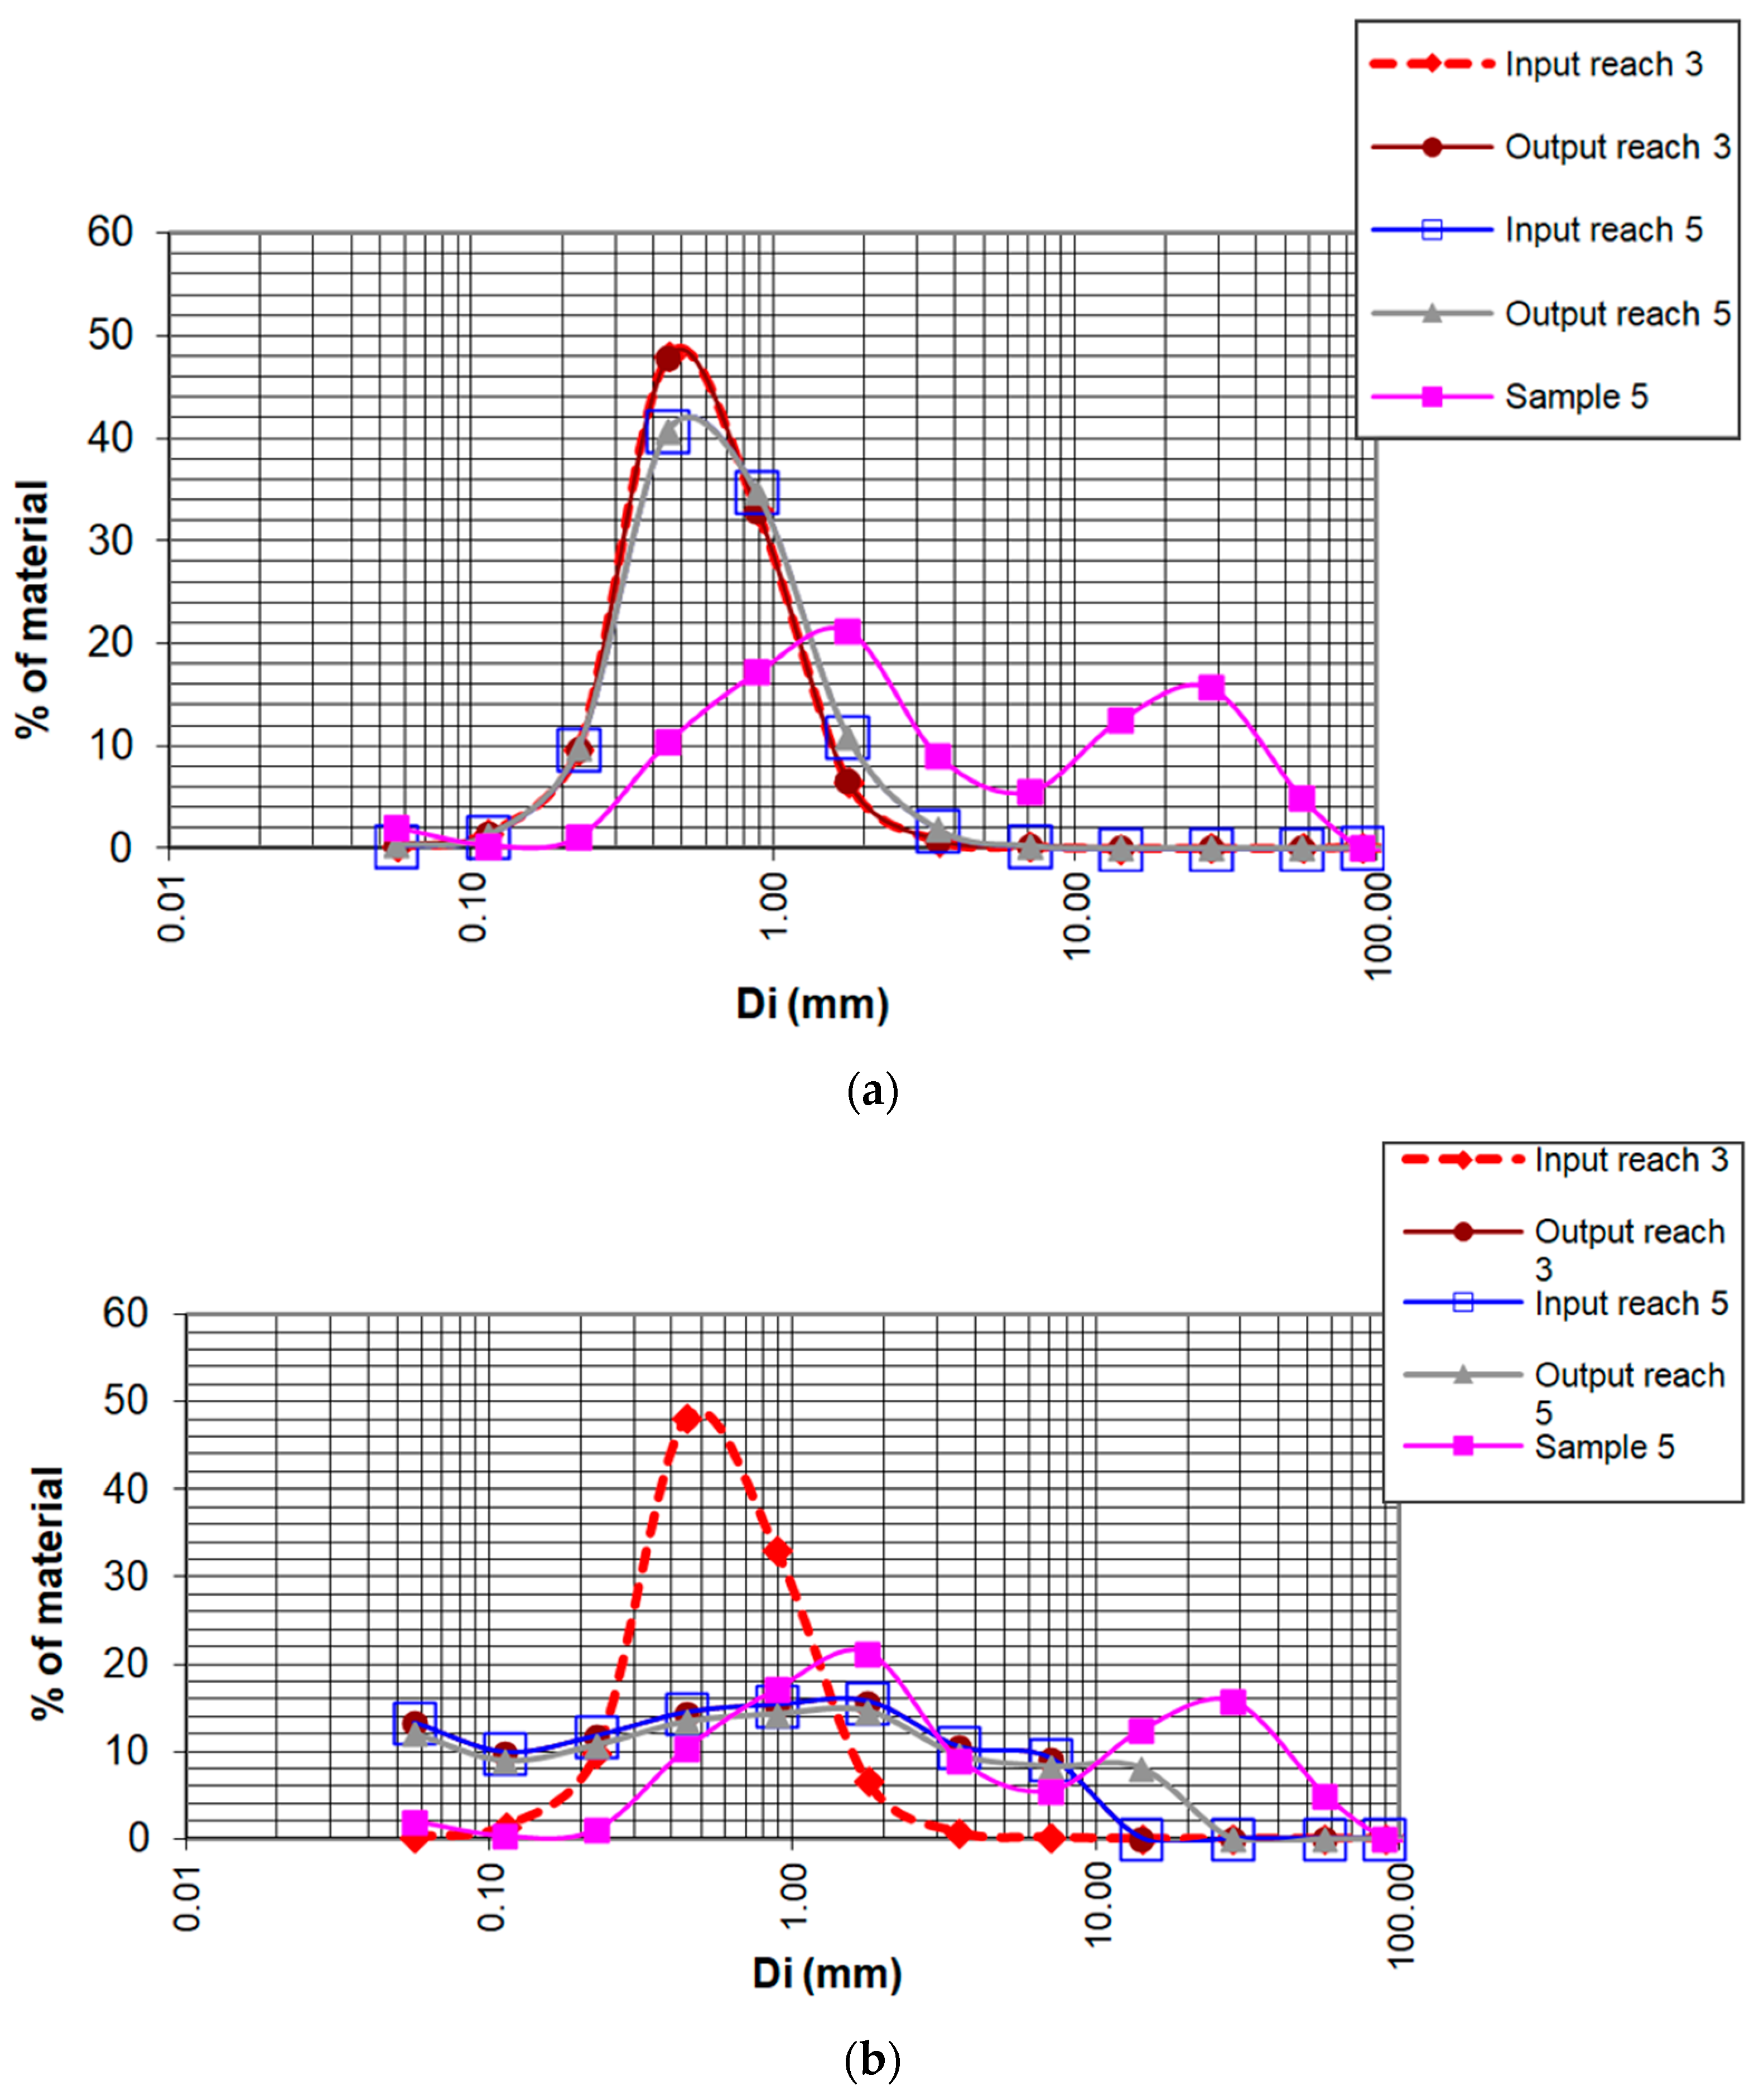
4.6. Analysis of the Evolution of the Grain Size Distribution of the Bedload Transport under Different Scenarios

Out of all methods employed in this research, MPM underestimates the sediment transport, and P + EH clearly overestimates it. Yang’s equation yields overall average results when compared to the four methods, and it is the only method suitable for the prediction of the transport of particles with different sizes. Therefore, this methodology is the one employed in this section.
The evolution of the grain size of the materials transported by the Tagus River in reaches 3 and 5 were analyzed and compared with the sample collected downstream of the whole area of analysis. The non-cumulative particle size distribution for the materials arriving at reach 3 (input reach 3), leaving the same reach (output reach 3), arriving at reach 5 (input reach 5) and leaving reach 5 (output reach 5) are presented in Figure 7, for cases 2 (1970 flooding) and 3 (normal summer conditions). The particle size distribution of sample 5 is also represented in both figures for comparison purposes.
For the 1970 flooding scenario (Figure 7a), we can conclude that the material arriving into reach 3 is sandy soil with no gravel (proceeding from the Alberche River). This identical material is transported throughout the river with no significant change all the way to the downstream location of reach 5 (output reach 5), with a slight change in the grading curve, getting slightly wider (which means that this material contains a higher range of particles), and smaller proportion of the materials of around 0.4 mm, compared with the input (40% versus the original value of 48%). It is also worth noting that there were no fine materials transported during this event. The comparison with sample 5 highlights that these materials are different, and confirms that the soil deposited in reach 5 was not the result of the deposition of the soil transported during a flood event like this.
In Figure 7b, we can see a completely different situation. Under normal summer conditions, the material arriving at reach 3 is sand coming from the Alberche River in very small amounts. Then, erosion takes place in this reach, and the particle size distribution of the transported material (output 3) is completely different from the input, as the river, in this reach, can transport finer and coarser soils (up to around 7 mm), which are extracted from the bed of the main channel. When this material arrives at reach 5, there is further erosion of coarser materials, up to around 14 mm. The output curve of reach 5 is different from sample 5 but is significantly more similar to the previous case (Case 2). The curve of sample 5, however, reflects coarser materials and not fine materials. These differences could be attributed to the armouring of the main channel after many months of low-discharge scenarios, much longer than the 1 month simulated in this case. After some small flood events, the fine sediment was removed when the sample was taken. As previously mentioned, Yang’s method does not consider armouring. However, although both curves show some differences, particularly in terms of coarser sizes, the trends are very similar, representing the mixture of sandy and coarse material in both cases. This demonstrates that this model can reproduce the trends of bedload mechanics.

5. Conclusions

In this paper, field samples of bed deposits in the Tagus–Alberche river confluence in Talavera de la Reina (Spain) were tested and compared with five bed load formulae available in the literature for bed load transport. Of them, Meyer-Peter and Müller, Parker + Engelund Hansen, Akers and White, and Yang were tested to analyze the effect of the confluence on sediment deposits downstream of the confluence. The main conclusions from this analysis are listed as follows:
  • Yang’s method for non-uniform particles was concluded to be the most suitable procedure for analyzing the confluences of rivers that carry different types of soils. Using this method, the prediction of the resultant bedload transport at the downstream location of this river system, compared with the material collected at the same location, follows a similar trend, although it displays some differences. This can be attributed to, firstly, the fact that the simulation was conducted for only 1 month under summer conditions, and secondly, because this model cannot consider armouring, and therefore, might yield overestimated results in terms of the transport of the finest fractions of the material.
  • In a typical flooding event in the Alberche and Chascoso rivers, while the Tagus River is under normal flow conditions, the material deposited in the Tagus River is sand, a predicted overall increase in the bottom of the main channel of around 1.35 m is obtained, resulting in a very significant loss in terms of the hydraulic capacity of the cross-section. This situation occurs due to the lack of bedload capacity in the Tagus River.
  • In the case of typical flooding in the whole fluvial system, like the one reported back in 1970, the amount of sandy sediment transported by the Alberche River is similar to the previous case, but the Tagus River can carry a greater proportion, with the result of an overall increase in the elevation in the river bed of around 0.14 m.
  • In both previous cases, even if the Chascoso River suffered flooding, its effect on the overall performance of the analyzed river system in terms of bedload transport was found to be negligible.
In summary, the developed methodology is suitable for predicting the geomorphology of confluences of gravel-bed rivers with sandy tributaries. These results help to understand the effect of different flow regimes between main river and tributaries into flow sediment transport capacity downstream of a confluence.

Author Contributions

Conceptualization, J.P.M.-V.; methodology, J.P.M.-V. and S.L.-Q.; validation, S.L.-Q., P.M.-M. and J.P.M.-V.; formal analysis, S.L.-Q.; investigation, P.M.-M.; resources, J.P.M.-V.; data curation, P.M.-M. and S.L.-Q.; writing—original draft preparation, P.M.-M.; writing—review and editing, P.M.-M.; visualization, P.M.-M.; supervision, J.P.M.-V.; project administration, J.P.M.-V. All authors have read and agreed to the published version of the manuscript.

Funding

This research received no external funding.

Data Availability Statement

Data sharing is not applicable to this article.

Acknowledgments

The authors would like to thank Fabio Spaliviero and Gonzalo Simarro-Grande for their contribution in developing the analytical software.

Conflicts of Interest

The authors declare no conflict of interest.

References

  1. Lane, S.N.; Bradbrook, K.F.; Richards, K.S.; Biron, P.M.; Roy, A.G. Secondary circulation cells in river channel confluences: Measurement artefacts or coherent flow structures? Hydrol. Process. 2000, 14, 2047–2071. [Google Scholar] [CrossRef]
  2. James, A. Time and the persistence of alluvium: River engineering, fluvial geomorphology, and mining sediment in California. Geomorphology 1999, 31, 265–290. [Google Scholar] [CrossRef]
  3. Benito, G.; Díez-Herrero, A.; Fernández de Villalta, M. Magnitude and Frequency of Flooding in the Tagus Basin (Central Spain) over the Last Millennium. Clim. Chang. 2003, 58, 171–192. [Google Scholar] [CrossRef]
  4. Martín-Vide, J.P.; Martín-Moreta, P.J.; López-Querol, S.; Machado, M.J.; Benito, G. Tagus river: Historical floods at Talavera de la Reina. In Palaeofloods, Historical Floods and Climatic Variability: Applications in Flood Risk Assessment, Proceedings of the PHEFRA Workshop, Barcelona, Spain, 16–19 October 2002; CSIC—Centro de Ciencias Medioambientales: Madrid, Spain, 2003; pp. 191–196. [Google Scholar]
  5. Roy, N.; Sinha, R. Understanding confluence dynamics in the alluvial Ganga–Ramganga valley, India: An integrated approach using geomorphology and hydrology. Geomorphology 2007, 92, 182–197. [Google Scholar] [CrossRef]
  6. Mosley, M.P. An experimental study of channel confluences. J. Geol. 1976, 84, 535–562. [Google Scholar] [CrossRef]
  7. Best, J.L.; Reid, I. Separation zone at open-channel junctions. J. Hydraul. Eng. 1984, 110, 1588–1594. [Google Scholar] [CrossRef]
  8. Best, J.L. Sediment transport and bed morphology at river channel confluences. Geomorphology 1988, 35, 481–498. [Google Scholar] [CrossRef]
  9. De Serres, B.; Roy, A.G.; Biron, P.; Best, J.L. Three-dimensional flow structure at a river channel confluence with discordant beds. Geomorphology 1999, 26, 313–335. [Google Scholar] [CrossRef]
  10. Weber, L.J.; Schumate, E.D.; Mawer, N. Experiment on flow at a 90° open-channel junction. J. Hydraul. Eng. 2001, 127, 340–350. [Google Scholar] [CrossRef]
  11. Constantinescu, G.; Miyawaki, S.; Rhoads, B.; Sukhodolov, A. Numerical analysis of the effect of momentum ratio on the dynamics and sediment-entrainment capacity of coherent flow structures at a stream confluence. J. Geophys. Res. 2012, 117, 1–21. [Google Scholar] [CrossRef]
  12. Roca, M.; Martín-Vide, J.P.; Moreta, P.J.M. Modelling a torrential event in a river confluence. J. Hydrol. 2008, 364, 207–215. [Google Scholar] [CrossRef]
  13. Parsons, D.R.; Best, J.L.; Lane, S.N.; Orfeo, O.; Hardy, R.J.; Kostaschuk, R.A. Form roughness and the absence of secondary flow in a large confluence–diffluence, RioParaná, Argentina. Earth Surf. Process. Landf. 2007, 32, 155–162. [Google Scholar] [CrossRef]
  14. Roy, A.G.; Bergeron, N. Flow and particle paths at a natural river confluence with coarse bed material. Geomorphology 1990, 3, 99–112. [Google Scholar] [CrossRef]
  15. Rhoads, B.L. Mean structure of transport-effective flows at an asymmetrical confluence when the main stream is dominant. In Coherent Flow Structures in Open Channels; Ashworth, P., Bennett, S.J., Best, J.L., McLelland, S., Eds.; John Wiley &Sons Ltd.: Chichester, UK, 1996; pp. 491–517. [Google Scholar]
  16. Best, J.L.; Rhoads, B.L. Sediment transport, bed morphology and the sedimentology of river channel confluences. In River Confluences, Tributaries and the Fluvial Network; Rice, S.P., Roy, A.G., Rhoads, B.L., Eds.; John Wiley and Sons Ltd.: Chichester, UK, 2008. [Google Scholar]
  17. Martín-Vide, J.P.; Plana-Casado, A.; Sambola, A.; Capapé, S. Bedload transport in a river confluence. Geomorphology 2015, 250, 15–28. [Google Scholar] [CrossRef]
  18. Miller, J.P. High mountain streams: Effects of geology on channel characteristics and bed material. New Mex. Bur. Mines Miner. Resour. 1958, 4, 53. [Google Scholar]
  19. Hubbell, D.W. Bedload sampling and analysis. In Sediment Transport in Gravel-Bed Rivers; Thorne, C.R., Bathurst, J.C., Hey, R.D., Eds.; John Wiley & Sons: New York, NY, USA, 1987. [Google Scholar]
  20. Brown, C.B. Sediment transportation. Eng. Hydraul. 1950, 12, 769–857. [Google Scholar]
  21. Wong, M.; Parker, G. Reanalysis and correction of bed-load relation of Meyer-Peter and Müller using their own database. J. Hydraul. Eng. 2006, 132, 1159–1168. [Google Scholar] [CrossRef]
  22. Gomez, B.; Church, M. An assessment of bedload sediment transport formulae for gravel bed rivers. Water Resour. Res. 1989, 25, 1161–1186. [Google Scholar] [CrossRef]
  23. White, W.R.; Milli, W.R.; Crabbe, A.D. Sediment transport theories: A review. Proc. Inst. Civ. Eng. 1975, 59, 265–292. [Google Scholar]
  24. Batalla, R.J. Evaluating bed-material transport equations using field measurements in a sandy gravel-bed stream, Arbúcies River, NE Spain. Earth Surf. Process. Landf. 1997, 22, 121–130. [Google Scholar] [CrossRef]
  25. Barry, J.J.; Buffington, J.M.; Goodwin, P.G.; King, J.G.; Emmett, W.W. Performance of bed-load transport equations relative to geomorphic significance: Predicting effective discharge and its transport rate. J. Hydraul. Eng. 2008, 134, 601–615. [Google Scholar] [CrossRef]
  26. López, R.; Vericat, D.; Batalla, R.J. Evaluation of bed load transport formulae in a large regulated gravel bed river. J. Hydrol. 2014, 510, 164–181. [Google Scholar] [CrossRef]
  27. Walling, D.E. Suspended sediment yields in a changing environment. In Changing River Channels; Gurnell, A., Petts, G., Eds.; Wiley: Chichester, UK, 1995; pp. 149–176. [Google Scholar]
  28. Wasson, R.J.; Mazari, R.K.; Starr, B.; Clifton, G. The recent history of erosion and sedimentation on the Southern Tablelands of southeastern Australia. Geomorphology 1998, 24, 291–308. [Google Scholar] [CrossRef]
  29. Wilkinson, S.N.; Olley, J.M.; Prosser, I.P.; Read, A.M. Targeting erosion control in large river systems using spatially distributed sediment budgets. In Geomorphological Processes and Human Impacts in River Basins; International Association of Hydrological Sciences Publication No. 299; IAHS Press: Wallingford, UK, 2005; pp. 56–64. [Google Scholar]
  30. Dietrich, W.B.; Dunne, T. Sediment budget for a small catchment in mountainous terrain. Z. Geomorphol. Suppl. 1978, 29, 191–206. [Google Scholar]
  31. Slaymaker, O. The sediment budget as conceptual framework and management tool. Hydrobiologia 2003, 494, 71–82. [Google Scholar] [CrossRef]
  32. Kondolf, G.M. Hungry Water: Effects of Dams and Gravel Mining on River Channels. Environ. Manag. 1997, 21, 533–551. [Google Scholar] [CrossRef] [PubMed]
  33. Vericat, D.; Batalla, R.J. Sediment transport in a large impounded river: The lower Ebro, NE Iberian Peninsula. Geomorphology 2006, 79, 72–92. [Google Scholar] [CrossRef]
  34. Gilbert, G.K. Report on the Geology of the Henry Mountains; Department of the Interior, U.S. Geographical and Geological Survey of The Rocky Mountain Region: Washington, DC, USA, 1877. [Google Scholar]
  35. Gilbert, G.K. The Transportation of Debris by Running Water; Professional Paper; U.S. Geological Survey: Washington, DC, USA, 1914; Volume 86, p. 263. [Google Scholar]
  36. Einstein, H.A. The Bed-Load Function for Sediment Transportation in Open Channel Flows; Technical Bulletin 1026; U.S. Department of Agriculture, Soil Conservation Service: Washington, DC, USA, 1950. [Google Scholar]
  37. Strahler, A.N. Dynamic basis of geomorphology. Geol. Soc. Am. Bull. 1952, 63, 923–938. [Google Scholar] [CrossRef]
  38. Wilcock, P.R. Two-fraction model of initial sediment motion in gravel-bed rivers. Science 1998, 280, 410–412. [Google Scholar] [CrossRef]
  39. Cooper, J.R.; Tait, S.J. Examining the physical components of boundary shear stress for water-worked gravel deposits. Earth Surf. Process. Landf. 2010, 35, 1240–1246. [Google Scholar] [CrossRef]
  40. Pu, J.H.; Wei, J.; Huang, Y. Velocity Distribution and 3D Turbulence Characteristic Analysis for Flow over Water-Worked Rough Bed. Water 2017, 9, 668. [Google Scholar] [CrossRef]
  41. Pu, J.H. Velocity Profile and Turbulence Structure Measurement Corrections for Sediment Transport-Induced Water-Worked Bed. Fluids 2021, 6, 86. [Google Scholar] [CrossRef]
  42. Reid, L.M.; Dunne, T. Rapid Evaluation of Sediment Budgets; Catena Verlag: Reiskirchen, Germany, 1996. [Google Scholar]
  43. Lisle, T.E. The evolution of sediment waves influenced by varying transport capacity in heterogeneous rivers. In Gravel-Bed Rivers VI: From Process Understanding to River Restoration; Habersack, H., Piégay, H., Rinaldi, M., Eds.; Elsevier: Amsterdam, The Netherlands, 2008; pp. 443–469. [Google Scholar]
  44. Graf, W.H. Hydraulics of Sediment Transport; McGraw-Hill Book Company: New York, NY, USA, 1971. [Google Scholar]
  45. Hicks, D.M.; Gomez, B. Sediment Transport, in Tools in Fluvial Geomorphology; Kondolf, G.M., Piégay, H., Eds.; John Wiley: Chichester, UK, 2003; pp. 425–462. [Google Scholar]
  46. Mueller, E.R.; Pitlick, J. Morphologically based model of bed load transport capacity in a headwater stream. J. Geophys. Res. 2005, 110, F02016. [Google Scholar] [CrossRef]
  47. Einstein, H.A. Formulas for the transportation of bed load. Am. Soc. Civ. Eng. Trans. 1942, 107, 561–577. [Google Scholar] [CrossRef]
  48. Martin, Y. Evaluation of bed load transport formulae using field evidence from the Vedder River, British Columbia. Geomorphology 2003, 53, 75–95. [Google Scholar] [CrossRef]
  49. Barry, J.J.; Buffington, J.M.; King, J.G. A general power equation for predicting bed load transport rates in gravel bed rivers. Water Resour. Res. 2004, 40, W10401. [Google Scholar] [CrossRef]
  50. Martín Vide, J.P.; López Querol, S.; Martín Moreta, P.; Simarro Grande, G.; Benito, G. Uso de modelos uni-y bidimensionales en llanuras de inundación. Aplicación al caso del río Tajo en Talavera de la Reina. Ing. Del Agua 2003, 10, 49–58. (In Spanish) [Google Scholar] [CrossRef]
  51. Parker, G. Surface-based bedload transport relation for gravel rivers. J. Hydraul. Res. 1990, 28, 417–436. [Google Scholar] [CrossRef]
  52. Engelund, F.; Hansen, E. A Monograph on Sediment Transport in Alluvial Streams; Teknisk Forlag: Copenhagen, Denmark, 1967; 65p. [Google Scholar]
  53. Ackers, P.; White, W.R. Sediment Transport: New Approach and Analysis. J. Hydraul. Div. 1973, 99, 2041–2060. [Google Scholar] [CrossRef]
  54. Maza Alvarez, J.A.; García Flores, M. Manual de Ingeniería de Ríos; Instituto de Ingeniería UNAM: Mexico City, Mexico, 1996. (In Spanish) [Google Scholar]
  55. Yang, C.T. Unit stream power equation for gravel. J. Hydraul. Eng. 1984, 110, 1783–1797. [Google Scholar] [CrossRef]
  56. Martín Vide, J.P. Ingeniería de Rios; Edicions UPC: Barcelona, Spain, 2002. (In Spanish) [Google Scholar]
  57. Chow, V.T. Hidráulica de Canales Abiertos; McGraw-Hill: Santa Fe de Bogotá, Colombia, 1994. [Google Scholar]
  58. USACE. HEC-RAS River Analysis System, User’s Manual; versión 6.0; USACE: Davis, CA, USA, 2020. [Google Scholar]
Figure 1. Location maps of Tagus River in Talavera de la Reina (Spain).
Civileng 04 00067 g001
Figure 2. Plan view of the Tagus River system and confluences. Type of bed material and location of collected soil samples (red arrows and numbered circles). Reaches 1, 3 and 5 are Tagus River. Reach 2 is Alberche river and Reach 4 is Cardoso stream. Reach 1 ends in Reach 2 confluence. Reach 3 stars in Reach 2 confluence and ends in Reach 4 confluence. Reach 5 starts in Reach 4 confluence.
Civileng 04 00067 g002
Figure 3. Relevant idealized cross-sections of the 5 reaches (dimensions in m). The vertical scale is distorted.
Civileng 04 00067 g003
Figure 4. Conceptual diagram for the bed load sediment budget of the Tagus–Alberche River confluence. Vm, Vt and V1 are volume loads of sediment transport and C1 and C2 given by capacity equations applied in each reach with different materials.
Civileng 04 00067 g004
Figure 5. Particle size distributions of the bed materials measured in the area of analysis. (a) Cumulative; (b) non-cumulative.
Civileng 04 00067 g005
Figure 6. Bed materials analyzed in the area of analysis. (a) Alberche River (sample 2); (b) Tagus River between Alberche and Chascoso confluences (sample 3); (c) Tagus River in the Palomarejo weir (sample 5).
Civileng 04 00067 g006
Figure 7. Evolution of the particle size distribution from upstream of Reach 3 to downstream of Reach 5. (a) Case 2 (1970 flood). (b) Case 3 (normal summer conditions).
Civileng 04 00067 g007
Table 1. Description of reaches and their properties.
Reach NumberDescriptionSlope (m/m)Length (m)n Manning in the Main Channeln Manning in the FloodplainsSediment Sample (Figure 2 and Figure 5)
1Tagus River upstream of the confluence with Alberche0.0005-0.0250.051
2Alberche river0.0095-0.0150.052
3Tagus between Alberche and Chascoso confluences0.000715000.0260.053
4Chascoso river0.0050-0.0150.054
5Tagus between Chascoso and the Palomarejos weir0.0008320000.0260.055
Table 2. Main sediment and flow parameters involved in each Case (reaches as named in Figure 2).
ParametersR1
Tagus Upstream
R2
Alberche
R3
Tagus Chascoso
R4
Chascoso
R5
Tagus Downstream
Dm or D50 (mm)600.560.72
γs2.62.62.62.62.6
S (m/m)0.00050.00950.00070.0050.00083
Ql (m3/s) Case 111025036067427
  Cases 2,514004001800671867
  Cases 3,410011010101
w (m) Case 11516521118250
  Cases 2,510002001340181500
  Cases 3,4151102001180
ql (m2/s) Case 10.73.81.76.71.7
  Cases 2,51.421.36.71.2
  Cases 3,40.70.010.500.6
Table 3. Summary of results obtained for Case 1 (in m3) in reaches 3 and 5 (R3 and R5 in Figure 2).
Meyer-Peter and MüllerParker + Engelund and HansenAckers and WhiteYang
R3–Tagus AlbercheR5–Tagus ChascosoR3–Tagus AlbercheR5–Tagus ChascosoR3–Tagus AlbercheR5–Tagus ChascosoR3–Tagus AlbercheR5–Tagus Chascoso
V Tagus 029,284025,289018,170018,717
V tributary172,39310362,495,2806739571,0112427939,6944253
V1172,39330,3202,495,28032,028571,01120,597939,69422,970
C129,28434,14825,28934,03315,12617,40418,59225,678
C2000051106663632662
Vo29,28430,32025,28932,02818,17018,79918,71722,994
Deposited
(all Vol in m3)
143,10902,469,9910552,8411799920,976−24
Table 4. Summary of results obtained for Case 2 (all volumes in m3) in R3 and R5.
Meyer-Peter and MüllerParker + Engelund and HansenAckers and WhiteYang
R3–Tagus AlbercheR5–Tagus ChascosoR3–Tagus AlbercheR5–Tagus ChascosoR3–Tagus AlbercheR5–Tagus ChascosoR3–Tagus AlbercheR5–Tagus Chascoso
V Tagus032,479011,948088315137115
V tributary84,01710502,907,8096902362,3592466717,7214340
V184,01733,5292,907,80918,850362,3593349719,23411,455
C132,47924,59411,948943484968270956083
C2000066100208152
Vo32,47924,59411,948943488372971156090
Deposited
(all Vol in m3)
51,53889352,895,8619416361,4752620712,1195365
Table 5. Summary of results obtained for Case 3 (all volumes in m3) in R3 and R5.
Meyer-Peter and MüllerParker + Engelund and HansenAckers and WhiteYang
R3–Tagus AlbercheR5–Tagus ChascosoR3–Tagus AlbercheR5–Tagus ChascosoR3–Tagus AlbercheR5–Tagus ChascosoR3–Tagus AlbercheR5–Tagus Chascoso
V Tagus01140490576101197
V tributary1140490230790
V11141144949235761791197
C166,19779,01031,29144,51421,994907123,0231820
C200005761907111971321
Vo11411449495761907111971322
Deposited
(all Vol in m3)
0000−5738−3310−1118−125
Table 6. Summary of results obtained for Case 4 (all volumes in m3) in R3 and R5.
Meyer-Peter and MüllerParker + Engelund and HansenAckers and WhiteYang
R3–Tagus AlbercheR5–Tagus ChascosoR3–Tagus AlbercheR5–Tagus ChascosoR3–Tagus AlbercheR5–Tagus ChascosoR3–Tagus AlbercheR5–Tagus Chascoso
V Tagus066,197031,291021,994023,023
V tributary1140490230790
V111466,1974931,2912321,9947923,023
C166,19779,01031,29144,51421,99429,84923,02333,839
C266,197031,235021,994907123,0231321
Vo66,19766,19731,29131,29121,99427,45123,02323,317
Deposited
(all Vol in m3)
−66,0840−31,2420−21,971−5457−22,944−293
Table 7. Summary of results obtained for Case 5 (all volumes in m3) in R3 and R5.
Meyer-Peter and MüllerParker + Engelund and HansenAckers and WhiteYang
R3–Tagus AlbercheR5–Tagus ChascosoR3–Tagus AlbercheR5–Tagus ChascosoR3–Tagus AlbercheR5–Tagus ChascosoR3–Tagus AlbercheR5–Tagus Chascoso
V Tagus032,479011,948084915137191
V tributary84,01710502,907,8096902362,3592466717,7214340
V184,01733,5292,907,80918,850362,3593315719,23411,532
C132,47924,59411,948943484968970956084
C232,479011,92608491007177152
Vo32,47924,59411,948943484974471916100
Deposited
(all Vol in m3)
51,53889352,895,8619416361,5092572712,0435432
Disclaimer/Publisher’s Note: The statements, opinions and data contained in all publications are solely those of the individual author(s) and contributor(s) and not of MDPI and/or the editor(s). MDPI and/or the editor(s) disclaim responsibility for any injury to people or property resulting from any ideas, methods, instructions or products referred to in the content.

