Article

Improving the Properties of Saline Soil Using a Deep Soil Mixing Technique

by
Mohamed A. Hammad
*,
Yahia Mohamedzein
and
Mohamed Al-Aghbari
Department of Civil and Architectural Engineering, College of Engineering, Sultan Qaboos University, Al-khod, Muscat PC 123, Oman
*
Author to whom correspondence should be addressed.
CivilEng 2023, 4(4), 1052-1070; https://doi.org/10.3390/civileng4040057
Submission received: 15 May 2023 / Revised: 19 July 2023 / Accepted: 2 August 2023 / Published: 6 October 2023
(This article belongs to the Topic Advances on Structural Engineering, 2nd Volume)

Abstract

:
Saline soils belong to the category of problematic soils with high compressibility and weak shear strength when exposed to water. Water dissolves the salts in soils which are the primary cementing agents. Therefore, stabilization methods that provide sustainable cementing substances are employed in this study using deep soil mixing techniques to enhance the properties of saline soil. In this regard, a laboratory-scaled deep soil mixing procedure was developed to treat the soil in a way similar to the field methods. A binder, consisting of marble powder and cement, was employed to treat the soil. This study aimed to select the most efficient binder mix design in terms of optimum marble powder/cement ratio and optimum water/binder ratio. Unconfined compressive strength, durability, density measurements and ultrasonic velocity pulse tests were conducted on the treated soil. To determine the treatment efficacy, microstructure analysis of the treated samples was conducted. The 80C20MP and 70C30MP samples exhibit a dense soil structure with minimal voids, and their microstructure is denser than the other treated specimens. Additionally, the EDX analysis shows increased calcium percentages with up to 30% MP replacement, aligning well with the microstructure analysis and the UCS values. The results indicate that the economical and eco-friendly binder mix consisted of (70% to 80%) cement and (20% to 30%) marble powder with water/binder ratio in the range of 1.1 to 1.3. This mix contributed greatly to the improvement in soil strength and integrated columns.

1. Introduction

The process of urbanization results in a lack of suitable building areas for construction activities due to poor ground conditions. Therefore, sites that were abandoned in the past are now being reconsidered for construction. Saline soil is a well-known problematic soil. They are typically distinguished from other surficial soils by a higher salt content, higher compressibility and lower shear strength. Structures supported on saline soils might experience significant stability issues. Saline soil is widespread across the Middle East, North Africa, the United States, and Australia [1]. The critical percentage of salt that significantly alternates the performance of this soil is 5% [2]. The physical and chemical properties of the saline soils were improved via chemical treatment with lime, cement, cement kiln dust, fly ash, waste gypsum, and microsilica [3,4,5,6,7]. The studies listed above employed traditional stabilization techniques which are appropriate for shallow mixing conditions and comparatively thin and shallow saline soil deposits. For soil layers that are thicker and deeper, the deep soil mixing (DSM) technique can be utilized. The DSM method has a number of benefits, including speed, low vibration and noise levels, the ability to stabilize soil at greater depths, and the production of little spoil soil. This method was successfully used to stabilize soft soils for supporting structures and embankments, slopes stabilization, and reduction in liquefaction [8].
Very few studies had investigated the application of DSM for soil stabilization of saline soils. Jung et al. [9] presented the first and the only study which employed a wet DSM technique for saline soil in the UAE to reduce settlement and improve the bearing capacity of a shallow foundation as an alternative to traditional piling. The employed binder in DSM is typically cement; however, it may also occasionally be fly ash, geopolymers, microsilica, or glass powder [9,10,11,12,13,14]. The environmental impact of geotechnical engineering applications, such as grouting and soil stabilization using cement, is very harmful due to high CO2 emissions [15]. Approximately 2% of cement’s overall CO2 emissions are attributable to its use in soil improvement works [16]. Thus, substituting another material for 10% of cement in geotechnical engineering applications results in a 6.1 Mt CO2 reduction [17]. Therefore, the use of waste materials in ground improvement is an area of study that is developing very fast. Utilizing waste materials could benefit the ecosystem and solve the issue of waste disposal. Marble powder is one of the waste materials that can be used to partially replace cement in DSM. Marble powder and dust are waste materials that results from polishing of marble blocks. Several studies reported that during marble block production, 25% of the volume of the block will consist of marble powder and dust, which will cause environmental pollution [18,19,20,21]. Therefore, reusing this material in DSM will have a positive eco-friendly effect on the environment.
Bhadriraju et al. [22] reported that several factors influence the treatment of soil using the DSM technique, specifically the sample preparation process and the soil/binder mixing process. Thus, the methodology of laboratory samples preparation plays a significant role in the strength of the treated soil. Many studies on DSM techniques reported a traditional mechanical mixing of the soil, binder and water that are not consistent with the field methods where the soil and binder mixtures are poured into molding cylinders [11,12,13]. Very few studies, such as Esmaeili et al. [10] and Frikha et al. [23], presented a scaled-laboratory apparatus similar to the field deep soil mixing techniques where a vertical and rotating auger mixed the binder and the soil.
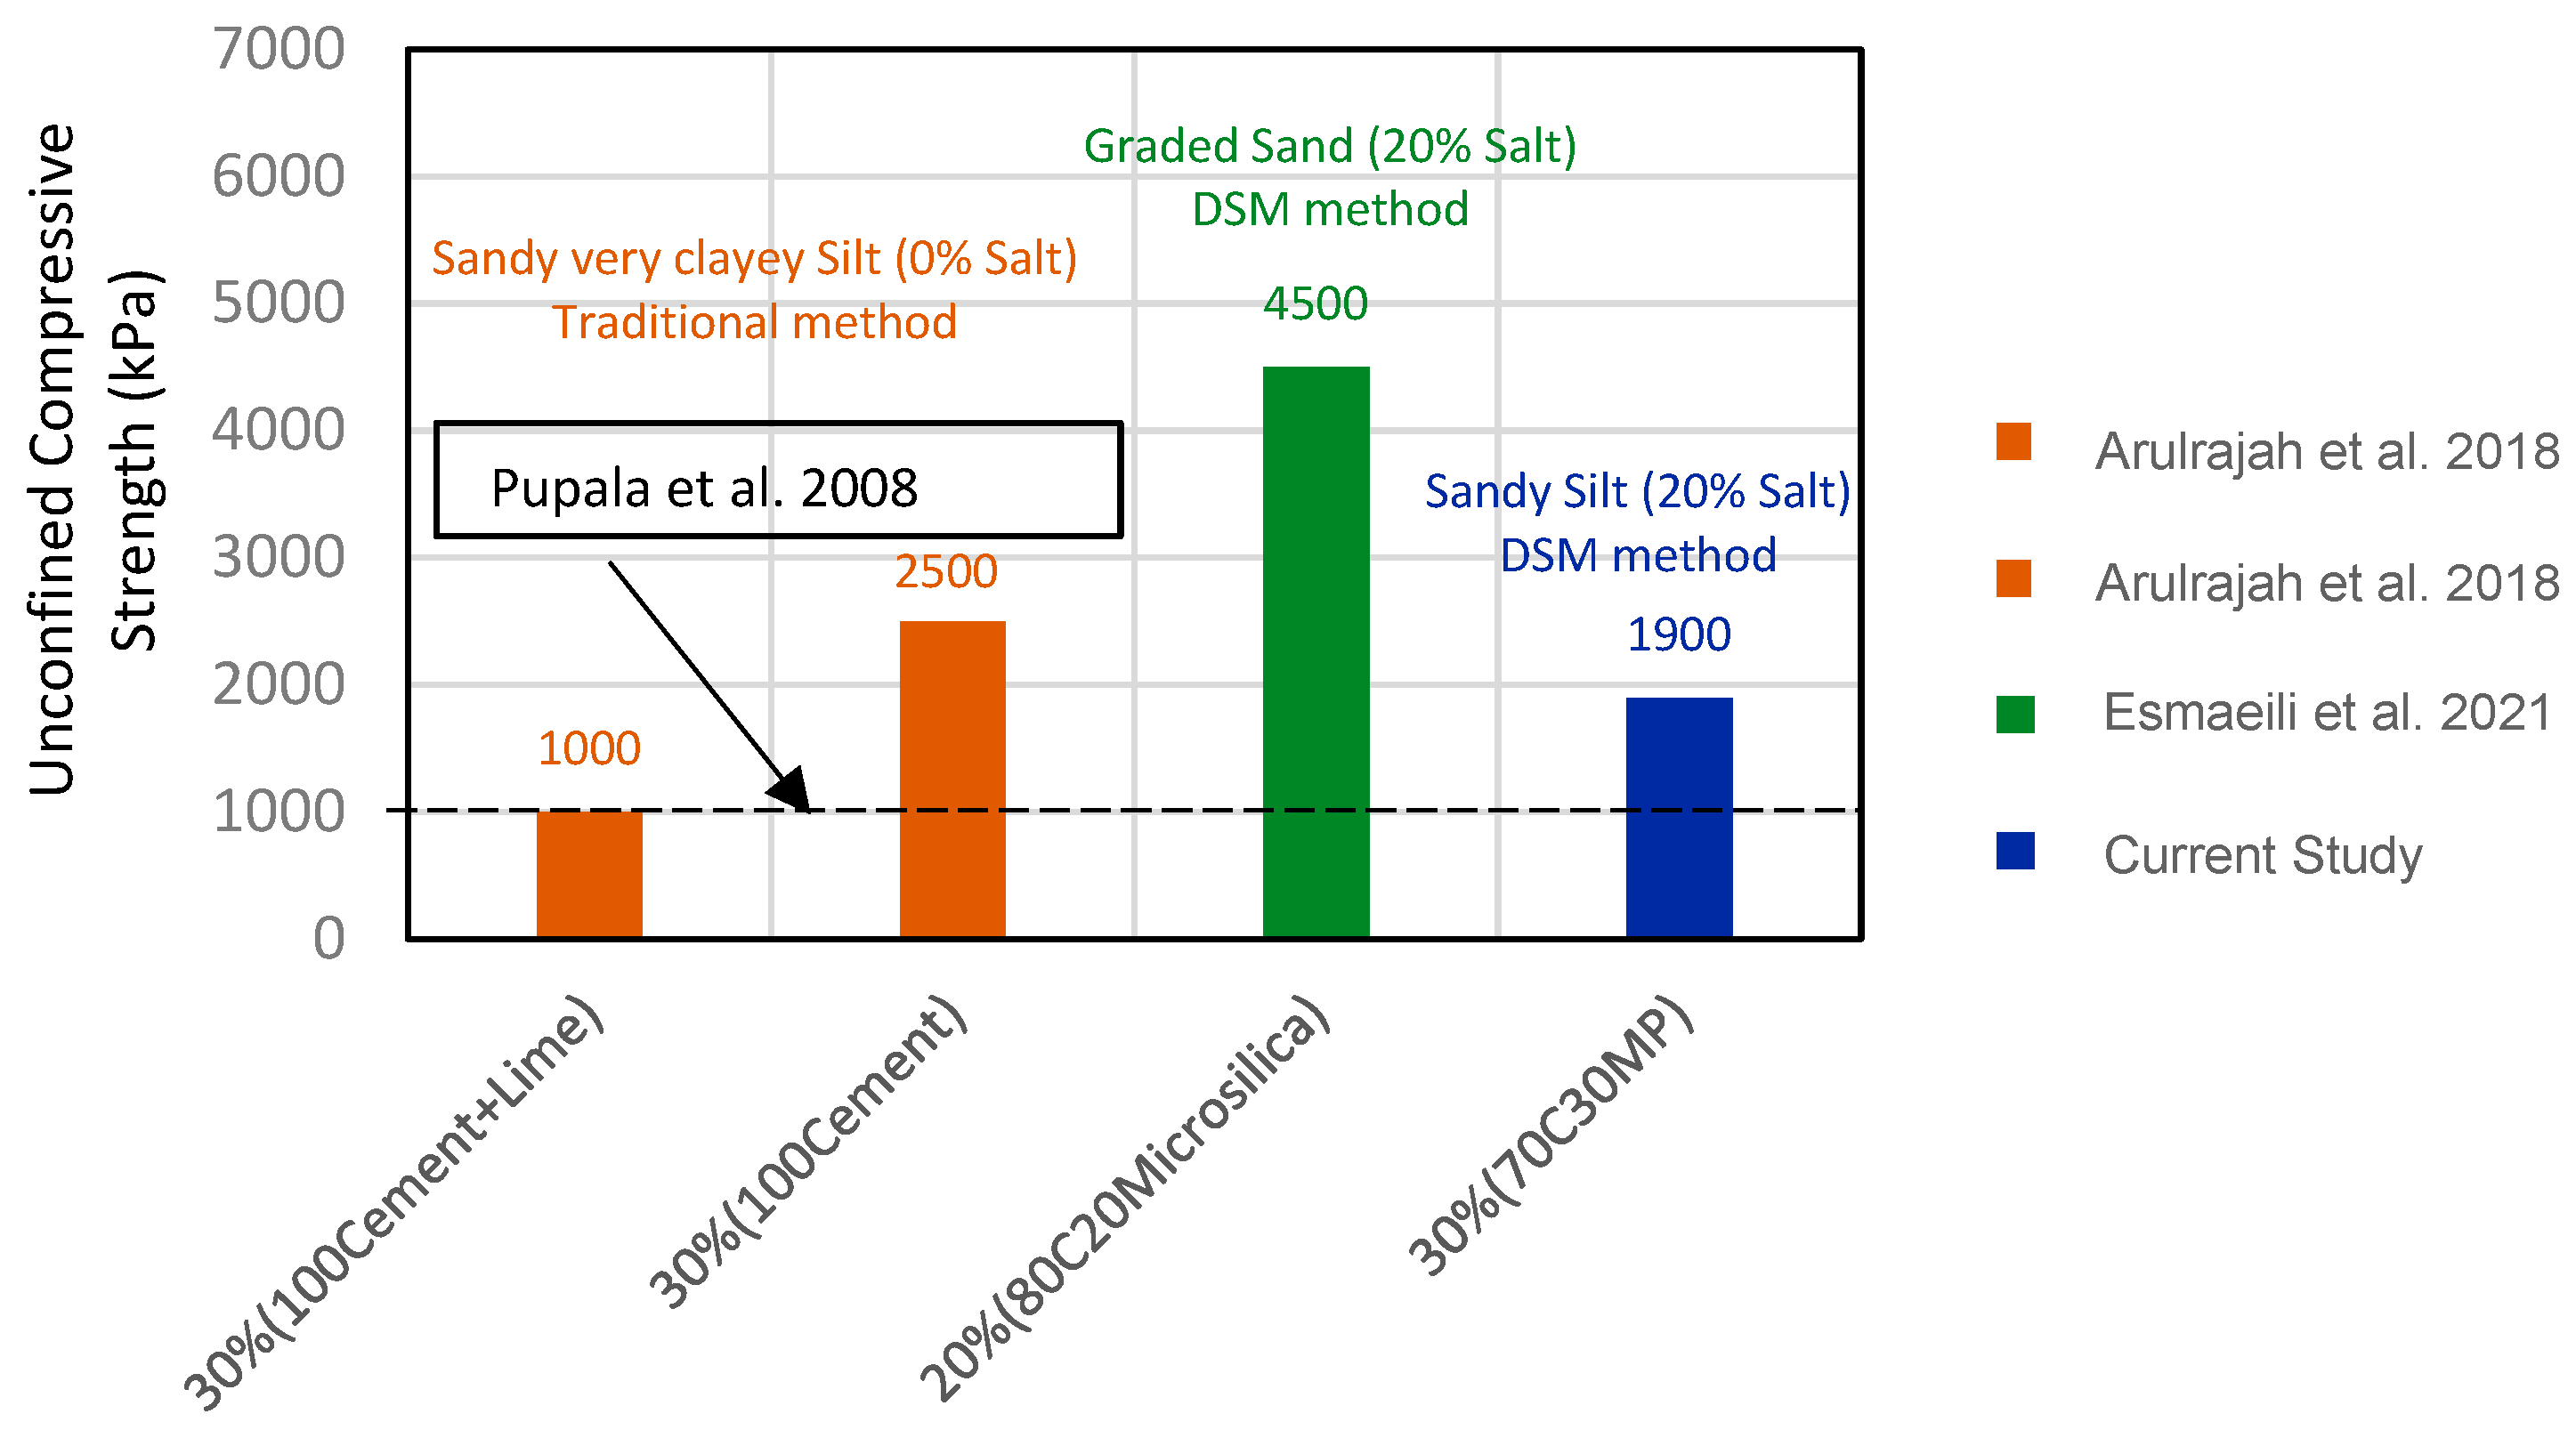
Esmaeili et al. [10] presented a study treating a loose salty dry sand subgrade (artificial subgrade) with different salt percentages (0, 5, 10 and 20% salt) using microsilica additives. Three percentages micro-silica additives, 10, 15 and 20%, were added to a cement solution with a w/b ratio equal to 1. The samples were subjected to UCS tests after curing periods of 7, 14 and 28 days. The results indicated that addition of 15% microsilica resulted in a 21% improvement in UCS after 28 days curing period. The shortcomings of the applied DSM method are that the slurry delivery system depended on a gravitation method employing a tank placed at a height of 2.5 m from the ground floor rather than utilizing a slurry pump injection to apply a pressure while injecting the slurry into the soil. Such a method may have a significant effect on the mixing quality. Also, this research involved a w/b ratio equal to 1.0, and hence, the effect of w/b ratio was not addressed in this study.
Frikha et al. [23] investigated the treatment of soft clay high organic matter percentages equal to 22% using only cement. The conducted testing program involved the examination of five different parameters. These parameters included curing time at 7, 14, 21, and 28 days. Additionally, the injection pressure was tested at 50, 100, and 150 kPa, while the w/c ratio was equal to 0.7, 1, and 1.2. The rotation rate parameter was assessed at 15, 30, and 40 rpm. The findings indicated that higher w/c ratios resulted in decreased shear strength of the soil. Conversely, increasing injection pressure improved soil shear characteristics. The curing period had a notable impact on the treated soil’s shear strength. When the rotation rate of drilling tools increased, there was a significant reduction in soil shear strength. Additionally, injecting grout cement at high rotation rates hindered the formation of a cohesive column and resulted in unsatisfactory mixing. This study focused on the operational parameters and the w/c ratio effect on the soil improvement degree while ignoring the amount of cement. Also, only cement was employed in this study as a stabilizer rather than other additives or wastage material. In addition, the author used only the Triaxial testing method; meanwhile, there were no microstructures analysis nor non-destructive testing on the samples to verify the results of the Triaxial test.
Both studies by Esmaeili et al. [10] and Frikha et al. [23] applied a DSM technique in the laboratory for artificial saline dry sand and organic soft clay with 163% water content, respectively. The physical and chemical properties of the soil, including its grain size distribution, water content, Atterberg limits, clay mineral type, cation exchange capacity, soluble silica and alumina content, pore water pH, and organic matter content, first have an impact on the properties of the treatment applicability and then on the treated soil properties if successful [24]. The treatment of saline sandy silt using a developed DSM apparatus in the laboratory has not been addressed elsewhere.
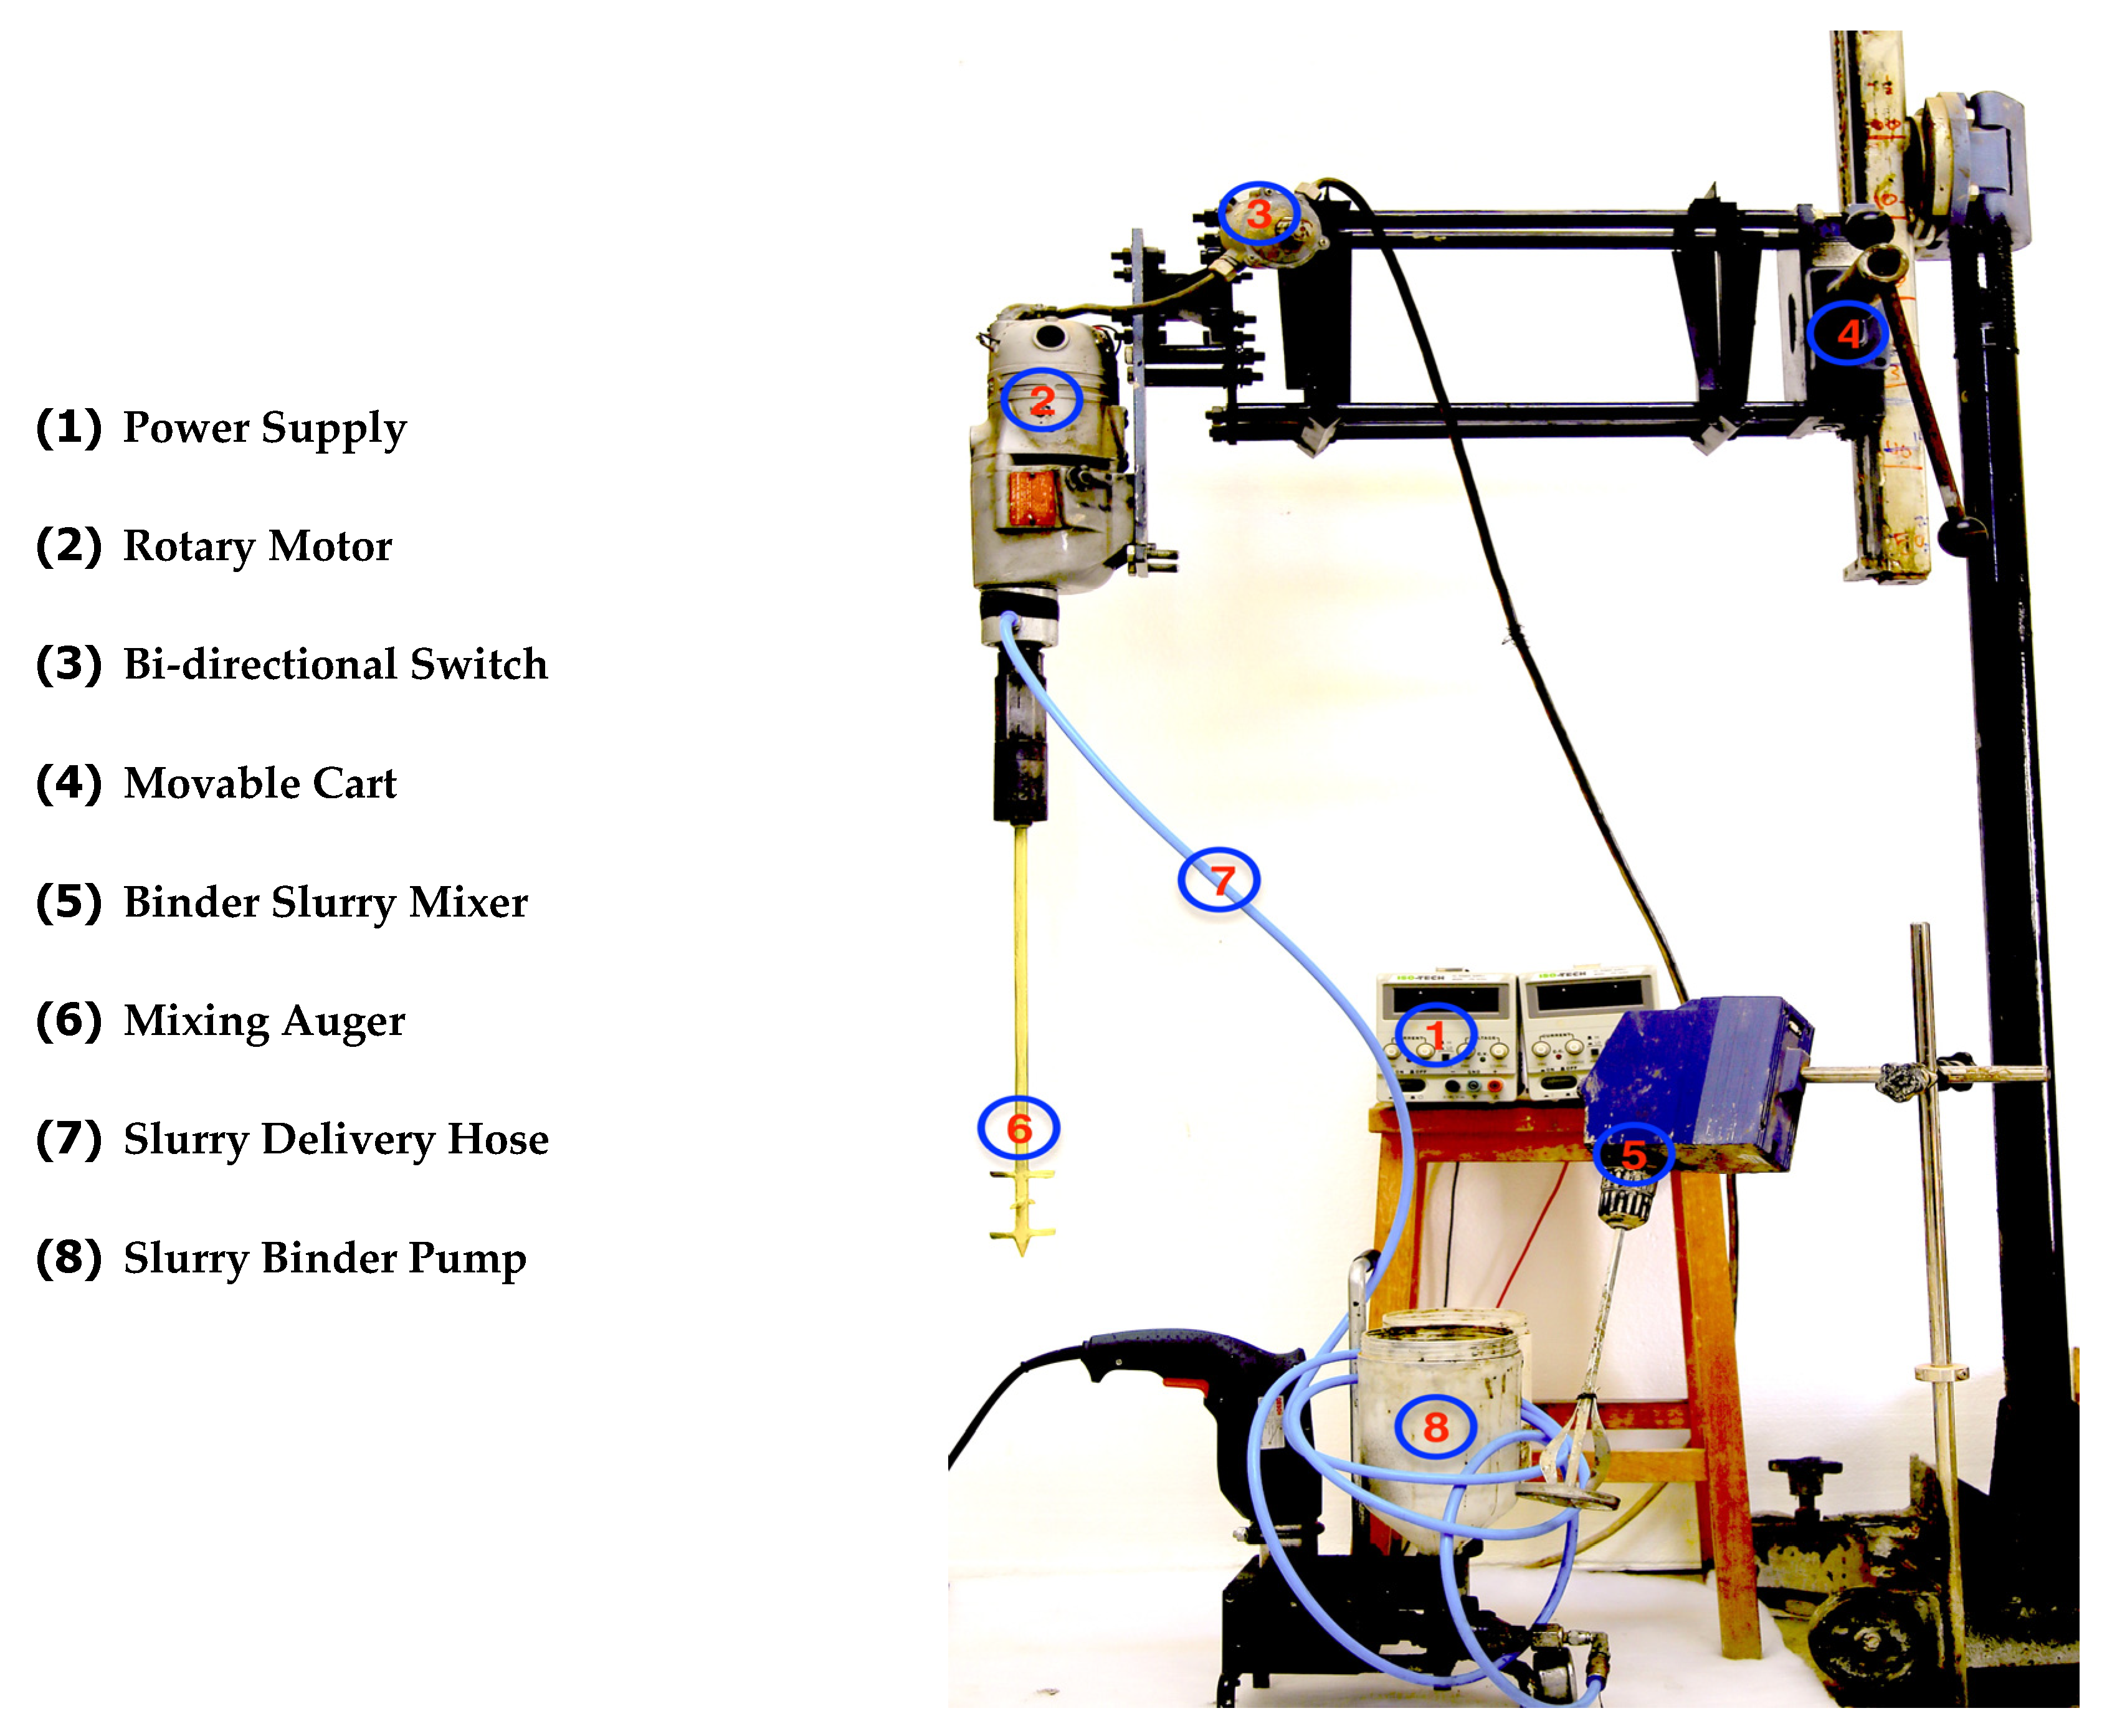
Accordingly, the current research aimed to present a detailed study on the treatment of saline silt soils using the deep soil mixing technique. A scaled-laboratory DSM setup that simulates the in-situ DSM method was developed in the laboratory. Furthermore, this study investigates the potential use of marble powder (MP) for the purpose of partial cement replacement in DSM.

2. Materials Properties

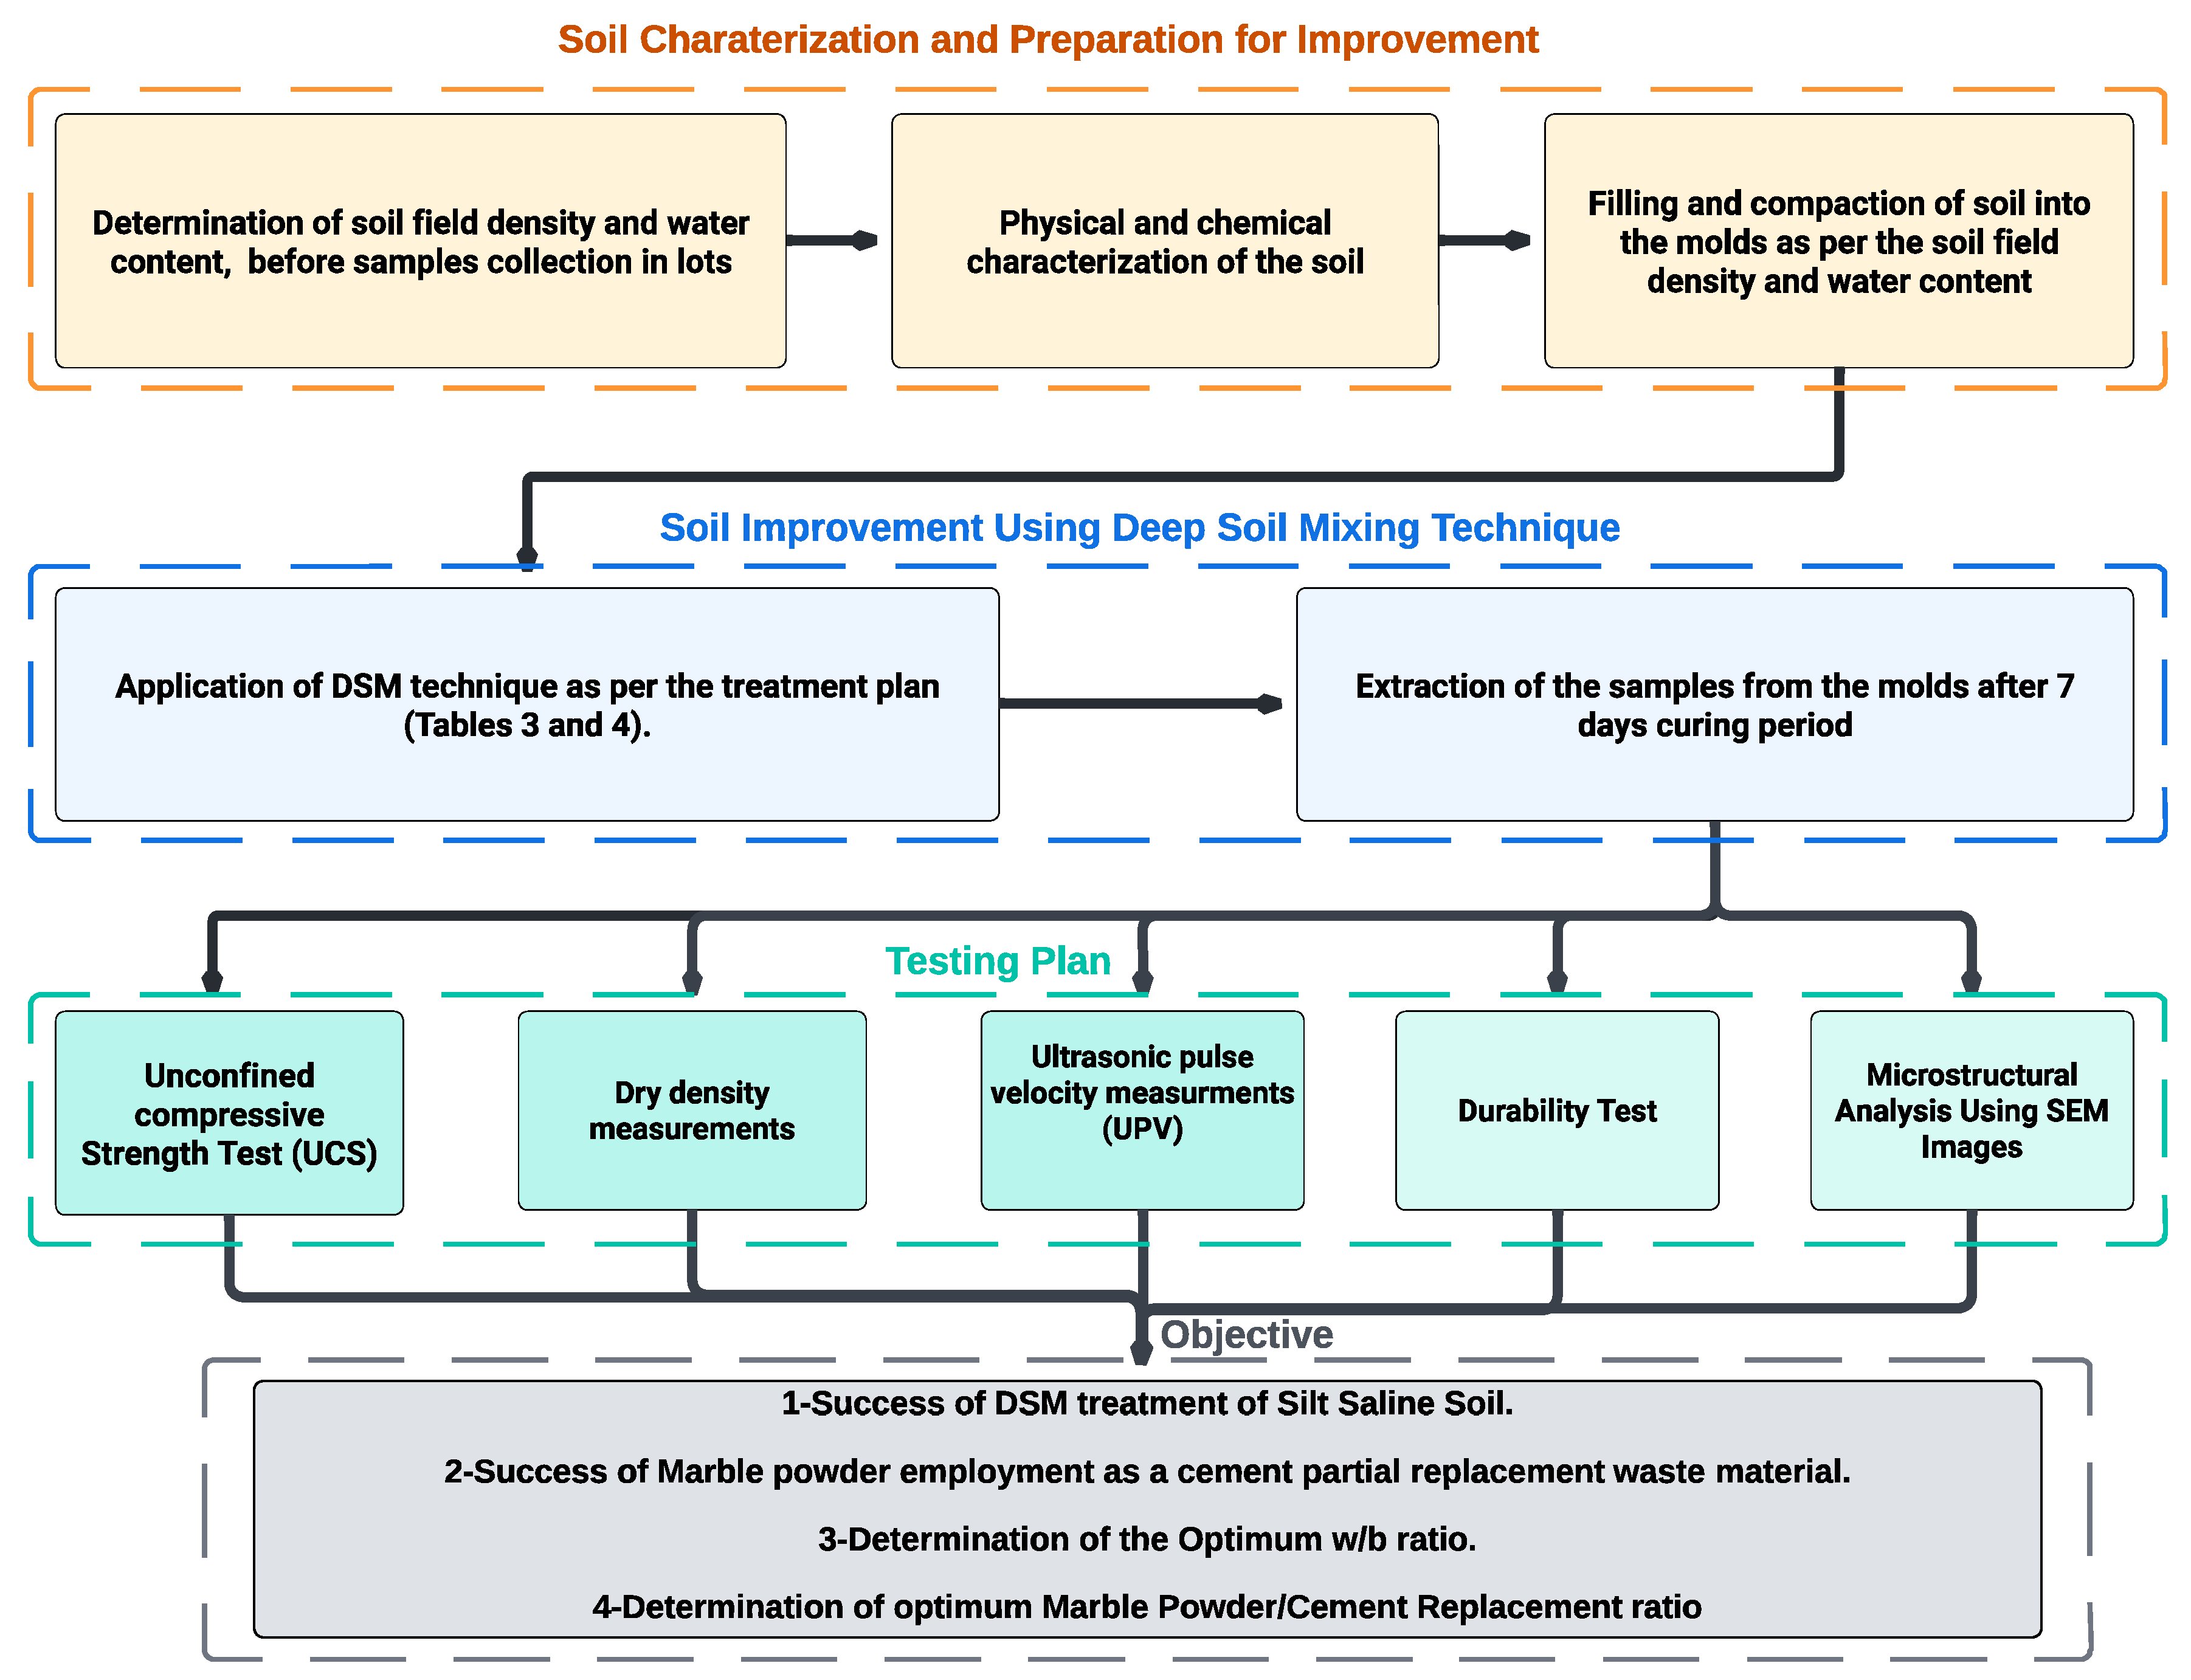
A large quantity of soil samples was collected. The soil was dried overnight in the oven (1 full day). Afterwards, the soil was grinded to break the cemented particles due to the presence of salt. To characterize the soil, grain size distribution ASTM D6913-04 [25], Atterberg limits ASTM D4318 [26], and standard proctor test ASTM D698-12 [
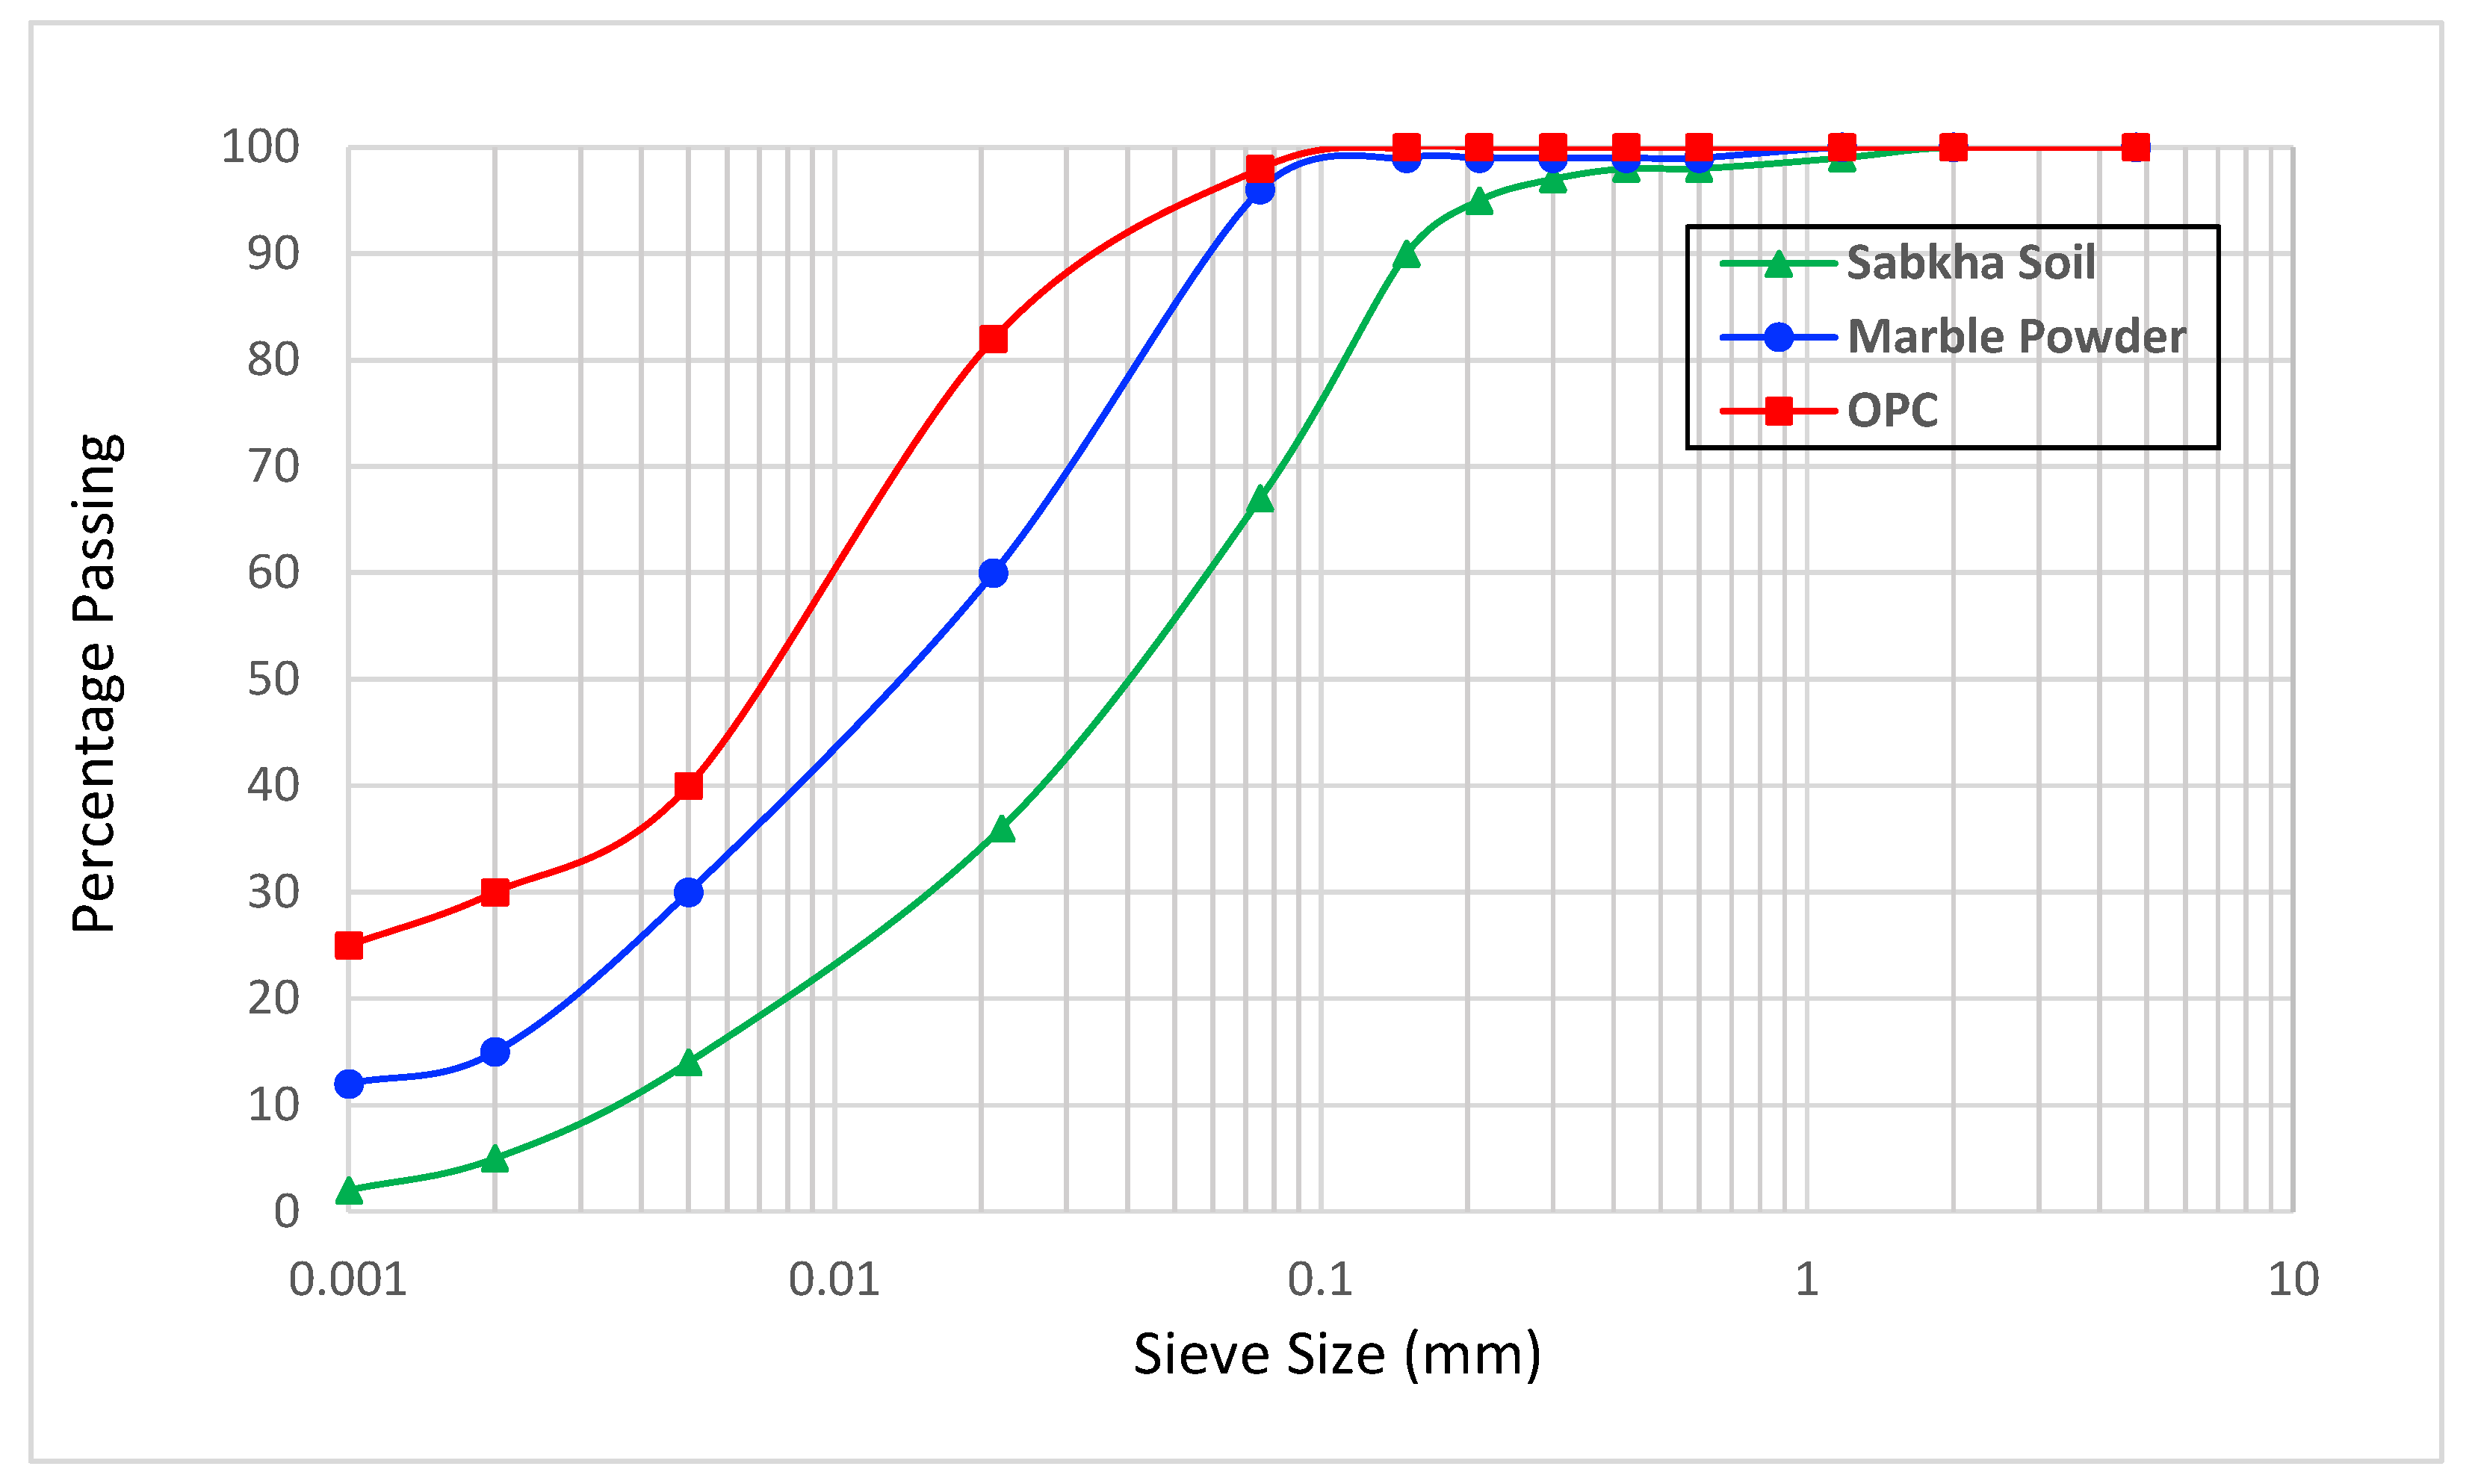
27] were performed. These tests were repeatedly conducted on identical samples. The particle size gradation of the soil is presented in Figure 1. Both, the chemical composition and physical properties of the soil are listed in Table 1 and Table 2, respectively. This soil can be classified as a low plastic organic soil (OL) based on the Unified Soil Classification System (USCS). The soil field density and water content were determined at three (3) different locations using the sand cone test method as per ASTM D1556 [28].
Ordinary Portland cement (OPC) and marble powder (MP) are employed as binders for soil stabilization. OPC that conforms to ASTM C150 [29] was employed. The binders’ physical properties were determined. Particle gradation analysis, Atterberg limits and specific gravity ASTM D854-02 [30] were carried out. Figure 1 shows the particles gradation of OPC and MP. Atterberg limits, specific gravity and chemical analysis of MP and OPC are presented in Table 1 and Table 2. The MP has been imported from a marble industry factory as a byproduct in the form of a powder.

3. Developed Apparatus for Laboratory Deep Mixing

3.1. Apparatus Components

A special equipment has been developed to prepare the treated soil samples. The set up consisted of portable steel stand, rotary motor, movable cart, mixing auger, and slurry injection pump (Figure 2). The portable stand is mounted to carry the movable cart together with the rotary motor and mixing auger. The rotary motor’s function is to rotate the mixing augers, whereas the movable cart allowed for vertical movement of the mixing auger during penetration or withdrawal. The injection pump delivers the binder slurry to the auger stem, and hence to the soil during penetration and withdrawal. In terms of installation requirements, an electrical inverter direct current power supply (DCP) is connected to the rotary motor to control the speed rotation. The vertical movement are manually operated via a rotating rod attached to the moving cart. Clockwise and anti-clockwise rotation directions are specified for downward and upward movement of the mixing auger, respectively. For reverse direction of the rotary motor, an on-off-on switch with six-pin terminals is attached with the engine motherboard.
The drilling augers with diameters of 60 and 75 mm is manufactured from a stainless-steel hollow stem with an outer/inner diameter of 12.75/11.22 mm. Six cutting blades with two sharp edges are attached to the auger. The blade thickness was chosen to be as thin as possible in order to reflect an efficient mixing, as referenced by Topolnicki [31]. The blades were fixed with inclined angles of 40 degrees. A nozzle with a diameter of 5 mm is attached very close to the auger tip in order to inject the binder slurry to the soil. The pump consists of a power station connected with the gearbox to apply a hydraulic movement on the piston shaft. A pressure gauge and a screw nut with a push connector is used to control the pumping rate. Figure 2 demonstrates the utilized DSM apparatus.

3.2. Operational Parameters

Deep mixing operation details are considered crucial for the soil improvement degree. Therefore, extensive literature reviews on DM operation characteristics have been conducted to define the acceptable values of auger penetration, withdrawal rate, and rotation speed. In their study, (Esmaeili et al., 2021 and Frikha et al., 2017) [10,23] selected vertical translation while penetration and withdrawal ranged from (250–1000 mm/min) and rotation rate ranged from 15 to 60 rpm. The selected rotation rates for some of these studies is corresponded to the order of magnitude utilized by AFNOR NF EN 14679 standard-December 2005. In addition, a typical parameter for deep mixing process was presented by Jie Han [8]. Based on the literature, the installation rate was 360 mm/min, and the rotation mixing head speed was 80 rounds per minute (rpm). The slurry injection pressure was kept constant at 0.5 bar. The slurry pumping rate was calibrated to be equal to 0.60 L/minute, as introduced via an injection pump pressure.

4. Stabilization Mixture Ratios

Recent studies revealed that binder proportions of 10, 20 and 30% on the basis of the dry soil mass were recommended for DSM [32,33,34,35]. In cases of soils with a significant amount of organic matter and soils with an excess of salt, particularly sulphates, which may delay cement hydration, special consideration is necessary. Smith [36] stated that saline soil treatment has been mentioned to present some challenges, but these can be overcome by adding more cement.
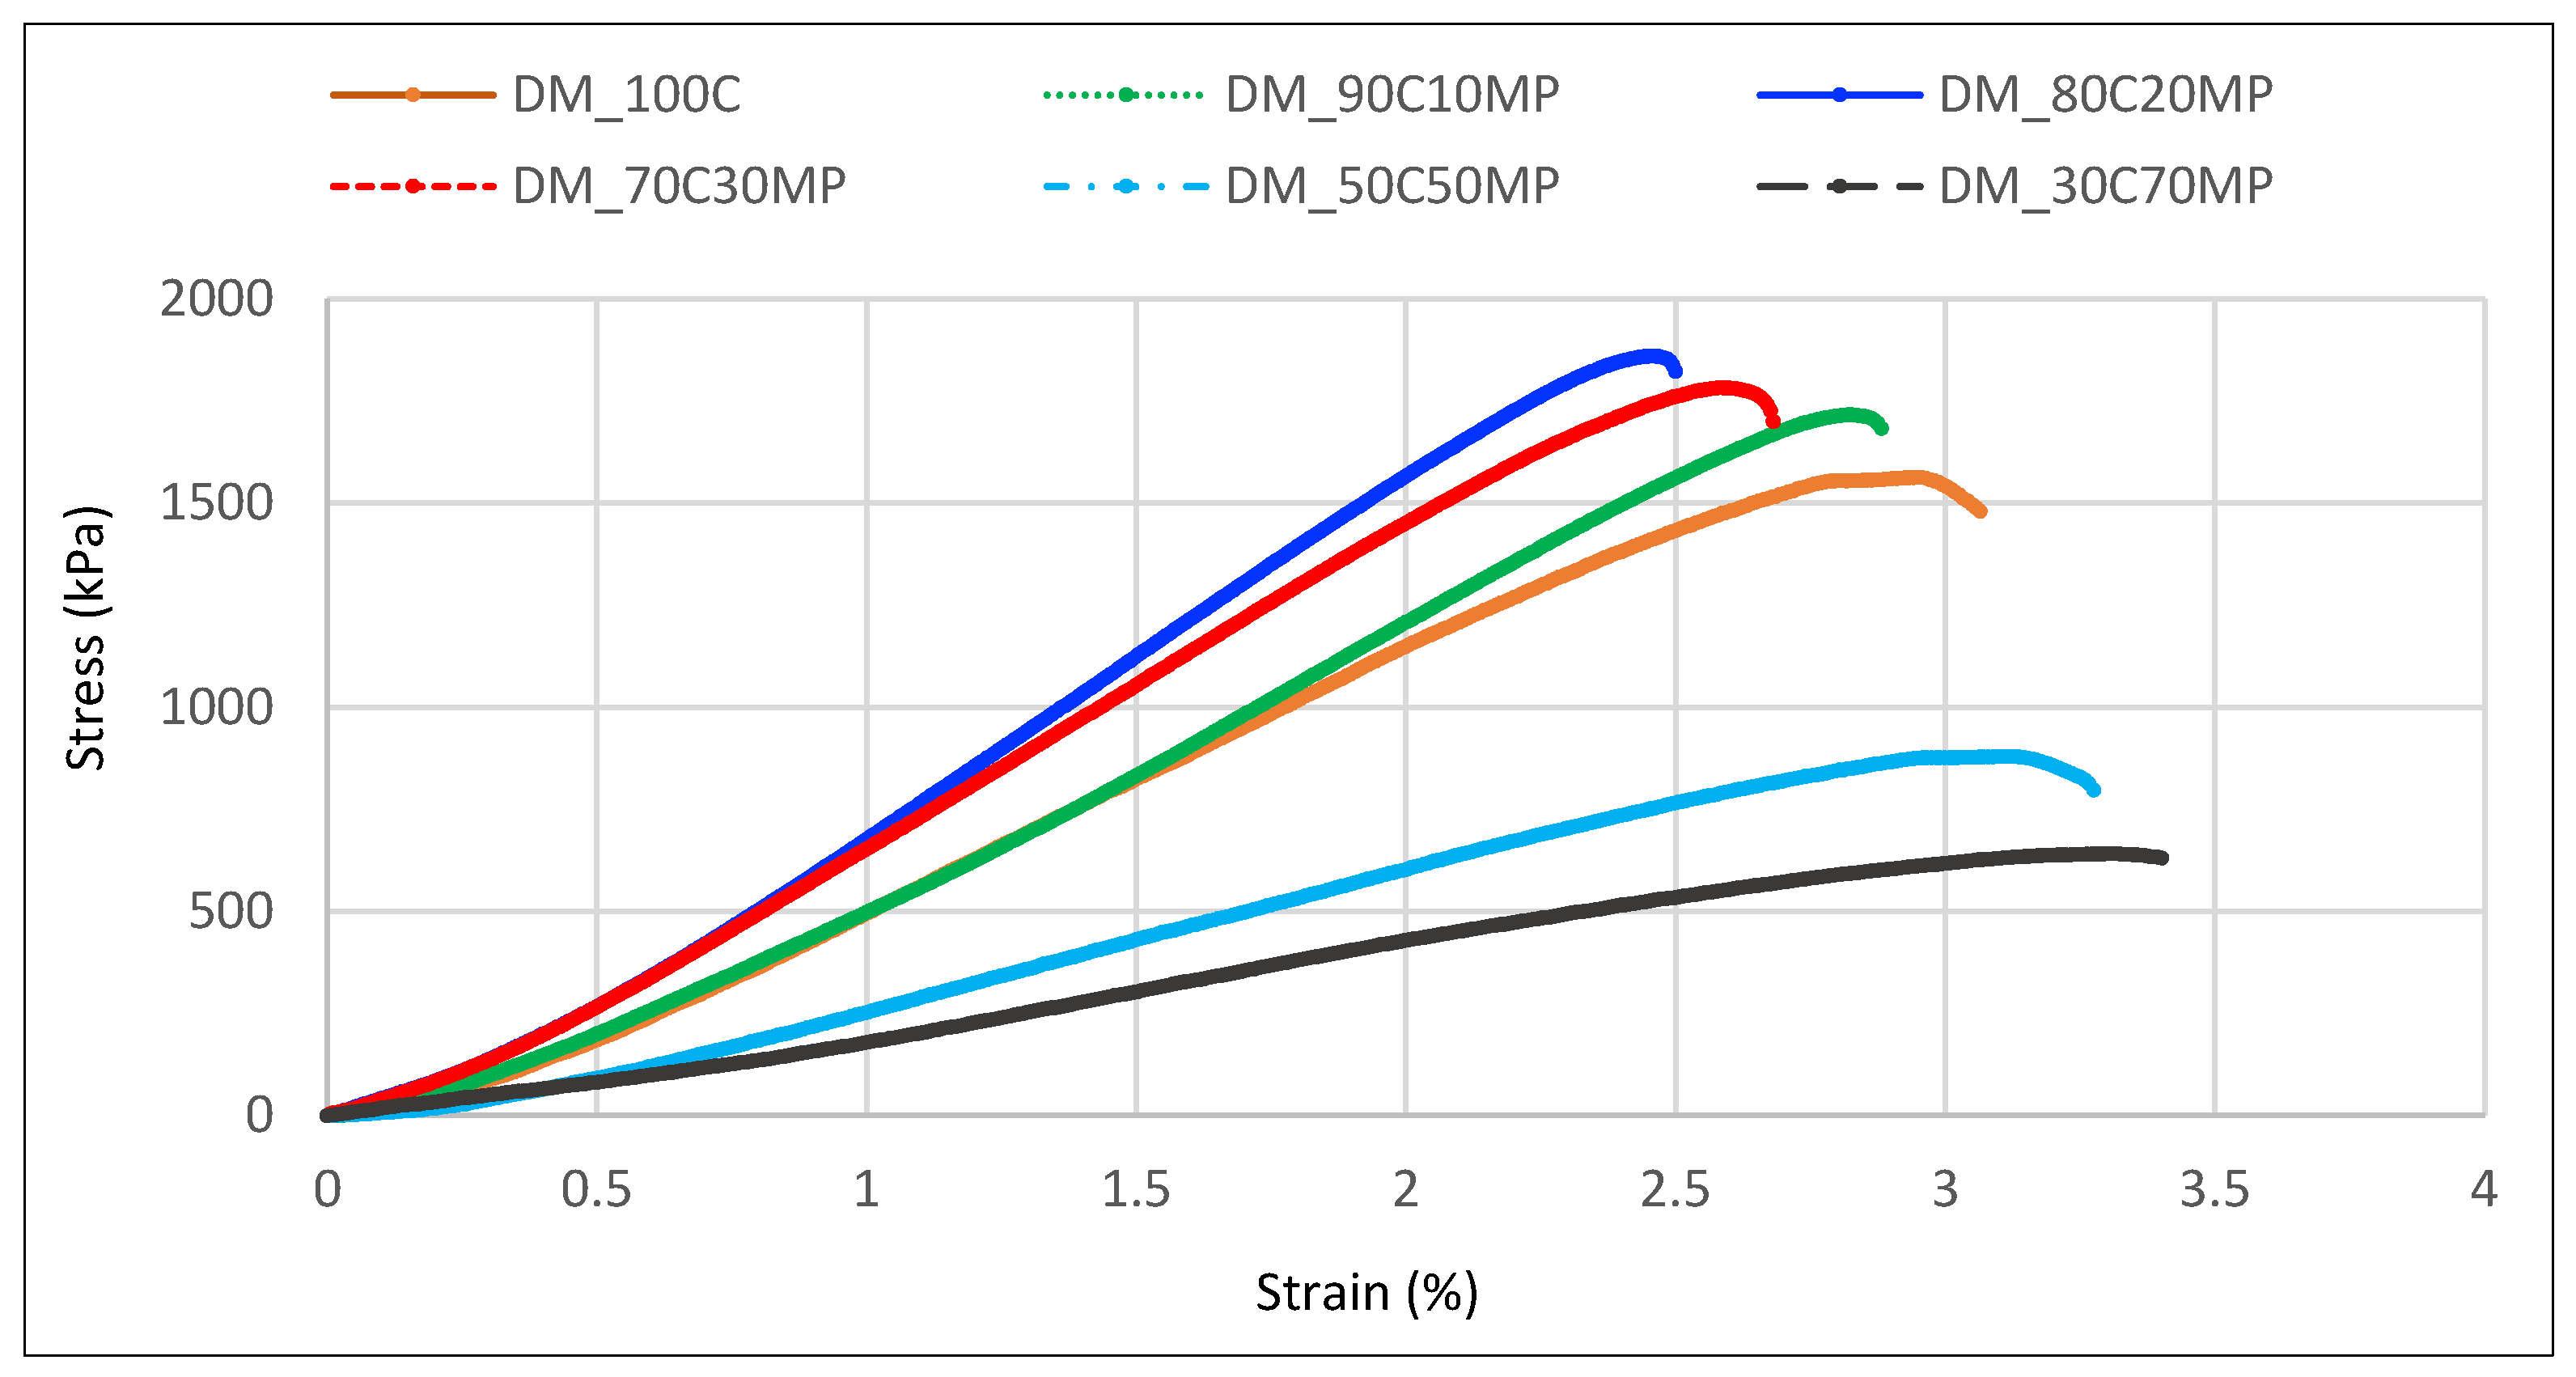
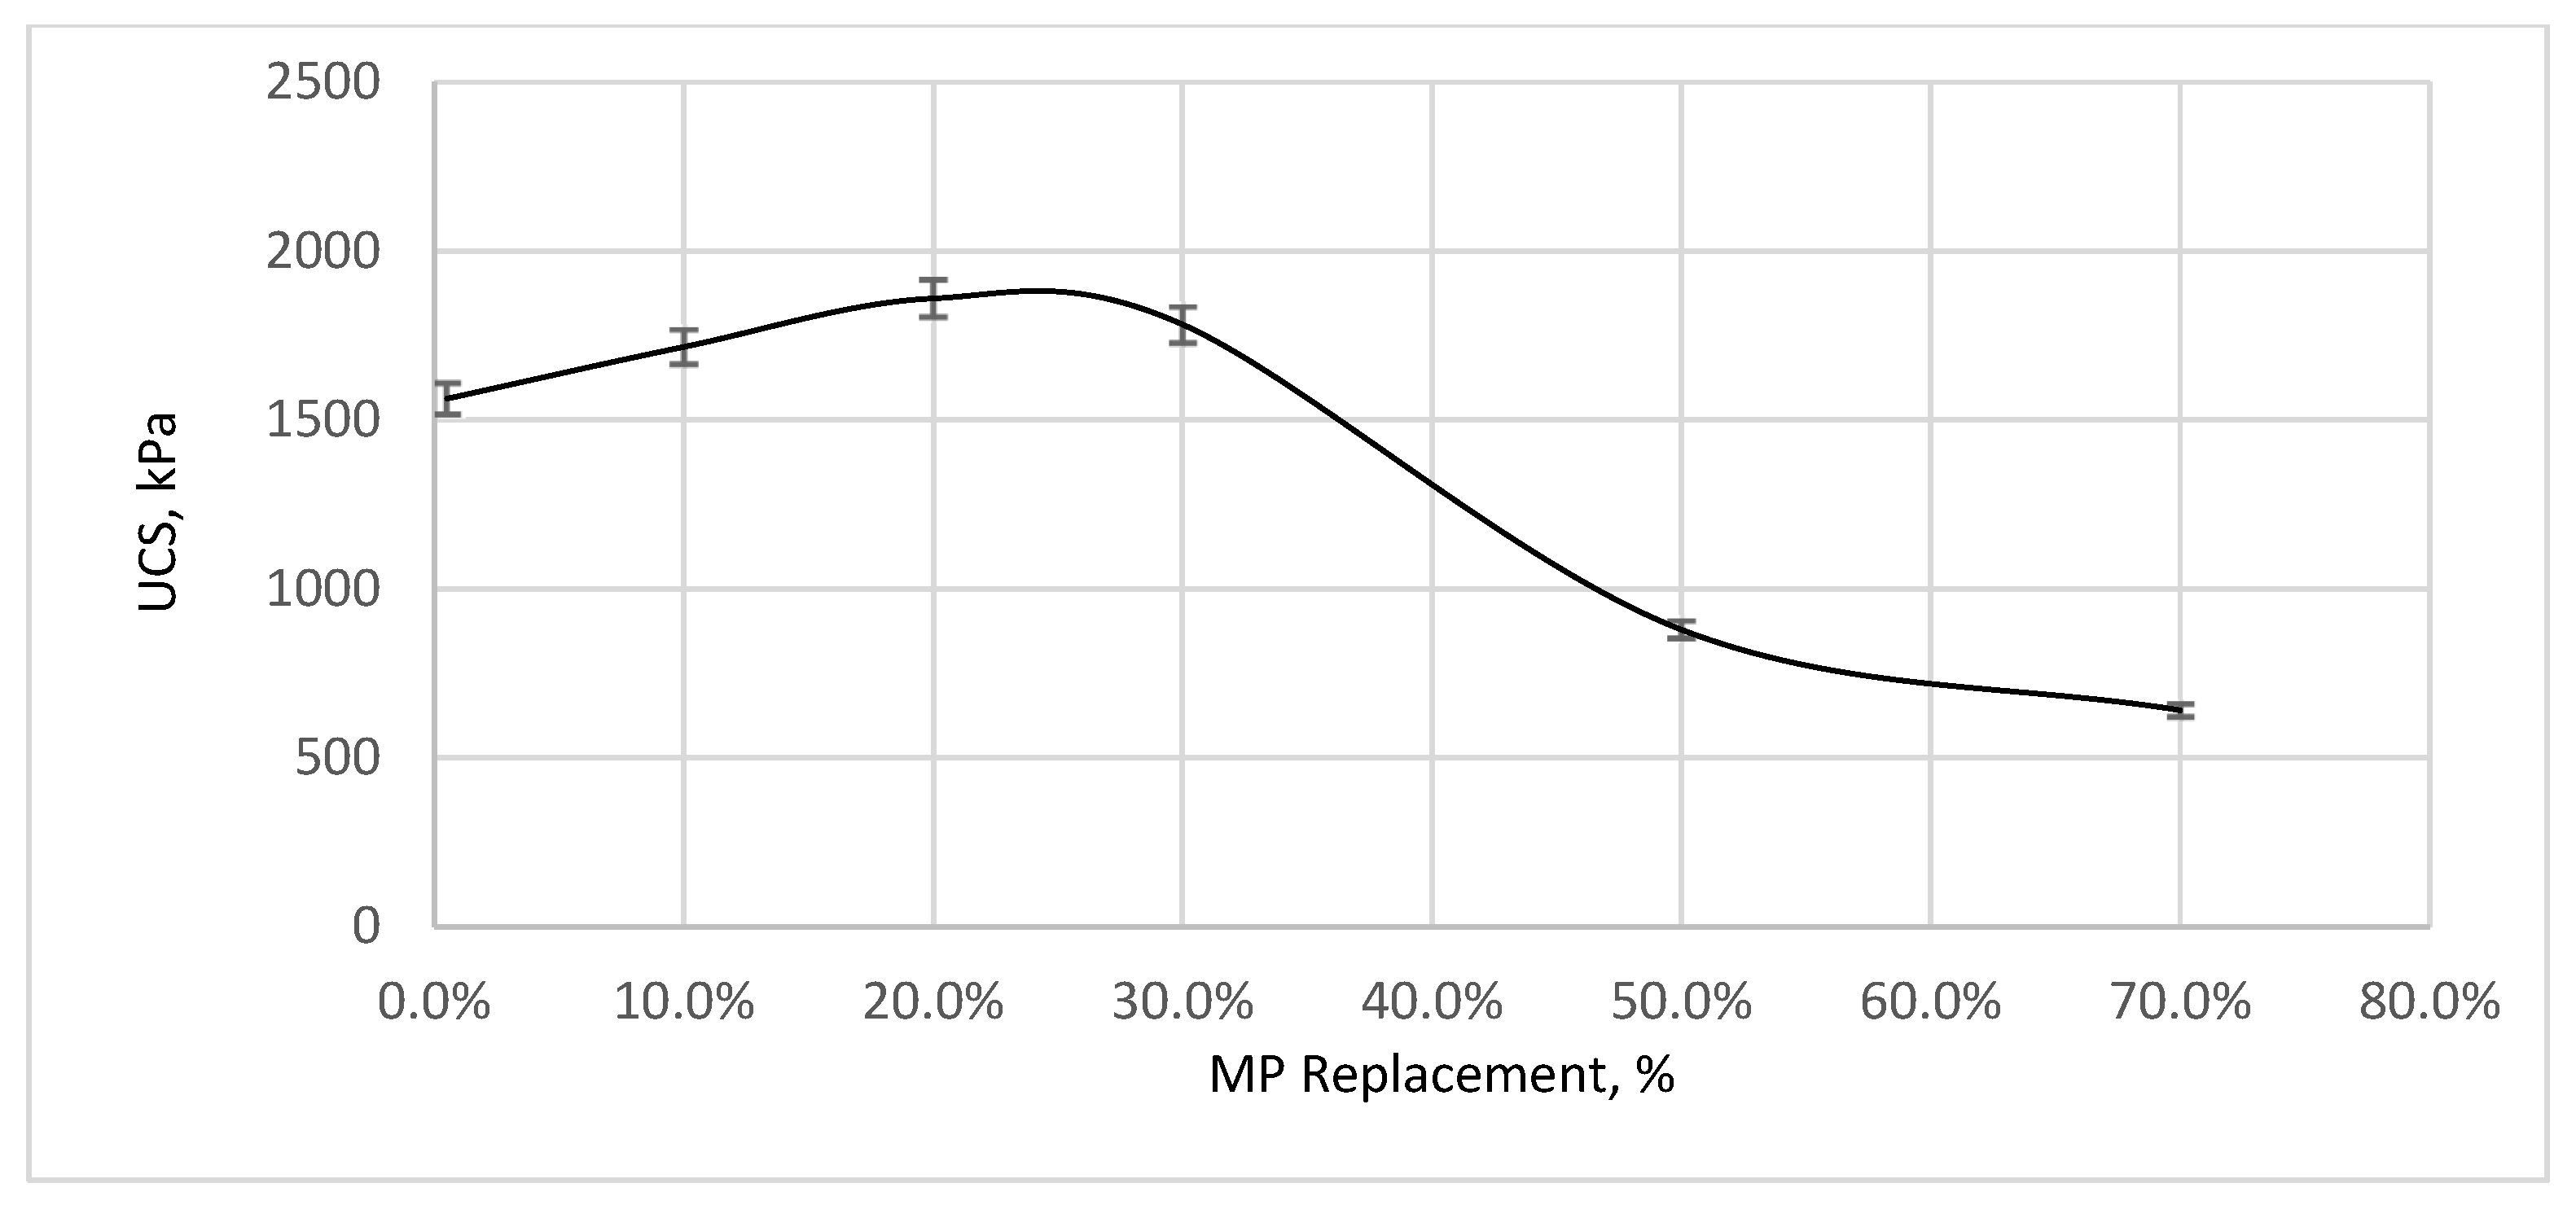
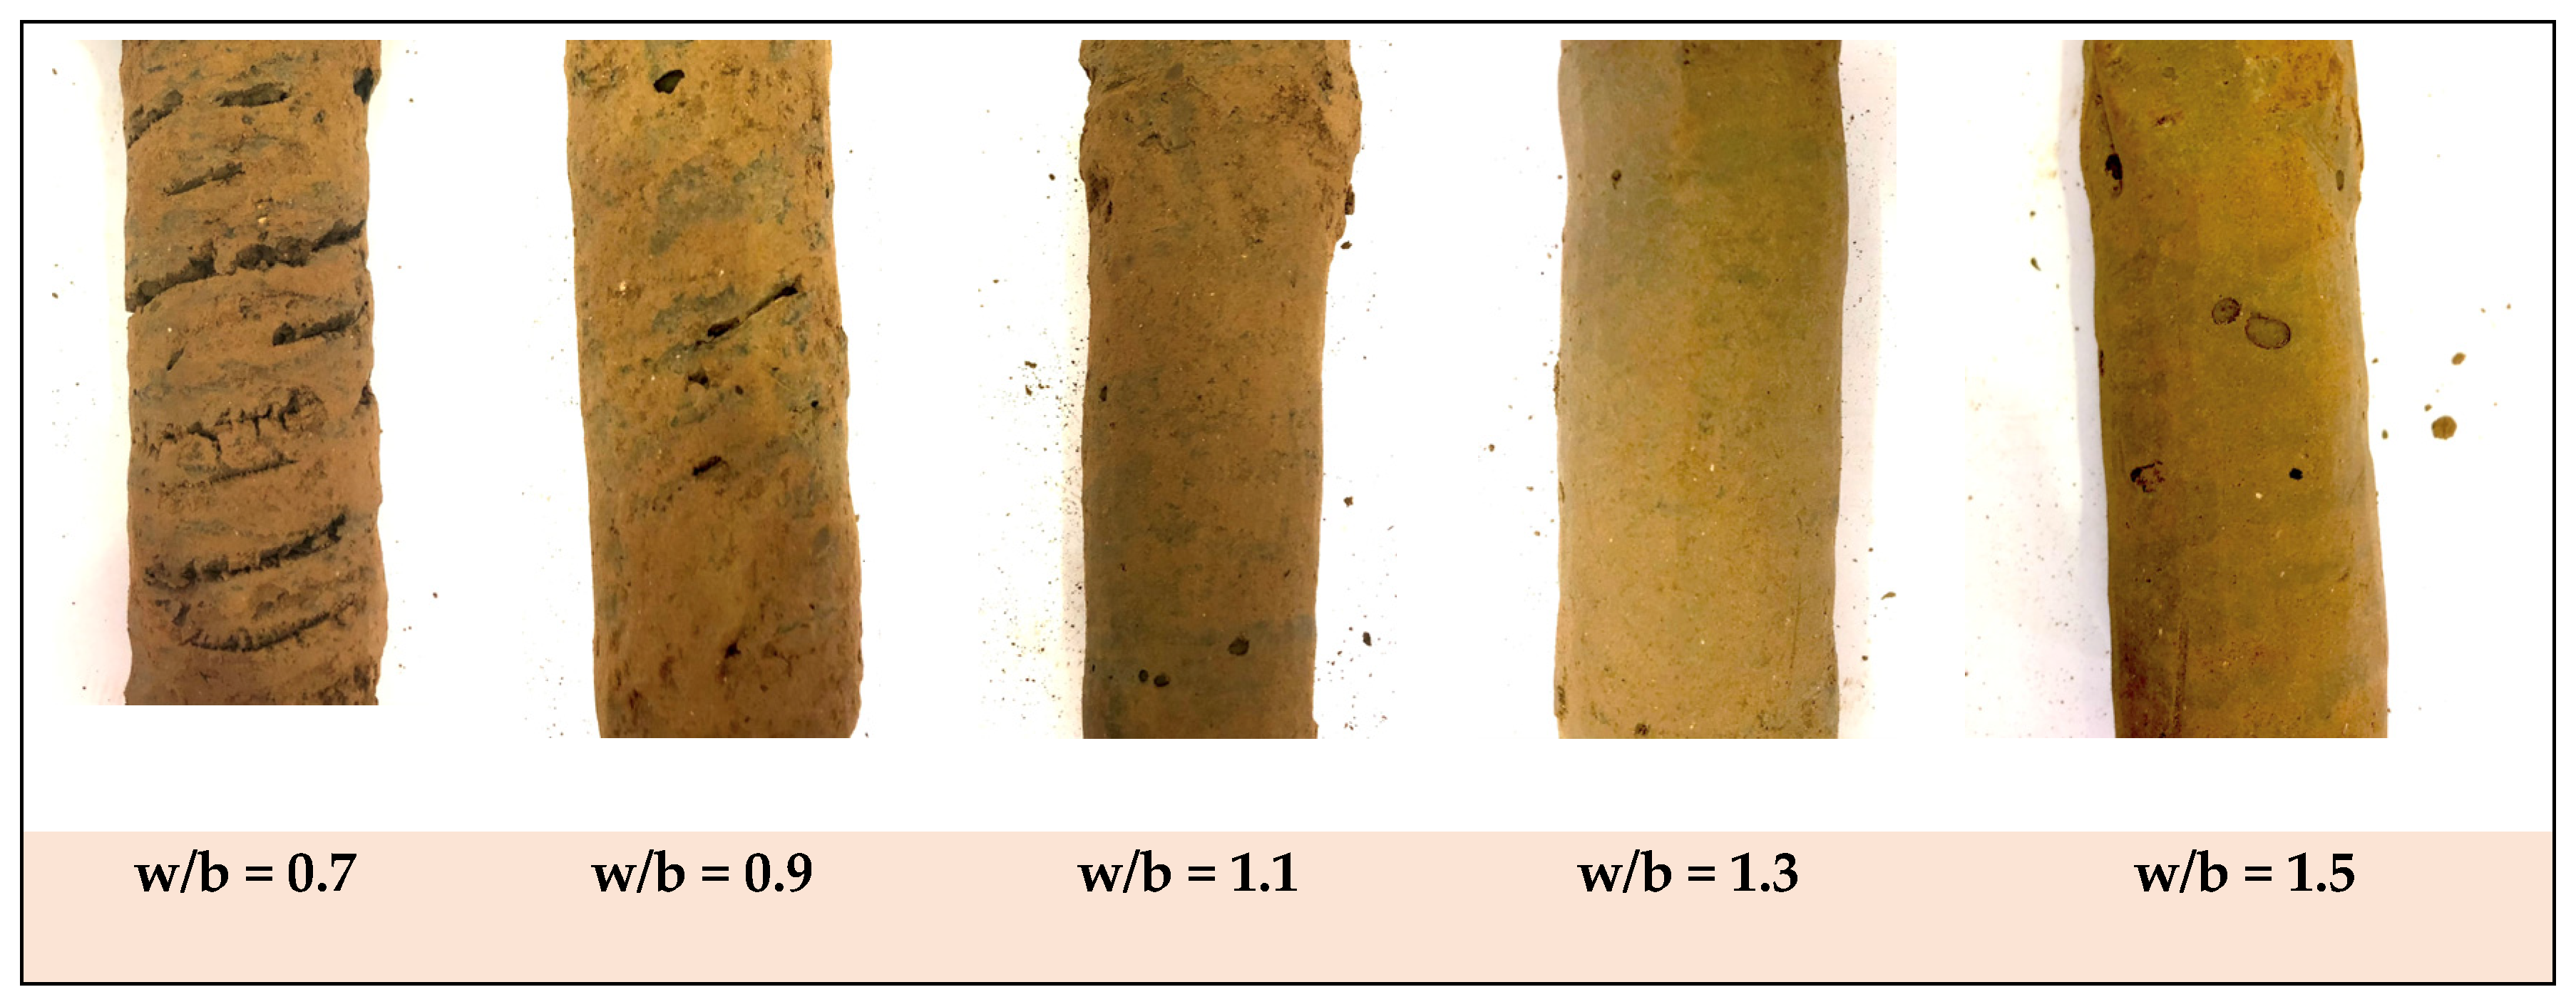
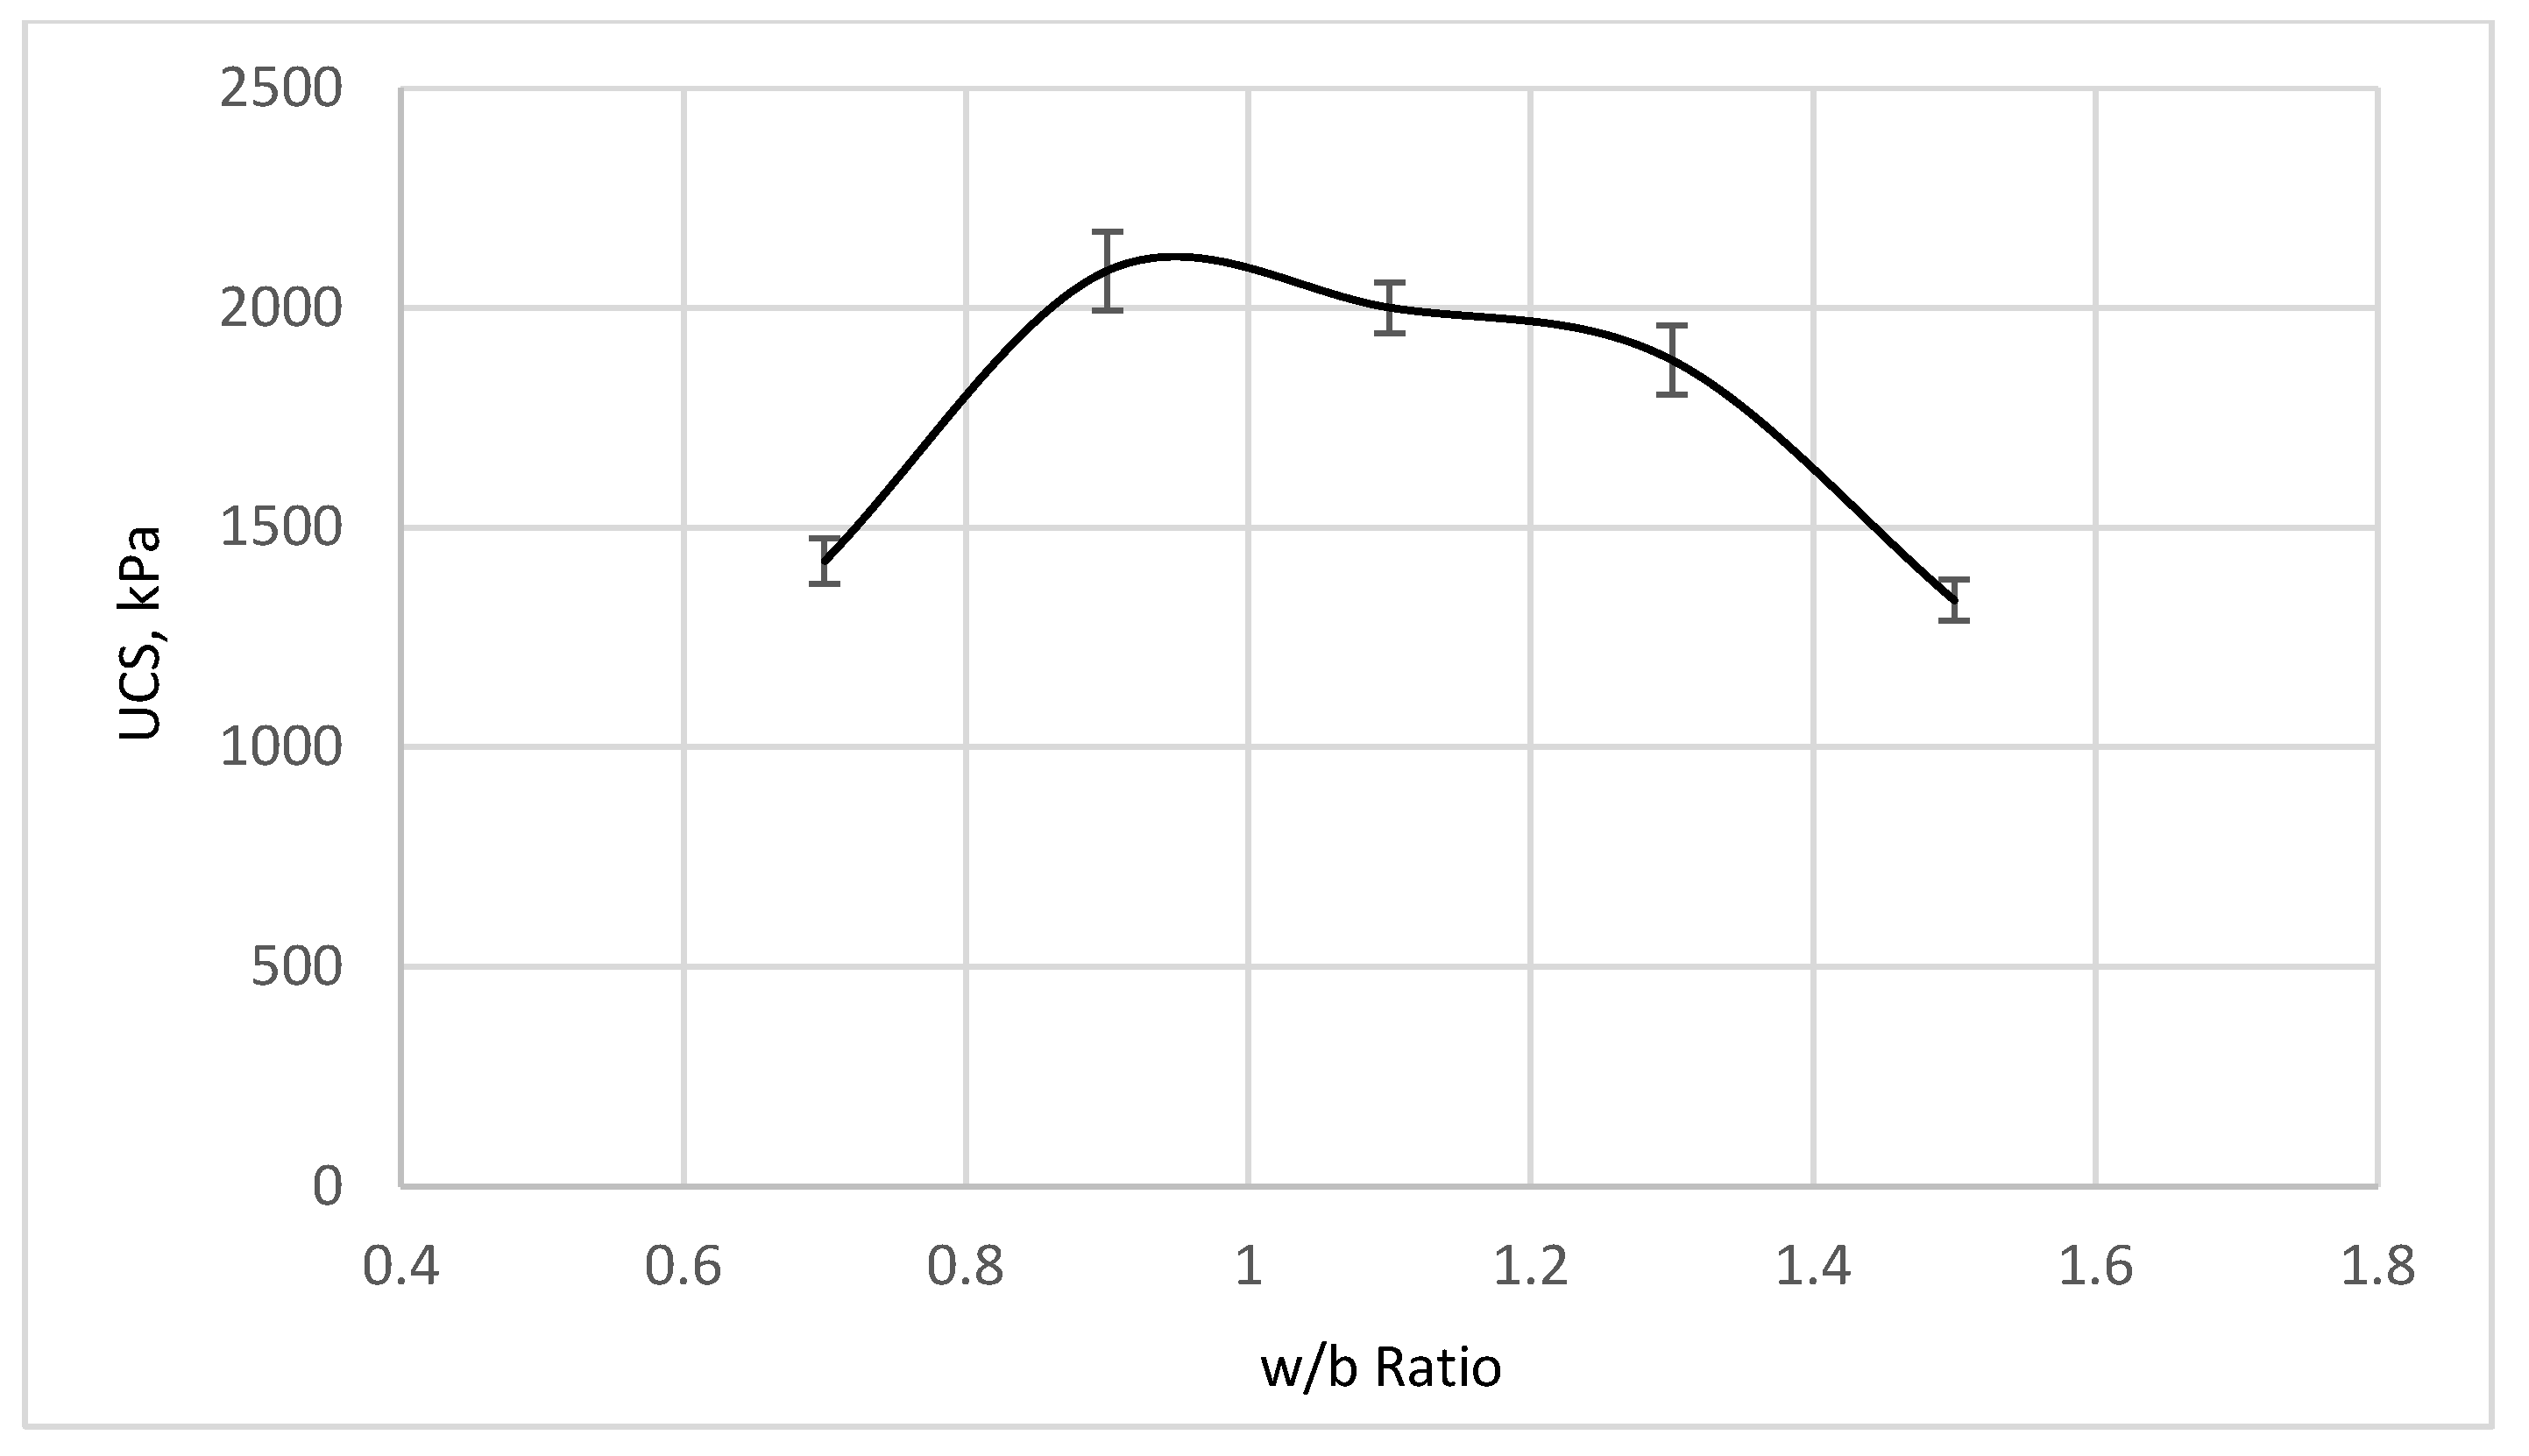
Based on the above review, a binder content of 30% is considered in this study to reduce the effect of salts in saline soils. Unlike the previous studies where binder consists of pure cement, marble powder will be used to partially replace the cement. In order to establish the optimum binder design, different MP replacement ratios are selected to replace the cement in the total binder using the following OPC/MP ratios: 100/0, 90/10, 80/20, 70/30, 50/50, and 30/70. The content of OPC and MP are provided in terms of the mass of dry soil. In addition, water/binder (w/b) proportion is a significant parameter that have an impact on the strength of the stabilized soil. As referenced in many literatures, when the w/b proportion increases, the stabilized strength decreases. To determine the optimum water/binder (w/b) ratio, different w/b ratios samples were prepared. Table 3 and Table 4 present different mixes with different binder % and w/b ratios, respectively.

5. Specimens Preparation

The soil sample was sieved using sieve No. 4 (size of 4.75 mm) to remove any gravels and large size particles. Steel molds with dimensions of 150 mm diameter and 300 mm height have been selected to prepare the soil according to the determined field density and water content. Using a mechanical mixer, the soil was completely mixed with water. Then, the soil was filled into the mold and compacted into five layers up to 250 mm height. The mold weight before and after filling was recorded together with soil water content determination to control the target soil density. The molds were covered and sealed to maintain the soil water content until mixing time.

5.1. Binder Slurry Preparation

The binder has been prepared in a slurry form. First, the cement was mixed properly with the marble powder before adding water. Afterwards, the required quantity of water was added to the binder materials (Cement and MP). The binder was mixed with water using a 250 rpm mechanical mixer for at least 10 min to form a homogenous slurry.

5.2. Specimens Treatment Procedures

The procedures for the DM treatment are as follows: (a) the slurry was poured into the injection graduated container; (b) while the volume of the required injected slurry was pre-determined, the slurry volume was recorded before and after the injection process for quantity control requirements taking into account the amount of the slurry that fills the injection hoses and the auger stem; (c) the auger rotation speed was adjusted at 80 rpm; (d) the mixing auger was located at the center of soil top surface, and the verticality of the mixing auger must be checked prior to the mixing process; (e) mixing and injection processes were commenced; and (f) after completion of the mixing process, the volume of the remaining slurry was recorded together with the weight of the mold after treatment. The molds were covered with sealed plastic bags. The specimens were extracted from the mold after curing duration (7 days). The diameter of the specimen was measured precisely at different locations to ensure the quality of the mixing process. The samples were trimmed to a length/diameter ratio of 2.0. The samples were cut with a miter saw at both ends to get planar areas parallel to the sample height. After trimming, a griding tool was used to adjust a slight irregularity of the sample surfaces.
To ensure adequate quality of the treated soil, some measurements were recorded before, during and after samples preparation. The binder amount was pre-determined as 30% from the dry soil mass. The soil density and water content before treatment were recorded followed by the amount and volume of the injected slurry considering the losses. The treated soil weight was recorded. Water content of the treated soil was determined just after treatment. In terms of installation characteristics, the penetration and withdrawal rate (mm/min) were controlled using a stopwatch and a constant rate of penetration. Also, the rotation speed (rpm) was calibrated. Such measurements can control not only the quantity of the binder but also the quality of the mixing consistency.

6. Testing Program

Unconfined compressive strength (UCS), density measurements, ultrasonic pulse velocity (UPV), durability and scanning electronic microscopy (SEM) tests were selected to assess the improvement in the soil. The UCS tests were conducted according to ASTM D1633-17 [37]. The sample density measurements were performed in accordance with ASTM D7263-09 [38]. The durability test was carried out as per the ASTM D559/D559M-15 [39] to assess the treated soil during long-term exposure to severe environment conditions. Furthermore, UPV test was conducted as described in ASTM C597 [40]. Furthermore, SEM testing was conducted on untreated samples and on selected treated samples to qualitatively analyze the microstructural development. A schematic flow chart is presented in Figure 3 to highlight the methodology, testing and main objective.

7. Test Results

7.1. Effect of Cement/Marble Powder Mixture Proportions Employing UCS

Figure 4 and Figure 5 present the stress/strain behavior and values of the UCS versus different MP replacement ratios, respectively. It is obvious that the stabilized soil strength increased with MP ratio up to 30% and then a sudden drop is noticed at 50% and 70% MP. The presented curves show that the optimum replacement ratio of MP/OPC is 20% to 30% MP. The statistical analysis of the unconfined compressive strength data under various testing conditions is displayed in Table 5. This table clearly demonstrates minimal fluctuations in the test results, indicating that the data obtained for unconfined compressive strength is highly repeatable.
Generally, the trend of UCS due to cement replacement is consistent with the outcomes reported by Alnunu and Nalbantoglu [13] for replacement of cement with waste marble powder. With 0% to 30% MP contents in the binder, UCS increases because of the formation of calcium hydroxide (Ca(OH)2) from the calcium oxide (CaO) in cement and marble powder, dissolution and precipitation of silica (SiO2) and alumina (AlO3) from the soil, and the consequent reactions forming CAH (calcium aluminate hydrate) and CSH (calcium silicate hydrates). Moreover, calcite (CaCO3) in MP reacts with tricalcium aluminate in cement to form calcium aluminate carbonate that speeds up the rate of hydration and increases the compressive strength [41,42,43,44,45,46,47].
For binders with MP ratios of 50% and 70%, the dramatic decrease in UCS is due to the excess of MP% that fills all the pore spaces and the extra MP precipitate on the surface of the soil grains, and thus, the contact area between soil particles is reduced. As a consequence, the amount of contact surface area required for chemical reaction decreased. Similar observation was reported by Alnunu and Nalbantoglu [13].
Figure 6 shows a comparison between the unconfined compressive strength obtained in this study and the published data on stabilized loose sandy clayey SILT without salt and graded dry SAND with 20% salt by Arulrajah et al. [35], and Esmaeili et al. [10], respectively. The amount of binder and the binder type are mentioned in the figure label.
Figure 6 shows the UCS values (2500 kPa) for only 30% cement, but UCS values in the traditional mixing method [35] is very close to the values obtained in the current study (1900 kPa) with the improved saline soil (70C30MP) mixture. However, other binders, such as (cement with lime), contributed to lower UCS values. In the case of graded dry saline SAND (20% salt) [10], the UCS value (4500 kPa) is more than double of the values of the current study (1900 kPa). This difference is attributed to the soil shear strength of the original soils prior to treatment considering that both studies employed the DSM method to prepare the samples in the laboratory.
Puppala et al. [48] recommended a minimum 28 day UCS value of 1.034 MPa (150 psi) for ground improvement under embankments and earth structures via the DSM technique when cement is used as the binder. Therefore, the treated soil in the current research fulfils the minimum requirement of UCS.

7.2. Water/Binder Proportion Effect on UCS

In order to study the impact of water/binder (w/b) proportion on the shear strength of the stabilized soil, different w/b ratios of were selected. The literature review shows that the w/b proportion can vary from 0.8 to 1.5 [11,12,13,32]. Based on the literature, five different w/b proportions were selected in the current study: 0.7, 0.9, 1.1, 1.3 and 1.5. Figure 7 shows the different sample formation after preparation and extraction from the mold. The sample with a w/b proportion of 1.3 is intact and uniform in comparison with the other ratios. W/b proportions of 0.7 and 0.9 were not sufficient to fill all the specimen voids and acquire a uniform mixture. For the w/b ratio of 1.5, clear voids were seen, which indicate bleeding due to the presence of extra water. Figure 8 presents the impact of w/b on the UCS of the treated soils. The error bars demonstrate minimal fluctuations in the test results. It is obvious that as the w/b proportion increase, the UCS increases up to a w/b proportion of 0.9 and then starts to decrease after that. Although w/b ratios 0.9 shows highest strength 2080 kPa, but due to the disintegration of the sample mass, such ratios cannot be used. The sample with a w/b ratio of 1.3 shows strength equal to 1880 kPa, which is the highest strength with intact and uniform appearance. For the w/b ratio of 1.5, the strength suddenly dropped to 1334 kPa. Similar trend was reported by (Szymkiewicz et al. and Daniel et al.) [49,50]. Thus, the w/b proportion of 1.3 can produce suitable workable mixtures with acceptable UCS.

7.3. Dry Density Measurements

The dry density of five different treated specimens, 100C0MP, 90C10MP, 80C20MP, 70C30MP, and 50C50MP, were measured, after a 7-day curing period. The results revealed that the 10, 20 and 30% replacement ratios had an important impact on the dry density of the treated specimens, as depicted in Figure 9. The error bars resulting from the statical analysis demonstrates that undesirable variations in the test results are marginal. The dry density of the treated samples improved proportionally with the increase in the MP replacement ratio up to 30%. The highest dry density values equal to 1244 and 1241 kg/m3 were captured for 80C20MP and 70C30MP, respectively. An increase of up to 1.13% in the dry density of the treated samples was encountered at a MP replacement ratio of 20% from the cement only samples. This indicates that more dense samples may be attributed to well particles size gradation. In addition, this sample showed the highest strength values, whereas at 50% MP replacement ratio, the bulk density reduced by 2.52% compared to the cement only specimen. Such a reduction may be due to the MP which was in excess of the amount required to fill the voids in the treated samples. The proportion of MP beyond 30% did not improve the samples density.

7.4. UPV Test Results

The ultrasonic pulse velocity (UPV) test measures the time taken by ultrasonic pulses to travel from one surface of an element to the other. The density and elastic properties of a material determine the transit time of ultrasonic pulses. Thus, a high velocity value indicates that the sample structure has achieved good densification and homogeneity, permitting the waves to be applied in the specimens to move quickly and boosting the UPV values.
After a 7-day curing period, the UPV test was conducted on five different samples: 100C0MP, 90C10MP, 80C20MP, 70C30MP, and 50C50MP. As illustrated in Figure 10, MP significantly influenced the increase in ultrasonic velocity. The error bars resulting from the statistical analysis demonstrates negligeable marginal in the test results. The samples with 10, 20, and 30% MP showed greater UPV values than the sample with only cement, meanwhile the specimen with 50% MP showed significantly low UPV values. This result is perfectly in line with the UCS results. The high wave speed of the material particles demonstrates that MP is an excellent filler material. Furthermore, it is possible to conclude that a 30% MP replacement ratio is the optimal percentage needed to fill the pore space.

7.5. Durability Test Results

The purpose of this test is to assess the stability of the treated soil during long-term exposure to severe environment conditions. The durability test has been conducted on four selected samples (100C0MP, 90C10MP, 80C20MP and 70C30MP) based on the UCS test results. The samples were prepared and then cured for 7 days. Afterwards, 12 wet/dry cycles and brushing were applied on the selected samples. The volume and weight loss due to wetting and drying cycles were recorded. The results are presented in Figure 11 and Figure 12, respectively. The results revealed that the weight loss is equal to 2.60 2.93, 3.47 and 4.04% for 100C0MP, 90C10MP, 80C20MP, and 70C30MP, respectively. In terms of volume loss, after 12 wetting and drying cycles with brushing, the samples shrunk to 1.82, 2.08, 2.34, and 2.61% for 100C0MP, 90C10MP, 80C20MP, and 70C30MP, respectively. The maximum permissible loss of weight is 14% and 11% according to the Portland Cement Association (PCA) and the USA Corps of Engineers (USACE), respectively. Hence, the recorded weight loss for all samples is acceptable and within the limits allowed.

7.6. Microstructural Analysis Using SEM

The microstructure analysis has been performed for plain soil and treated soil specimens with cement and MP (100C0MP, 90C10MP, 80C20MP, 70C30MP and 50C50MP) after 7 days of curing time. The samples were prepared as per the mentioned methodology for UCS, UPV, and durability test using deep soil mixing apparatus. The samples were examined without any kind of loading. Only 7 days curing period was considered for the samples. The examined surface of the samples was not exposed to any kind of cutting or trimming. A small grove was gently formed in the middle of the sample which could be easily cut by hand. To provide surface conductivity, the samples were coated with a thin layer of gold. The representative images are shown in Figure 13, Figure 14, Figure 15, Figure 16, Figure 17 and Figure 18. All the specimens were examined at 5000× magnification.
The SEM image of plain soil demonstrates a randomly oriented system with visible various voids formed by partially clothed sand and silt interaction (Figure 13a). Figure 13b depicts the energy dispersive X-ray (EDX) outcomes for plain soil. The presence of Si, Mg, Fe, Ca, K, Cl, and Na is revealed through EDX analysis, with weight fraction of 14.30, 3.40, 3.71, 2.69, 0.96, 0.91, and 0.39%, respectively. The presence of silicon, calcium, and chloride as core elements was discovered; the presence of potassium, magnesium, and iron is attributed to iron oxides and clay inclusions as cementing materials.
The SEM images of treated soil with 100C0MP, 90C10MP, 80C20MP, and 70C30MP are shown in Figure 14, Figure 15, Figure 16, Figure 17 and Figure 18. The figures clearly demonstrate a consistent dense structure owing to the hydration process as evidenced by the fibrous needles (C-S-H) at various locations. Furthermore, the voids are reduced in the treated samples. However, as the percentage of MP increases up to 30%, the void sizes decrease. The treated 80C20MP and 70C30MP samples exhibit dense soil structure with almost no visible voids. The microstructure of these samples is denser than the other treated specimens. On the other hand, the SEM image of treated soil with 50C50MP illustrates a non-uniform structure. Since there is a lack of cement hydration, fibrous needles (C-S-H) may not exist.
Summary of the EDX analysis results of the treated soil is presented in Table 6. The indicated percentages of calcium (Ca) and silicon (Si) are because of the C-S-H gel produced due to OPC and MP addition. It is clearly mentioned that percentages of calcium (Ca) are increased while percentages of MP replacement increased up to 30% only. The microstructure analysis of the treated samples is in good harmony with the UCS values.

8. Conclusions

A successful scaled-laboratory apparatus similar to the field deep soil mixing techniques to improve the saline silt soil was presented. The soil type together with the methodology of laboratory samples preparation play a significant role in the strength of the treated soil. In addition, the present study assessed the potential of utilization of MP as a partial replacement to cement in saline silt soil stabilization. Consequently, the following conclusions are derived:
  • The developed DSM apparatus succeeded in forming an intact and uniform appearance of the cylindrical samples;
  • Employment of marble powder as a wastage material with a replacement proportion of cement ranging from (20% to 30%) and 30% total binder ratio showed a significant increase in the UCS values owing to the gradual cementitious compounds’ formation (calcium aluminate hydrate and calcium silicate hydrate);
  • A water/binder ratio ranging from 1.1 to 1.3 showed intact and uniform samples with acceptable UCS values;
  • The UPV values for samples with 20% and 30% MP in the treated samples exhibited the highest velocity due to the high density of the samples;
  • The dry density measurements revealed that the 80C:20MP and 70C:30MP samples showed the highest values;
  • The selected sample with 20% to 30% MP meets the durability requirements;
  • The microstructure analysis of the treated samples is in good harmony with the UCS values;
  • According to the findings, the optimum binder proportion is 30% and consists of (70%C:30%MP) with a w/b ratio equal to 1.3;
  • Marble powder is explored as a cleaner alternative with low carbon dioxide emission to be employed in a deep soil mixing industry.

9. Recommendation for Future Work

For saline soil, further testing plan may be applied, such as California bearing ratio (CBR) and Triaxial test. The current study applied the wet deep mixing technique due to the natural water content of the saline silt soil. In forthcoming work, it is recommended to try a dry deep soil mixing method to examine saline soil having high water content which may exceed 60%. Also, the soil’s initial void ratio and salt content may have an important effect on the selection of the required binder amount. Many wastage materials such as Cement kiln Dust (CKD) can be investigated as a partial replacement of cement. In case of the non-efficiency of the wastage material, the addition of a chemical activator can be studied.

Author Contributions

Conceptualization, M.A.H., Y.M. and M.A.-A.; methodology, M.A.H. and Y.M.; software, M.A.H.; validation, M.A.H. and Y.M.; resources, M.A.-A., M.A.H. and Y.M.; writing—original draft preparation, M.A.H.; writing—review and editing, Y.M. and M.A.-A.; supervision, Y.M. and M.A.-A. All authors have read and agreed to the published version of the manuscript.

Funding

The authors acknowledge the financial support given by Sultan Qaboos University (SQU). The APC was funded by SQU.

Data Availability Statement

Not Applicable.

Conflicts of Interest

The authors declare no conflict of interest.

References

  1. Al-Amoudi, O.S.B. Chemical stabilization of sabkha soils at high moisture contents. Eng. Geol. 1994, 36, 279–291. [Google Scholar] [CrossRef]
  2. Elsawy, M.B.D.; Lakhouit, A.A. A review on the impact of salinity on foundation soil of coastal infrastructures and its implications to north of Red Sea coastal constructions. Arab. J. Geosci. 2020, 13, 555. [Google Scholar] [CrossRef]
  3. Shuja, D.; Rollakanti, C.R.; Poloju, K.K.; Joe, A. An experimental investigation on -stabilization of sabkha soils with cement and Cement Kiln Dust (CKD) in Sultanate of Oman. Mater. Today Proc. 2022, 65, 1033–1039. [Google Scholar] [CrossRef]
  4. Al-Alawi, H.S.; Ganiyu, A.A.; Badr, A. Stabilisation of Sohar’s sabkha soil using waste gypsum plasterboard. IOP Conf. Ser. Mater. Sci. Eng. 2020, 849, 012028. [Google Scholar] [CrossRef]
  5. Al-Homidy, A.A.; Dahim, M.H.; El Aal, A.K.A. Improvement of geotechnical properties of sabkha soil utilizing cement kiln dust. J. Rock Mech. Geotech. Eng. 2017, 9, 749–760. [Google Scholar] [CrossRef]
  6. Moayed, R.Z.; Izadi, E.; Heidari, S. Stabilization of saline silty sand using lime and micro silica. J. Cent. S. Univ. 2012, 19, 3006–3011. [Google Scholar] [CrossRef]
  7. Mohamedzein, Y.E.A.; Al-Rawas, A.A. Cement-stabilization of sabkha soils from Al-Auzayba, Sultanate of Oman. Geot. Geol. Eng. 2011, 29, 999–1008. [Google Scholar] [CrossRef]
  8. Han, J. Principles and Practice of Ground Improvement; Wiley: Hoboken, NJ, USA, 2015. [Google Scholar]
  9. Jung, C.; Ceglarek, R.; Clauvelin, T.; Ayeldeen, M.; Kim, D. Deep soil mixing in Sabkha soils for foundation support in United Arab Emirates. Int. J. Geosynth. Ground Eng. 2020, 6, 3. [Google Scholar] [CrossRef]
  10. Esmaeili, M.; Astaraki, F.; Yaghouti, H.; Rad, M.M. Laboratory Investigation on the Effect of Microsilica Additive on the Mechanical Behavior of Deep Soil Mixing Columns in Saline Dry Sand. Period. Polytech. Civ. Eng. 2021, 65, 1080–1091. [Google Scholar] [CrossRef]
  11. Farouk, A.; Shahien, M.M. Ground improvement using soil–cement columns: Experimental investigation. Alex. Eng. J. 2013, 52, 733–740. [Google Scholar] [CrossRef]
  12. Canakci, H.; Güllü, H.; Dwle, M.I.K. Effect of glass powder added grout for deep mixing of marginal sand with clay. Arab. J. Sci. Eng. 2018, 43, 1583–1595. [Google Scholar] [CrossRef]
  13. Alnunu, M.Z.; Nalbantoglu, Z. Performance of using waste marble dust for the improvement of loose sand in deep soil mixing. Arab. J. Sci. Eng. 2021, 47, 4681–4694. [Google Scholar] [CrossRef]
  14. Puppala, A.J.; Madhyannapu, R.S.; Nazarian, S. Full-scale field studies to evaluate deep soil mixing in stabilizing expansive soils. J. Geotech. Geoenviron. Eng. 2022, 148, 04021163. [Google Scholar] [CrossRef]
  15. Chang, I.; Im, J.; Cho, G.C. Introduction of microbial biopolymers in soil treatment for future environmentally-friendly and sustainable geotechnical engineering. Sustainability 2016, 8, 251. [Google Scholar] [CrossRef]
  16. Oss, H.G.V. Cement Statistics and Information; US Geological Survey: Reston, VA, USA, 2014.
  17. Capuano, L. Us Energy Information Administration’s International Energy Outlook 2020 (Ieo2020); US Department of Energy: Washington, DC, USA, 2020; p. 7.
  18. Ruiz-Sánchez, A.; Sánchez-Polo, M.; Rozalen, M. Waste marble dust: An interesting residue to produce cement. Constr. Build. Mater. 2019, 224, 99–108. [Google Scholar] [CrossRef]
  19. Kavas, T.; Olgun, A. Properties of cement and mortar incorporating marble dust and crushed brick. Ceram. Silik. 2008, 52, 24. [Google Scholar]
  20. Selim, F.A.; Hashem, F.S.; Amin, M.S. Mechanical, microstructural and acid resistance aspects of improved hardened Portland cement pastes incorporating marble dust and fine kaolinite sand. Constr. Build. Mater. 2020, 251, 118992. [Google Scholar] [CrossRef]
  21. Awad, A.H.; Abdellatif, M.H. Assessment of mechanical and physical properties of LDPE reinforced with marble dust. Compos. Part B Eng. 2019, 173, 106948. [Google Scholar] [CrossRef]
  22. Bhadriraju, V.; Puppala, A.J.; Madhyannapu, R.S.; Williammee, R. Laboratory procedure to obtain well-mixed soil binder samples of medium stiff to stiff expansive clayey soil for deep soil mixing simulation. Geotech. Test. J. 2007, 31, 225–238. [Google Scholar]
  23. Frikha, W.; Zargayouna, H.; Boussetta, S.; Bouassida, M. Experimental study of Tunis soft soil improved by deep mixing column. Geotech. Geol. Eng. 2017, 35, 931–947. [Google Scholar] [CrossRef]
  24. Porbaha, A.; Shibuya, S.; Kishida, T. State of the art in deep mixing technology. Part III: Geomaterial characterization. Proc. Inst. Civ. Eng.-Ground Improv. 2000, 4, 91–110. [Google Scholar] [CrossRef]
  25. ASTM D6913-04; Standard Test Methods for Particle Size Distribution (Gradation) of Soils Using Sieve Analysis. ASTM International: West Conshohocken, PA, USA, 2009. [CrossRef]
  26. ASTM D4318-10; Standard Test Methods for Liquid Limit, Plastic Limit, and Plasticity Index of Soils. ASTM International: West Conshohocken, PA, USA, 2010. [CrossRef]
  27. ASTM D698-12e1; Standard Test Methods for Laboratory Compaction Characteristics of Soil Using Standard Effort (12,400 ft-lbf/ft3 (600 kN-m/m3)). ASTM International: West Conshohocken, PA, USA, 2012.
  28. ASTM D1556-07; Standard Test Method for Density and Unit Weight of Soil in Place by the Sand-Cone Method. American Society for Testing and Materials: West Conshohocken, PA, USA, 2007.
  29. ASTM ASTM C150; Standard specification for Portland cement. Annual Book of ASTM Standards. ASTM International: West Conshohocken, PA, USA, 2001.
  30. ASTM D854-14; Standard Test Methods for Specific Gravity of Soil Solids by Water Pycnometer. ASTM International: West Conshohocken, PA, USA, 2014. [CrossRef]
  31. Topolnicki, M. General overview and advances in Deep Soil Mixing. In Proceedings of the XXIV Geotechnical Conference of Torino Design, Construction and Controls of Soil Improvement Systems, Torino, Italy, 25–26 February 2016; pp. 25–26. [Google Scholar]
  32. Bruce, M.E.C.; Berg, R.R.; Collin, J.G.; Filz, G.M.; Terashi, M.; Yang, D.S. Federal Highway Administration Design Manual: Deep Mixing for Embankment and Foundation Support (FHWA-HRT-13-046); Federal Highway Administration: Washington, DC, USA, 2013.
  33. Bushra, I.; Robinson, R.G. Effect of fly ash on cement admixture for a low plasticity marine soil. Adv. Civ. Eng. Mater. 2013, 2, 608–621. [Google Scholar] [CrossRef]
  34. Pourakbar, S.; Huat, B.B.; Asadi, A.; Fasihnikoutalab, M.H. Model study of alkali-activated waste binder for soil stabilization. Int. J. Geosyn. Ground Eng. 2016, 2, 35. [Google Scholar] [CrossRef]
  35. Arulrajah, A.; Yaghoubi, M.; Disfani, M.M.; Horpibulsuk, S.; Bo, M.W.; Leong, M. Evaluation of fly ash-and slag-based geopolymers for the improvement of a soft marine clay by deep soil mixing. Soils Found. 2018, 58, 1358–1370. [Google Scholar] [CrossRef]
  36. Smith, K.W.G. Some problems of salts in semi-arid soils for stabilization with cement. In Proceedings of the ARRB Conference; Australian Road Research Board: Canberra, Australia, 1962; Volume 1, pp. 1078–1084. [Google Scholar]
  37. ASTM D1633-17; Standard Test Methods for Compressive Strength of Molded Soil-Cement Cylinders. ASTM International: West Conshohocken, PA, USA, 2017.
  38. ASTM D7263-09; Standard Test Methods for Laboratory Determination of Density (Unit Weight) of Soil Specimens. ASTM International: West Conshohocken, PA, USA, 2009.
  39. ASTM D559/D559M-15; Standard Test Methods for Wetting and Drying Compacted Soil-Cement Mixtures. ASTM International: West Conshohocken, PA, USA, 2015. [CrossRef]
  40. ASTM C 597; Standard Test Method for Pulse Velocity through Concrete. American Society for Testing and Materials: West Conshohocken, PA, USA, 2016.
  41. Toubal Seghir, N.; Mellas, M.; Sadowski, Ł.; Krolicka, A.; Żak, A. The effect of curing conditions on the properties of cement-based composites blended with waste marble dust. JOM 2019, 71, 1002–1015. [Google Scholar] [CrossRef]
  42. Ergün, A. Effects of the usage of diatomite and waste marble powder as partial replacement of cement on the mechanical properties of concrete. Constr. Build. Mater. 2011, 25, 806–812. [Google Scholar] [CrossRef]
  43. Arel, H.Ş. Recyclability of waste marble in concrete production. J. Clean. Prod. 2016, 131, 179–188. [Google Scholar] [CrossRef]
  44. Ulubeyli, G.C.; Artir, R. Properties of hardened concrete produced by waste marble powder. Procedia-Soc. Behav. Sci. 2015, 195, 2181–2190. [Google Scholar] [CrossRef]
  45. Gesoğlu, M.; Güneyisi, E.; Kocabağ, M.E.; Bayram, V.; Mermerdaş, K. Fresh and hardened characteristics of self-compacting concretes made with combined use of marble powder, limestone filler, and fly ash. Constr. Build. Mater. 2012, 37, 160–170. [Google Scholar] [CrossRef]
  46. Kumar, S.; Babu, V.; Sharmila, S.M.R. Soil Stabilization Using Marble Dust. Int. J. Civ. Eng. Technol. 2017, 8, 1705–1712. Available online: http://www.iaeme.com/IJCIE (accessed on 15 May 2023).
  47. Gurbuz, A. Marble powder to stabilise clayey soils in sub-bases for road construction. Road Mater. Pavement Des. 2015, 16, 481–492. [Google Scholar] [CrossRef]
  48. Puppala, A.J.; Madhyannapu, R.S.; Nazarian, S. Special Specification for Deep Soil Mixing (No. 0-5179-P1); University of Texas at Arlington: Arlington, TX, USA, 2008. [Google Scholar]
  49. Szymkiewicz, F.; Tamga, F.S.; Kouby, A.L.; Reiffsteck, P. Optimization of strength and homogeneity of deep mixing material by the determination of workability limit and optimum water content. Can. Geotech. J. 2013, 50, 1034–1043. [Google Scholar] [CrossRef]
  50. Ribeiro, D.; Néri, R.; Cardoso, R. Influence of Water Content in the UCS of Soil-Cement Mixtures for Different Cement Dosages. Advances in Transportation Geotechnics 3. In Proceedings of the 3rd International Conference on Transportation Geotechnics (ICTG 2016), Guimaraes, Portugal, 4–7 September 2016. [Google Scholar]
Figure 1. Particle size gradation analysis for the soil, OPC and MP.
Civileng 04 00057 g001
Figure 2. The developed deep soil mixing apparatus.
Civileng 04 00057 g002
Figure 3. A schematic flow chart of the methodology, testing and research objective.
Civileng 04 00057 g003
Figure 4. Stress/strain relationship for different OPC/MP treated soil.
Civileng 04 00057 g004
Figure 5. MP replacement effect on the treated soil UCS.
Civileng 04 00057 g005
Figure 6. Comparison between published studies [10,35,48] and the current study in terms of UCS value.
Civileng 04 00057 g006
Figure 7. Different w/b ratios of treated soil samples.
Civileng 04 00057 g007
Figure 8. Effect of w/b ratio on USC of treated soil.
Civileng 04 00057 g008
Figure 9. Treated sample bulk density measurements.
Civileng 04 00057 g009
Figure 10. Velocity measurements for treated samples with different MP contents.
Civileng 04 00057 g010
Figure 11. Weight loss of treated samples due to wetting and drying with brushing cycles.
Civileng 04 00057 g011
Figure 12. Volume loss due to wetting and drying with brushing cycles of treated samples.
Civileng 04 00057 g012
Figure 13. (a) SEM image for untreated soil. (b) EDX analysis for treated soil.
Civileng 04 00057 g013
Figure 14. (a) SEM image for 100C0MP. (b) EDX analysis for 100C0MP.
Civileng 04 00057 g014
Figure 15. (a) SEM image for 90C10MP. (b) EDX analysis for 90C10MP.
Civileng 04 00057 g015
Figure 16. (a) SEM image for 80C20MP. (b) EDX analysis for 80C20MP.
Civileng 04 00057 g016
Figure 17. (a) SEM image for 70C30MP. (b) EDX analysis for 70C30MP.
Civileng 04 00057 g017
Figure 18. (a) SEM image for 50C50MP. (b) EDX analysis for 50C50MP.
Civileng 04 00057 g018
Table 1. Basic properties of the soil and MP.
Physical PropertiesSoilMP
Liquid Limit (%)3536
Plastic Limit (%)2121
Plasticity Index1415
Specific Gravity2.672.69
Maximum Dry Unit Weight (kN/m3)1.88-
Optimum Water Content (%)13.70-
Field Dry Unit Weight (kN/m3)1.54-
Field Water Content (%)18-
Salt Proportion (%)20-
Table 2. Chemical composition of the soil, OPC and MP.
Chemical CompositionSoilOPCMP
Oxide *
SiO246.020.842.5
CaO20.765.19.9
MgO11.11.911.7
Al2O310.74.617.4
Fe2O37.24.57.5
Na2O2.40.21.5
K2O1.10.30.1
TiO20.80.40.3
P2O50.10.10.1
MnO0.10.10.1
Other Properties
Loss on ignition (LOI) (%)2229
* In%.
Table 3. The proportions of different binders.
No.MaterialsTotal Binder (%)Mixture IDPercentage from the Total Dry Solids
1Soil Only-Untreated SoilSoil in its natural water content
2Soil, OPC and MP30%100C0MP(Soil: OPC: MP)70%:30%:0%
390C10MP(Soil: OPC: MP)70%:27%:3%
480C20MP(Soil: OPC: MP)70%:24%:6%
570C30MP(Soil: OPC: MP)70%:21%:9%
650C50MP(Soil: OPC: MP)70%:15%:15%
730C70MP(Soil: OPC: MP)70%:9%:21%
Note: Water/binder ratio for all mixtures is 1.3.
Table 4. The proportions of different w/b ratios.
No.Binder% (Cement: MP)w/b (%)Mixture ID
130% (70C30MP)0.70.7W70C30MP
20.90.9W70C30MP
31.11.1W70C30MP
41.31.3W70C30MP
51.51.5W70C30MP
Note: For total binder content of 30%.
Table 5. Statistical analysis of unconfined compressive strength results.
Sr.Sample IDMax. UCS (kPa)Min. UCS (kPa)Avg. Value (kPa)Standard Deviation (kPa)Absolute Variation (kPa)
1100C0MP1,2,31625.31500.31562.862.5125.0
290C10MP1,2,31767.71664.81716.251.5103.0
380C20MP1,2,31906.41813.41859.946.593.0
470C30MP1,2,31839.31725.21782.257.0114.1
550C50MP1,2,3893.2866.8880.013.226.4
630C70MP1,2,3658.4623.7641.017.334.6
Table 6. Untreated and different treated soil EDX analysis results.
ElementSoil100C0MP90C10MP80C20MP70C30MP50C50MP
Weight (%)
Ca2.6918.2920.9123.6728.8017.06
Si14.3010.119.2410.5716.8410.23
Mg3.42.301.852.695.753.55
Fe3.711.871.634.012.964.75
Cl0.912.032.213.691.801.26
Na0.390.55-0.800.68-
K0.960.810.290.690.400.32
Disclaimer/Publisher’s Note: The statements, opinions and data contained in all publications are solely those of the individual author(s) and contributor(s) and not of MDPI and/or the editor(s). MDPI and/or the editor(s) disclaim responsibility for any injury to people or property resulting from any ideas, methods, instructions or products referred to in the content.

