Article

Assessment of Infrastructure Reliability in Expansive Clays Using Bayesian Belief Network

1
Industrial Systems Engineering, Faculty of Engineering and Applied Science, University of Regina, 3737 Wascana Parkway, Regina, SK S4S 0A2, Canada
2
Environmental Systems Engineering, Faculty of Engineering and Applied Science, University of Regina, 3737 Wascana Parkway, Regina, SK S4S 0A2, Canada
*
Author to whom correspondence should be addressed.
CivilEng 2022, 3(4), 1126-1136; https://doi.org/10.3390/civileng3040064
Submission received: 1 November 2022 / Revised: 12 December 2022 / Accepted: 15 December 2022 / Published: 18 December 2022
(This article belongs to the Special Issue Next Generation Infrastructure)

Abstract

:
Civil infrastructure supported by expansive clays is severely affected by extensive volumetric deformations. The reliability prediction of such facilities is quite challenging because of the complex interactions between several contributing factors, such as a scarcity of data, a lack of analytical equations, correlations between quantitative and qualitative information, and data integration. The main contribution of this research is the development of a modeling approach based on the Bayesian belief network. The modeling results highlight that facility age is the most critical parameter (23% variance), followed by facility type (1.37% variance), for all the investigated types of infrastructure, namely road embankments, buried pipelines, and residential housing. Likewise, the results of sensitivity analysis and extreme scenario analysis indicate that the new method is capable of predicting infrastructure reliability and the assessments were found to be in agreement with expected field behavior. The proposed model is useful in decision making related to civil infrastructure management in expansive clays.

1. Introduction

Expansive clays constitute a class of problematic soils that exhibit swelling and shrinkage due to changes in water content. Civil infrastructure supported by such soils experiences either volumetric deformations due to soil movement or stresses when such movements are restrained [1]. Successive wet–dry cycles due to seasonal weather variations result in gradual fatigue in structural components and the eventual breakage of the facilities, such as municipal roads [2], pipeline networks [3], and residential housing [4]. This is especially true for Regina (Saskatchewan, Canada), where the interplay of a glacio-lacustrine expansive clay and a dry continental climate results in extensive damages to lightly loaded structures at the ground surface and at shallow depths [5]. Furthermore, extreme weather events such as high-intensity rainfall and long-lasting droughts have been observed to occur more frequently in the region [6]. Given the continuously increasing maintenance costs, there is a need to predict the reliability of aging infrastructure supported by expansive clays.
The prediction of infrastructure reliability in expansive soil deposits is quite challenging because of the complex interactions between several contributing factors, such as soil properties, hydraulic parameters, ground conditions, and infrastructure type. The nonlinear relationships are further complicated by the following: (i) the scarcity of experimental data; (ii) the lack of analytical equations; (iii) the lack of correlation between quantitative and qualitative information; and (iv) the lack of integration of data from all sources. Clearly, there is a knowledge gap in effectively capturing these wide-ranging issues.
The various challenges can be addressed using different methodologies, such as analytic network processes, fuzzy cognitive maps, artificial neural networks, and the Bayesian belief network (BNN). Qualitative and comparative evaluations of the available methods [7,8] demonstrated that a BBN-based framework is best suited for infrastructure reliability. Probabilistic graphical approaches based on this method can characterize the uncertainty associated with variables [9]; provide informed decisions in cases of imprecise, incomplete, and ambiguous information [10]; and are flexible to conduct diagnostic analysis (to determine the reasoning for possible causes by observing the effect) or predictive analysis (to determine the reasoning for possible effects by observing the cause) [11,12].
The main purpose of this research was to develop a BBN-based model for the prediction of infrastructure reliability in expansive clays. The BBN-based model is described from the perspective of the theoretical background, parameter selection, data collection and analysis, and model architecture. The modeling results are presented based on both quantitative (sensitivity analysis) and qualitative (extreme scenario analysis) approaches.

2. Modeling of Bayesian Belief Network

2.1. Parameter Selection

Swelling and shrinkage in the expansive Regina clay depend on the following distinct but interrelated parameters: (i) soil geology and geotechnical properties [13,14]; (ii) ground cover and vegetation type [15,16]; (iii) seasonal weather and environmental conditions [17,18]; and (iv) hydrologic conditions and depth below surface [19,20]. Based on these factors, a simplified approach was adopted for the selection of parameters affecting volume changes in the expansive clay. First, soil properties were considered to be constant across the city, although there is some variation in the geological deposit in terms of composition in the vertical and lateral directions. Second, ground cover was only considered at two levels, namely an exposed surface (lawns, fields, cemeteries) that allows direct interaction with the atmosphere to allow water migration into and out of the soil, and a covered surface (roads, houses, buildings) that precludes infiltration and evaporation. A similar rationale was adopted for vegetation—that is, the presence of a tree supports transpiration and vice versa. Third, the meteorological parameters of precipitation and evaporation (temperature, humidity, wind, radiation) were collectively represented in terms of ground water content. Environmental conditions such as heat from buildings, corrosion from pipes, and deicing salts from roads were not included. Fourth, hydrologic conditions were identified as either free drainage with no water flowing through the soil or surface ponding facilitating water migration through the soil. Likewise, the depth below surface was considered up to 3.0 m, beyond which the overburden stress cancels out the swelling deformations [21].
The factors affecting infrastructure integrity in Regina included the type and age of the facility. Three types of lightly loaded facilities were selected, namely surface roads, buried pipelines, and residential units. Likewise, a service life of up to 70 years was used to incorporate age. Parameters such as material type, deterioration mechanism, and exposure conditions were considered to be included in the age of the various facilities.

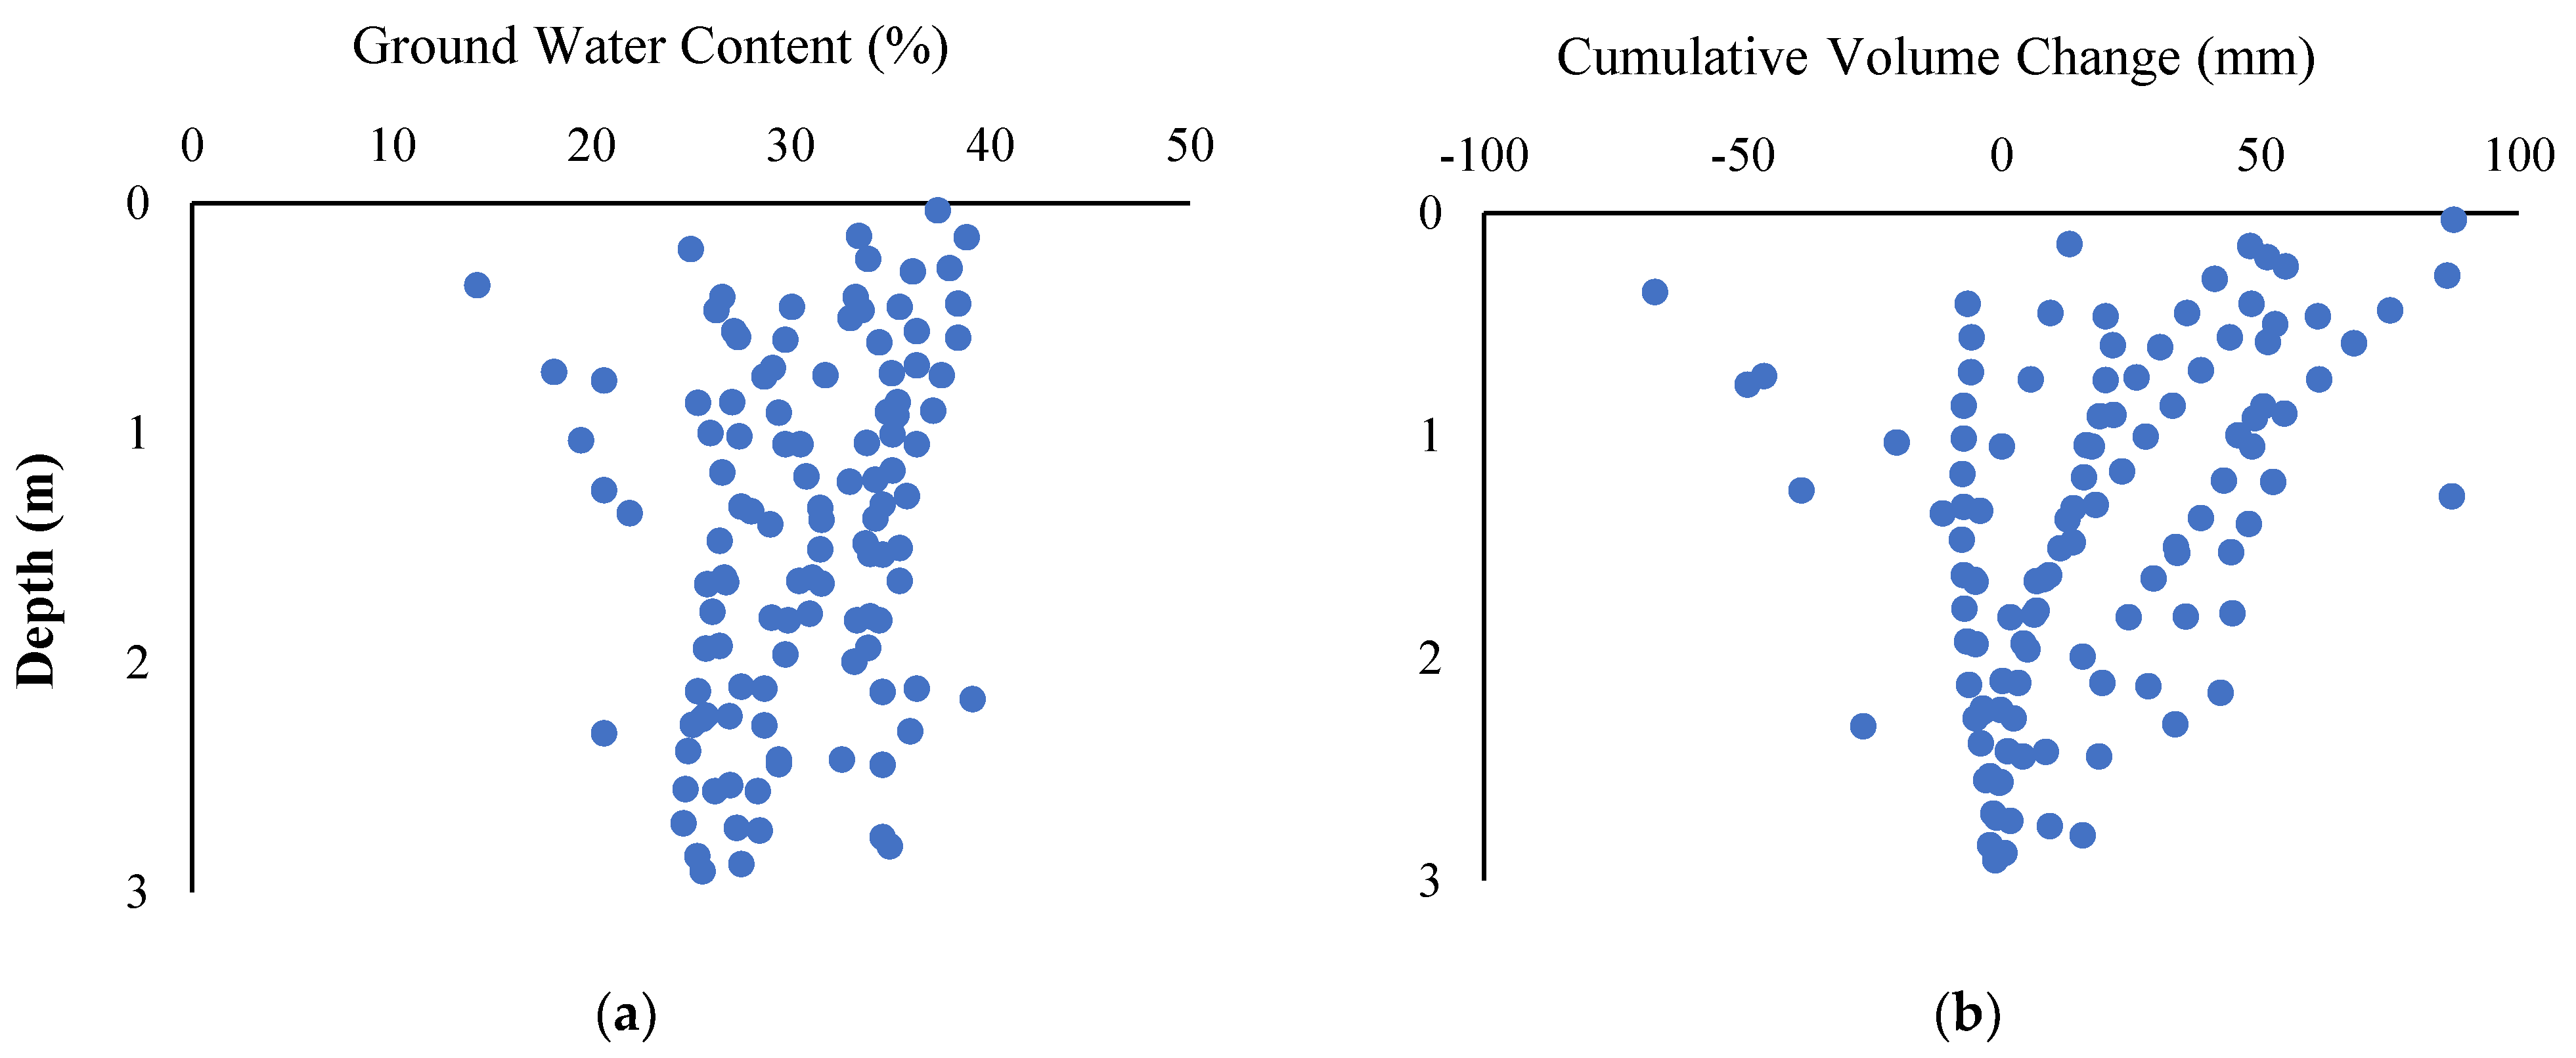
2.2. Data Collection and Analysis

Figure 1 gives field data in the investigated expansive clay profile. The ground water content (Figure 1a) from March to November in different years were reported by Azam et al. [22], Fredlund [23], Hamilton [18], Hu and Vu [16], Hu et al. [24], and Yoshida et al. [21]. Compiled by Ito and Azam [25], the water content depicted a vague funnel-like shape around the plastic limit (27% ± 5), with large variations at the surface and a gradual decrease with depth. Using the plastic limit as the datum, the change in water content was used to determine the cumulative volume change (Figure 1b) following the method developed by Ito and Azam [25]. This figure shows a distinct funnel-like shape with up to 100 mm of volumetric deformations close to the surface, and these values gradually diminished around a 3.0 m depth. Furthermore, Figure 2 summarizes the field data in terms of histograms for ground water content, depth below ground, volume change, and cumulative change. For each of the parameters, the histograms pertain to six distinct levels, thereby gradually capturing field behavior.

2.3. Model Architecture

A BBN-based modeling approach was used. Conceptually, the process is to perform probabilistic inferences or belief updating based on data or observations using the Bayes theorem [26]. Figure 3 shows the proposed BBN-based model for predicting infrastructure reliability in expansive clays. The qualitative component of the model comprised nodes to identify variables of interest and links to denote conditional relationships among the variables [10,27]. The figure shows that nine (9) independent or parent nodes and five (5) dependent or child nodes were connected with fourteen (14) causal links. Likewise, the quantitative component of the model was presented as a set of conditional probabilities for each child node based on the information related to the parent node [28]. The states and units of both the parent and the child nodes are summarized in Table 1.
The model architecture was developed using the Netica software [29]. The prior and posterior probabilities of the nodes were calculated after establishing the causal diagram. The updated probability for the m number of mutually exclusive variables Vi (i=1,2,…,m) and the given data D was determined according to the following equation [9]:
p ( V j | D ) = p ( D | V j ) × p ( V j ) i = 1 m p ( D | V i ) × p ( V i )
In the above equation, p(Vj|D) represents the posterior probability; p(Vj) refers to the prior probability; and p(D|Vj) denotes the conditional probability considering that Vj is true. The constant value of the denominator represents the total probability.
The dependencies between the child nodes and the parent nodes were quantified using a Conditional Probability Table (CPT). The CPT values of the child nodes were based on the training of exiting field data following the procedure outlined in Kabir et al. [30] and Tang and McCabe [31], as well as on expert judgment following the method given by Cárdenas et al. [32] and Cai et al. [33].
Referring to Figure 3, the CPT values of the GWC, the Delta_GWC, and the Depth nodes were determined based on the compiled data presented in Ito and Azam [25]. Utilizing constant values for the Swell–Shrink Modulus (1.2) and Ratio of Vertical to Horizontal Movement (0.33), an analytical equation given in Ito and Azam [25] was used to calculate the CPT values of the Volume Change node. In contrast, the CPT values for Plantation, Ground Cover, and Ground Slope were considered to have uniform probabilities and, based on expert judgement, collectively affected Flow Through. The Volume Change and Flow Through were used to generate the CPT values for the Cum_Volume_Change node based on an expectation-maximization algorithm [29,34]. Furthermore, the CPT values for Age and Facility Type were considered to have uniform probabilities and collectively resulted in the Infrastructure_Stability node. Based on expert judgement, the Cum_Volume_Change node and the Infrastructure_Stability node were analyzed to estimate Reliability.
Table 2 presents an example of the determination of the conditional probabilities based on knowledge elicitation. The child node Flow Through depends on parent nodes Ground Cover, Ground Slope, and Plantation. Using an exposed surface, a slope that facilitates free drainage and the presence of trees, the corresponding CPT values for Flow Through are (33, 67). These values indicate that the conditional probabilities for Flow Through being in the state of “Yes” and “No” are 33% and 67%, respectively. The CPTs of the Infrastructure Stability and Reliability nodes were calculated in a similar way. A total of 487 conditional probabilities were generated.

3. Results and Discussion
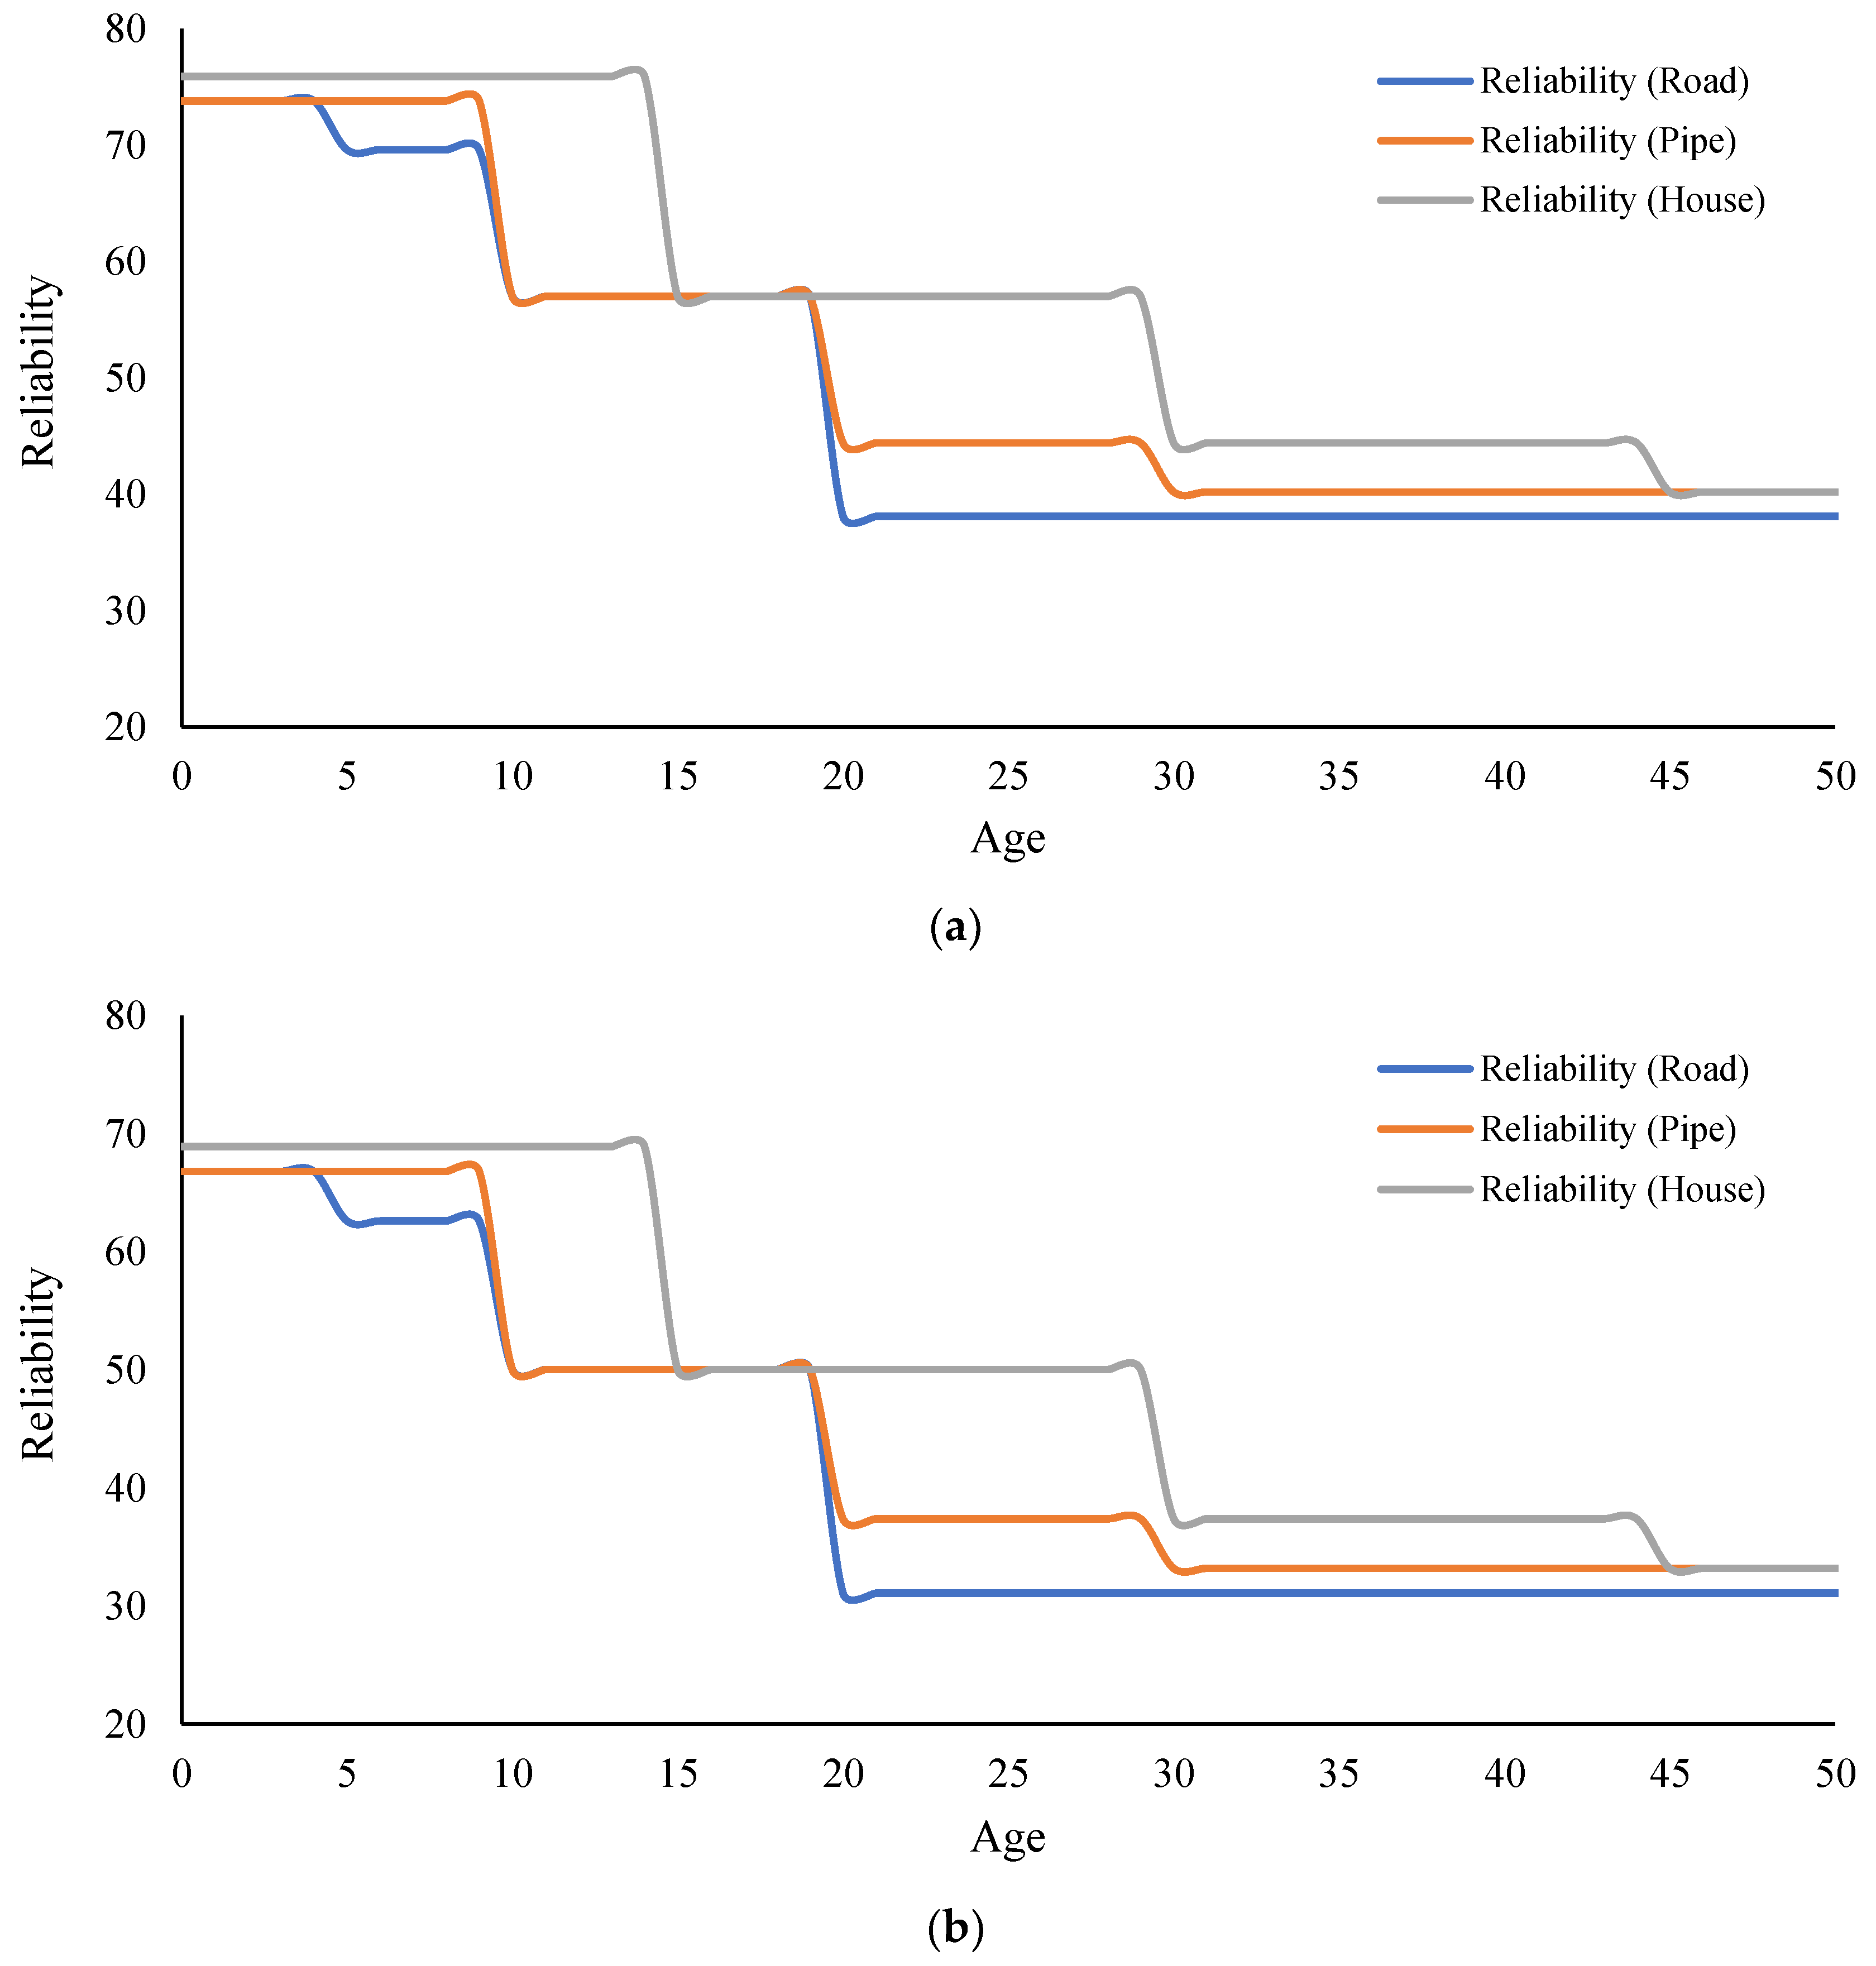
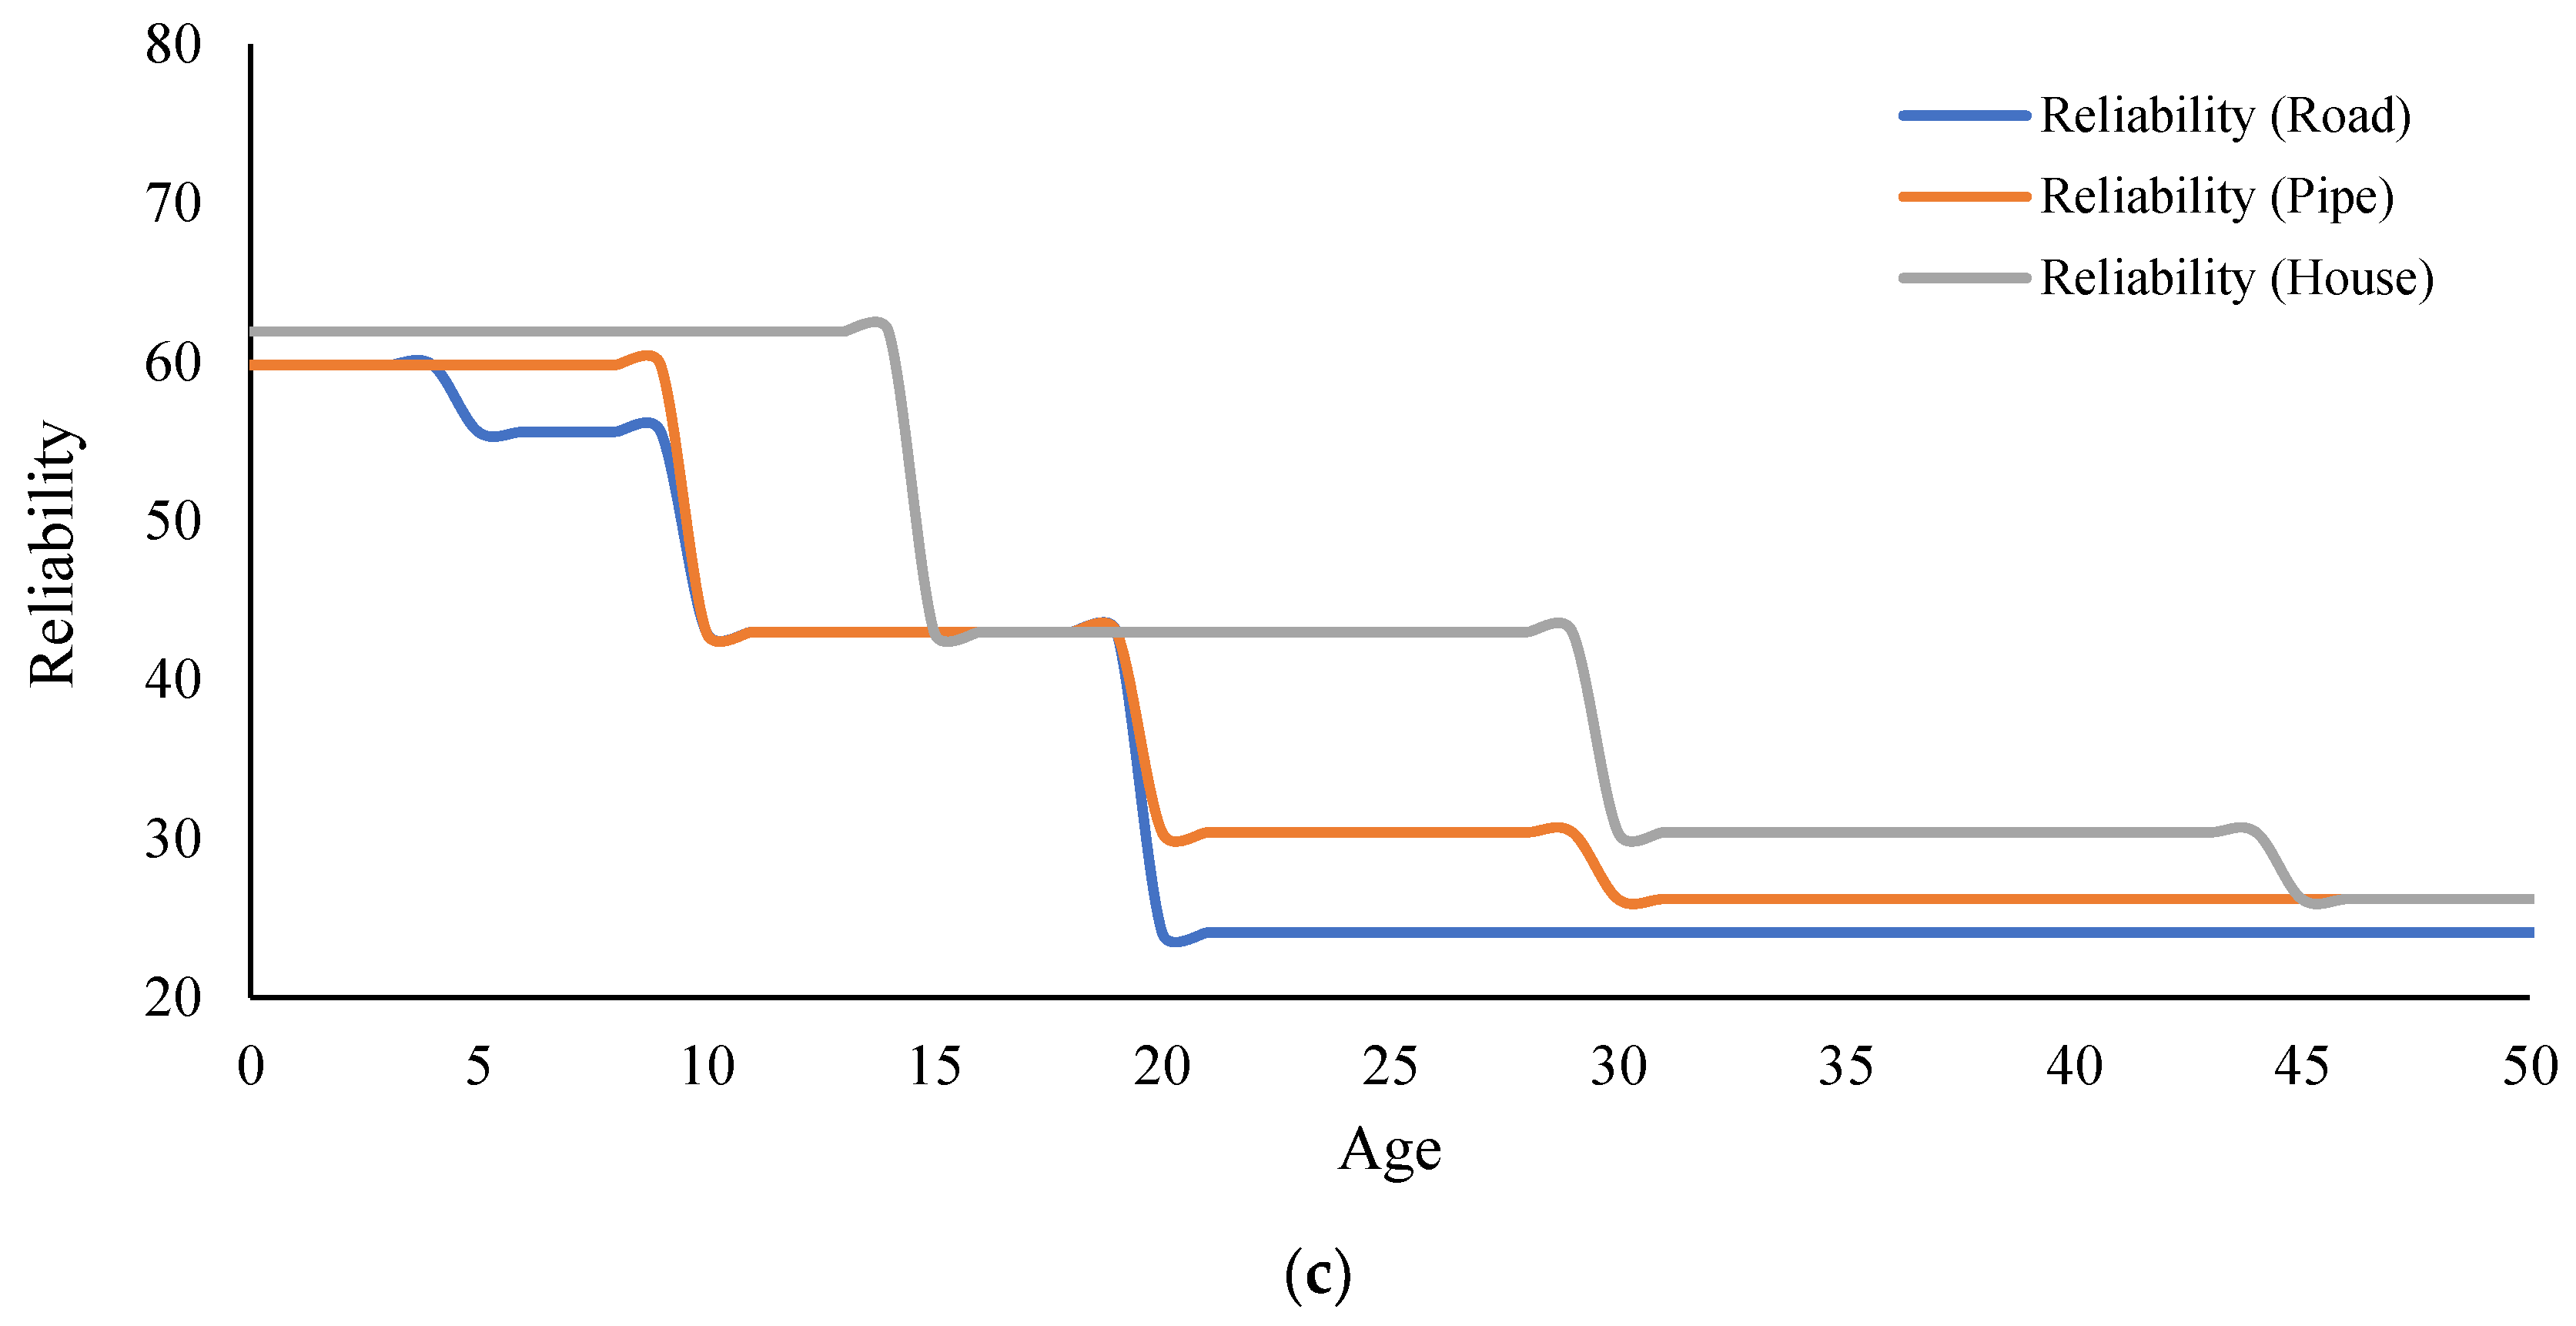
3.1. Results

Sensitivity analysis was performed to identify critical parameters affecting infrastructure reliability due to volume changes in expansive clays. The variance reduction method [7,29] was used to perform the sensitivity analysis because the input parameters have both discrete (such as tree or no tree) and continuous (such as 12–17 or 17–22) values. The variance (V(R/t)) of the real value of R (such as Reliability) due to given evidence T (such as age, water content, plantation, or depth) of state t, was calculated according to the following equation [9,29]:
V ( R | t ) = z p ( r | t ) [ Y r E ( R | t ) ] 2
In the above equation, r is the state of the query node R, p(r/t) represents the conditional probability, Yr denotes the numeric value corresponding to state r, and E(R/t) indicates the expected real value of R after the new finding t for node T.
Table 3 gives a summary of the sensitivity analysis. Table 4 gives the results of the extreme scenario analysis. Figure 4 shows the infrastructure reliability curves due to swelling.

3.2. Discussion

According to Table 3, Age showed the highest contribution to variance (23%), followed by Facility Type (1.37%), and all other parameters were found to be less than 0.05%. Being the most sensitive parameter, changes in Age have a significant effect on the final output irrespective of facility type. These results are in agreement with the expert opinion. Furthermore, the 25% variance highlighted that the sensitivity of the reliability (child node) highly depends on the variability of the parent nodes.
Four extreme conditions (Table 4) for each type of civil infrastructure were considered when all of the parent nodes were either in the worst condition or in a favorable condition. For example, clay shrinkage for roads gives the three states for Reliability, namely Low, Moderate, and High, to be 57.1, 40.2, and 2.68, respectively, under the worst condition. The corresponding values under a favorable condition were found to be 4.0, 24.0, and 72.0, respectively. These data indicate that the reliability of roads will be low for the worst conditions and high for the favorable scenarios. A similar interpretation can be made for clay swelling under roads. Likewise, the same analyses can be performed for the other types of civil infrastructure. Once again, the proposed BBN-based model gives results according to the assumed soil behavior.
To further validate the proposed BBN-based model, more than 420 hypothetical scenarios were generated. Results indicated that the moderate conditions for swelling fell between the extreme conditions. As an example, Figure 4 shows the predicted infrastructure reliability curves due to swelling in expansive clays (based on GWC from 22 to 42). For this analysis, the age of the infrastructure is changed while keeping the states of all the other nodes in accordance with row 7 through row 12 in Table 4. The curves show that infrastructure reliability decreases in a step-wise manner based on the age bracket. Similar reliability curves can be generated for shrinkage in expansive clays.

4. Conclusions

This study aimed at examining the interrelationship between several contributing factors that impact the reliability of different infrastructures in expansive soils. The BBN approach was used because it can demonstrate the relationship between different factors in complex systems more effectively when compared with other multi-criteria decision analysis methods. The proposed approach of BBN-based modeling was successfully applied to determine the reliability of civil infrastructure in expansive soils. The modeling results highlighted that facility age is the most critical parameter (23% variance), followed by facility type (1.37% variance), for all the investigated types of infrastructure, namely road embankments, buried pipelines, and residential housing. Results of the sensitivity analysis and extreme scenario analysis indicated that the method is capable of predicting infrastructure reliability, and the assessments were found to be in agreement with the expected field behavior. For example, it was found that the reliability of roads is low for the worst conditions and high for the favorable scenarios. The model can be further improved by discretizing the Age node in more than the current seven stages. This will allow for the capture of more frequent variations in infrastructure reliability. The proposed model will aid geotechnical practitioners in estimating the probabilistic reliability of different infrastructure under various scenarios. As such, the model is useful in decision making related to civil infrastructure management in expansive clays.

Author Contributions

Conceptualization, G.K. and S.A.; methodology, G.K. and S.A.; software, G.K. and S.A.; validation, G.K. and S.A; formal analysis, G.K. and S.A.; investigation, G.K. and S.A.; resources, G.K. and S.A.; data curation, G.K. and S.A.; writing—original draft preparation, G.K. and S.A.; writing—review and editing, G.K. and S.A.; visualization, G.K. and S.A.; project administration, G.K. and S.A. All authors have read and agreed to the published version of the manuscript.

Funding

This research received no external funding.

Data Availability Statement

The data presented in this study are already published in previous studies.

Acknowledgments

The authors would like to acknowledge the University of Regina for providing the computational facilities and Maki Ito for providing the compiled field data given in Figure 1.

Conflicts of Interest

The authors declare no conflict of interest.

References

  1. Chen, F.H. Foundations on Expansive Soils; Elsevier: New York, NY, USA, 1998. [Google Scholar]
  2. Petry, T.M.; Little, D.N. Review of stabilization of clays and expansive soils in pavements and lightly loaded structures—History, practice, and future. J. Mater. Civil. Eng. 2002, 14, 447–460. [Google Scholar] [CrossRef]
  3. Hu, Y.; Hubble, D.W. Failure conditions of asbestos cement water mains in Regina. In Proceedings of the 1st CSCE Specialty Conference on Infrastructure Technologies, Management and Policy, Toronto, ON, Canada, 2-4 June 2005. [Google Scholar]
  4. Pugh, R.S. Some observations on the influence of recent climate change on the subsidence of shallow foundations. Proc. Inst. Civil. Eng. Geotech. Eng. 2002, 155, 23–25. [Google Scholar]
  5. Ito, M.; Azam, S. Engineering characteristics of a glacio-lacustrine clay deposit in a semi-arid climate. Bull. Eng. Geol. Environ. 2009, 68, 551–557. [Google Scholar] [CrossRef]
  6. Akhter, A.; Azam, S. Flood-drought hazard assessment for a flat clayey deposit in the Canadian Prairies. J. Environ. Inform. Lett. 2019, 1, 8–19. [Google Scholar] [CrossRef]
  7. Kabir, G.; Balek, N.B.C.; Tesfamariam, S. Consequence-based framework for buried infrastructure systems: A Bayesian belief network model. Reliab. Eng. Syst. Saf. 2018, 180, 290–301. [Google Scholar] [CrossRef]
  8. Sen, M.K.; Dutta, S.; Kabir, G. Modelling and quantification of time-varying flood resilience for housing infrastructure using dynamic Bayesian Network. J. Clean. Prod. 2022, 361, 132266. [Google Scholar] [CrossRef]
  9. Pearl, J. Probabilistic Reasoning in Intelligent Systems: Networks of Plausible Inference; Morgan Kaufmann Publishers, Inc.: San Francisco, CA, USA, 1988. [Google Scholar]
  10. Nielsen, T.D.; Jensen, F.V. Bayesian Networks and Decision Graphs; Springer Science and Business Media: New York, NY, USA, 2009. [Google Scholar]
  11. Philip, B.; Jassmi, H.A. A Bayesian Approach towards Modelling the Interrelationships of Pavement Deterioration Factors. Buildings 2002, 12, 1039. [Google Scholar] [CrossRef]
  12. Rahman, M.M.; Islam, M.K.; Al-Shayeb, A.; Arifuzzaman, M. Towards sustainable road safety in Saudi Arabia: Exploring traffic accident causes associated with driving behavior using a Bayesian belief network. Sustainability 2022, 14, 6315. [Google Scholar] [CrossRef]
  13. Ito, M.; Azam, S. Engineering properties of a vertisolic expansive soil deposit. Eng. Geol. 2013, 152, 10–16. [Google Scholar] [CrossRef]
  14. Huang, Q.; Azam, S. Evaluation of empirically predicted volumetric changes in cracked expansive clays. Innov. Infrastruct. Solut. 2020, 5, 104. [Google Scholar] [CrossRef]
  15. Hamilton, J.J. Volume changes in undisturbed clay profiles in western Canada. Can. Geotech. J. 1963, 1, 27–42. [Google Scholar] [CrossRef]
  16. Hu, Y.; Vu, H.Q. Analysis of soil conditions and pipe behaviour at a field site. Can. Geotech. J. 2011, 48, 847–866. [Google Scholar] [CrossRef]
  17. Azam, S.; Ito, M. Coupled soil-atmosphere modeling for expansive Regina clay. J. Environ. Inform. 2012, 19, 20–29. [Google Scholar] [CrossRef]
  18. Hamilton, J.J. Effect of environment on the performance of shallow foundation. Can. Geotech. J. 1969, 6, 65–80. [Google Scholar] [CrossRef]
  19. Asker, A.; Jin, Y.C. Macropores drainage of unsaturated swelling clays. Water Resour. Res. 2000, 36, 1189–1197. [Google Scholar] [CrossRef]
  20. Ito, M.; Azam, S.; Hu, Y. A two stage model for moisture-induced deformations in expansive soils. Environ. Syst. Res. 2014, 3, 1–11. [Google Scholar] [CrossRef] [Green Version]
  21. Yoshida, R.; Fredlund, D.; Hamilton, J. The prediction of total heave on a slab-on-grade floor on Regina clay. Can. Geotech. J. 1983, 20, 69–81. [Google Scholar] [CrossRef]
  22. Azam, S.; Shah, I.; Raghunandan, M.; Ito, M. Study on swelling properties of an expansive soil deposit in Saskatchewan, Canada. Bull. Eng. Geol. Environ. 2013, 72, 1–11. [Google Scholar] [CrossRef]
  23. Fredlund, D.G. Engineering properties of expansive clays. In Proceedings of the Seminar on Shallow Foundations on Expansive Clays, Regina, SK, Canada, 27–28 October 1975. [Google Scholar]
  24. Hu, Y.; Vu, H.Q.; Lotfian, K. Instrumentation of asbestos cement pipe in expansive soil. In Proceedings of the American Society of Civil Engineering International Pipeline Conference, Atlanta, GA, USA, 22 July 2008; Volume 1, pp. 1–10. [Google Scholar]
  25. Ito, M.; Azam, S. Stochastic modeling of volume changes in expansive soils. Innov. Infrastruct. Solut. 2018, 3, 45. [Google Scholar] [CrossRef]
  26. Cooper, G.F.; Herskovits, E. A Bayesian method for the induction of probabilistic networks from data. Mach. Learn. 1992, 9, 309–347. [Google Scholar] [CrossRef] [Green Version]
  27. Cockburn, G.; Tesfamariam, S. Earthquake disaster risk index for Canadian cities using Bayesian belief networks. Georisk: Assess. Manag. Risk Eng. Syst. Geohazards 2012, 6, 128–140. [Google Scholar] [CrossRef]
  28. Li, L.; Wang, J.; Leung, H.; Zhao, S. A Bayesian method to mine spatial data sets to evaluate the vulnerability of human beings to catastrophic risk. Risk Anal. 2012, 32, 1072–1092. [Google Scholar] [CrossRef] [PubMed]
  29. Norsys Software Corp. Netica Version 4.16. Norsys Software Corp, Canada. 2014. Available online: www.norsys.com/ (accessed on 1 September 2022).
  30. Kabir, G.; Tesfamariam, S.; Francisque, A.; Sadiq, R. Evaluating risk of water mains failure using a Bayesian belief network model. Eur. J. Oper. Res. 2015, 240, 220–234. [Google Scholar] [CrossRef]
  31. Tang, Z.; McCabe, B. Developing complete conditional probability tables from fractional data for Bayesian belief networks. J. Comput. Civil. Eng. 2007, 21, 265–276. [Google Scholar] [CrossRef]
  32. Cárdenas, I.C.; Al-Jibouri, S.S.; Halman, J.I.; Tol, F.A. Modeling Risk-Related Knowledge in Tunneling Projects. Risk Anal. 2014, 34, 323–339. [Google Scholar] [CrossRef]
  33. Cai, B.; Liu, Y.; Liu, Z.; Tian, X.; Zhang, Y.; Ji, R. Application of Bayesian networks in quantitative risk assessment of subsea blowout preventer operations. Risk Anal. 2013, 33, 1293–1311. [Google Scholar] [CrossRef]
  34. Kabir, G.; Suda, H.; Cruz, A.M.; Giraldo, F.M.; Tesfamariam, S. Earthquake-related Natech risk assessment using a Bayesian belief network model. Struct. Infrastruct. Eng. 2019, 15, 725–739. [Google Scholar] [CrossRef]
Figure 1. Field data for the investigated expansive clay profile. (a) Ground water content, (b) cumulative volume change.
Civileng 03 00064 g001
Figure 2. Histograms of field data for the investigated expansive clay. (a) Ground water content, (b) depth below ground, (c) volume change, (d) cumulative volume change.
Civileng 03 00064 g002
Figure 3. Proposed infrastructure reliability prediction model for expansive clays.
Civileng 03 00064 g003
Figure 4. Infrastructure reliability curves due to swelling. (a) 27 to 32 GWC, (b) 32 to 37 GWC, (c) 37 to 42 GWC.
Civileng 03 00064 g004aCivileng 03 00064 g004b
Table 1. States and units of parent and child nodes.
Parent NodeStateUnitChild NodeStateUnit
Water Content (GWC)12 to 17
17 to 22
22 to 27
27 to 32
32 to 37
37 to 42
%Change in Water Content (Delta_GWC)−15 to −10
−10 to −5
−5 to 0
0 to 5
5 to 10
10 to 15
%
Depth0 to 0.5,
0.5 to 1.0
1.0 to 1.5
1.5 to 2.0
2.0 to 2.5
2.5 to 3.0
mVolume Change−30 to −15
−15 to 0
0 to 15
15 to 30
30 to 45
45 to 60
mm
Age0 to 5
5 to 10
10 to 15
15 to 20
20 to 30
30 to 45
45 to 70
YearCumulative
Volume Change (Cum_Volume_Change)
−90 to −60
−60 to −30
−30 to 0
0 to 30
30 to 60
60 to 90
mm
PlantationTree
No Tree
Flow ThroughYes
No
Ground CoverExposed Surface
Covered Surface
Infrastructure StabilityLow
Moderate
High
Ground SlopeFree Drainage
Surface Ponding
ReliabilityLow
Moderate
High
Facility TypeRoad
Pipe
House
Swell–Shrink
Modulus
Constant
Ratio of Vertical to Horizontal MovementConstant
Table 2. Example of determination of conditional probabilities based on knowledge elicitation.
Ground CoverGround SlopePlantationFlow Through
YesNo
Exposed SurfaceFree DrainageTree3367
Exposed SurfaceFree DrainageNo Tree6733
Exposed SurfaceSurface PondingTree6733
Exposed SurfaceSurface PondingNo Tree1000
Covered SurfaceFree DrainageTree0100
Covered SurfaceFree DrainageNo Tree3367
Covered SurfaceSurface PondingTree3367
Covered SurfaceSurface PondingNo Tree6733
Table 3. Summary of sensitivity analysis.
NodeVariance Reduction (%)
Age23
Facility Type1.37
Water Content0.0474
Ground Slope0.0355
Plantation0.0355
Ground Cover0.0355
Depth0.00177
Swell–Shrink Modulus0
Ratio of Vertical to Horizontal Movement0
Sum24.52%
Table 4. Summary of extreme scenario analysis.
ConditionWater ContentDepthGround
Slope
Ground
Cover
PlantationFacility
Type
AgeReliability
Worst12 to 170 to 0.5Surface
Ponding
Exposed
Surface
No TreeRoad45 to 70Civileng 03 00064 i001
Worst12 to 170 to 0.5Surface
Ponding
Exposed
Surface
No TreePipe45 to 70Civileng 03 00064 i002
Worst12 to 170 to 0.5Surface
Ponding
Exposed
Surface
No TreeHouse45 to 70Civileng 03 00064 i003
Favorable22 to 272.5 to 30Free
Drainage
Covered
Surface
TreeRoad0 to 5Civileng 03 00064 i004
Favorable22 to 272.5 to 30Free DrainageCovered SurfaceTreePipe0 to 5Civileng 03 00064 i005
Favorable22 to 272.5 to 30Free DrainageCovered SurfaceTreeHouse0 to 5Civileng 03 00064 i006
Favorable27 to 322.5 to 30Free
Drainage
Covered
Surface
TreeRoad0 to 5Civileng 03 00064 i007
Favorable27 to 322.5 to 30Free DrainageCovered SurfaceTreePipe0 to 5Civileng 03 00064 i008
Favorable27 to 322.5 to 30Free DrainageCovered SurfaceTreeHouse0 to 5Civileng 03 00064 i009
Worst37 to 420 to 0.5Surface
Ponding
Exposed
Surface
No TreeRoad45 to 70Civileng 03 00064 i010
Worst37 to 420 to 0.5Surface
Ponding
Exposed
Surface
No TreePipe45 to 70Civileng 03 00064 i011
Worst37 to 420 to 0.5Surface
Ponding
Exposed
Surface
No TreeHouse45 to 70Civileng 03 00064 i012
Publisher’s Note: MDPI stays neutral with regard to jurisdictional claims in published maps and institutional affiliations.

